
Table of Contents
- Executive Summary
- Introduction
- Mass Incarceration in the U.S.
- Congress Weighs In: Higher Education in Prison
- Research on Correctional Education
- Current Landscape of Higher Education & Job Training in Prison
- Study
- Results
- Discussion
- Policy Implications/Recommendations
- Conclusion
- Appendix A: Methodology
- Appendix B: Description of PIAAC Proficiency Levels on the Literacy Scale
- Appendix C: Description of PIAAC Proficiency Levels on the Numeracy Scale
Results
The results of this study provide an understanding of the skills of the U.S. general population and the incarcerated population within federal and state prisons. The results in this section often compare the skills of the general public and incarcerated adults across the demographics of age, race/ethnicity, gender, educational attainment, and reentry status (only for the incarcerated population).
The survey respondents included 8,670 individuals of the household sample, also referred to in this report as the general public. There were 1,319 incarcerated adults who participated in the survey. Due to the rigorous survey methods, these results are representative of the U.S. population, in which the findings can be generalized to the general public and those in federal and state prisons and also compared across the two populations.
Demographics of the Sample
Category 1: Gender, Age, Race/Ethnicity
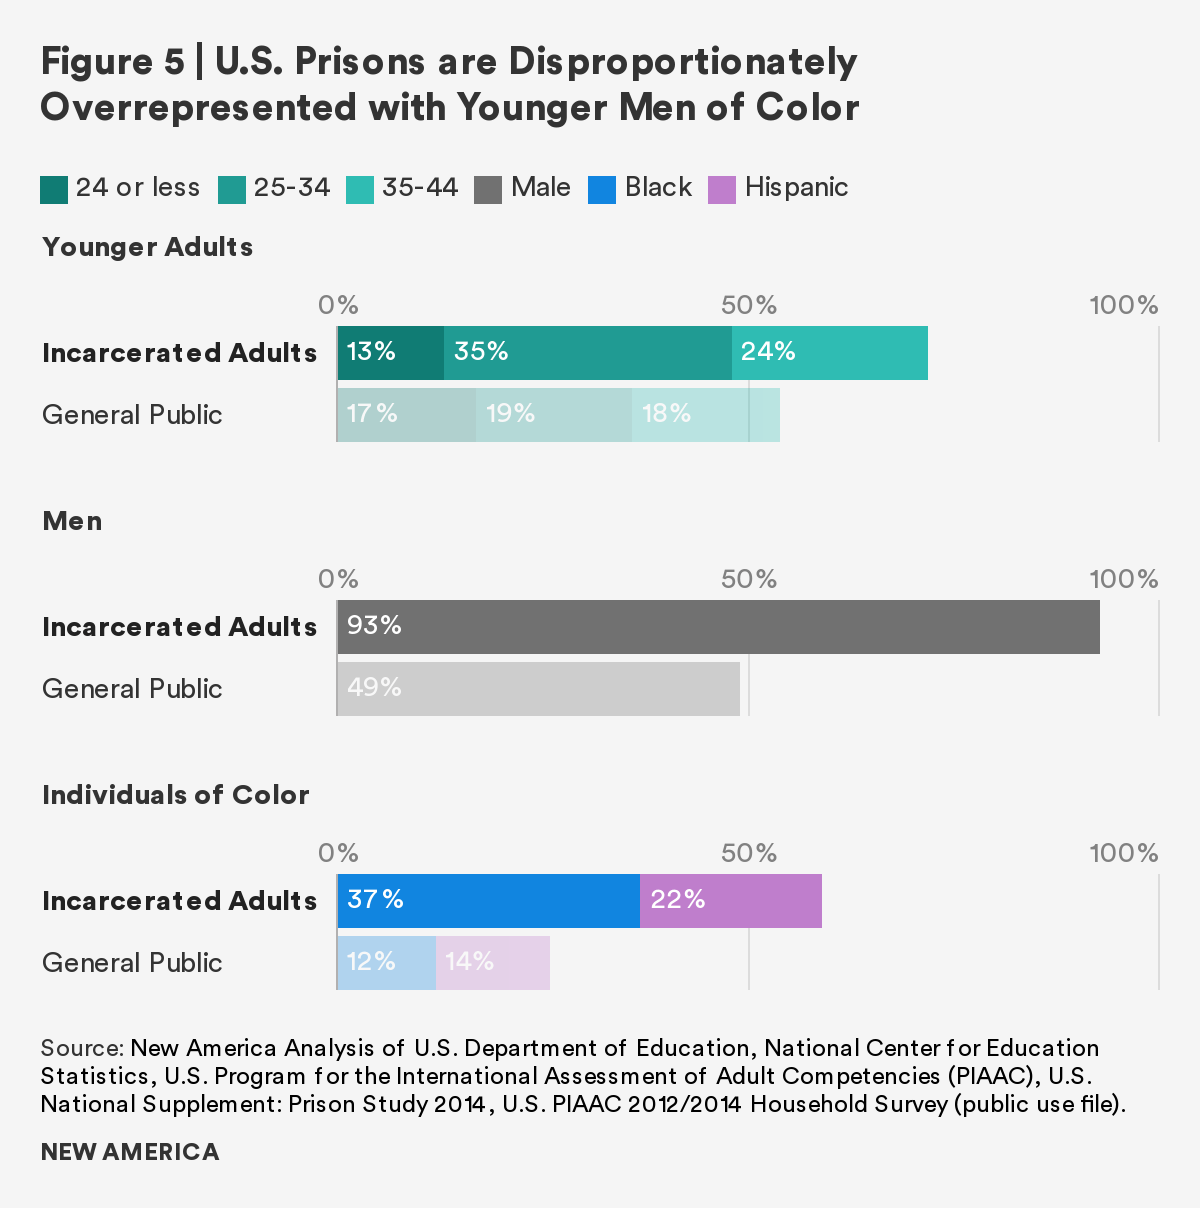
As figure 5 below shows, young men of color (Black and Hispanic) are extremely overrepresented in the incarcerated adult population. Among other findings:
- Most (93 percent) incarcerated adults are men. In comparison, men make up just about half (49 percent) of the general public.
- The majority (72 percent) of incarcerated adults are 44 years of age or younger. Comparatively, this age group represents about 54 percent of the general public.
- About 60 percent of the federal and state prison population are individuals of color (Black and Hispanic), even though individuals of color make up only about a quarter (26 percent) of the country’s total population.
Category 2: Educational Attainment
The education gap between the incarcerated population and the general public is incredibly large.
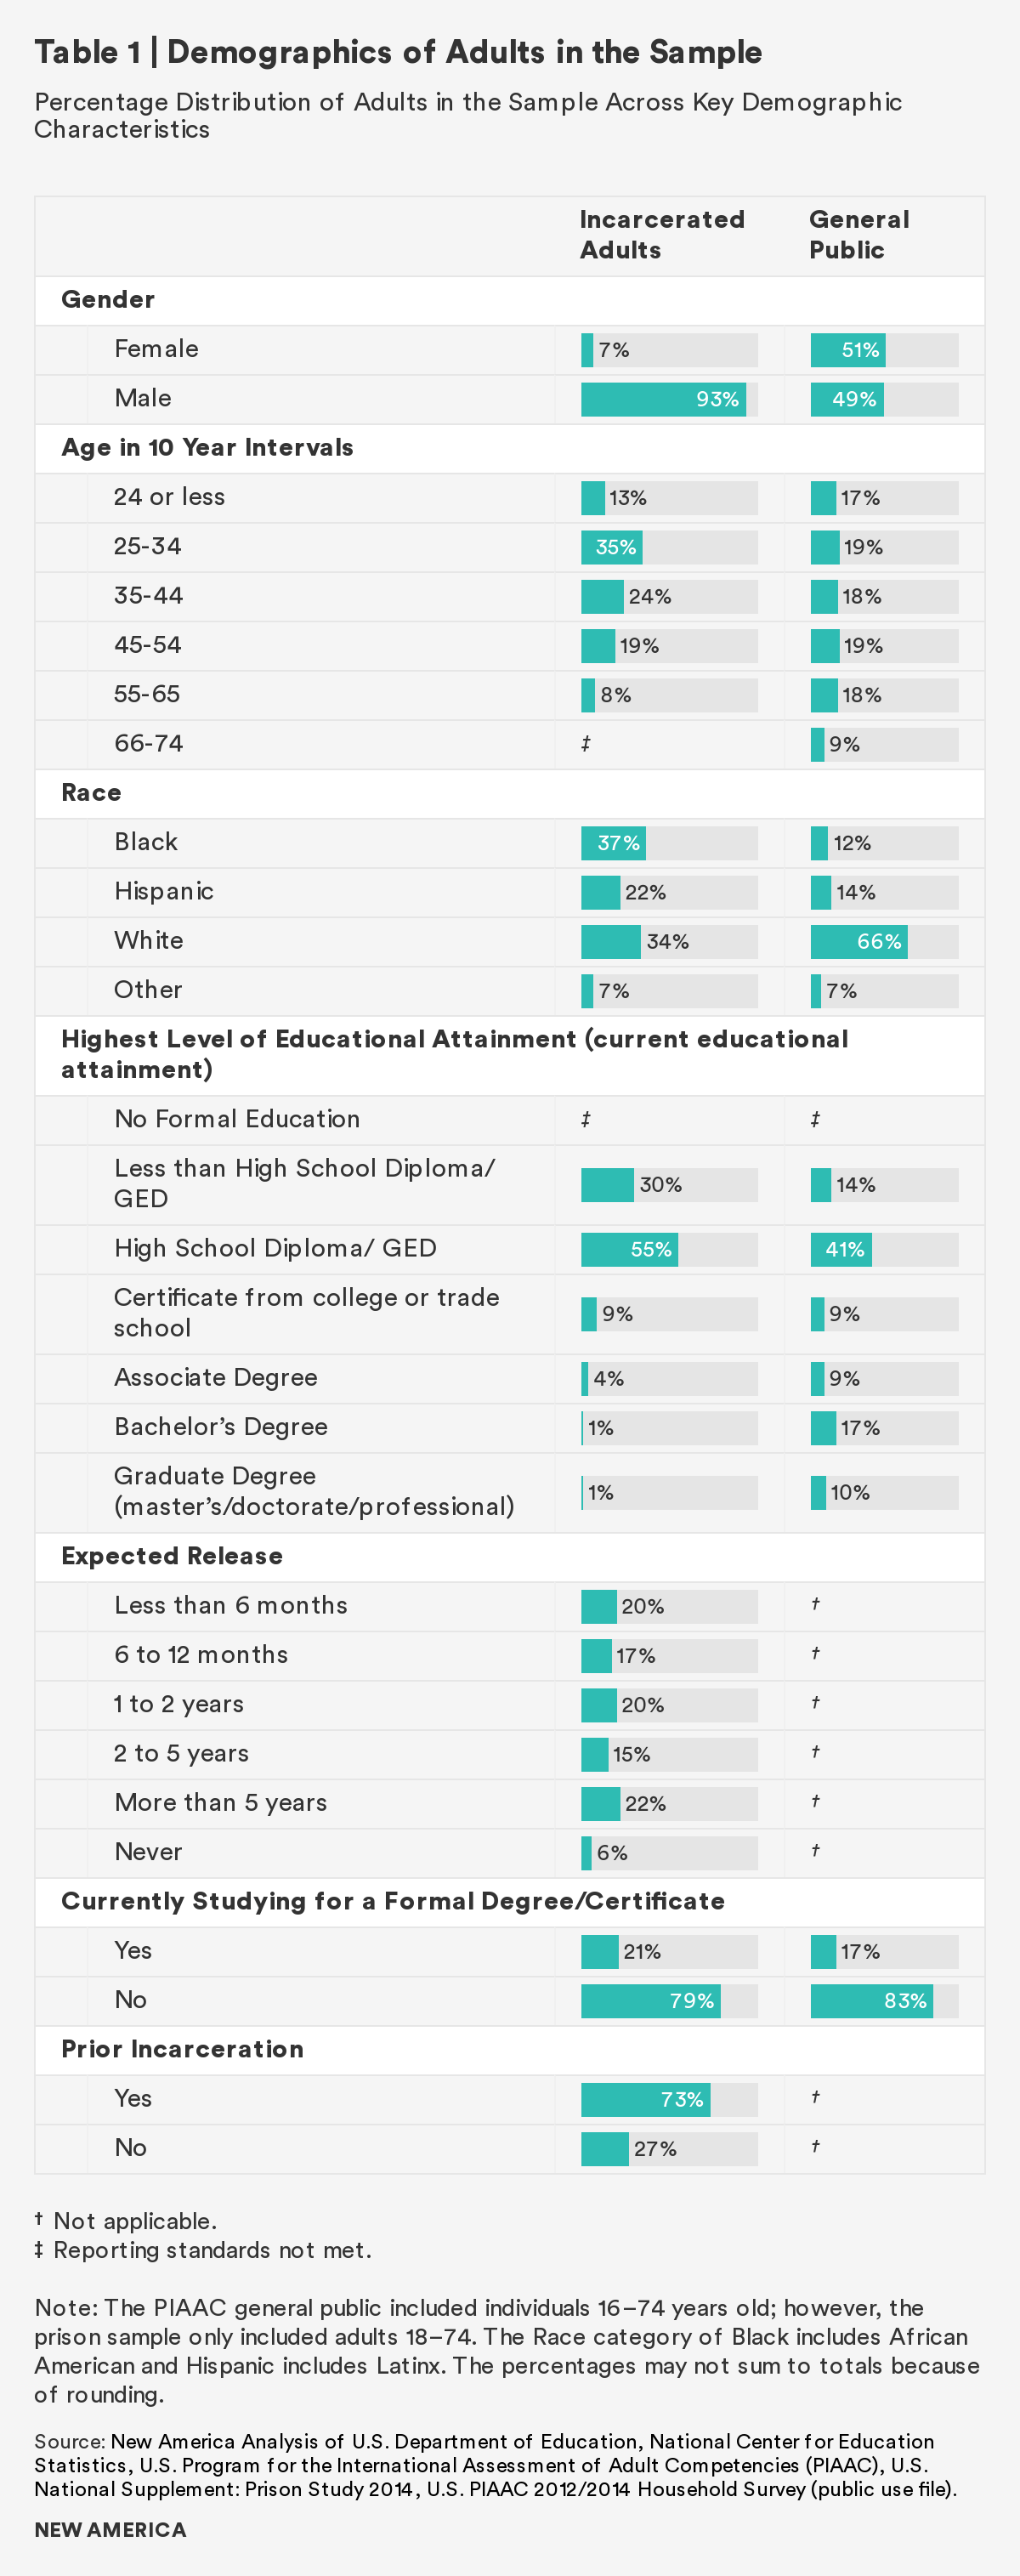
- About 1 in 3 of incarcerated adults have less than a high school equivalence, either prior to or during incarceration, while only 14 percent of the general public has less than a high school equivalence.
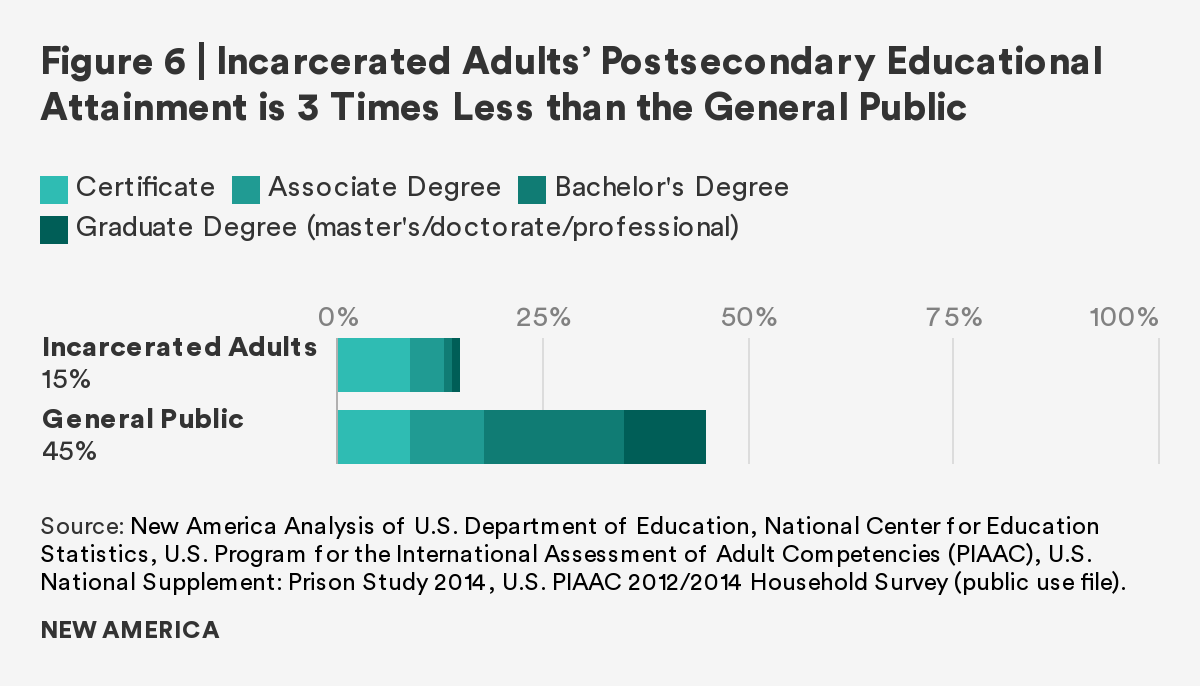
- Only 15 percent of incarcerated adults earn a postsecondary degree or certificate either prior to or during incarceration, while almost half (45 percent) of the general public have completed some form of postsecondary education. See figure 6.
Of particular interest to policymakers, a little more than half of incarcerated adults’ highest level of education is equivalent to a high school diploma/GED either prior to or during incarceration. In essence, 55 percent of the country’s federal and state prison population is academically eligible to enroll in a postsecondary education program. See Table 1 below.
Category 3: Reentry Status of Incarcerated Adults
- More than half (57 percent) of incarcerated adults currently in federal and state correctional facilities expect to be released from prison in fewer than two years.
- Most (94 percent) incarcerated adults in federal and state prisons will be released, while only 6 percent of the population will never come home. See Table 1 below.
Category 4: Highest Level of Educational Attainment During Incarceration
We spoke with federal and state correctional administrators, professionals of nonprofit organizations within the field, college-in-prison facilitators, and job training instructors, who said that a high school equivalence and vocational education take precedence in correctional education. Leaders in the field confirm that obtaining a high school equivalence or some form of Career and Technical Education (CTE) certificate or license while incarcerated is unfortunately the typical terminal degree within correctional education.
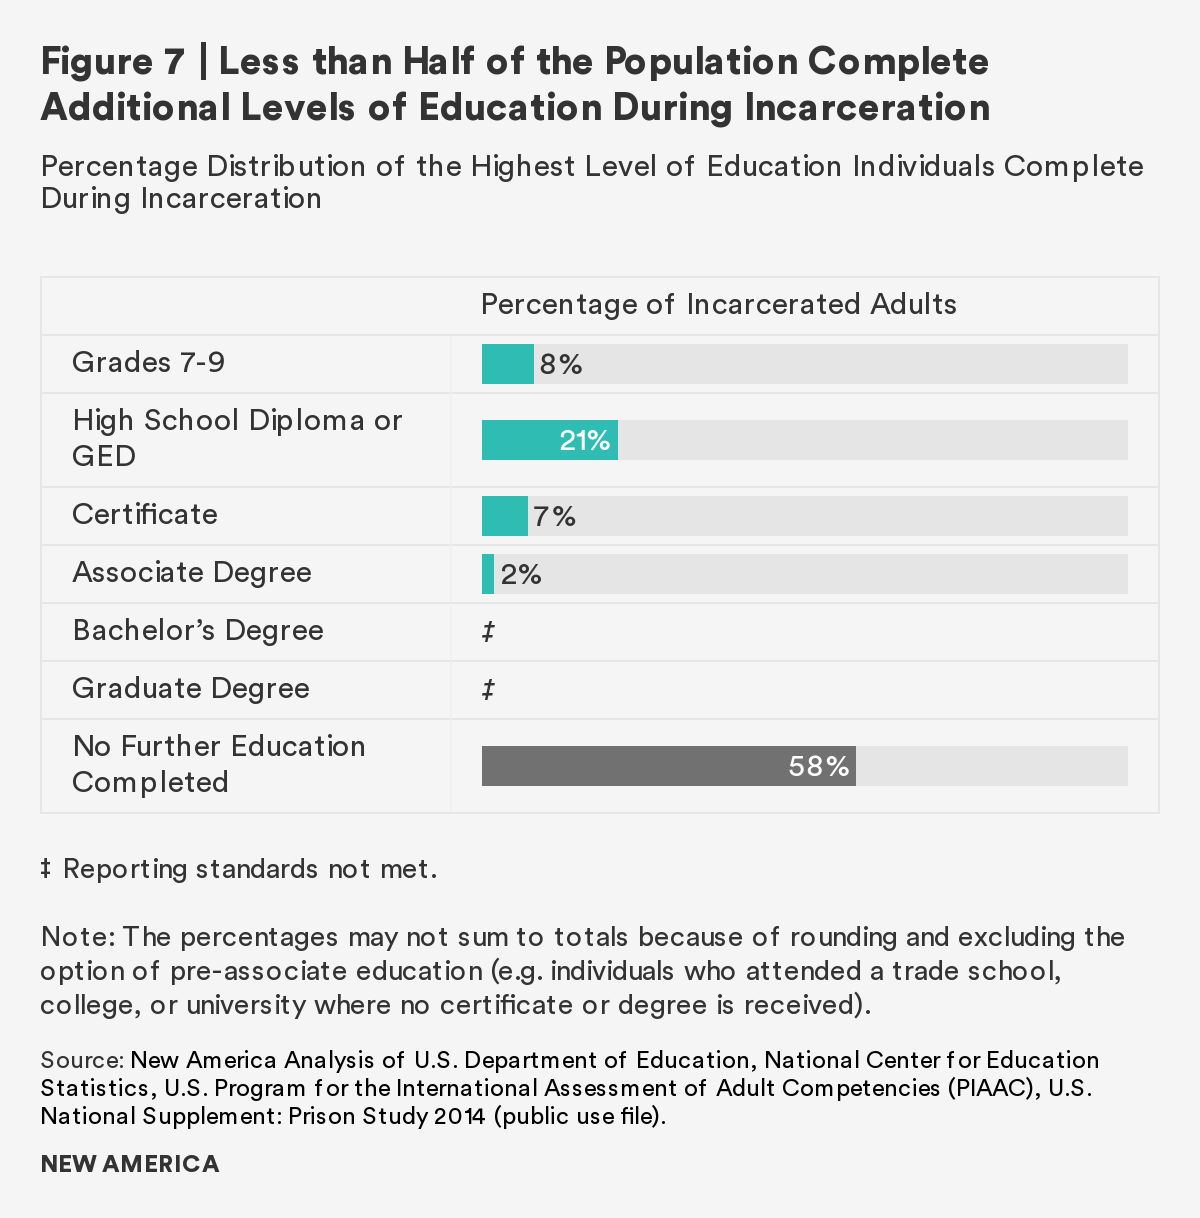
Figure 7 below looks at the levels of education individuals complete while incarcerated.
- Only 42 percent of adults in federal and state prisons complete additional level(s) of education while incarcerated,1 with the greatest percentage of incarcerated students (21 percent) completing a high school equivalence or GED.
- Just 7 percent of incarcerated adults complete a certificate, 2 percent complete an associate degree, and fewer than 1 percent of adults (nearly zero) complete a bachelor’s degree or beyond.
Category 5: Educational Aspirations of Incarcerated Adults
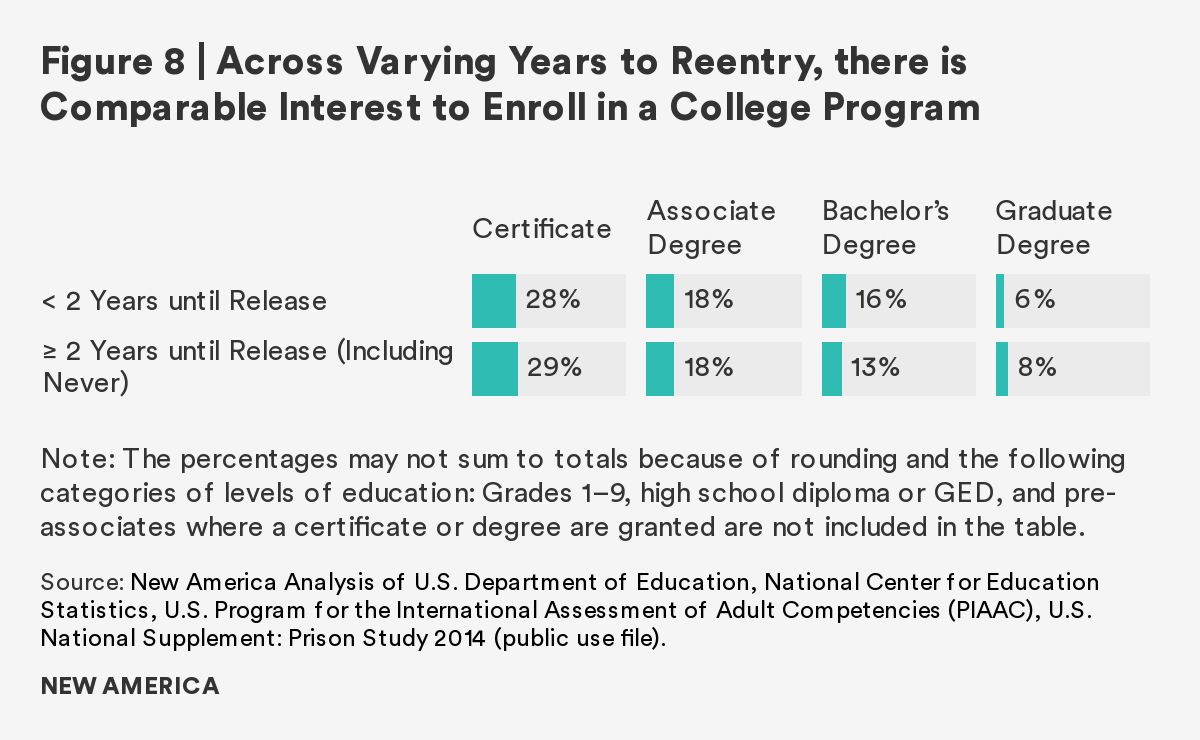
Despite the lower levels of education completed during incarceration, the educational aspirations of incarcerated students do not end with a high school equivalency. As figure 8 below shows, an overwhelming majority of those both close to release (fewer than two years) and with two or more years until release2 are comparably interested in enrolling in these postsecondary educational opportunities.
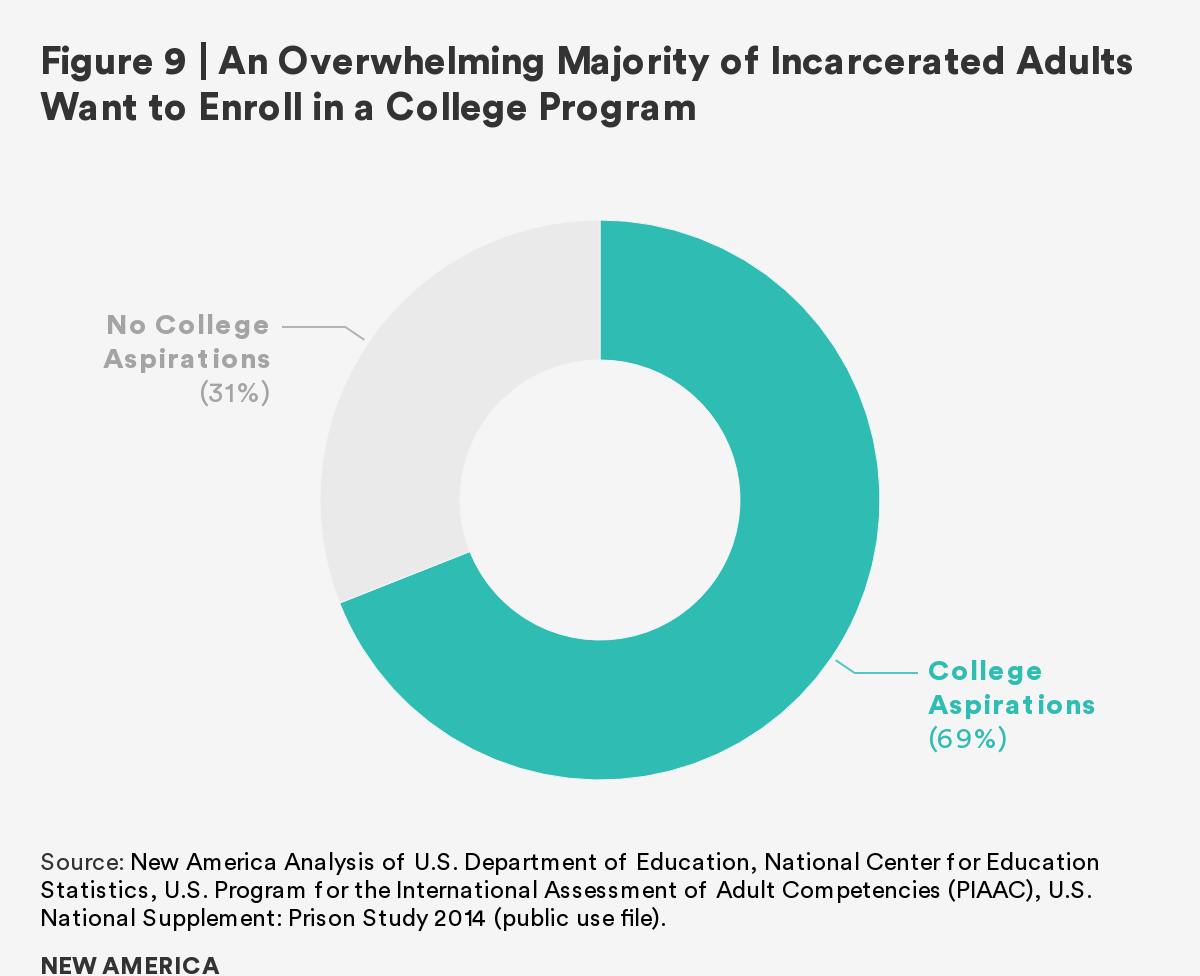
Overall, about 7 in 10 (69 percent) incarcerated adults in federal and state prisons are interested in enrolling in a postsecondary degree or certificate (see figure 9). One currently incarcerated student we spoke with confirmed this, noting that “there is a wealth of interest in bachelors degrees but we are limited by the milestone of only getting an associates. There are not enough opportunities to go beyond associates while we are in here.”
Non-Skills Related Results
Research Question 1: What is the participation and completion rates in postsecondary education and/or job training for incarcerated adults?
Postsecondary Education
About 2 in 10 (21 percent) adults in federal and state prisons, at the time of the survey, were enrolled in postsecondary education. See figure 10 below.
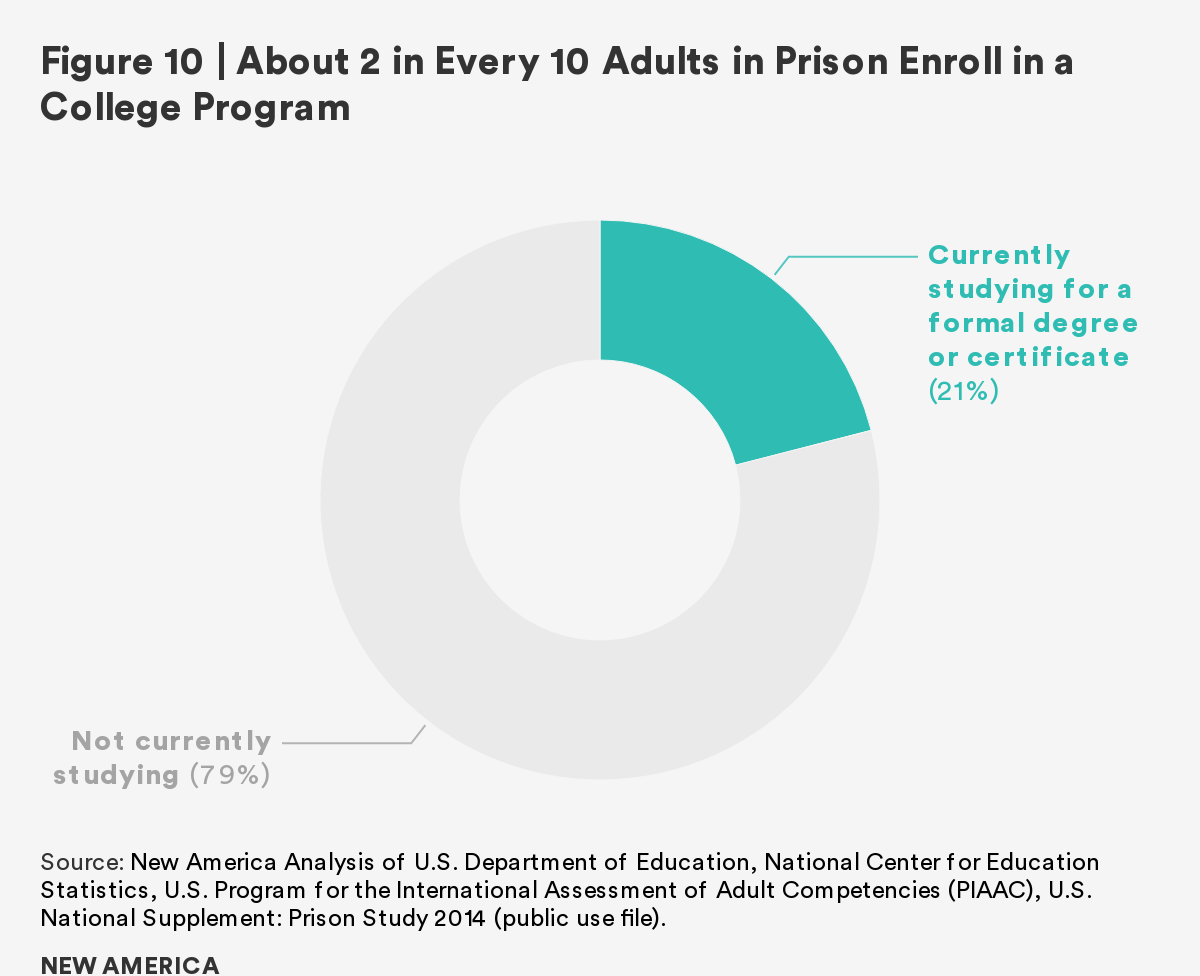
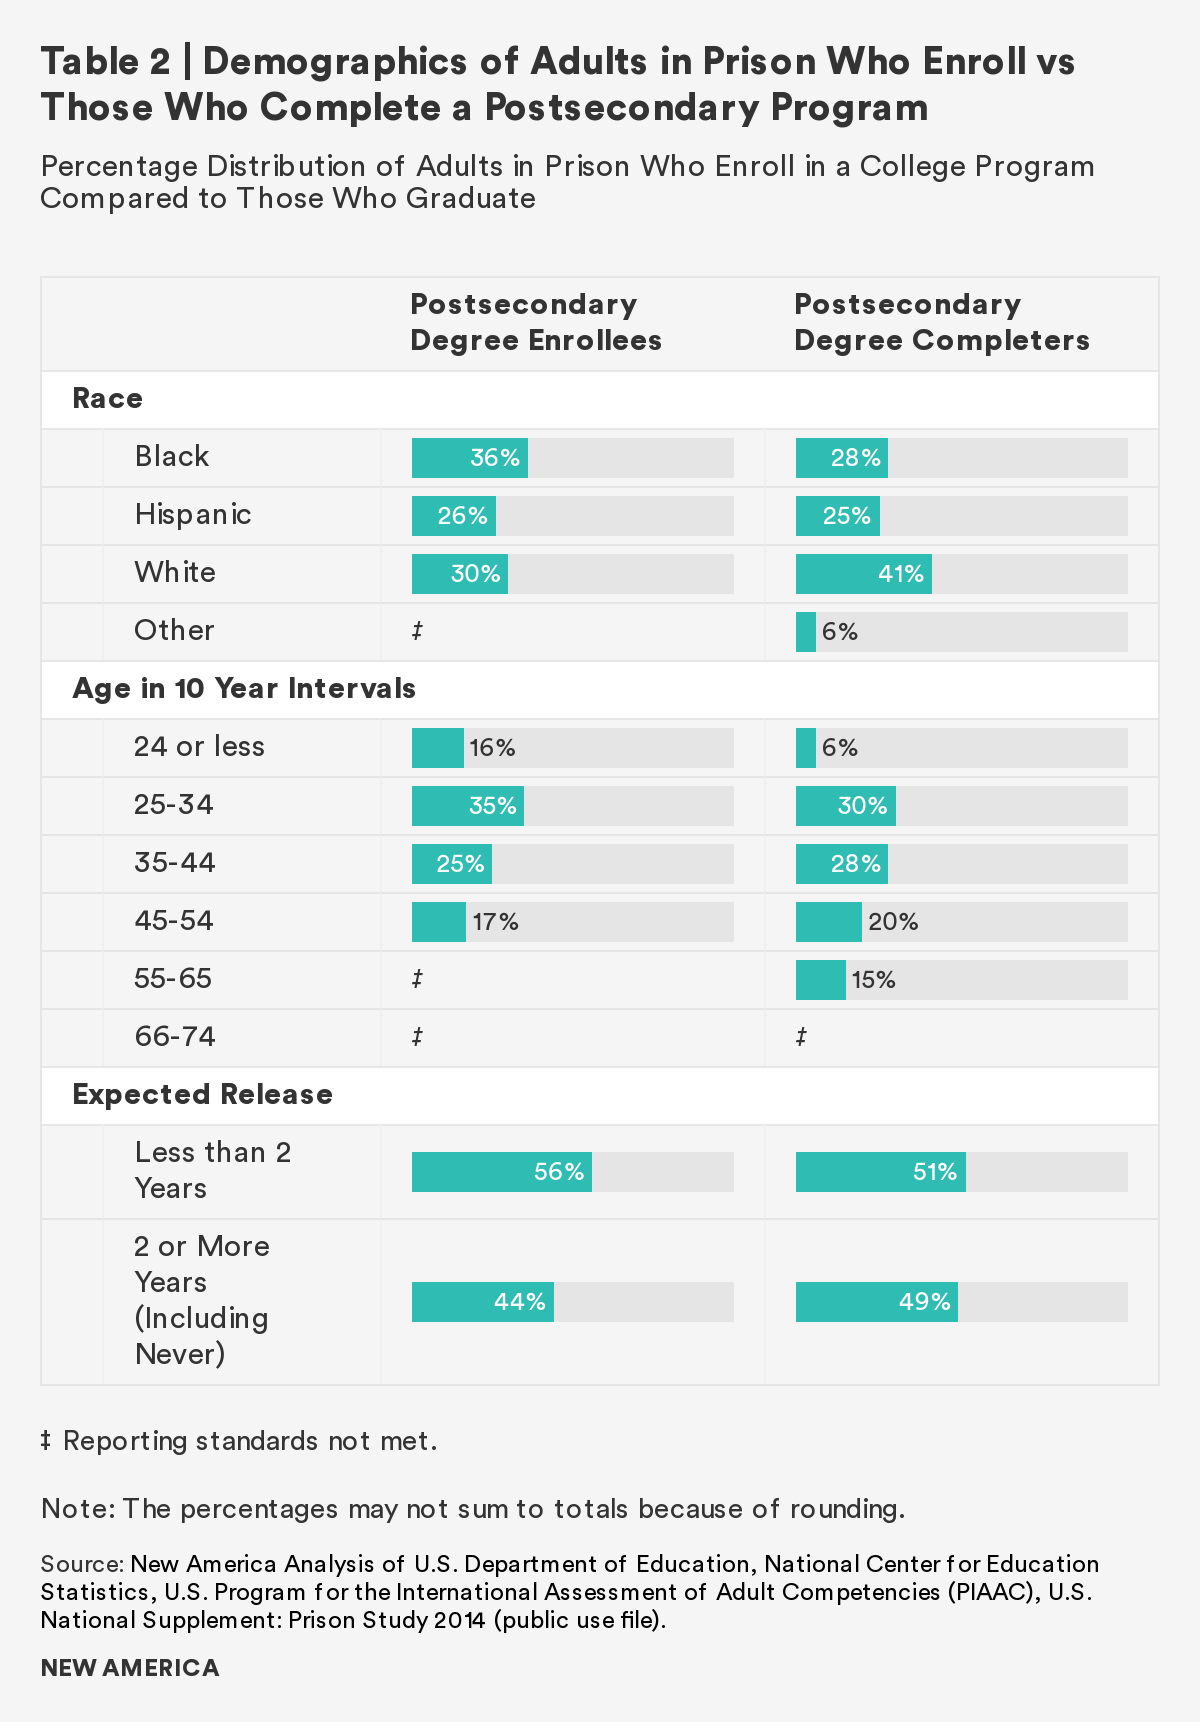
Table 2 below compares the percentage of incarcerated students who are currently enrolled in a postsecondary education program to those who completed a postsecondary program by key demographic characteristics. Among other findings, below are the demographics of incarcerated students who were enrolled in a college program at the time of the survey.
- Race/Ethnicity: The racial/ethnic make-up of adults who enroll in college programs in prison are relatively comparable, where 36 percent are Black compared with 30 percent white and 26 percent Hispanic.
- Age: The majority (60 percent) of incarcerated students who enroll in postsecondary education programs are between the ages of 25 to 44.
- Reentry Status: A little more than half (56 percent) of incarcerated students who are currently studying for a formal degree or certificate will be released from prison in fewer than two years.
While almost a quarter of students in prison enroll in a college program, less than 10 percent of adults complete a postsecondary degree or certificate while in prison. See figure 11 below.
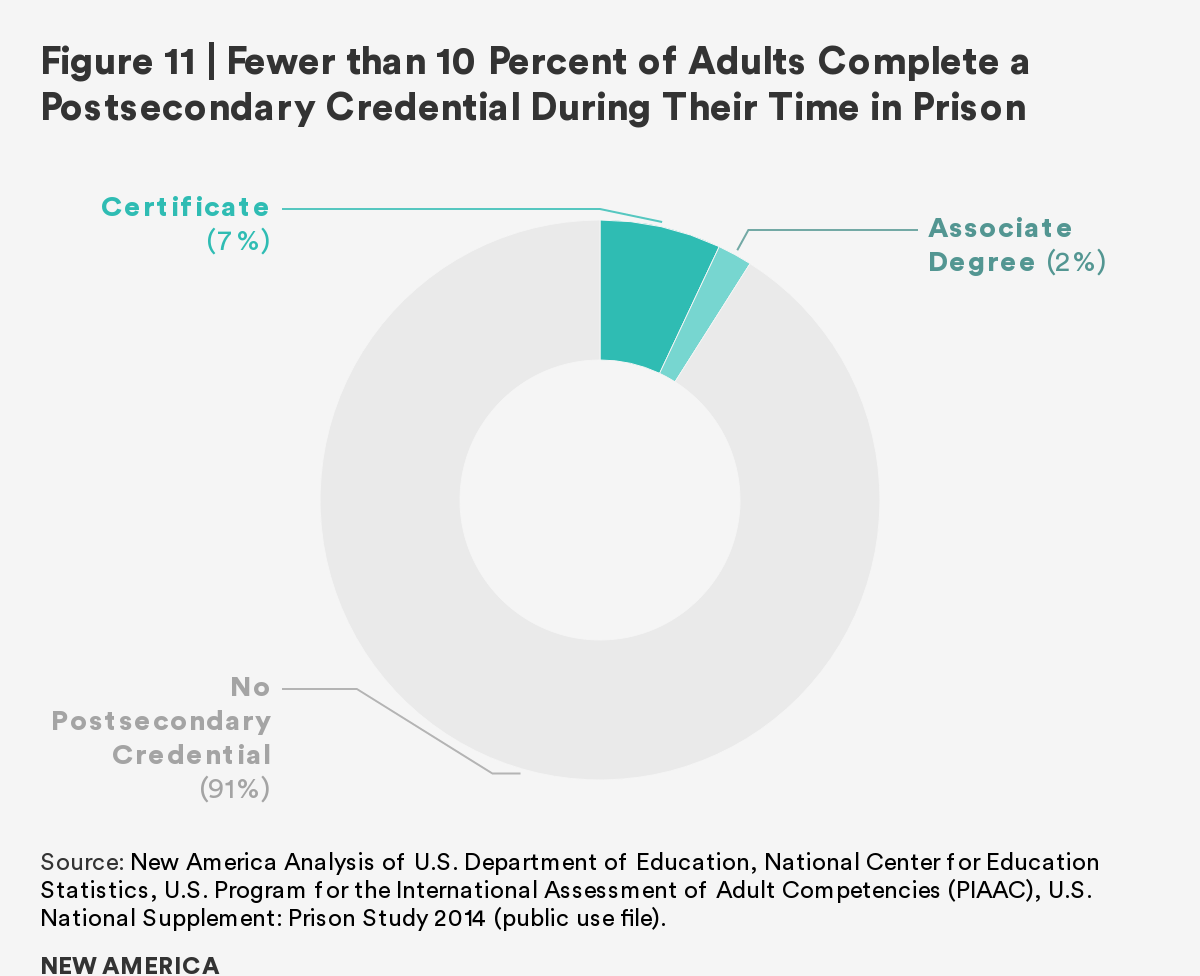
Table 2 above breaks down the share of incarcerated adults who complete a postsecondary degree or certificate by key demographic characteristics.
- Race/Ethnicity: Compared to the racial/ethnic demographics of those who enroll in college programs in prison, a racial disparity is apparent among those who graduate. The majority of incarcerated students who complete a postsecondary degree or certificate are white adults (41 percent), compared with 28 percent are Black adults and 25 percent are Hispanic adults. We saw this racial disparity in postsecondary completers during site visits to graduation ceremonies within correctional facilities, where the majority of those receiving associate degrees and/or certificates were white. The racial disparity among completers suggests Black and Hispanic incarcerated students enroll in college courses as often as white incarcerated students but complete at lower rates.3
- Age: The majority of incarcerated students who complete a postsecondary degree or certificate are between the ages of 25 and 54. In contrast to the age of those who enroll, a greater proportion of older adults are completing a postsecondary credential(s), which makes sense, since it takes time to complete a program.
- Reentry Status: Similar to those who enroll in college programs, a little more than half (51 percent) of incarcerated students who complete a postsecondary degree or certificate will be released in fewer than two years.
Job Training
About a quarter (23 percent) of adults in federal and state prisons participate in job training programs.4 These programs are vocational in nature and do not lead to any transferable postsecondary credits (see figure 12).
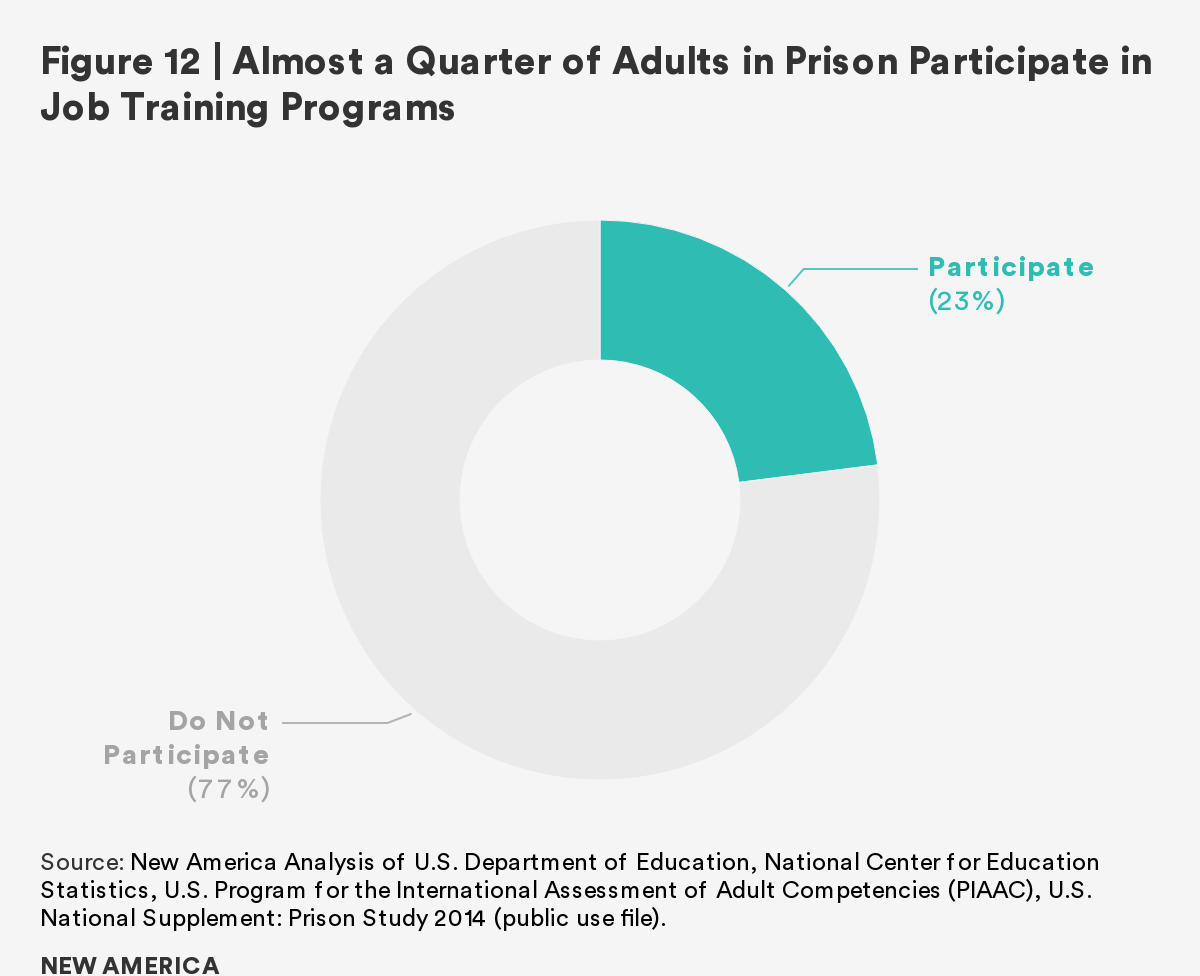
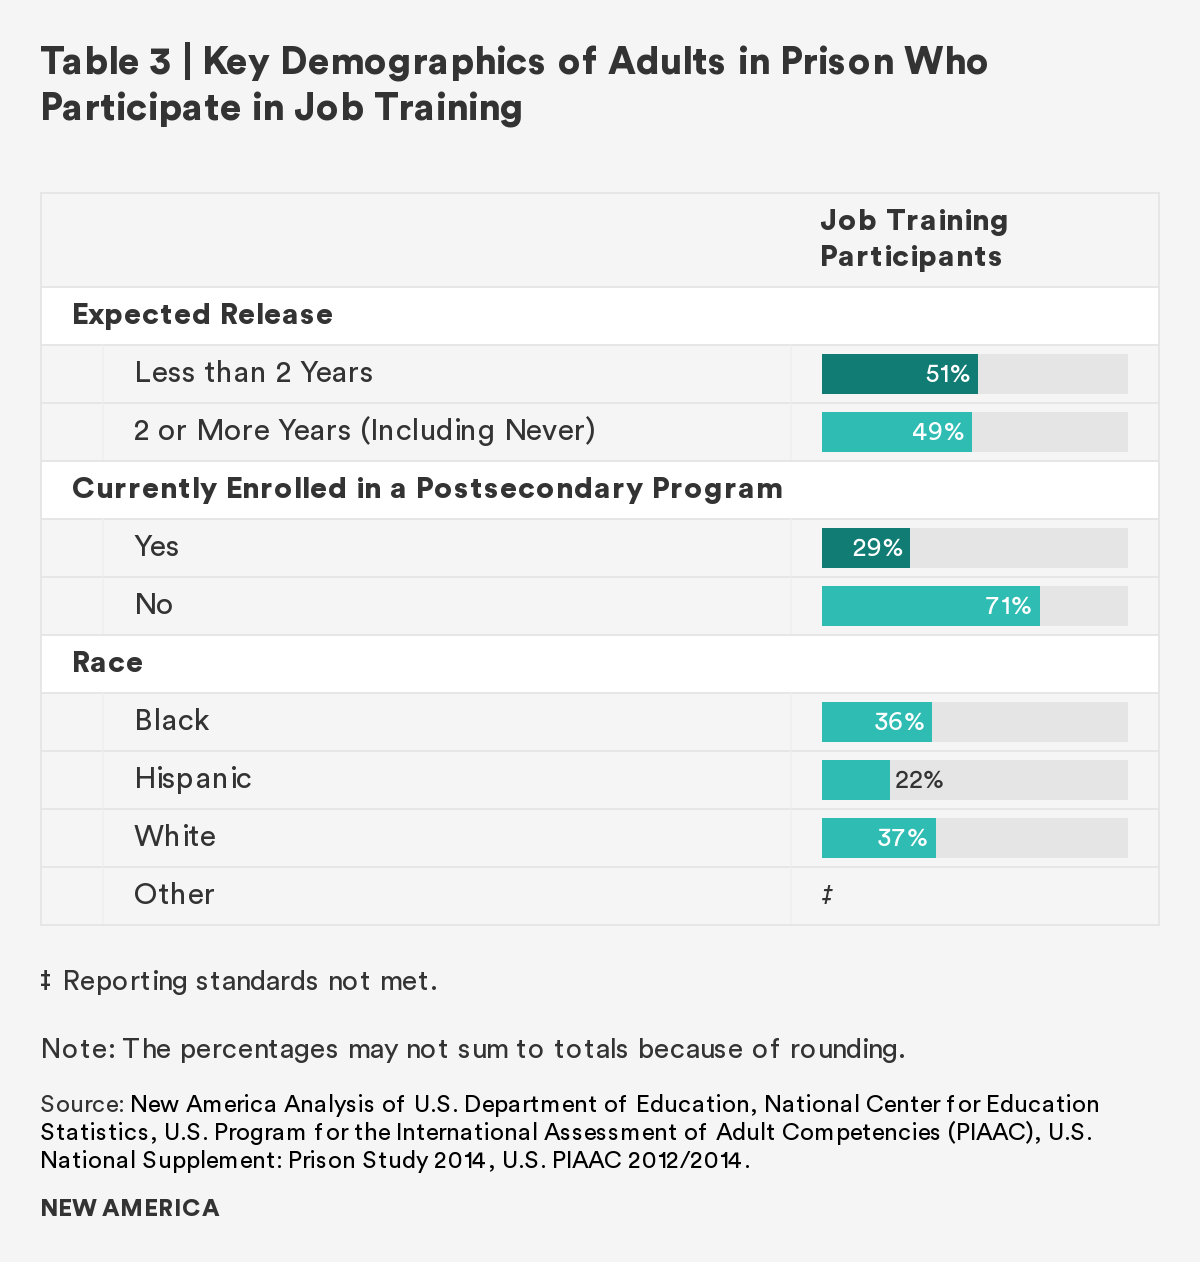
Table 3 below shows the distribution of participation5 in job training across key demographic characteristics.
- Reentry Status: Half (51 percent) of incarcerated students participating in job training programs will be released from prison in fewer than two years.
- Overlap with Postsecondary Education: Twenty-nine percent of incarcerated adults participate simultaneously in job training and postsecondary education.6 One college-in-prison instructor told us this was common, noting that “they will also do vocational training to have two sets of skills, both academic and vocational. They will do this in addition to the other adult programming available.”
Research Question 2: Does approaching reentry increase the likelihood of incarcerated adults enrolling in/completing postsecondary programs and/or participating in job training?
Individuals who are close to reentry (fewer than two years) are not more or less likely to enroll in correctional postsecondary education programs than those with more time remaining to their sentence.7 Similarly, those with fewer than two years to release are not more or less likely to complete a postsecondary credential than those with two or more years to release.8 And job training programs also showed no relationship between participation and the number of years remaining to reentry.9
Research Question 3: What are the reasons for participating in postsecondary education programs and/or job training?
Postsecondary Education
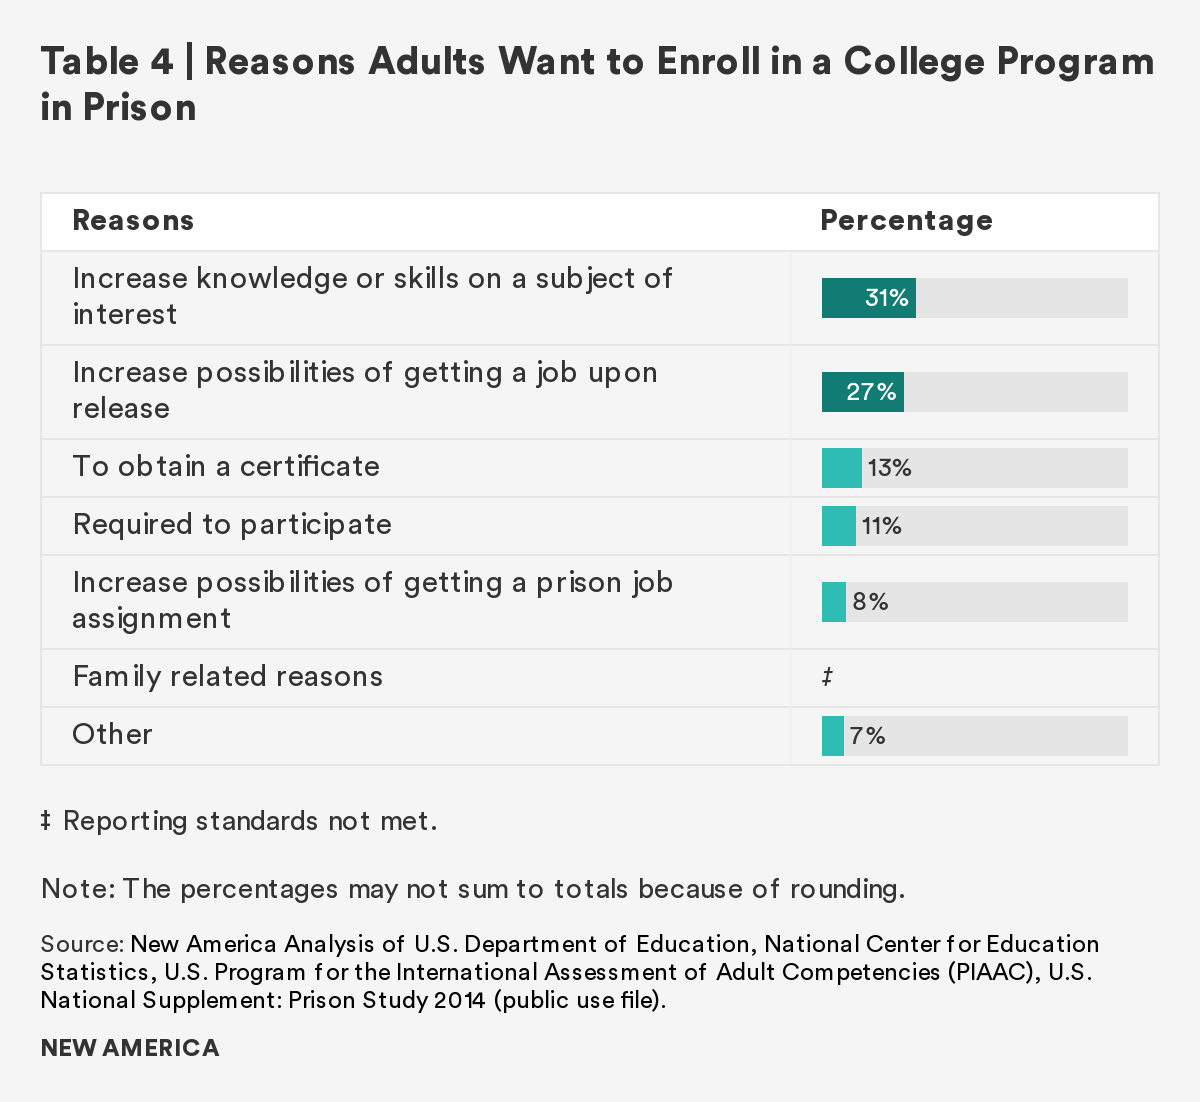
The top two reasons that students gave for wanting to enroll in a postsecondary program while in prison were to increase their knowledge and increase their possibility of getting a job upon release. See Table 4 below.
- About one-third (31 percent) of students who want to be enrolled in a postsecondary program in federal and state prisons, enroll to increase their knowledge or skills in a subject area that is of interest to them. One currently incarcerated student shared that “before I came to prison, I didn’t care about school or getting my education. But now that I have experienced this, I can’t wait to go to class. As soon as I leave class, my next thought is that I can’t wait to go to my next class. I just want to learn more.”
- A slightly smaller share of students (27 percent) who enroll in a postsecondary degree or certificate while incarcerated enroll to increase their possibilities of getting a job upon release. Another currently incarcerated student told us, "I know that as a felon I have two strikes against me, so going to college makes me more marketable and can take one strike away.”
From most of our prison site visits, we learned that an associate degree often functions as the final destination for postsecondary education. However, a combination of interest in educational courses and a deep desire to buffer the negative stigma associated with previous incarceration on labor market participation leads many of the students we spoke with to earn more than one associate degree while in prison. This occurred at many of the Second Chance Pell experimental sites we visited, where students are using their limited Pell funds to earn multiple associate degrees.
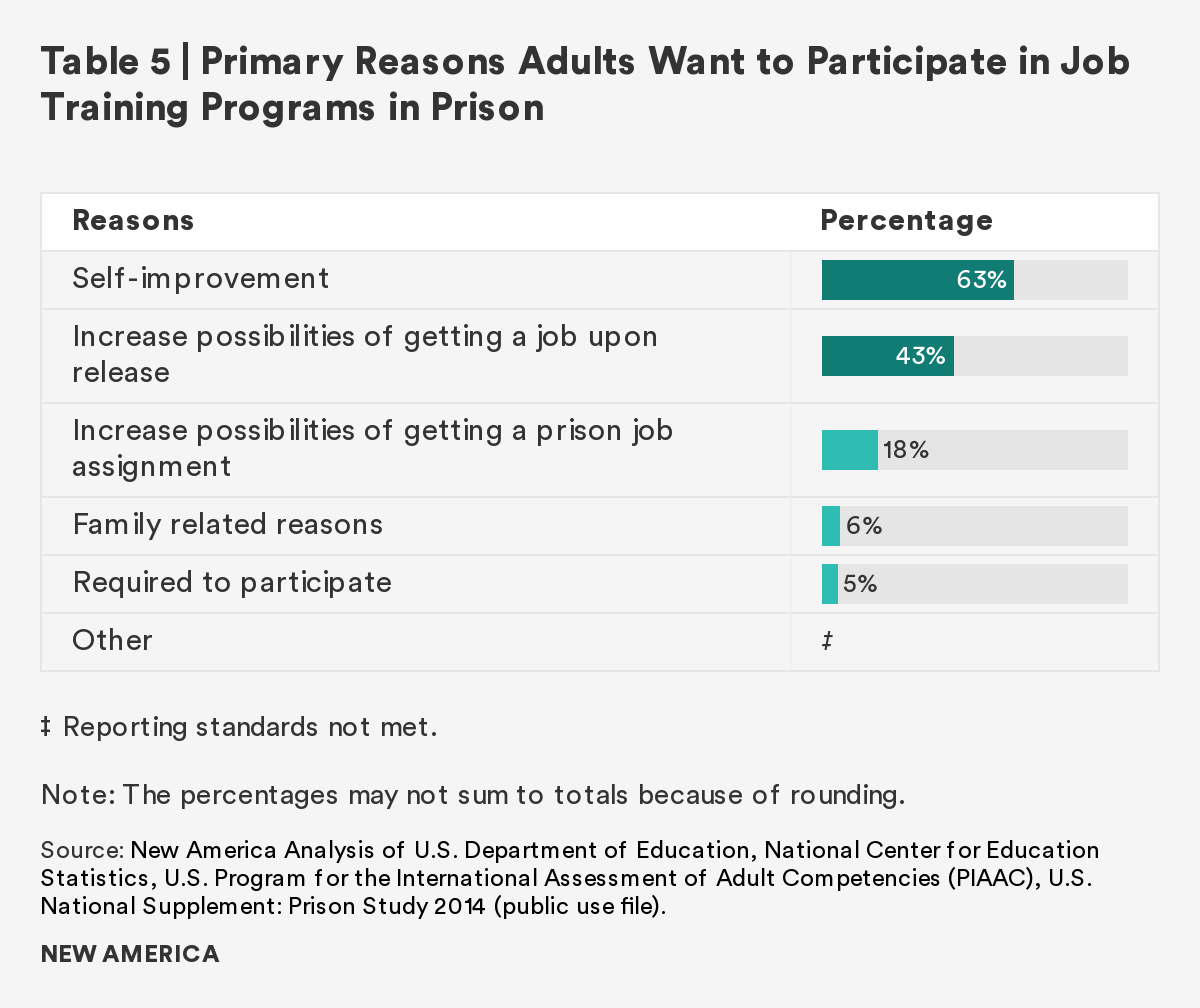
Job Training
Similar to the top two reasons for enrolling in postsecondary programs:
- The primary reason for participating in job training is for self-improvement (63 percent).
- The second most common reason is to increase the probability of getting a job upon release (43 percent). See Table 5 below.
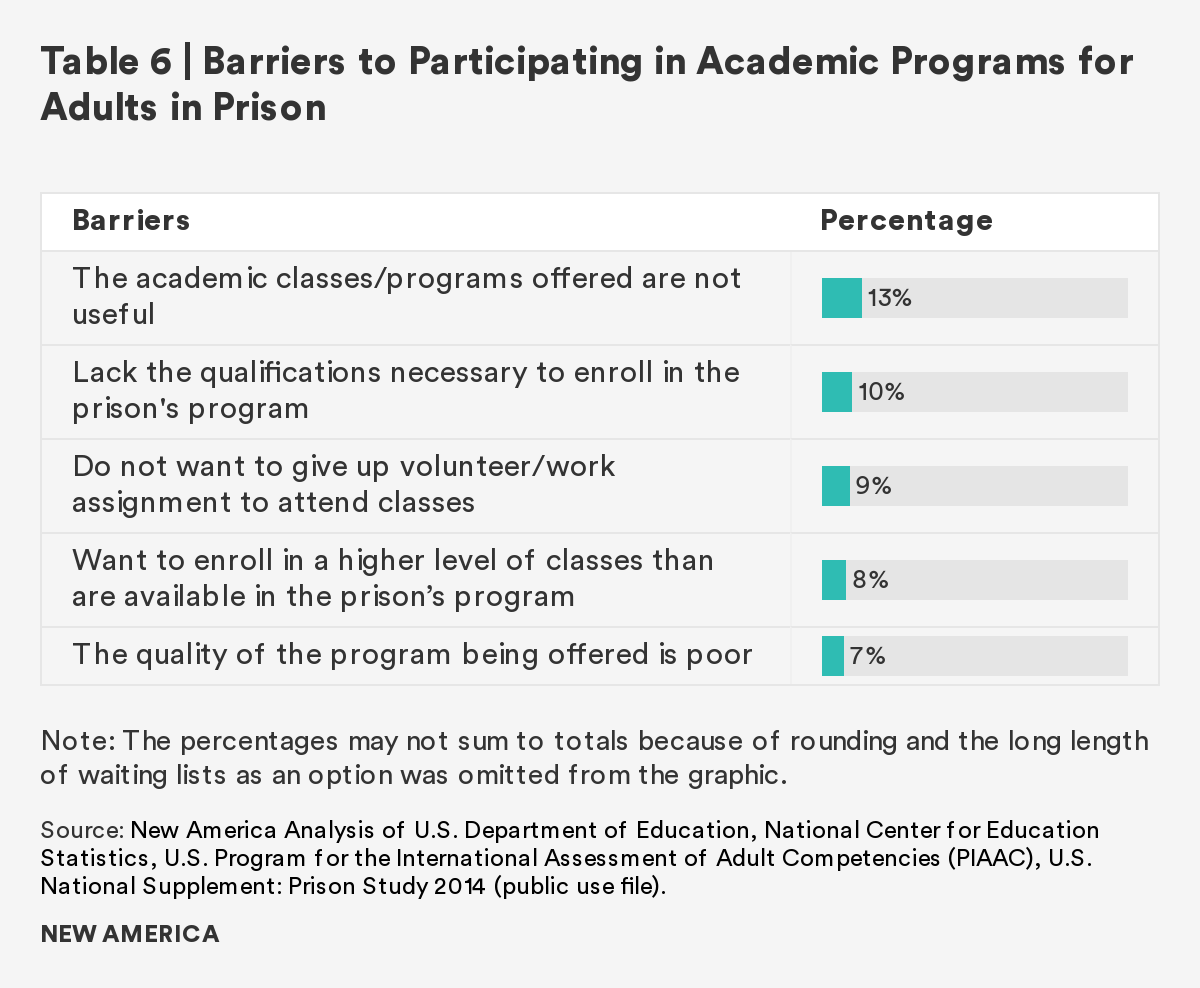
Research Question 4: What are the barriers to participating in academic classes and/or job training programs for incarcerated adults?
Academic Classes
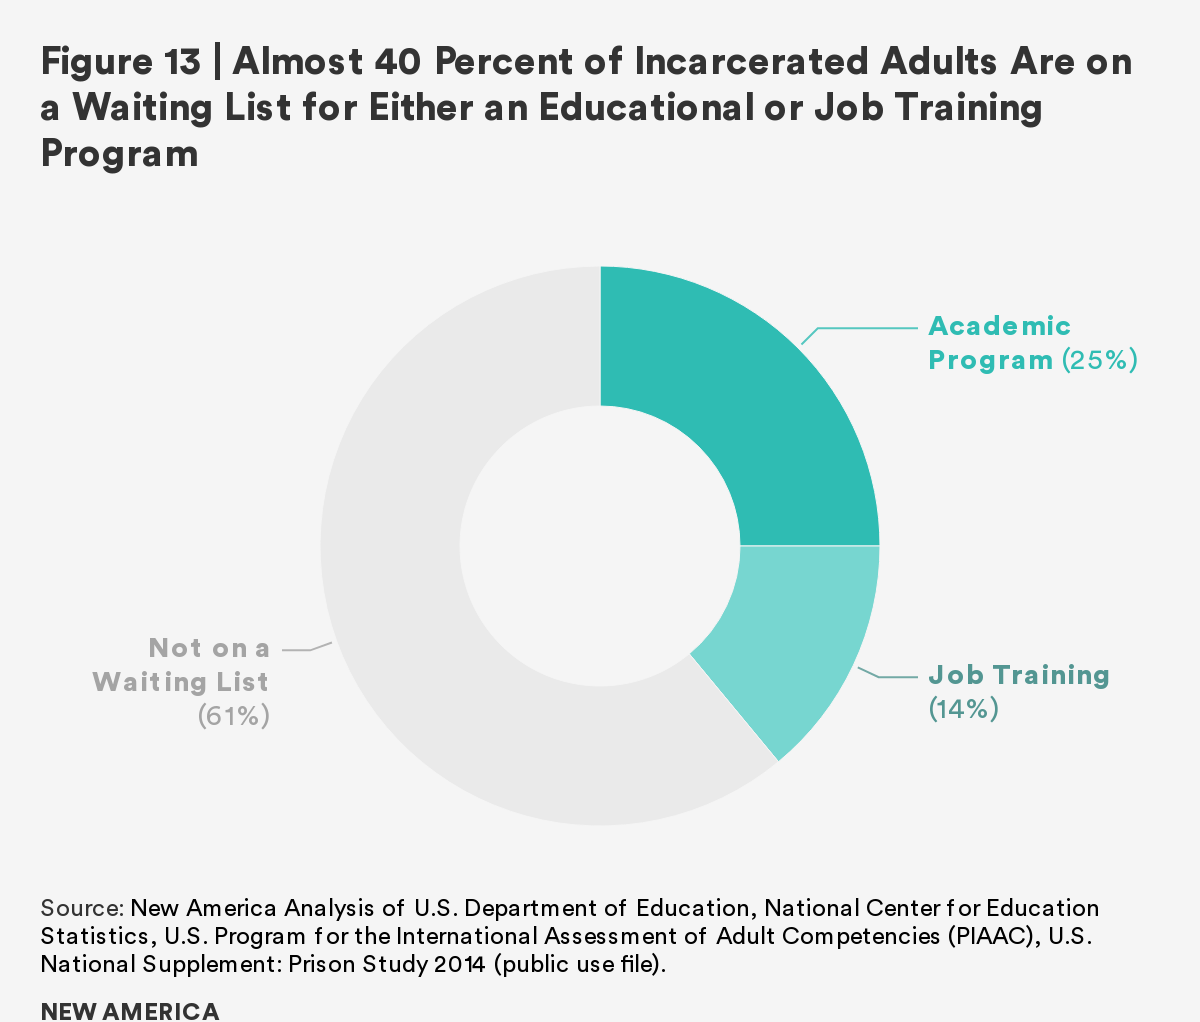
The barriers to participating in an academic program10 while incarcerated include being in prison, waiting lists, and more. One in five adults who stopped their formal education prior to incarceration say that their reason for stopping was because of being sent to a correctional facility. A quarter (25 percent) of adults in federal and state prisons are unable to enroll in an academic class or program of study because they are currently on a waiting list (see figure 13). Additional barriers to participating in academic programs for incarcerated adults are in Table 6 below.
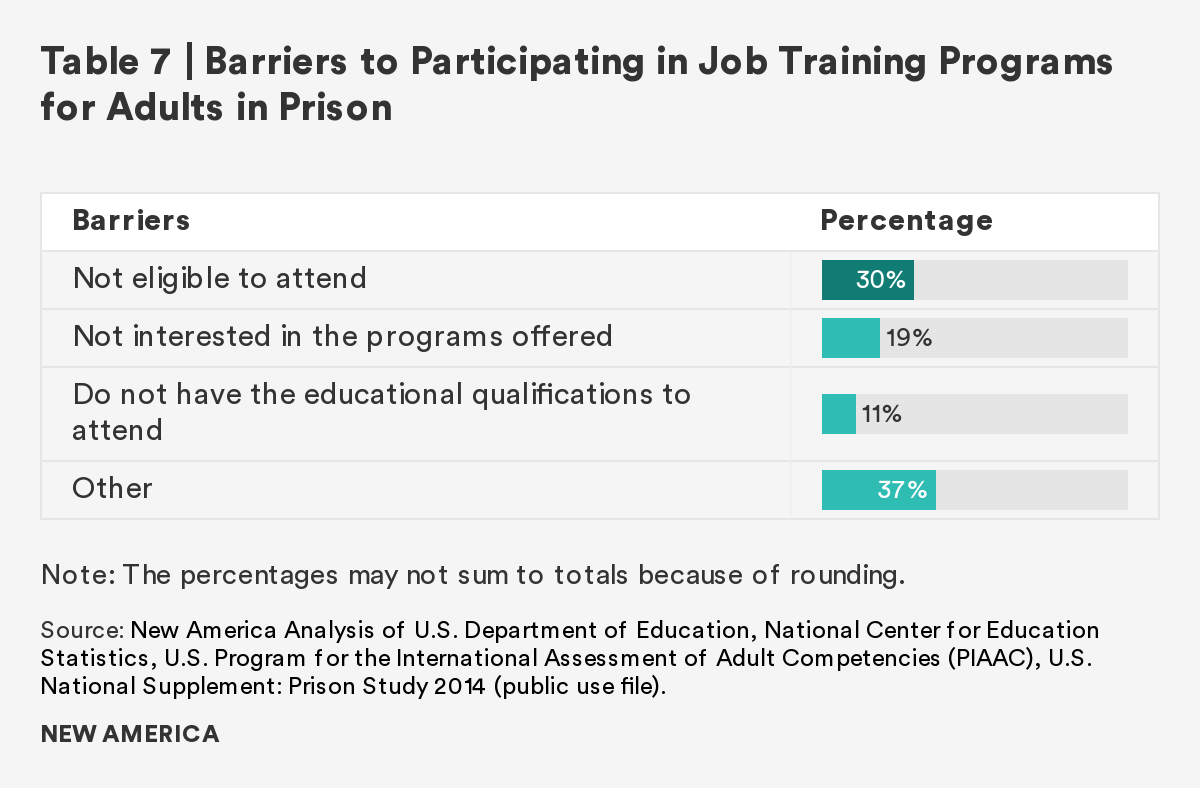
Job Training
Barriers to participating in job training while incarcerated similarly include waiting lists, lacking educational qualification, and more. About 14 percent of adults in federal and state prisons are currently on a waiting list for job skills or a job training course (see figure 13).
When incarcerated adults are asked the reason for not attending a course or program to learn job skills or job training, a third (30 percent) of incarcerated adults said they were not eligible to attend. See Table 7 below.
Skills-Related Results
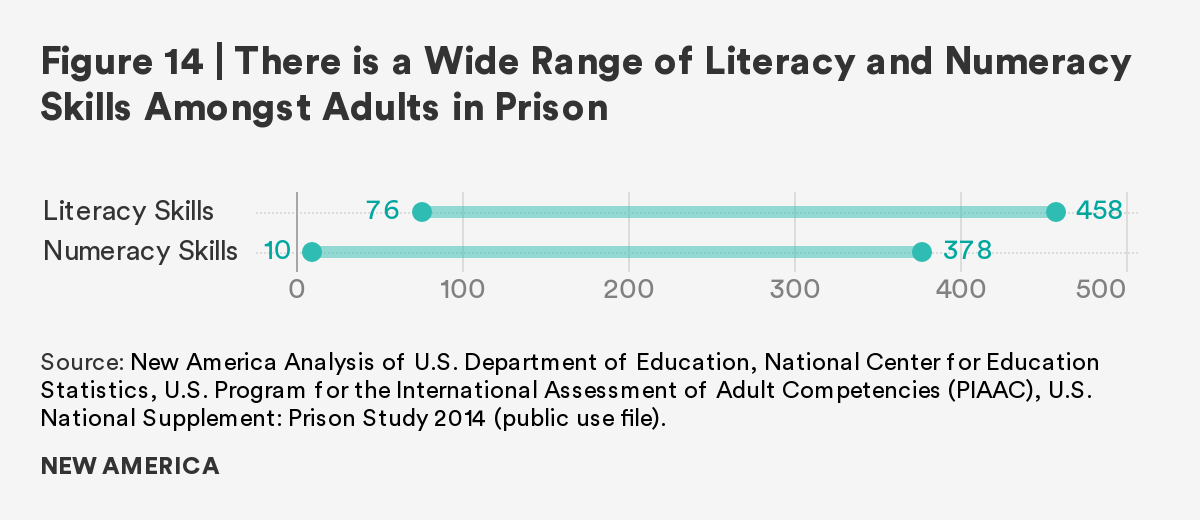
Research Question 1: What is the range of skills that incarcerated adults possess?
The range of possible literacy and numeracy scores on the PIAAC assessment is from 0 to 500. The average range of literacy scores for incarcerated adults extend from 76 to 458,11 while the average range of numeracy scores for incarcerated adults are from 10 to 378.12 See figure 14 below.
Research Question 2: Does a statistically significant gap in literacy and numeracy skills exist between incarcerated adults and the general public?
Literacy Skills
There is a statistically significant gap in literacy skills between the U.S. general public and adults in U.S. federal and state prisons.13
- With the exception of the lowest literacy proficiency level (Below Level 1), there is a significantly higher proportion of incarcerated adults in the lower literacy proficiency levels, while there is a greater proportion of the general public towards the higher proficiency levels.
- The average literacy score for incarcerated adults (249) is statistically significantly lower than the average literacy score of the general public (270).14 See Table 8 below.
- For both incarcerated adults and the general public, the average literacy proficiency level is a Level 2 (basic), indicating that, on average, Americans have a foundational level of literacy skills.
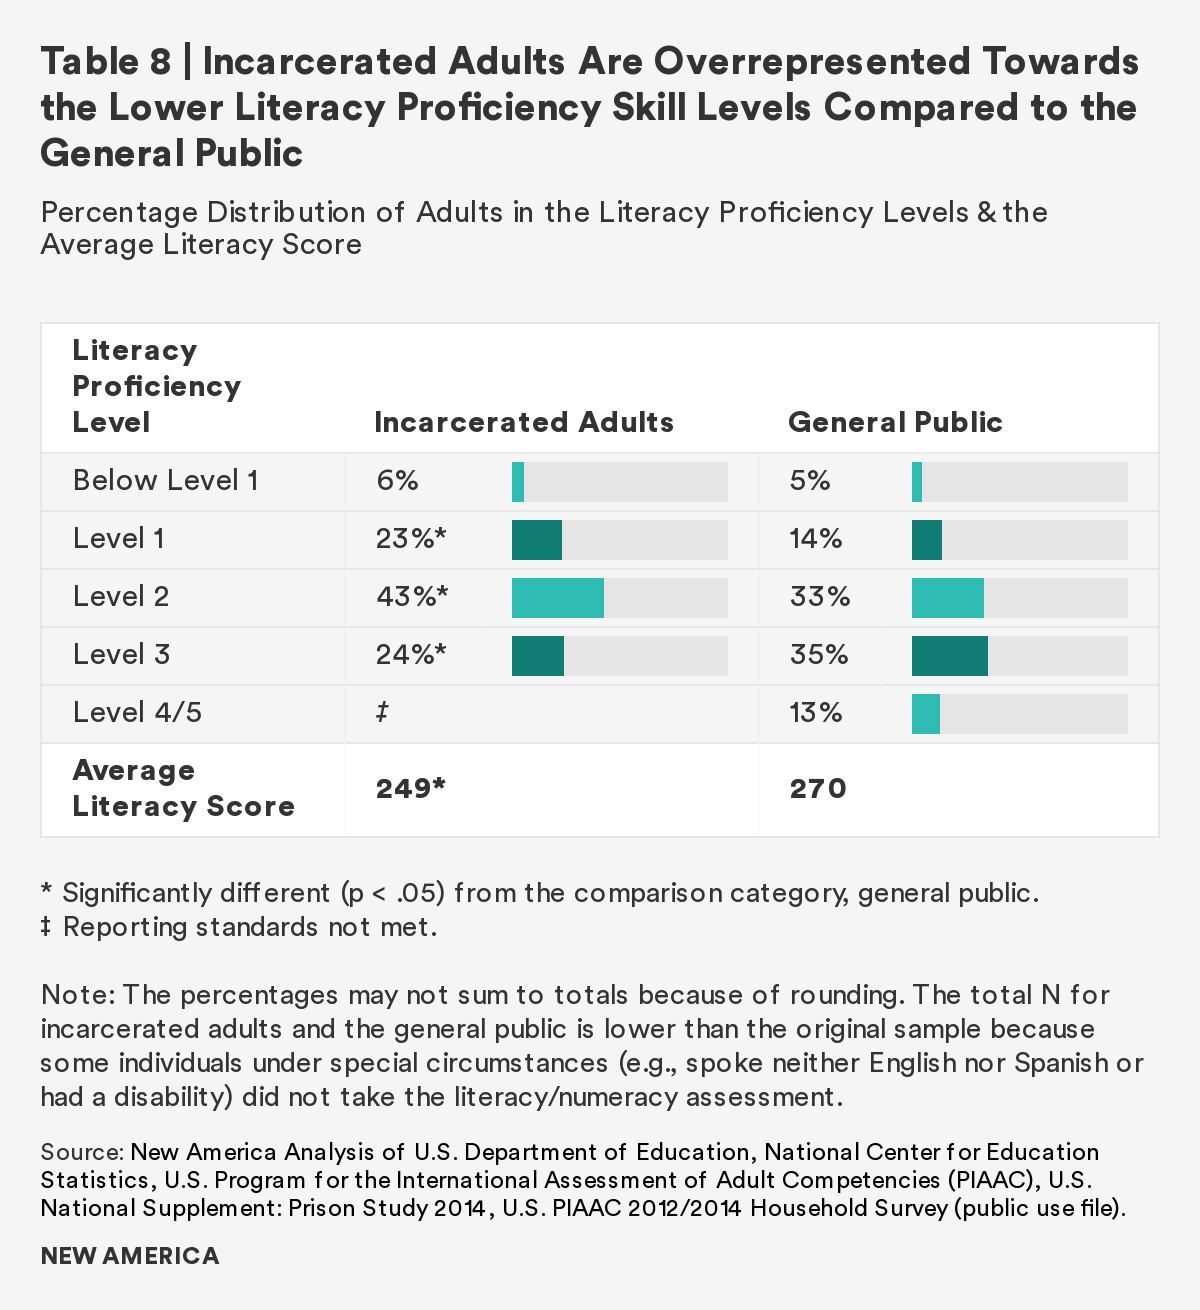
Table 9 describes the activities individuals can perform at each of the literacy proficiency levels.15
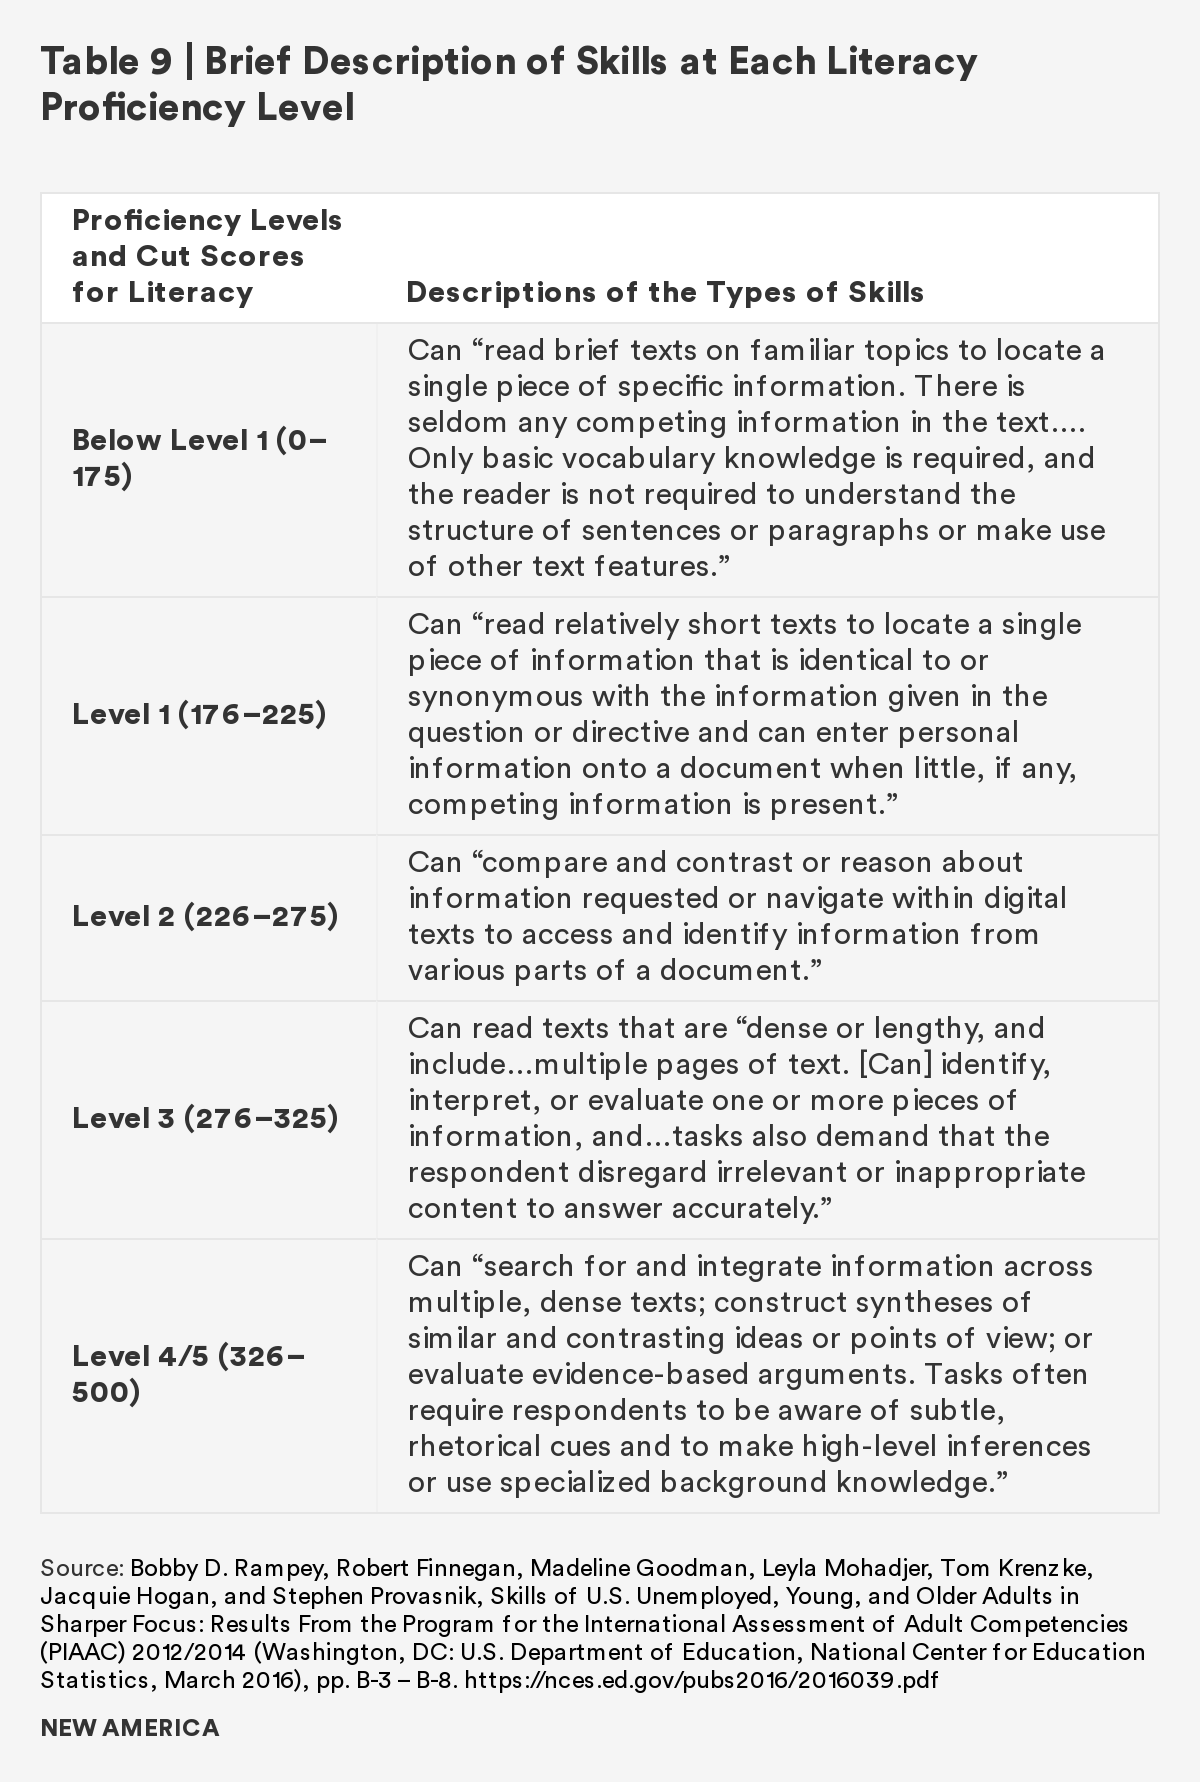
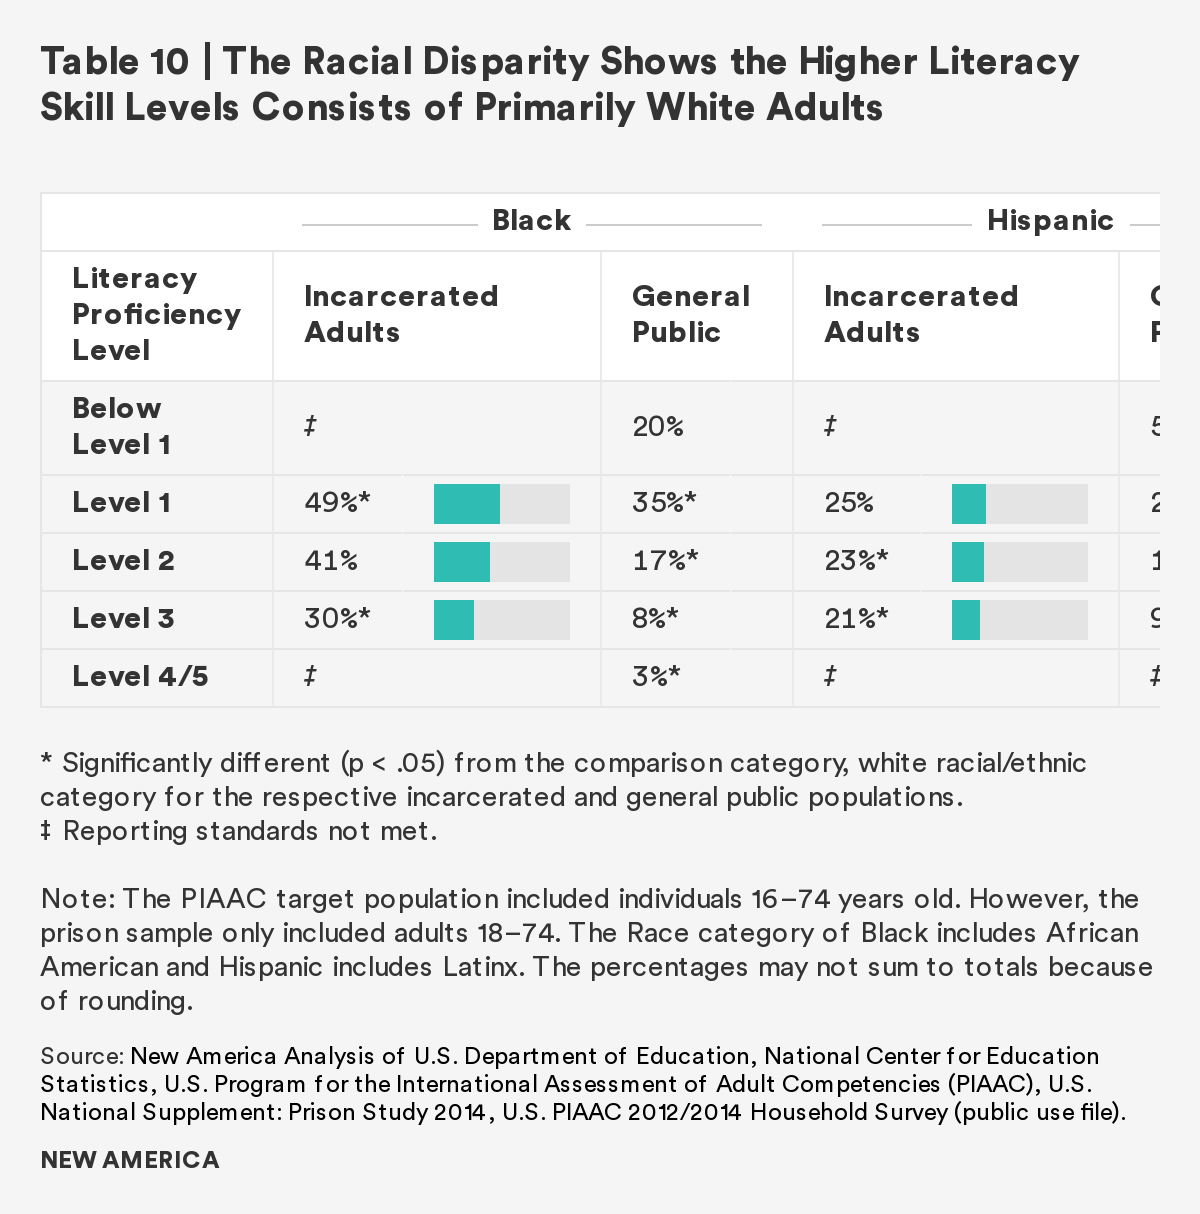
Table 1016 below shows the percentages of adults in literacy proficiency levels across race/ethnicity for both the general public and incarcerated adults. Across both populations, the majority of those at the lower literacy levels consist of individuals of color, while the higher literacy levels consist of primarily white individuals. There is a statistically significant gap in skills across racial/ethnic categories within both populations,17 but it is more pronounced among the general public, especially towards the higher literacy proficiency levels, where 93 percent of the general public at a Level 4/5 proficiency are white compared with 3 percent are Black.
Numeracy Skills
Similar to the literacy gap analysis, there is a statistically significant gap in numeracy skills between the U.S. general public and adults in U.S. federal and state prisons.18
- With the exception of Level 2 (where both populations have equal proportions scoring at the basic level), incarcerated adults are overrepresented in the lower numeracy proficiency levels, while the general public is overrepresented towards the higher proficiency levels.
- The average numeracy score for incarcerated adults (220) is statistically significantly lower than the average numeracy score for the general public (255).19 Table 11 below shows the gap in the numeracy skill outcomes between the two groups.
- For the general public, the average numeracy proficiency level is Level 2, while the average numeracy proficiency level is Level 1 for those who are incarcerated.
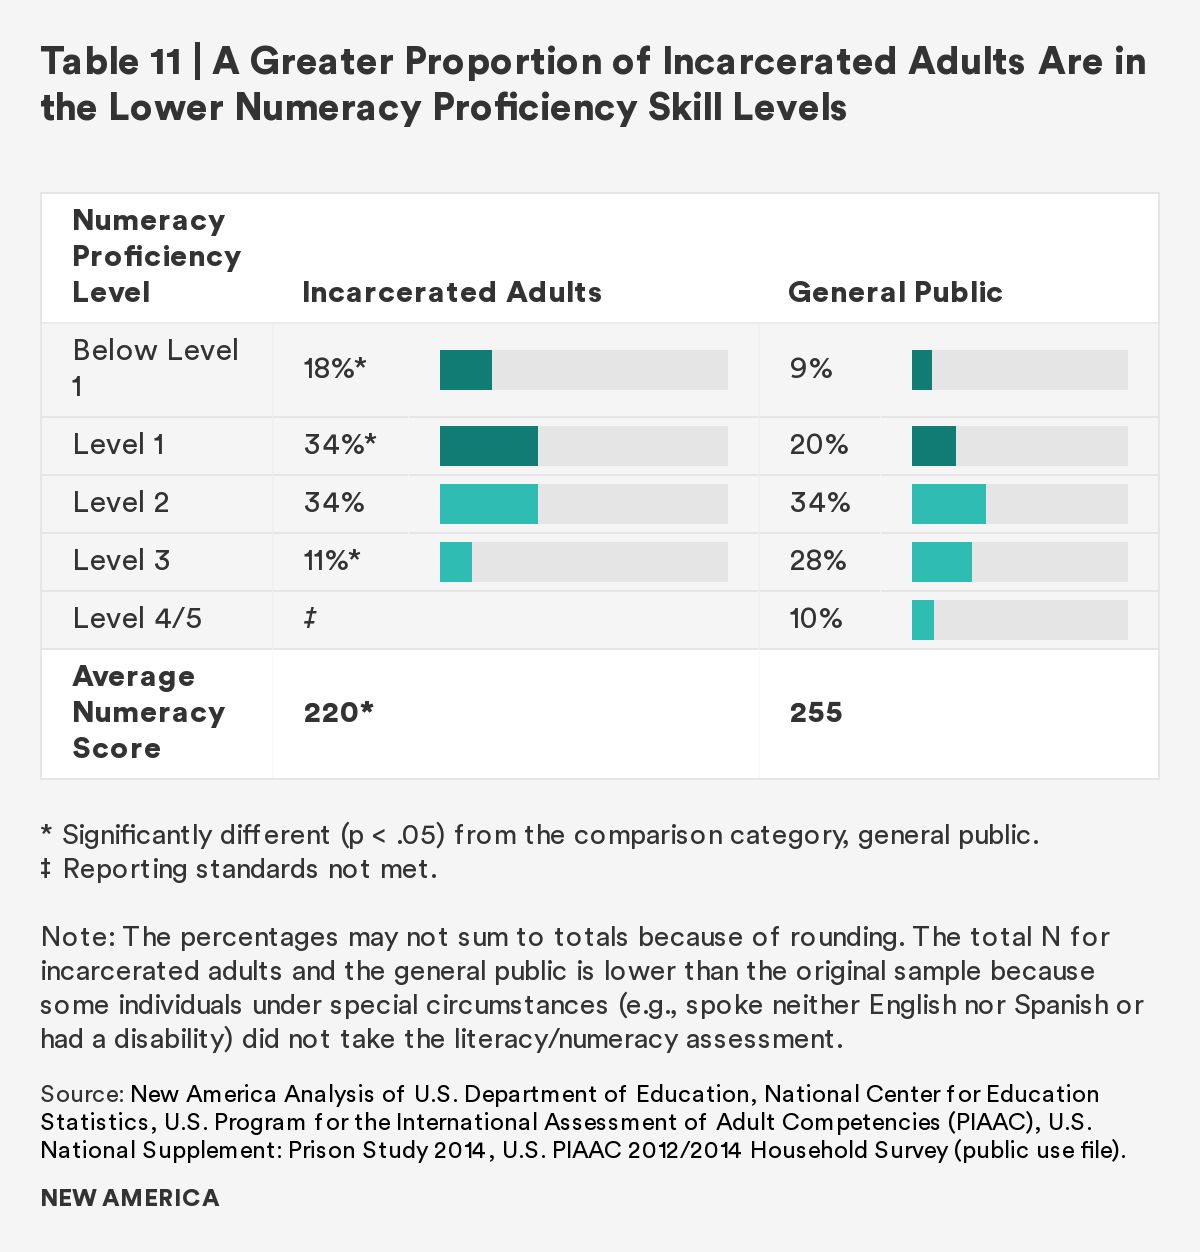
Table 12 describes the activities individuals can perform at each of the proficiency levels.20
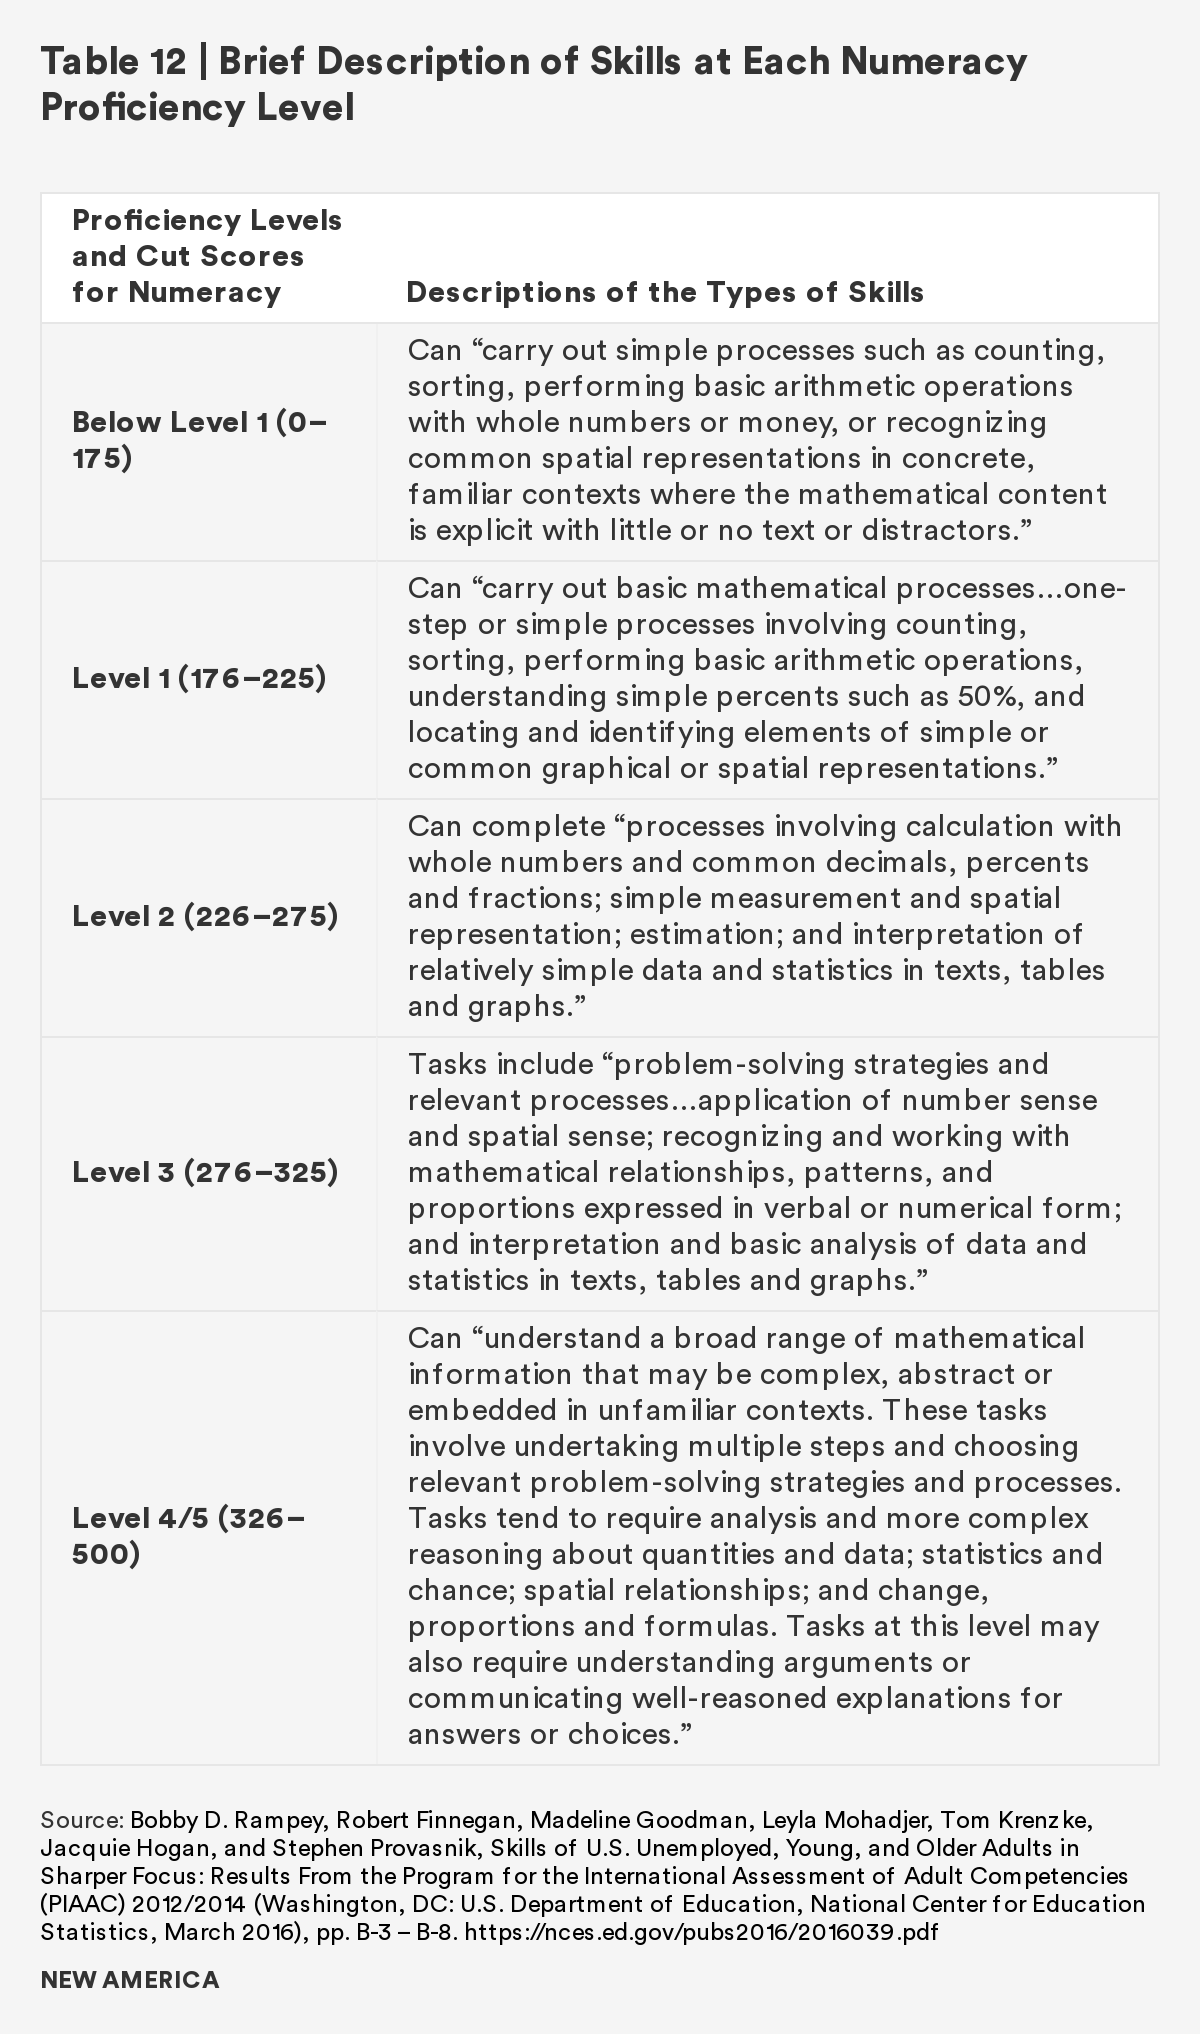
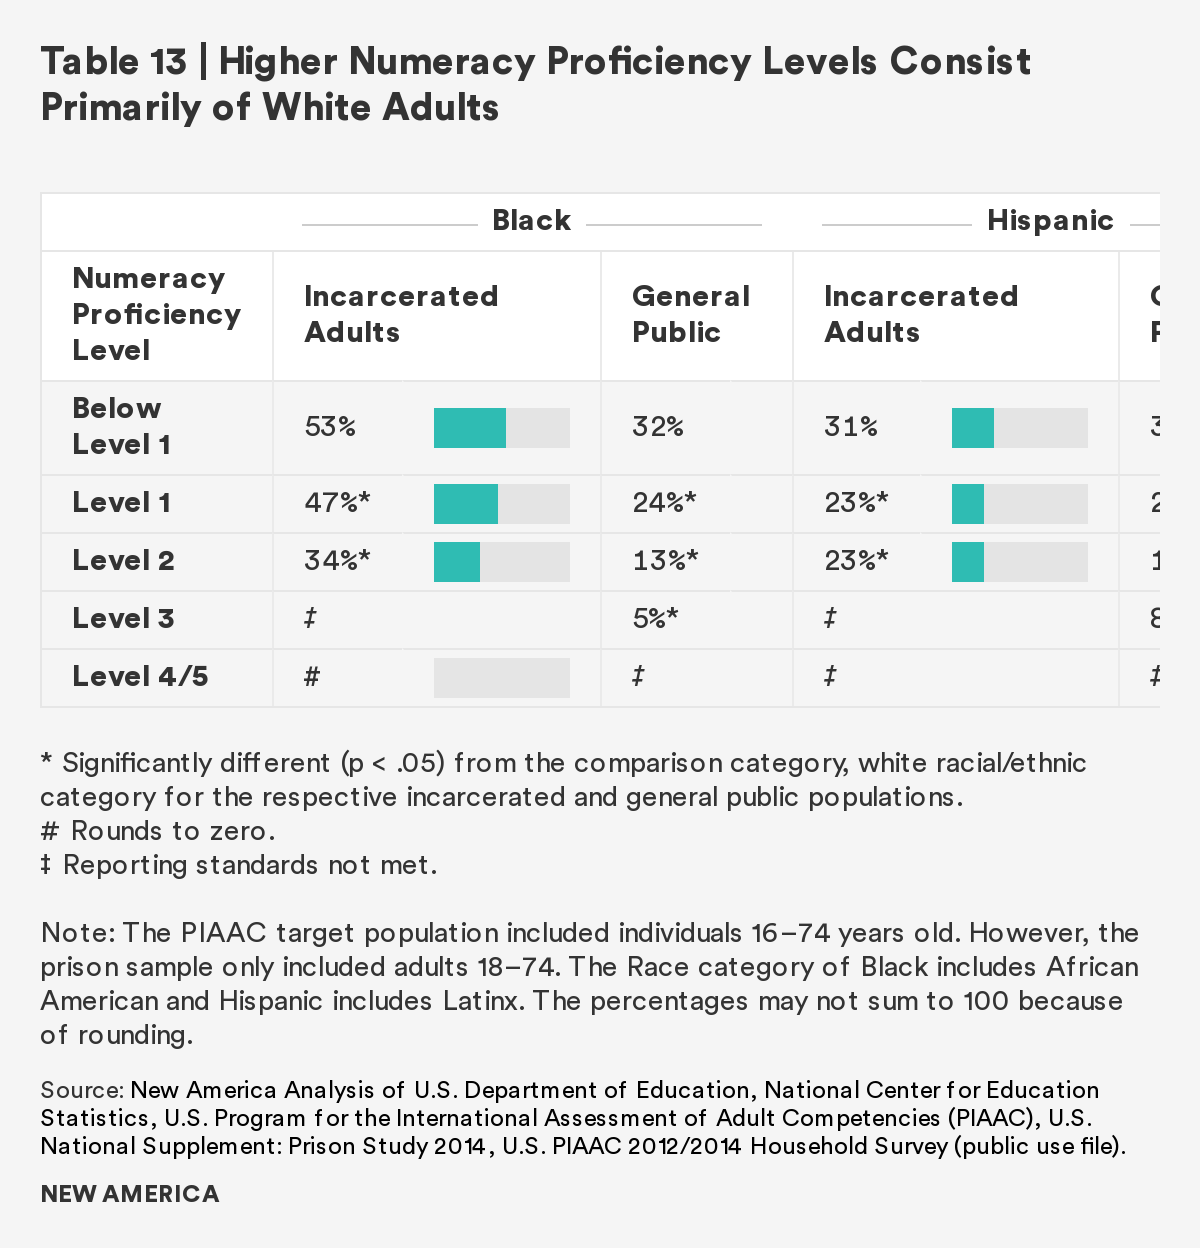
Table 1321 below shows the percentage of adults at the numeracy proficiency levels across race/ethnicity for both the general public and incarcerated adults. Similar to the results of the literacy domain, across both populations, there is a statistically significant gap in numeracy skills across racial/ethnic categories,22 where the higher numeracy proficiency levels consist of white individuals. The gap in skills across racial/ethnic categories is more pronounced among the general public, with 87 percent of adults at Level 3 are white compared to 8 percent are Hispanic and 5 percent are Black (see Table 13).
Research Question 3: How does the skill level of incarcerated individuals approaching reentry (fewer than two years) compare with the general public?
Literacy Skills
- Similar to the literacy proficiency gap observed between the entire incarcerated population and the general public, the average literacy score of those close to reentry (247) is statistically significantly lower than the average literacy score for the general public (270).23
Numeracy Skills
- Similar to the literacy skill domain, the average numeracy score of those close to reentry (219) is statistically significantly lower than the average numeracy score for the general public (255).24
These results should be important to policymakers because those closest to reentry (fewer than two years) do not have comparable skills to the general public. This gap could pose significant challenges for formerly incarcerated individuals as they try to integrate into the workforce upon release.
Research Question 4: Does participating in/completing postsecondary education and/or job training in prison have an effect on adults’ skills?
Literacy Skills
Although there is a statistically significant gap in skills between incarcerated individuals and the general public, completing a postsecondary degree or certificate and/or participating in job training mitigates the literacy proficiency gap.
Postsecondary Education
- There is a statistically significant positive relationship between literacy proficiency skill levels and completion of a postsecondary degree or certificate during incarceration. Those who complete a postsecondary credential are more likely to attain higher literacy proficiency levels compared to incarcerated adults who do not.25
- On average, those who complete a postsecondary degree or certificate while incarcerated score 26 points higher in literacy scores compared with adults who do not complete additional levels of education while incarcerated.26 See figure 15.
Job Training
- Those who participate in job training programs while incarcerated are more likely to have higher literacy proficiency skill levels compared to incarcerated adults who do not.27
- On average, individuals who participate in job training while incarcerated score 12 points higher in literacy compared with individuals who do not.28 See figure 15.
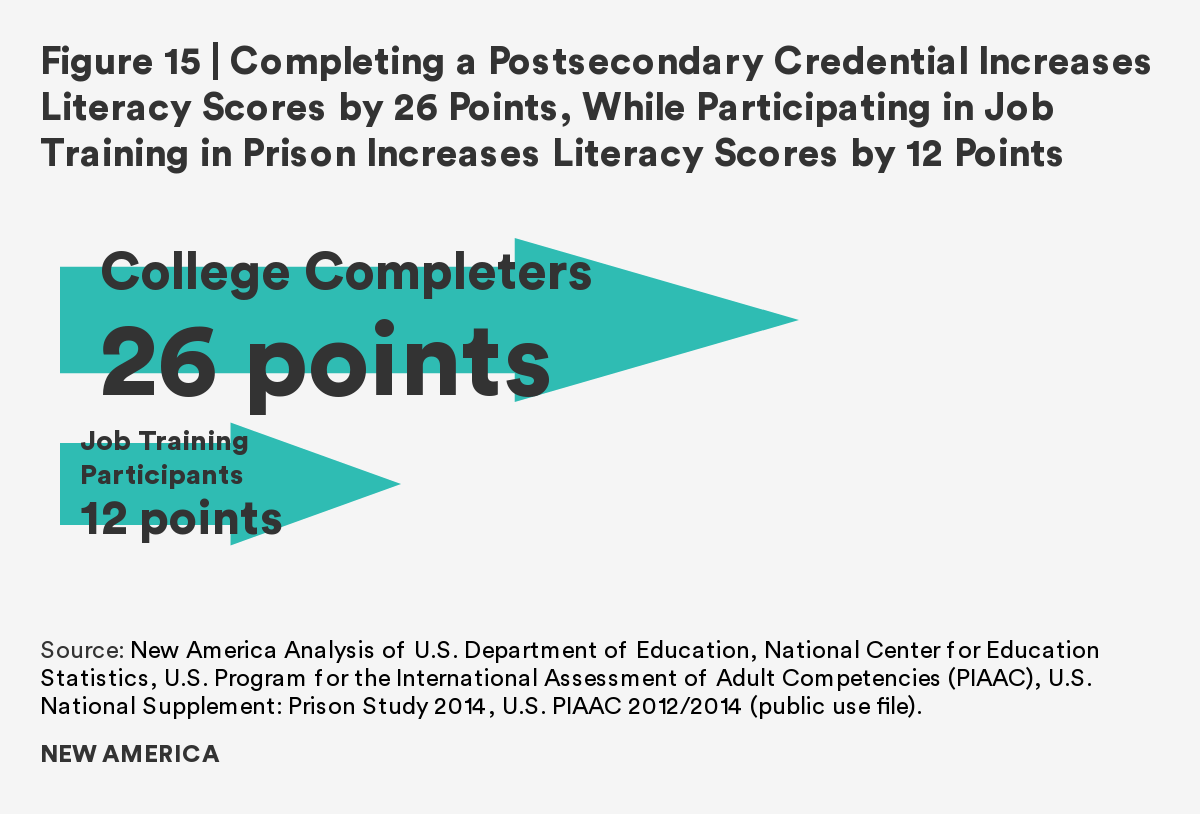
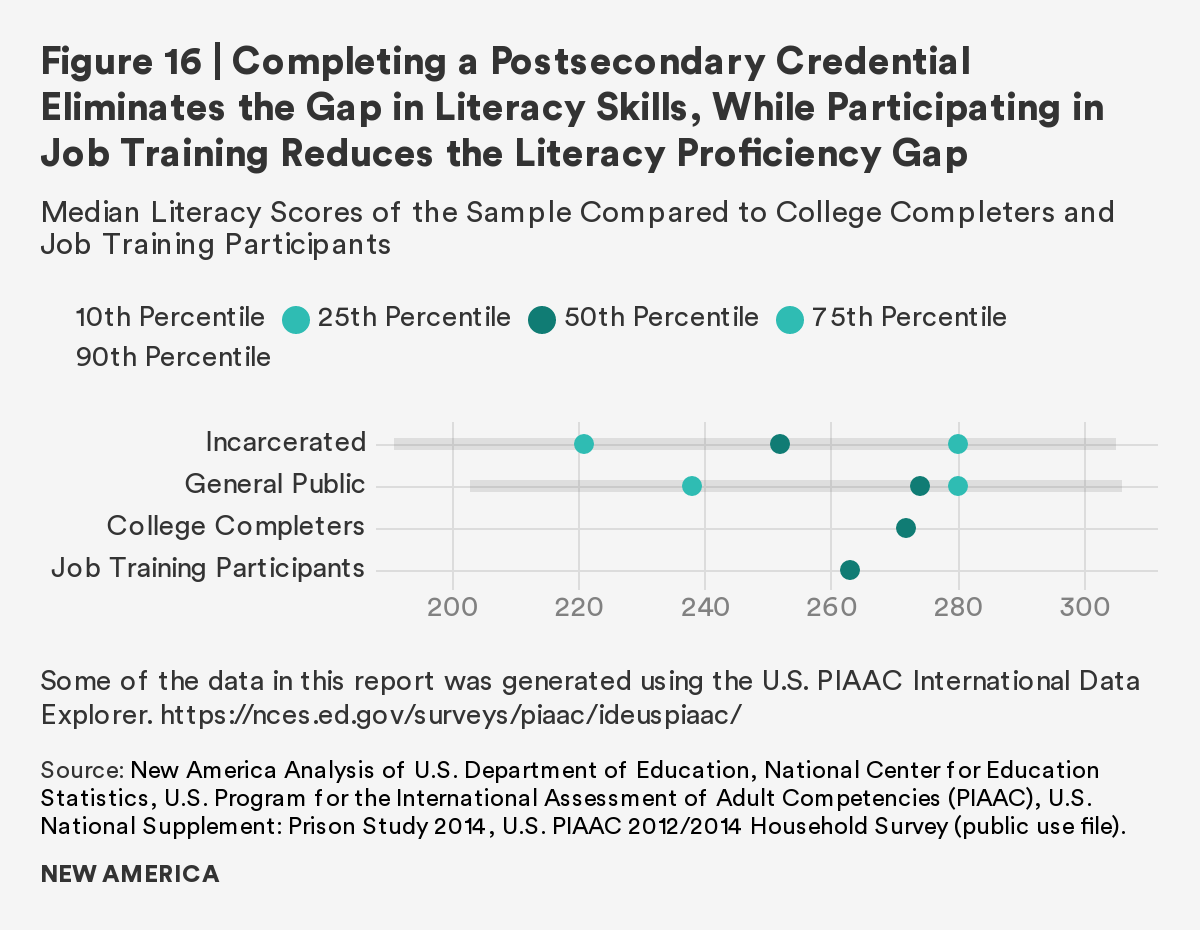
Figure 16 below shows the literacy scores along the 10th, 25th, 50th, 75th, and 90th percentiles for both the general public and incarcerated adults. The figure also shows the median literacy scores for the two groups (incarcerated and general public) juxtaposed with the median literacy scores for adults who complete a postsecondary degree or certificate and/or participate in job training while incarcerated.
Figure 16 shows the median literacy score for individuals who complete a postsecondary degree or certificate while incarcerated (272) score in the 50th percentile of literacy scores for the general public and is comparable to the median literacy score of the general public (274).
Figure 16 also shows that for individuals who participate in job training while incarcerated, the median literacy score (263) exceeds that of the incarcerated population (252) and is positioned at the 50th percentile of literacy scores for the general public.
Numeracy Skills
Similar to the literacy domain results, there is a statistically significant positive relationship between the numeracy proficiency skill levels and completion of a postsecondary credential and participation in job training during incarceration.
Postsecondary Education
- Individuals who complete a postsecondary degree or certificate while incarcerated are more likely to reach higher numeracy proficiency levels than individuals who do not.29
- Those who complete a postsecondary credential during incarceration, on average, score 38 points higher in numeracy compared to adults who do not complete additional levels of education during incarceration.30 See figure 17.
Job Training
- Those who participate in job training programs while incarcerated are more likely to have higher numeracy proficiency skill levels compared with incarcerated adults who do not.31
- On average, those incarcerated individuals in job training programs score 18 points higher in numeracy than incarcerated adults who do not.32 See figure 17 below.
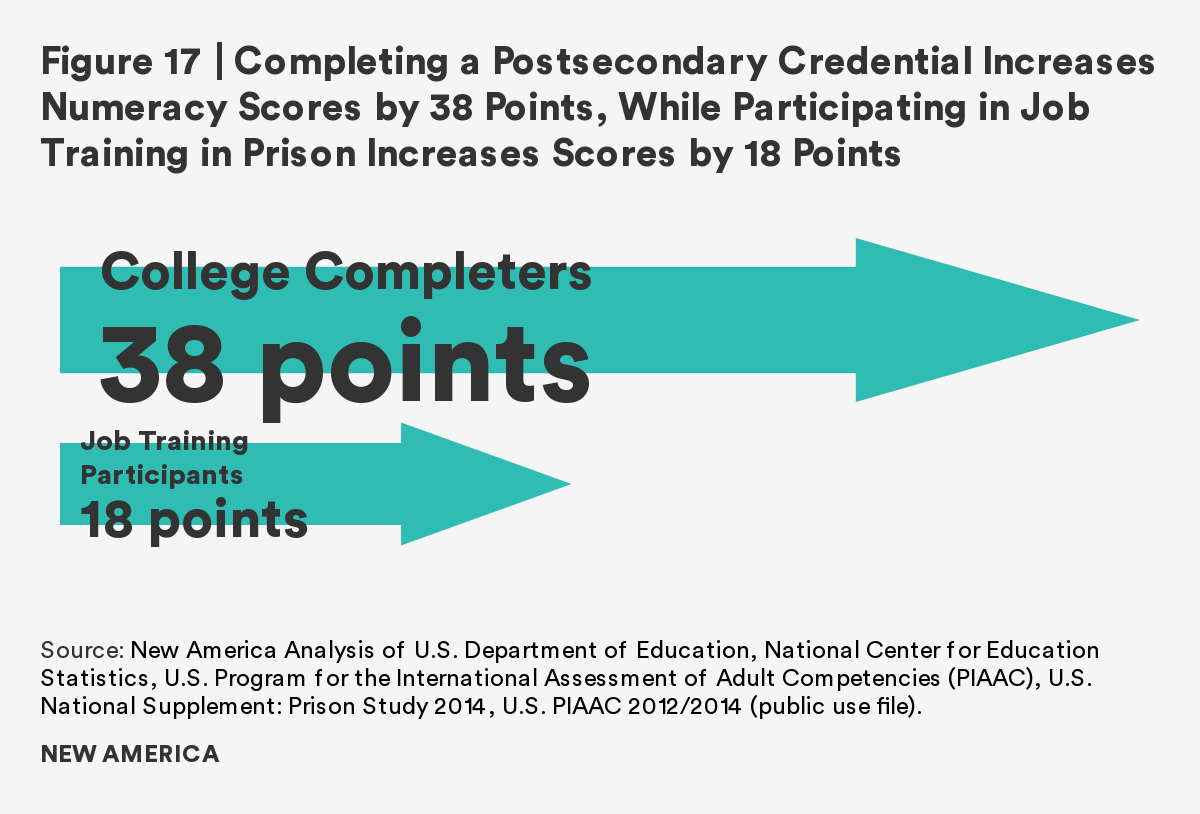
Figure 18 below shows that the median numeracy score for individuals who complete a postsecondary degree or certificate while incarcerated (253) is in the 50th percentile of numeracy scores for the general public and substantially exceeds the median numeracy score of the overall incarcerated population (223).
The figure below also shows that the median numeracy score for individuals who participate in job training (235) while incarcerated exceeds the median numeracy score of the overall incarcerated population (223) and is positioned at the 50th percentile of numeracy scores for the general public.
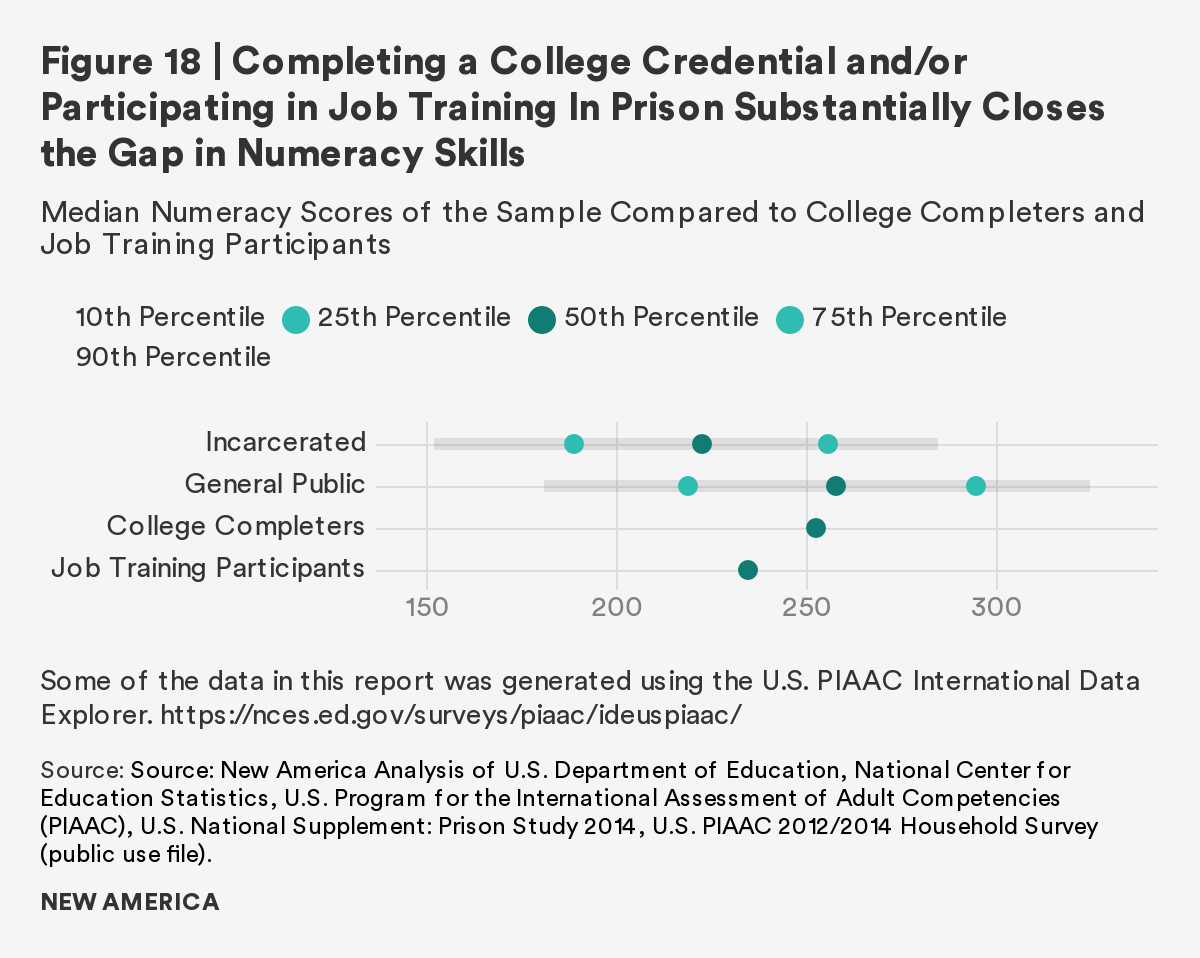
The literacy and numeracy medians displayed in figures 16 and 18 provide compelling evidence that completing postsecondary education and participating in job training while in prison closes the gaps in literacy and numeracy skills between the incarcerated population and the general public.
Citations
- Adults who did not complete additional education while incarcerated potentially include those who may have less than a high school equivalence, as well as adults who already completed a graduate degree prior to incarceration. See Highlights from the U.S. PIAAC Survey of Incarcerated Adults: Their Skills, Work Experience, Education, and Training: Program for the International Assessment of Adult Competencies: 2014 (NCES 2016-040).
- Due to the small sample size of adults completing additional education while incarcerated, the reentry status variable is collapsed into two categories for the remainder of the report.
- The analysis of this report does not attempt to explain why there is a difference in enrollment and completion rates across racial/ethnic groups.
- The job-training outlets available to incarcerated adults focus on providing specific workplace skills, such as learning Microsoft Word. The job-training outlets exclude prison jobs.
- The 2014 PIAAC Prison data only includes data on incarcerated adults who participate in job training. The data does not explicitly detail information on incarcerated adults’ who complete job training.
- A correlation analysis found that enrolling into a postsecondary degree or certificate program while incarcerated is statistically significantly associated with job-training participation.
- New America analysis with a bivariate logistic regression.
- New America analysis with a bivariate logistic regression.
- New America analysis with a bivariate logistic regression.
- Within the 2014 PIAAC Prison Survey, the variable to explain the barriers to enrolling in educational programs includes all correctional education programs (e.g., ABE, GED, certificates, etc.).
- The range excludes the 54 incarcerated adults who failed the core comprehension assessment. Those who fail the core comprehension assessment lack the basic cognitive skills to complete the literacy/numeracy skills assessment and were directed to the reading comprehension. These individuals were omitted from the range to avoid a skewed range of literacy scores.
- The range excludes the 54 incarcerated adults who failed the core comprehension assessment.
- New America analysis with an independent samples t-Test.
- New America analysis with an independent samples t-Test.
- Bobby D. Rampey, Robert Finnegan, Madeline Goodman, Leyla Mohadjer, Tom Krenzke, Jacquie Hogan, and Stephen Provasnik, Skills of U.S. Unemployed, Young, and Older Adults in Sharper Focus: Results From the Program for the International Assessment of Adult Competencies (PIAAC) 2012/2014 (Washington, DC: U.S. Department of Education, National Center for Education Statistics, March 2016), pp. B-3 – B-8. source
- The table compares the distribution of Black and Hispanic respondents to the distribution of white individuals in each of the proficiency levels.
- New America analysis with an independent samples t-Test.
- New America analysis with an independent samples t-Test.
- New America analysis with an independent samples t-Test.
- New America analysis with logistic regression, holding race and age constant.
- New America analysis with linear regression, holding race and age constant.
- New America analysis with logistic regression, holding race and age constant.
- New America analysis with linear regression, holding race and age constant.
- New American analysis with logistic regression, holding race and age constant.
- New America analysis with linear regression, holding race and age constant.
- New American analysis with logistic regression, holding race and age constant.
- New America analysis with linear regression, holding race and age constant.