
Table of Contents
- The Emerging Millennial Wealth Gap: Opening Note
- Building Ladders of Success for the Rising Millennial Generation: An Initiative Funded by the Citi Foundation
- Part 1: Generational Wealth and Financial Health
- Framing the Millennial Wealth Gap: Demographic Realities and Divergent Trajectories
- Trends, Origins, and Implications of the Millennial Wealth Gap
- The Millennial Racial Wealth Gap
- The Young and (Economically) Restless: The Nature of Work for American Millennials
- The Financial Lives of Millennials: Evidence from the U.S. Financial Health Pulse
- Part 2: Components of the Millennial Balance Sheet: Assets and Liabilities
- Wealth and the Credit Health of Young Millennials
- Millennials and Student Loans: Rising Debts and Disparities
- Young Adults and Consumer Debt: The Quiet Crisis Next Time
- Homeownership and Living Arrangements among Millennials: New Sources of Wealth Inequality and What to Do about It
- Part 3: Implications for Social Policy
- Public Policy Implications of the Millennial Wealth Gap
- Addressing the $1.5 Trillion in Federal Student Loan Debt
- Policy Responses to the Millennial Wealth Gap: Repairing the Balance Sheet and Creating New Pathways to Progress
Trends, Origins, and Implications of the Millennial Wealth Gap
William R. Emmons, Ana H. Kent, and Lowell R. Ricketts
Millennials have been the subject of great scholarly and popular discourse in recent years, and for good reasons. Using a definition of those born between 1981 and 1996, Millennials are now the largest generation in the world, and in the United States they recently surpassed the Baby Boomers to claim the largest generational share of the country’s population pie.1 In part, the focus resides on Millennials because their superior numbers are not matched by corresponding increases in a number of traditional socioeconomic markers of well-being, including household income and marriage rates. Additionally, various sources question their ability to meet longer-term financial goals, such as supporting their children’s college education, saving for retirement and investing, and owning a home.2
Today, Millennials compose the majority of the workforce, are increasingly found in leadership positions, and pay into Social Security. Companies and marketing firms study them avidly and roll out products, like avocado toast and small-batch artisan soaps, in order to attract their purchasing power. They have strength in numbers, yet their per capita consumption ability may be reduced compared to that of older groups. Indeed, as we document, Millennials are significantly behind the wealth benchmarks set by previous generations.3
Last year The Federal Reserve Bank of St. Louis Center for Household Financial Stability published The Demographics of Wealth 2018 Series to explore the links between demographics and financial outcomes. In the second essay of that series, we considered the long-lasting wealth impacts of the Great Recession on young American families. In this chapter, we summarize and extend that work by taking a deeper dive into the short-term and long-term causes of the Millennial wealth gap.
Our research shows that the wealth of the typical Millennial, defined by the median household with half of families above and half below, is much lower than would be predicted based on the wealth accumulated by previous generations at the same ages. It is no wonder that many Millennial families feel burdened by debt, disillusioned by the eroding social contract, and frustrated that the promise of the American Dream and financial stability seem out of reach.
This chapter has four parts. Section I describes our findings in the Demographics of Wealth essay and the impact of the Great Recession on the Millennial wealth gap. Section II identifies two long-term causes of the gap: a secular wealth-redistribution trend from less-educated to more-educated families, and one from younger to older families. Section III discusses the racial wealth gap and the role it plays in the Millennial wealth gap. Section IV concludes with a review of competing scenarios: an optimistic one where Millennials eventually catch up and a pessimistic one where they become a lost generation in terms of wealth accumulation.
Widespread Wealth Losses from the Great Recession
In the past 30 years, the U.S. economy has suffered three recessions; each triggered by unchecked changes in the economy: the savings and loan crisis from 1990 to 1991; the dot-com bubble recession in 2001; and the subprime mortgage crisis or Great Recession from 2007 to 2009. From the beginning to the end of each of these recessions, median household income dropped.4 Net worth (i.e., wealth), however, fell much more steeply during the Great Recession than during the earlier recessions. See Figure 1.
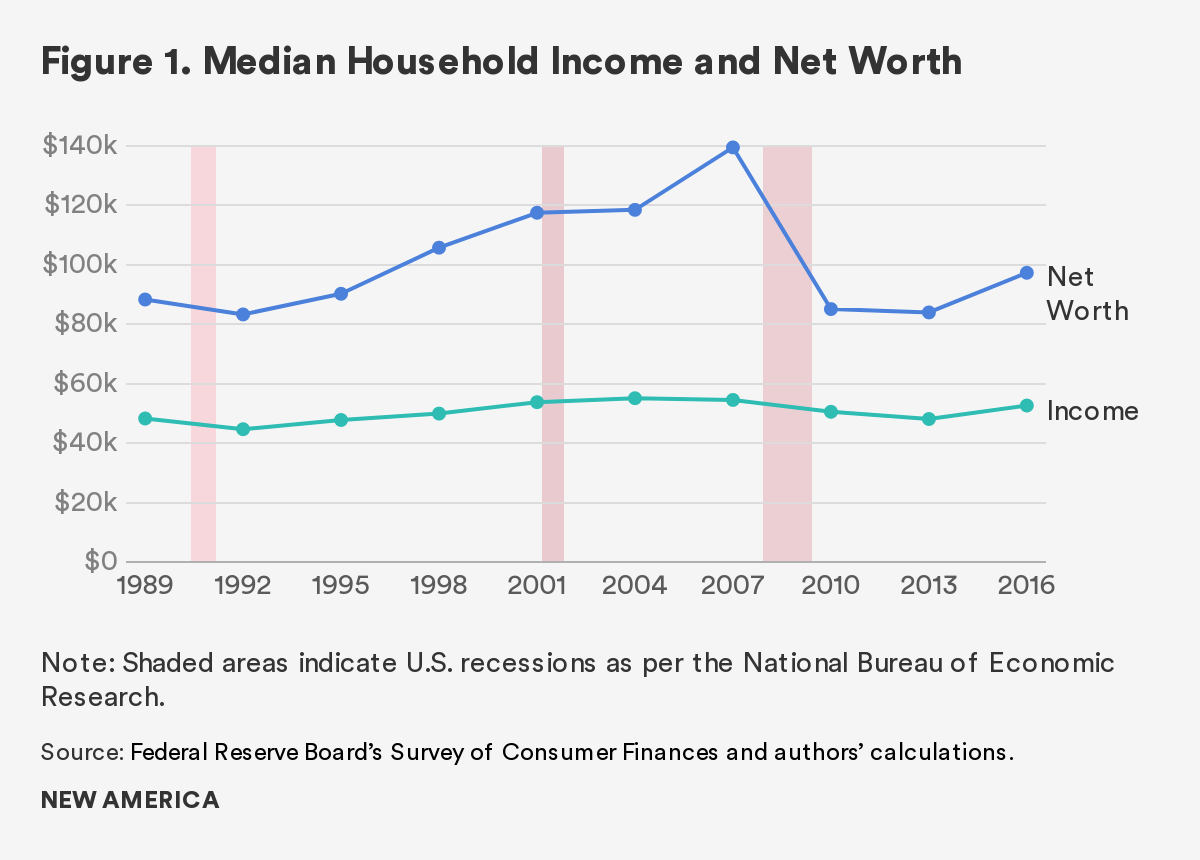
The data are clear that during the Great Recession, American families suffered widespread and deep income and wealth losses. However, younger families were hit particularly hard; they experienced greater financial damage in percentage terms than did retirement-age families. Younger families’ typical household income in 2016 was between 6 percent and 10 percent lower than that of similarly aged families in 2007, while older families’ income never fell below 2007 levels.
Even as wealth losses were widespread, younger families suffered more and have been slow to recover. As of 2016, younger families’ median net worth was between 27 percent and 37 percent below 2007 levels, while retirement-age families’ net worth was only 9 percent lower than similarly aged families.
Our analyses group families by the decade in which the family head was born. As generations span multiple birth decades with unique coming-of-age experiences, we believe this level of differentiation allows us to be more precise with our estimates and conclusions. Since the 1980s-born group is the youngest cohort that had fully reached adulthood by the start of the Great Recession (ages 18 to 27 in 2007), we consider the results of the 1980–1989 group to represent the experience of Millennials.
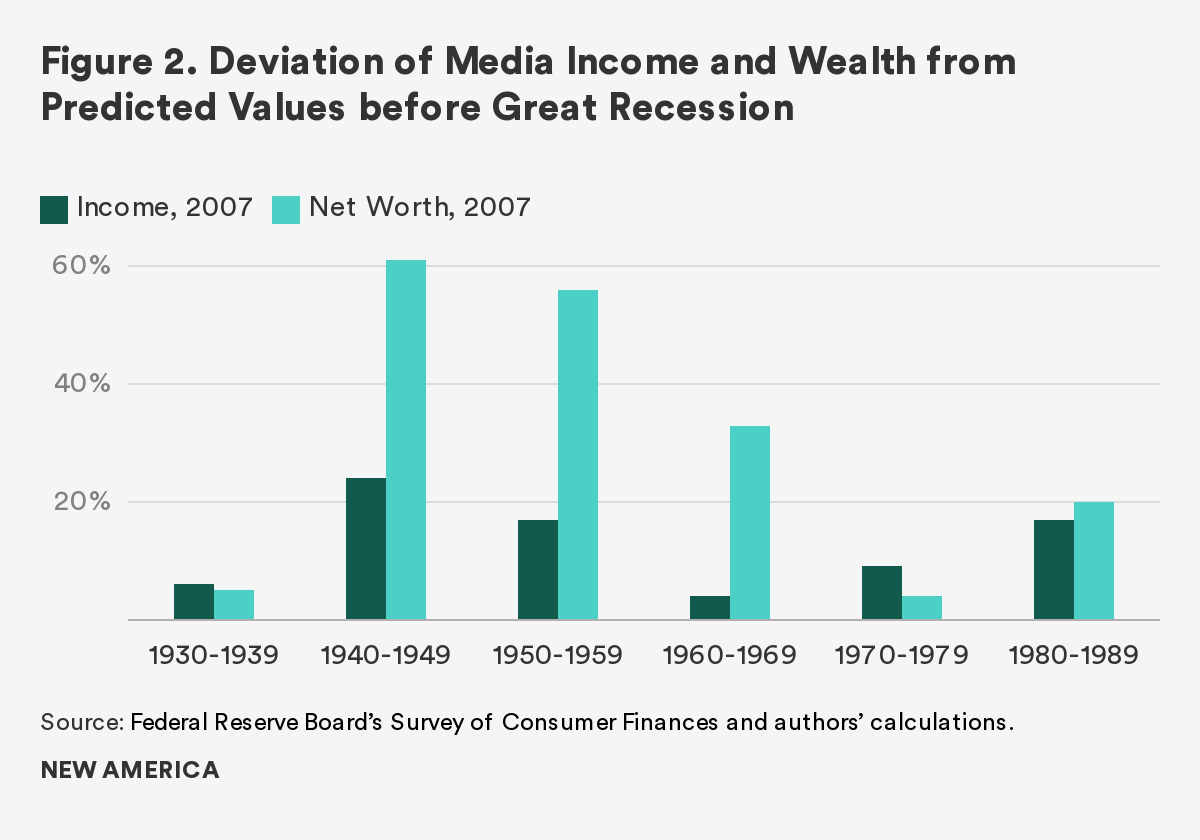
Using data from nearly 48,000 families in the triennial Survey of Consumer Finances between 1989 and 2016, we are able to estimate typical income and wealth building trajectories.5 These calculations allowed us to predict the amount of income or wealth a typical family could be expected to have at a given age.6 We are then able to compare actual values of income and wealth to the predicted values to describe relative gaps in earnings and accumulations. See Figures 2 and 3. If the typical family is doing better than we would expect based on all families, the bars are above zero; if they are doing worse, the bars fall below zero.
Income and wealth were relatively high for all families before the crash. See Figure 2. For example, the average Millennial (i.e., 1980s-born family head) was 24 in 2007. We would expect a typical 24-year-old to make about $28,6007 in income and have about $5,100 in wealth. Median 1980s Millennials were flying high, with income and wealth 17 percent and 20 percent above these predictions, at $33,300 and $6,100, respectively. Families whose heads were born in the 1940s, 1950s, and 1960s had wealth levels even farther above normal.
When the housing bubble burst with the onset of the Great Recession, the income and wealth advantages of each generation were also deflated. The typical Millennial family’s relative wealth standing plunged by 45 percentage points in comparison to 2007. See Figure 3. For all cohorts, wealth declined more sharply than income. In fact, in 2010, the year following the end of the recession, income had fallen below predictions only for the 1970s Gen-Xers and the 1980s Millennials.
Recovery between 2010 and 2016 is evident for most birth decades. Income recovered by an average of 15 percentage points while wealth recovered by 7 percentage points on average. However, gains were not shared equally. Older cohorts, measured by the typical family, fared better on both income and wealth recoveries.
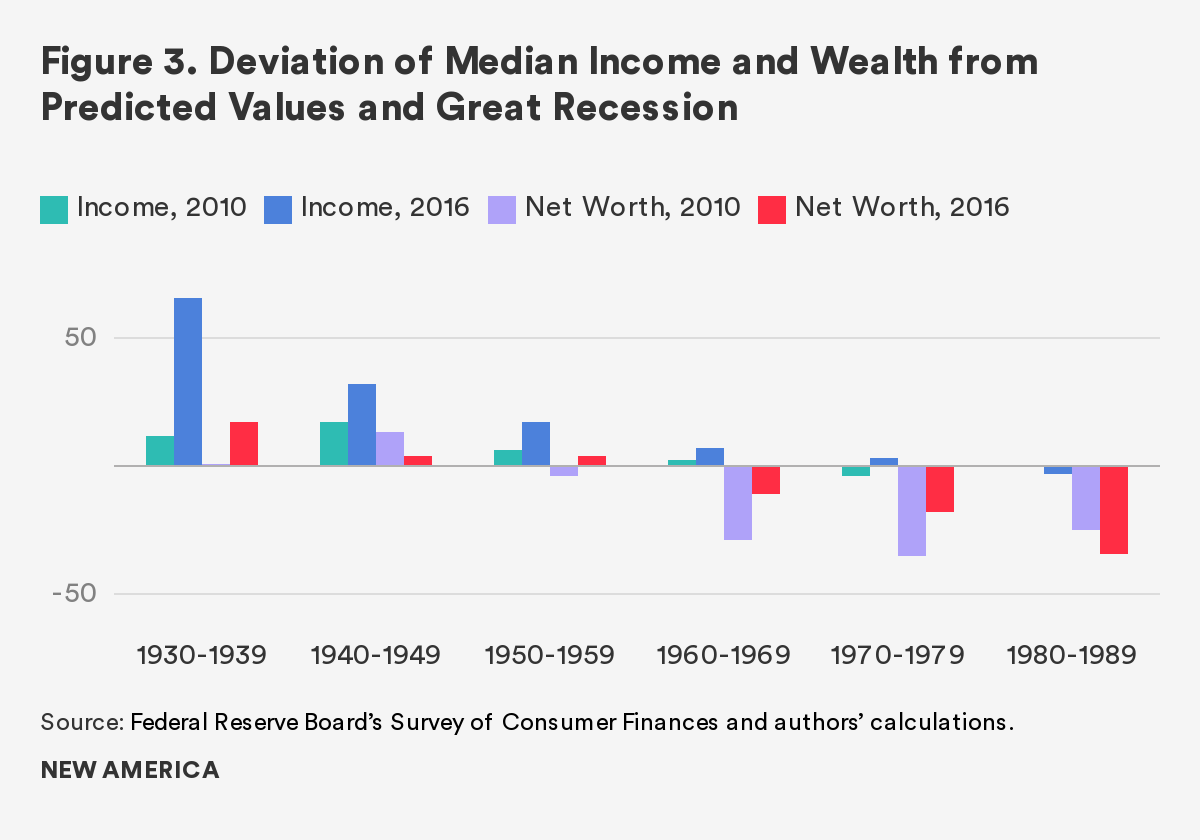
The 1980s Millennial group was the only cohort to fall below both income and wealth benchmarks in 2010 and then further behind in 2016. Income fell by 3 percentage points to -3 percent below predictions, and wealth fell by 9 percentage points to -34 percent below predictions. In 2016, the average 1980s-born Millennial family was 32, with an expected median income of $52,800 and an expected median wealth of $35,200. Instead, their actual median income was $51,200 and their actual median wealth was much lower: $23,200. This wealth shortfall of 34 percent is substantial.
Of course, many Millennials came of age during the unfavorable financial and economic conditions of the Great Recession. The 1980s-born group was economically vulnerable as they entered the labor force during a weak job market. Additionally, while asset prices—including stocks, bonds, and housing—had reached high levels relatively early in the recovery, many Millennials were not yet at an age where purchasing those types of assets is common. Long-term wealth accumulation may be difficult going forward in part because it is unlikely that asset appreciation will remain at these historical highs. These concerning trends call into question Millennials’ ability to recover in time to meet major financial life-goals, including buying a home, financing college education for their children, and saving and investing for retirement.
Wealth Redistribution Trends
The Great Recession amplified two long-term trends of wealth redistribution, which demand greater attention. First, the distribution of wealth has shifted from families with less than a four-year college degree to families with at least a bachelor’s degree (hereafter referred to as college grads).8 Second, wealth is also increasingly concentrated among older families, and younger families’ share has decreased.
Wealth Going to the More Educated
The belief that college leads to better financial outcomes is widespread and evident across a variety of disciplines.9 In fact, higher education is often touted as a solution to income and wealth inequality (but see Emmons et al. 2019 for a more nuanced discussion).10 The popularity of the belief that college is “worth it” is manifested in the rising share of U.S. families that are headed by terminal four-year college graduates and postgraduates. In 1989, a college graduate headed 15 percent of families and 9 percent were headed by postgraduates; by 2016, these figures respectively rose to 21 percent and 13 percent.
In fact, the 1980s Millennial group is the most educated decade we studied. College-grad Millennials made up 23 percent of the cohort in 2007. By 2016, their share had risen to 37 percent. College graduates have steeper income and wealth accumulation trajectories than do nongrads.11 Thus, it is instructive to look at four-year college grads and nongrads separately.
Using data from the Survey of Consumer Finances, we estimated new income and wealth predictions using all college grads and then using all nongrads (from 1989 to 2016). We then compared actual levels to predicted levels, keeping education consistent. Thus, for college-grad families the benchmarks are all college-grad families, and for nongrads the benchmarks are all nongrad families.
We found that college-grad Millennials were doing quite well prior to the recession. Both income and wealth were above the predictions, by 23 and 27 percent respectively. See Figure 4. The average Millennial college grad was 25 years old in 2007, with a median household income of $49,800 and a median household net worth of $11,800.
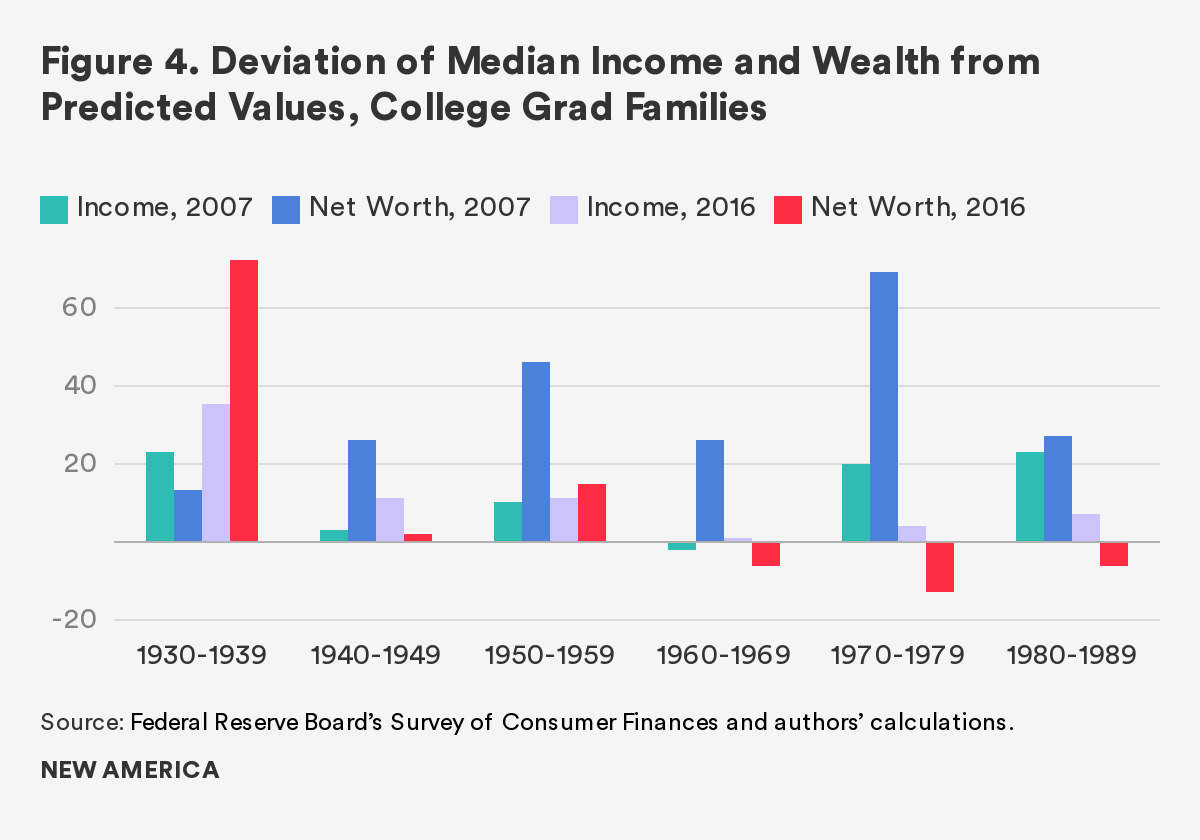
The recession depleted these advantages. Millennial income dropped 16 percentage points relative to the historical norm, though it stayed 7 percent above predictions. College grad Millennial wealth, on the other hand, was knocked down below predictions by 33 percentage points, to -6 percent. Millennial college grads were 31 years old on average in 2016, with an expected median income of $73,900 and expected net worth of $58,200. Instead, their income was $79,000, but their wealth was below predictions at $55,000.
Older college graduates were better able to weather the storm. Income did not fall below benchmarks and neither did wealth for the college grad groups born in the 1930s, ’40s, and ’50s. In fact, grads born in the 1930s and ’50s actually increased their wealth advantage relative to the historical norms between 2007 and 2016. While younger graduates born in the 1960s to 1980s had wealth levels lower than predicted, the effect of the Great Recession was tempered compared to the overall sample.
In contrast, Millennials with less than a four-year college degree fared much worse than did college-grad Millennials. These households were already at or below predicted levels in 2007. See Figure 5. Their median income was 4 percent above benchmarks set by all nongrad families, while their median wealth was 31 percent below. The average nongrad Millennial was 24 in 2007, with a median income of $29,500 and a median net worth of $5,200.
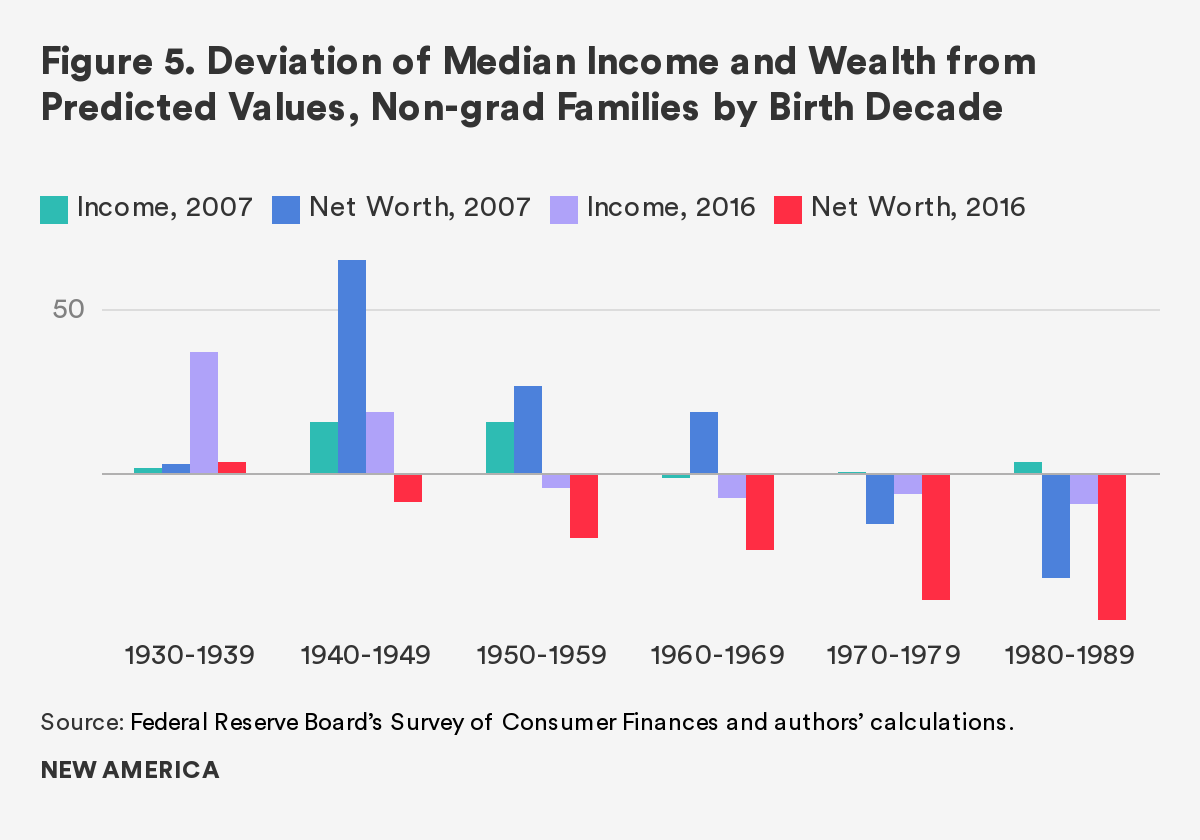
The Great Recession pushed nongrad Millennials back even further, and the most recent estimates for this group indicate that there has been no recovery. Their median household income dropped by 13 percentage points relative to the historical norm, from 4 percent above predicted values to -9 percent below, while their median household net worth, which was already -31 percent below predictions, dropped another 13 points to -44 percent below. The 1980s nongrad Millennials are the only group for which wealth has continued to drop further behind expectations each survey year after 2007.
Nongrad Millennials were 32 on average in 2016 with an expected income of $45,800 and expected wealth of $24,700. In reality, their median income was $41,700, and their median wealth was more than $10,000 lower, at $13,800. Considering that the average tuition and fees at public, four-year in-state colleges and universities was roughly $9,50012, this difference is very significant and may have long-lasting consequences for the wealth building potential of Millennial nongrads.
Wealth Going to Older Generations
The Great Recession also amplified an ongoing trend of wealth being redistributed from younger to older generations. Figure 6 shows that the generational wealth gap has been growing for many decades. In 2007, almost all of the age groups shown had a predicted wealth level higher than predicted levels for a same-age family in 1989. Yet the predicted wealth of those age 25 (born in 1982) was 11 percent below the predicted wealth of a 25-year-old in 1989. In contrast, the predicted wealth of a 75-year-old in 2007 was 84 percent higher than predicted for a 75-year-old in 1989.
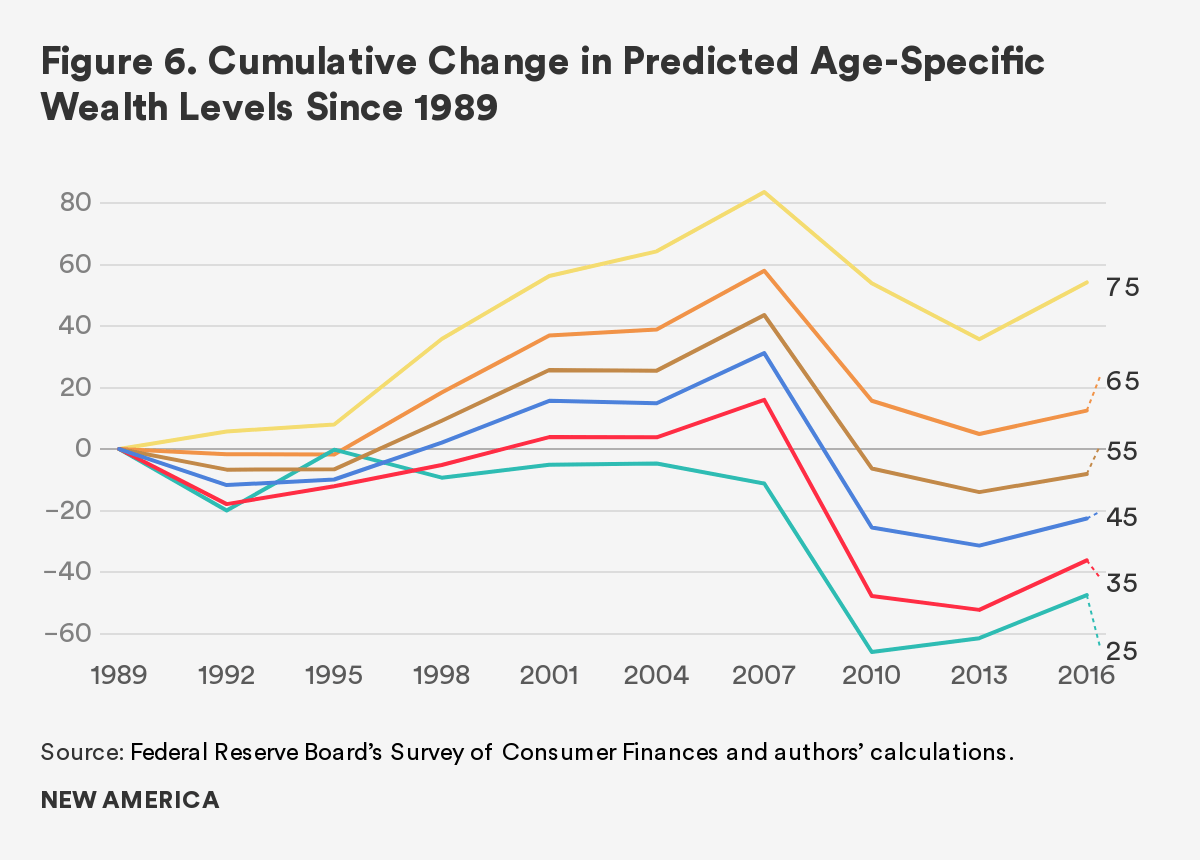
Even though the recession resulted in widespread wealth losses across the board, our findings show that younger families’ predicted wealth in 2016 was dramatically lower than a same-aged family in 1989. Older families have fared much better. While predicted wealth dropped from 2007 highs, it remained above that expected of same-aged older families in 1989.
In 2007, the predicted wealth of a family whose head was age 25 (born in 1982) was 11 percent below the predicted wealth of a 25-year-old family head in 1989. The predicted wealth of a 75-year-old family head was 84 percent higher than predicted for a 75-year-old in 1989. By 2016, the generational gap in predicted wealth had widened even further. The younger family was even further below 1989 levels (-47 percent) while older families’ predicted wealth remained significantly above 1989 levels (54 percent). Importantly, the generational wealth gap has also grown in absolute terms. The gap in predicted wealth between a 25- and a 75-year-old in 1989 was $152,600. By 2016, this gap had grown astronomically by nearly $100,000 to $248,700.
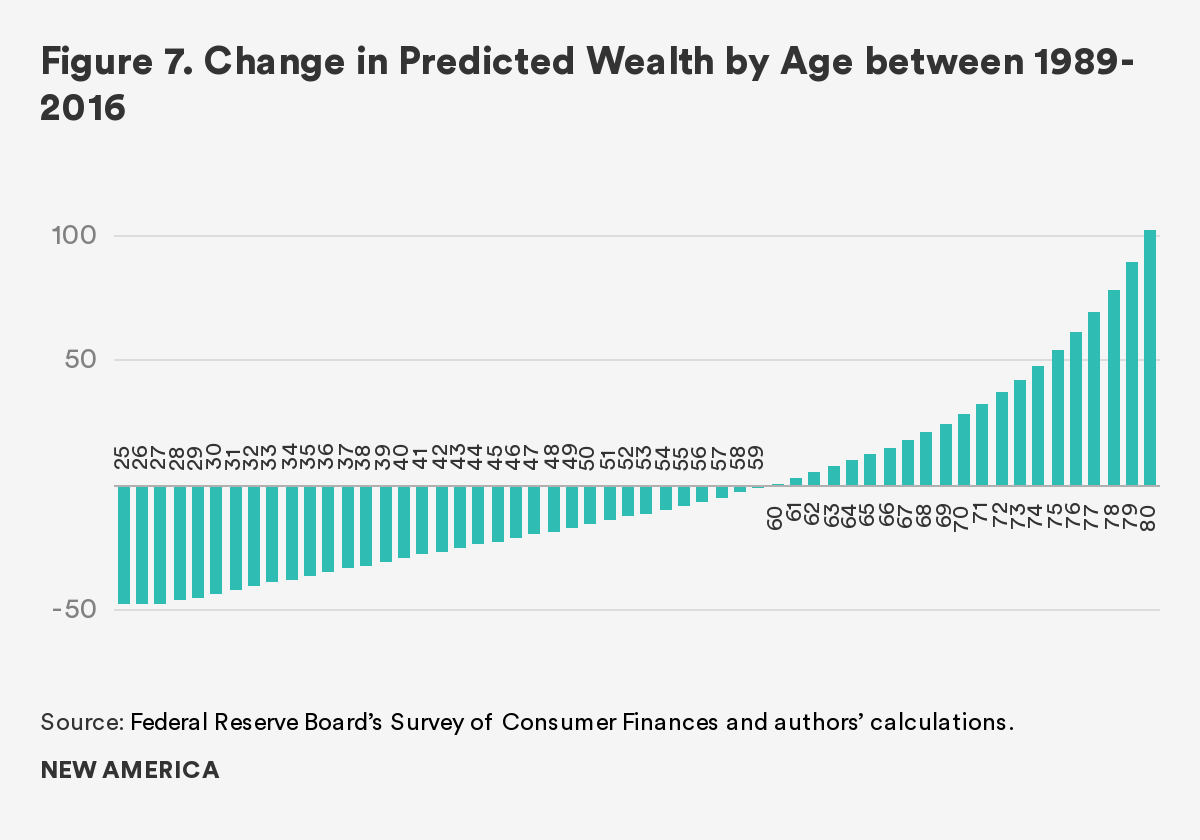
In the most basic terms, those near retirement age and older are predicted to have more wealth than their elders, while those younger have less. Age 60 appears to be a turning point. See Figure 7. The average age of a 1980s Millennial in 2016 was 32; their predicted wealth of $28,000 was 41 percent below a 32-year-old’s predicted wealth in 1989. For a 1950s-born Baby Boomer (average age 61 in 2016), their predicted wealth of $191,000 was 3 percent higher than a 61-year-old’s predicted wealth in 1989. Taken together, these findings show the extent to which the Great Recession helped to widen an already-growing generational wealth gap.
A Brief Discussion of Race/Ethnicity and the Millennial Wealth Gap
A compounding factor in the growing generational wealth gap is the role of race and ethnicity. Members of minority groups have historically had lower levels of income and wealth than non-Hispanic whites.13 The fact that Millennials are not reaching their expected financial potential may be related to their greater racial and ethnic diversity and the fact that predictions are based on all generations (the vast majority of whom are older and whiter).
Our analyses find that the 1980s Millennials are the most diverse group we studied. In 2016, 59 percent were non-Hispanic white, 17 percent were non-Hispanic black, 17 percent were Hispanic of any race, and the remainder were in a diverse catch-all group including Asians, American Indians, Alaskan Natives, Native Hawaiians, Pacific Islanders, other races, and those who identified with more than one race.14 Using these categories, we see how dramatic differences in wealth accumulation continue to persist, outpacing differences in income.
For example, non-Hispanic white15 Millennials had the highest median household income of all race/ethnicity groups at $60,800 in 2016. See Figure 8. Their income was 63 percent higher than that of black Millennials and 50 percent higher than that of Hispanic Millennials.
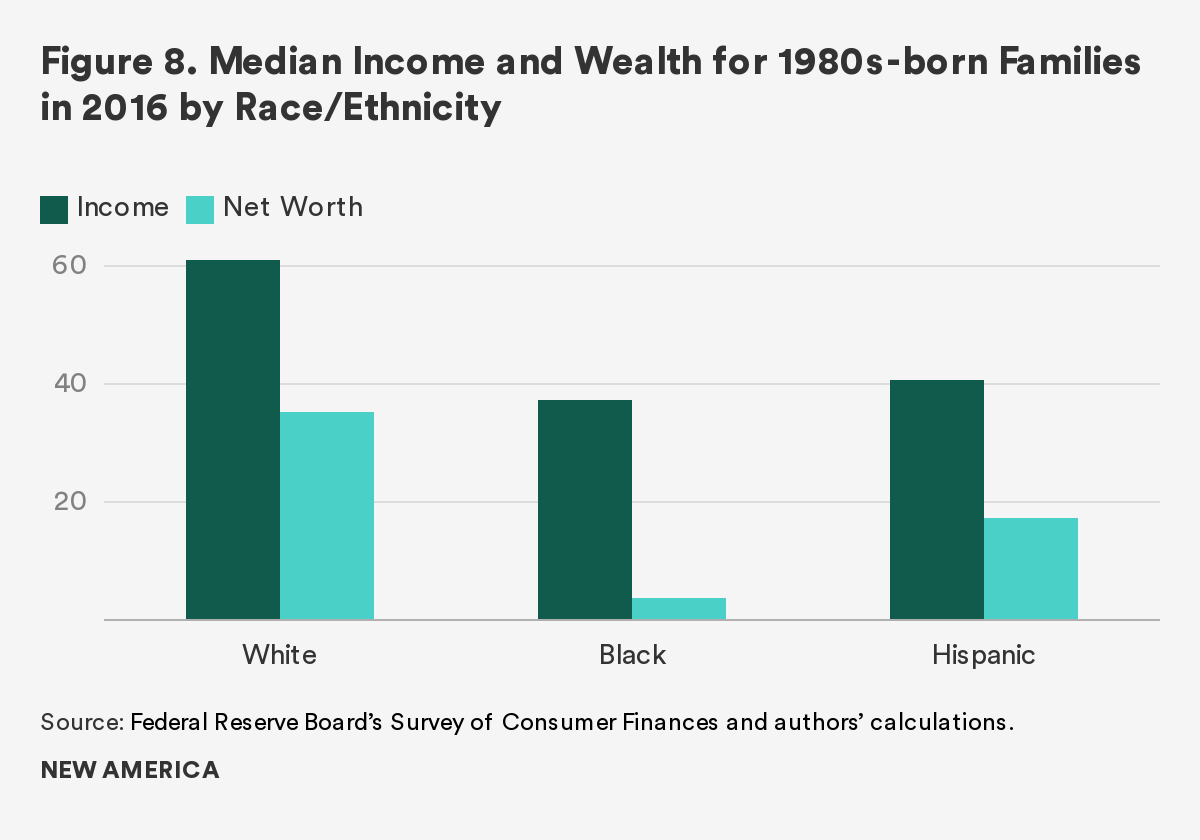
White Millennials’ wealth advantage was even more evident, especially as compared to non-Hispanic blacks. Black Millennials had 11 cents per every dollar of wealth owned by white Millennials. This gap is similar to the overall black/white wealth gap. The median wealth gap was smaller for Hispanic Millennials; they owned about 49 cents per every dollar owned by whites.
These trends are mirrored in the overall racial wealth gap, which is quite sizeable and has barely budged since 1989. The median wealth of black and Hispanic families has roughly doubled since that time, yet the gap is still more akin to a chasm. In 2016, the typical white family owned 10 times as much wealth as the typical black family and 7.5 times as much wealth as the typical Hispanic family.
A Lost Generation? Time Will Tell
These findings highlight the challenging path ahead for Millennials if they are to regain their footing and get on the type of trajectory of wealth accumulation required to catch up to previous generational cohorts. As wealth plays a fundamental role in the achievement of many financial life goals, the late start of the Millennial generation is troublesome and already having an impact on a variety of indicators, including delayed rates of homeownership, marriage, and child rearing.16
While the Millennial wealth gap is stark, a case can be made for optimism. Two key factors on the side of 1980s-born families are time and education. Millennial families have the majority of their working lives ahead of them, so there will be opportunities for greater earnings, savings, and investing—all of which can promote higher rates of wealth accumulation. The likely pinnacle of their income earning years is still some distance away, as is the time when their wealth is expected to peak.
Additionally, they are a very highly educated group, with nearly two out of five family heads having at least a four-year college degree. Given the strong association between education and wealth, it is possible that their income and wealth trajectories will pick up pace. If they do, Millennials may be able to catch up to and possibly surpass the benchmarks set by previous generations.
On the other hand, Millennials will have to overcome significant financial shortfalls to get back on track. For instance, with median wealth that is 34 percent below predictions, the scale of the deficit is particularly large. While Millennials do have many years left when they can be accumulating wealth, the rate of wealth accumulation is typically faster in percentage terms when people are younger.17 Additionally, the Millennial balance sheet is structurally different than that of previous generations. Their debt reflects lower frequency of mortgage debt and much higher borrowing rates of student loan debt.
While there should be no mistaking that the Millennial wealth gap is large and their predicament severe, the relative size of their cohort may help trigger a policy response. Already, many Millennials are moving into leadership positions and are increasingly able to stimulate change. In a number of key areas, Millennials are influencing social norms and fighting for social change, including addressing racial and ethnic wealth inequities.
The balance sheet perspective presented here highlights some promising areas for public policy. The burdensome nature of student loans and rising college costs in general underscore the potential impact of loan forgiveness and publicly subsidized higher education. Given that Millennials have had a difficult time attaining homeownership, due in part to a lack of affordable housing and inhibiting student debt, greater support (on par with incentives directed toward homeownership) for renting seems reasonable.18 These potential developments lend hope for the future, though only time will tell whether Millennials will recover, or if they will become part of a lost generation.
Citations
- Richard Fry. “Millennials Projected to Overtake Baby Boomers as America’s Largest Generation.” Pew Research Center. March 1, 2018. source
- Christie Smith and Stephanie Turner. “The Millennial Majority Is Transforming Your Culture.” Deloitte University report. 2017. source
- William R. Emmons, Ana H. Kent, and Lowell R. Ricketts. “A Lost Generation? Long-Lasting Wealth Impacts of the Great Recession on Young Families.” Demographics of Wealth 2018 Series, Number 2, May 2018. source
- See chart of Real Median Household Income of the United States. source
- See Appendix 2 in Emmons, Kent, and Ricketts (2018) for more information.
- We also removed the effect of survey year.
- Figures rounded to the nearest $100. All dollar amounts are expressed in 2016 dollars.
- We recognize that there are many two-year college graduates as well as individuals with certificate or technical degrees. We delineate at the four-year college degree because median wealth outcomes for those with less than a four-year degree but more than a high school degree parallel the median wealth of those with at most a high school degree. This trend has been consistent for many decades. See slide 15: source
- See Emmons, William R.; Kent, Ana. H.; and Ricketts, Lowell, R. “Is College Still Worth It? The New Calculus of Falling Returns,” Federal Reserve Bank of St. Louis, Working Paper, January 2019, for a more nuanced discussion. Our results in this paper suggest that college and postgraduate education may be failing some recent graduates as a financial investment.
- Lael Brainard, “Is the Middle Class within Reach for Middle-Income Families?” Federal Reserve Board, May 10, 2019. source
- Emmons et al., 2019.
- College Board. Trends in Higher Education: Published Prices. 2018. source
- William R. Emmons and Bryan J. Noeth. “Race, Ethnicity and Wealth,” Demographics of Wealth, Number 1, February 2015. source
- Due to sample-size constraints, we are unable to accurately explore the income and wealth outcomes of the catchall other-race group.
- Hereafter, non-Hispanic whites and non-Hispanic blacks are referred to as whites and blacks, respectively.
- Mark Carter. “The Economic Plight of Millennials,” Federal Reserve Bank of Atlanta Econ South, 2014. source
- For example, it is easier to double one’s wealth when the amount is small (say $500) than when it is large (e.g., $50,000). See Emmons, William R.; Kent, Ana. H.; and Ricketts, Lowell, R. “Is College Still Worth It? The New Calculus of Falling Returns,” Federal Reserve Bank of St. Louis, Working Paper, January 2019.
- Alvaro Mezza, Daniel Ringo, Shane Sherlund, and Kamila Sommer. “Student Loans and Homeownership,” Journal of Labor Economics, forthcoming.