
Table of Contents
- The Emerging Millennial Wealth Gap: Opening Note
- Building Ladders of Success for the Rising Millennial Generation: An Initiative Funded by the Citi Foundation
- Part 1: Generational Wealth and Financial Health
- Framing the Millennial Wealth Gap: Demographic Realities and Divergent Trajectories
- Trends, Origins, and Implications of the Millennial Wealth Gap
- The Millennial Racial Wealth Gap
- The Young and (Economically) Restless: The Nature of Work for American Millennials
- The Financial Lives of Millennials: Evidence from the U.S. Financial Health Pulse
- Part 2: Components of the Millennial Balance Sheet: Assets and Liabilities
- Wealth and the Credit Health of Young Millennials
- Millennials and Student Loans: Rising Debts and Disparities
- Young Adults and Consumer Debt: The Quiet Crisis Next Time
- Homeownership and Living Arrangements among Millennials: New Sources of Wealth Inequality and What to Do about It
- Part 3: Implications for Social Policy
- Public Policy Implications of the Millennial Wealth Gap
- Addressing the $1.5 Trillion in Federal Student Loan Debt
- Policy Responses to the Millennial Wealth Gap: Repairing the Balance Sheet and Creating New Pathways to Progress
Framing the Millennial Wealth Gap: Demographic Realities and Divergent Trajectories
Reid Cramer
The generational experience of Millennials is far from uniform and differences among them abound, but they do appear to be sharing a pervasive anxiety about their finances. As resources have become increasingly concentrated, economic divides in the country have grown rather than expectations of shared prosperity. Even though achieving economic security is often seen as a result of individual characteristics and behaviors, it is the performance of the overall economy, with its boom-and-bust business cycles, which ultimately creates the opportunity for financial success. Emblematic of the challenges facing young adults in America today is that—for a substantial majority of them—accumulating savings and wealth is turning out to be an elusive proposition.
Although there are regional and local variations in a national economy, macroeconomic trends produce conditions that everyone must navigate. How people respond to changes in the economy depends on a number of factors, including where they are in their life cycle. In this sense, a generational perspective is particularly useful in understanding how economic conditions have large-scale impacts over time.
By considering the demographic foundations, economic realities, and divergent trajectories that are shaping the Millennial generation, this chapter will frame the emerging generational wealth gap. The relative diversity of Millennials, described in the first section, is sowing the seeds for new type of generation gap—one that is fundamentally cultural but which will have economic implications. The second section focuses on the divergent experiences of Millennials in the economy, as reflected in the range of their financial profiles, socioeconomic outcomes, and changing milestones of adulthood that distinguish them from their generational predecessors. In this analysis, two factors loom large: the uneven impacts of the Great Recession and the enduring role of race and ethnicity. The third section offers a description of the most basic contours of the Millennial wealth gap, which is being driven by relatively flat incomes, low savings, decreased housing equity, and higher consumer debt and student loans as well as a widening racial wealth gap. Narrowing this gap and improving their economic prospects is likely to require a concerted policy response aimed at strengthening their generational balance sheet.
Demographic Realities of the Millennial Generation
Assessing the world through the perspective of generations is an analytical approach that has both inherent value and limitations. On the one hand, there are insights to be gleaned from discerning how people born about the same time and in the same place share characteristics and behaviors that shape their experiences. Just as cultures can be studied and compared by examining beliefs, practices, and customs, generational cohorts enable comparisons to contemporary or historic peers. On the other hand, a generational perspective fosters an imprecision, imposing arbitrary demarcations that collapse differences across the life course and force an aggregated analysis. Grouping people within large spans of time and assuming they share characteristics can be presumptuous—consider the differences in a single person’s outlook when they are in their early 20s from when they are in their mid-30s.
Still demographers have traditionally and successfully employed cohort analysis to study variations among geographies and communities, where there is an intermingling of effects related to a person’s age, the period of time when they live, and the variations among a group moving across time. Even though everyone in a society may experience a specific event, the impact of that experience on attitudes and behaviors may differ depending on a person’s age and place in the life cycle. At the generational level, comparing discrete age cohorts can reveal key distinctions in the links between experiences and outcomes.
Generational Cohorts Defined
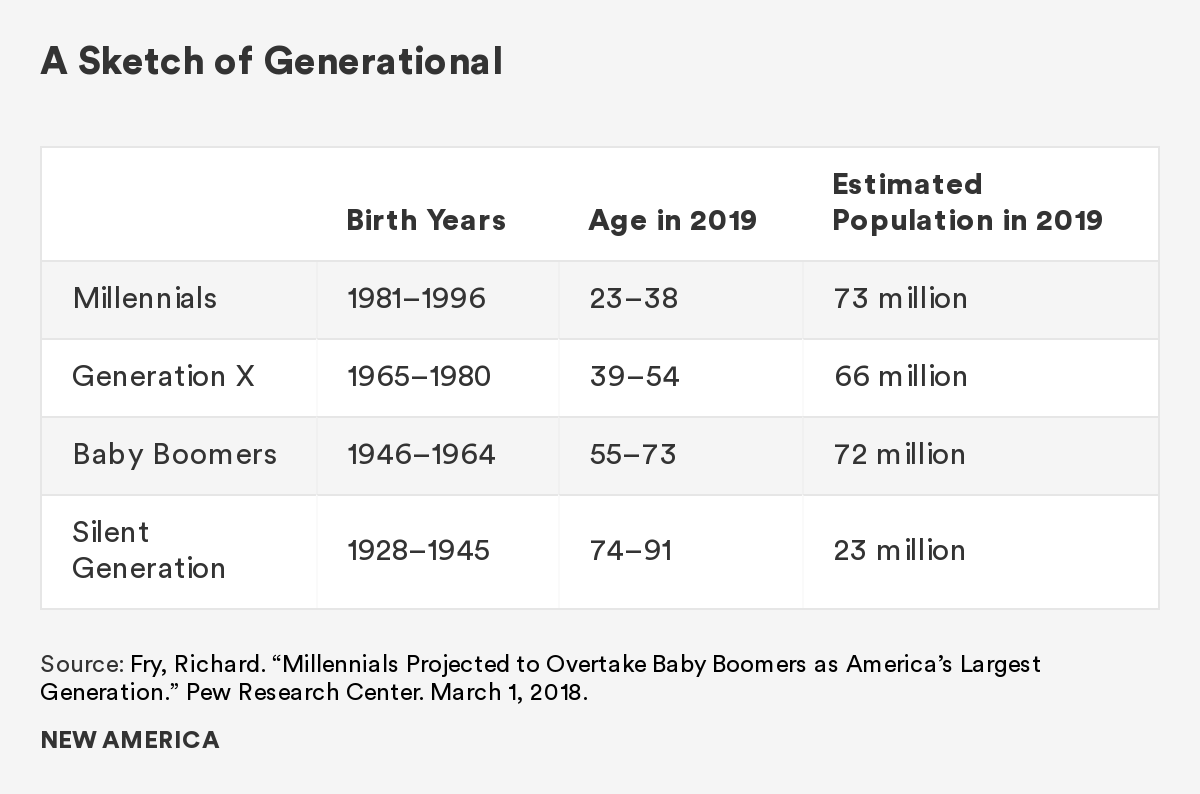
While generational labels have become ubiquitous in popular culture, they often are loosely applied. For instance, many different cutoff dates have been used to define the Millennial Generation, which variously have fallen between the years 1980 and 2000. The Pew Research Center, a leading source of generational analysis, recently called for a tightening of the Millennial span.1 Based on their assessment of demographic, labor market, attitudinal, and behavioral measures, they proposed a definition of all those born between 1981 and 1996. This means that as of 2019, Millennials are in their early 20s to late 30s, and they can be compared to Gen-Xers (ages 39–54), Baby Boomers (ages 55–73), and the Silent Generation (ages 74–91).
Using these generational labels, basic demographic realities for the United States—products of birth, death, and net migration—can be observed. The general outline of the country’s population pyramid reveals the unfolding dynamic between the large but aging Baby Boomer generation, born after World War II, the smaller number of Gen-Xers, and the increased number of births and immigrant arrivals that created the relatively large Millennial generation.
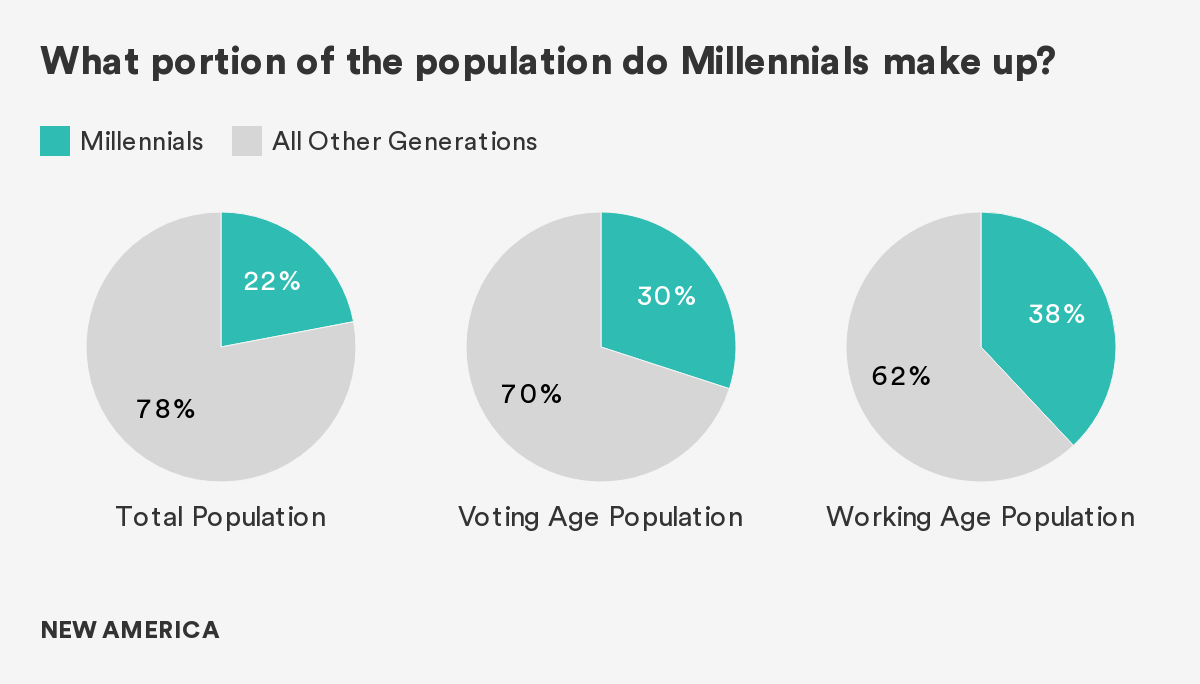
According to the U.S. Census Bureau’s projections, the population of the United States will surpass 328 million during 2019. Over 23 percent of Americans (over 73 million) will be between the ages of 22 and 38 in 2019.2 Recently exceeding the total number of Baby Boomers, Millennials already represent the nation’s largest living adult generation. Currently, Millennials are just over 30 percent of potential voters and are 38 percent of working-age adults; by 2025, they will constitute 75 percent of the workforce.3
While Boomers were more dominant at their peak (33 percent of the population in 1980), their numbers are projected to dwindle to 16.6 million by mid-century.4 In contrast, the influence of Millennials will only expand. Even though Millennials have recently become the largest cohort in absolute numbers, the country’s population will continue to age. This means that seniors are expected to account for much higher proportions of the overall population in the future than they did in the past.5 One implication of an aging population is the potential for a declining share of the population to be in the prime of working life. In 2010, the U.S. had 49 dependents per 100 working-age people; in 2050 that number is expected to rise to 66. As the child and middle-age populations in the U.S. are expected to increase at about the same pace, this increase is a result of the population’s aging.
Having fewer people in the workforce can slow economic growth, especially without increases in productivity. At the same time, more children and seniors may be depending on that shrinking workforce for support. This will have implications, as younger people work to fund the pensions and healthcare of the older generation. Regardless of how these tensions play out in national politics, the relative size of the Millennial generation, especially during their prime working years, is destined to exert a defining influence on the national economy and society.
Shared Experiences
Although individual preferences undoubtedly vary, Millennials do share a range of cultural, historic, and formative experiences that contribute to a generationally distinct worldview. These include early memories of traumatic national events, such as the Oklahoma City bombing in 1995 and Columbine school shooting in 1999, and political developments, such as the impeachment and acquittal of President Clinton in 1998, and the contested results of the presidential election of 2000.
Millennials were between 5 and 20 years old when the 9/11 terrorist attacks occurred, followed by the extended wars in Iraq and Afghanistan. Seven years later, Millennials were between 12 and 27 years old during the 2008 election campaign, when the force of the youth vote helped elect Barack Obama, the first Black president. Their adolescence and early adulthood were spent in the shadow of the Great Recession, with an economy wracked by job losses, business failures, and a slow recovery. The unexpected results of the 2016 election were relatively unpopular among Millennials, creating a new political landscape the entire country is continuing to navigate.

Beyond politics and events, Millennials have clearly been exposed to a dramatically different social landscape enabled by technological innovation and communication tools. The oldest of them came of age along with the internet and the proliferation of cell phones. The youngest have no memories of life before connectivity. Along with advances in telecommunications, many socioeconomic indicators improved. Violent crime in the U.S. fell sharply, as did smoking, drinking, and teen pregnancy. In many respects, the world became much safer. At the same time, there was a growing scientific consensus that environmental changes on a global scale, associated with the large-scale burning of fossil fuels, would increasingly become a source of disasters and displacement.
Millennial Diversity
While Millennials share cultural touchstones that distinguish them from older generations, broad generalizations about their preferences and behaviors will miss their diverse experiences. Indeed, the Millennial generation is defined by its diversity. Large waves of immigration to the U.S. in the 1980s and 1990s, coupled with the aging of the White population, have produced a rising share of new minority groups, particularly people with Hispanic and Asian origins.6 Today, 44 percent of Millennials identify as something other than non-Hispanic Caucasian, greatly exceeding the minority share of any of their predecessor generations.7 It is fair to conclude that Millennials are reordering the country’s race and ethnic composition, and serving as a bridge to a more diverse future.
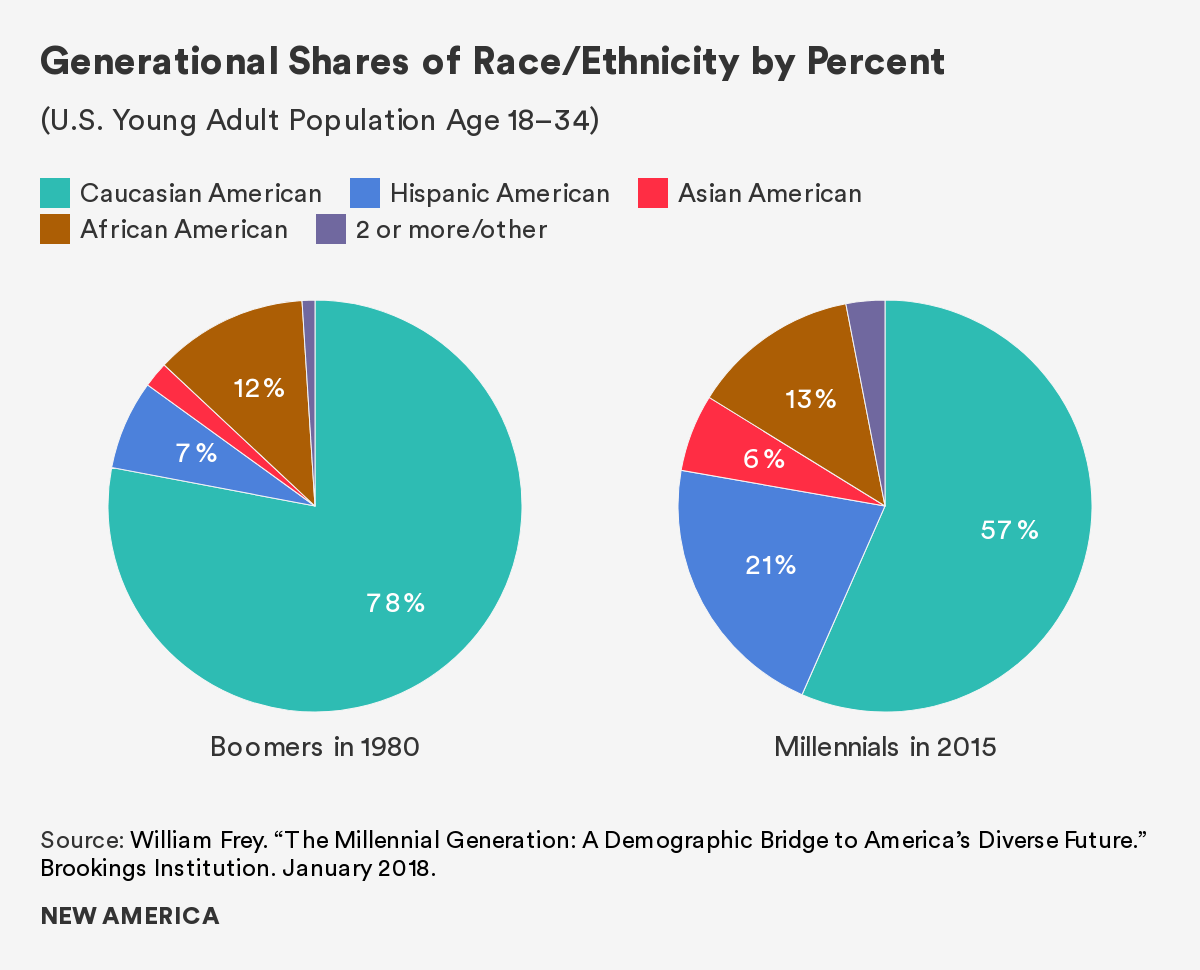
Although Americans of European origin remain the largest among racial and ethnic groups, they will soon no longer be a majority of the country. The Pew Research Center estimates that this will happen by 2055. Specifically, the Hispanic and Asian American slices of the population pie are dramatically increasing, predicted to triple over the next 40 years. While 9 percent of Boomers identify as Hispanic, 19 percent of Millennials identify as being of Hispanic (or Latinx) origin.8 Given current trends, the population of Asian Americans is expected to exceed the total population of African Americans by 2055.
These trends are making the Millennial generation more diverse than its predecessors in a number of respects—such as their country of family origin, languages spoken at home, and patterns of marriage and child rearing—all reflecting a wider range of experiences among the rising generation of Americans.
The experiences of Millennials from newer minority groups are particularly distinct, as both Asian American and Hispanic American Millennials are overwhelmingly made up of first- and second-generation Americans. Immigration by members of these and other groups has been both a primary driver of population growth in the U.S. and a source of diversity. In fact, the share of the U.S. population that is foreign born is among the highest in the world, approximately 14 percent today as compared to 5 percent in 1965.9 The 2015 Census Report predicts that the percentage of the U.S. population that is foreign-born will continue to increase, reaching 19 percent by 2060. More specifically, well over half of Asian American Millennials are foreign born, compared with 36 percent of Hispanic Americans, 10 percent of Blacks, and fewer than 4 percent of Whites. At home, the share of those speaking a language other than English has increased from 11 percent in 1980 to 25 percent in 2015. For Hispanic and Asian American Millennials, more than seven in 10 speak a language other than English with their families.
Since members of these ethnic groups tend to live in proximity, there is a geographic dimension to Millennial diversity. Racial and ethnic minorities make up more than half of the Millennial population in 10 states, including Texas, Arizona, Florida, Georgia, and New Jersey. In another 10 states, minorities account for more than 40 percent of Millennial residents (New York, Illinois, Virginia, and North and South Carolina). Only nine states are home to largely (over 80 percent) White Millennial populations, including Wyoming, Iowa, West Virginia, and Maine.
Given these demographic trends, the transition to a country with more racial and ethnic diversity will continue. Not only have immigrants added to the population generally, but their higher fertility rates are offsetting the steady declines in fertility among native-born women. Without the growth of Hispanic American children, the nation’s child population would have declined from 2000 to 2010.10 Beginning in 2011 and continuing through this year, the majority of babies born in the United States have parents who were traditionally identified as minorities.
Though 75 percent of older Americans—those over age 55—were White in 2015, this percentage drops to half for children under the age of 5.11This means that in only a few years, most children in the United States will likely identify as something other than White.
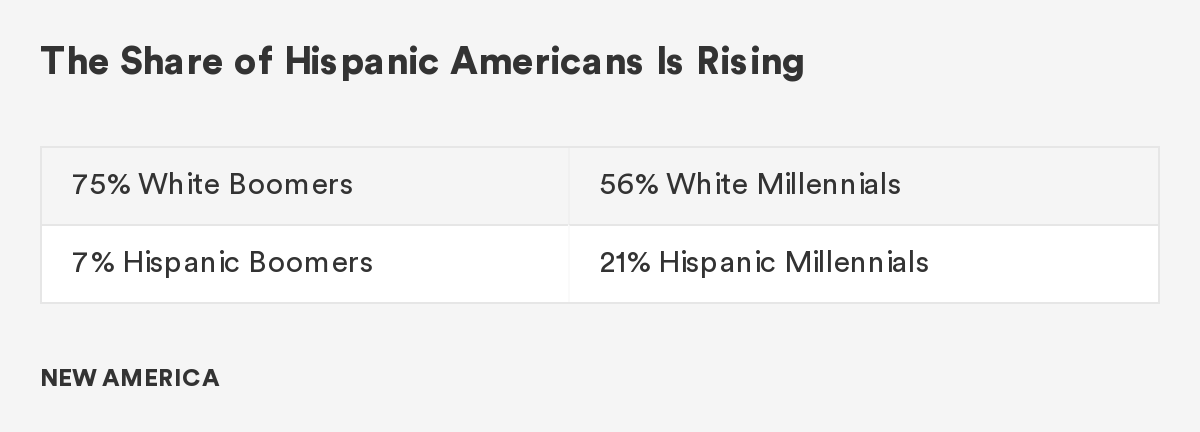
This change is reflected in the rising number of people in the country who identify as Hispanic American. While only 7 percent of Baby Boomers were of Hispanic origin, this has tripled to 21 percent of Millennials. The cultural experience is decidedly different, as most White Baby Boomers were born when immigration to America was historically low, and those who did arrive were mostly White Europeans. At that time, the country’s minority population was mostly African Americans, and there was widespread residential segregation. Today Millennials are heralding the arrival of a new national demography. In the near term, the working population will increasingly have more racial and ethnic diversity, while the nonworking will be overwhelmingly White Baby Boomers. This is creating what demographer William Frey has called a “cultural generation gap,” triggered by the transformation from the “mostly white baby-boom culture that dominated the nation during the last half of the 20th century to the more globalized, multiracial country that the United States is becoming.” With the growing share of racial and ethnic minorities among the young adult population, the country’s future diversity is foreshadowed. In the long term, this new demography will undermine generalizations, remake institutions, and change the country.
Divergent Experiences among the Millennial Generation
The Millennial generation is not monolithic. No generation is, but the combination of their unique demographic composition and the extended impact of the Great Recession have sparked a divergence from past trajectories. Transitioning to adulthood in the years following the financial crisis has had an impact on financial health, which in turn influenced behaviors and life choices that have become a source for many of the divergent experiences that have defined the Millennial generation.
Millennials in the New Socioeconomic Landscape
Initially the financial crisis eroded the value of a large set of assets, which collapsed the overall distribution of wealth. As the stock and real estate markets recovered, inequality rose as those with significant asset holdings did comparatively better, while the majority, and especially young adults, had to navigate a tough economy. For Millennials, entering the workforce immediately after the Great Recession has dramatically altered work and employment trajectories. The labor market consequences have been large, negative, and long lasting.12
In 2007, before the economic downturn, more than 50 percent of college graduates had a job offer lined up when they graduated; for the class of 2009, fewer than 20 percent did.13 The subsequent job losses and the slow recovery, reflected in an unemployment rate that stayed above 8 percent until 2013, have depressed incomes and undermined workforce attachment. Today, over half of the unemployed are young adults, greatly exceeding their share of the workforce. While the unemployment rates have come down in recent years, and currently are near historic lows, wages have barely increased and the labor force participation rate for those between the ages of 18 and 34 remains near its lowest level in four decades.14
Since the Great Recession, young people have experienced substantial declines in labor force participation, which was above 65 percent until 2000, and then dropped to 54.9 percent by 2014.15 These changes have been driven by two distinct dynamics. More young people choose to stay in school, complete high school, and pursue postsecondary education. As a result, Millennials are better educated and credentialed than their predecessors, and may be more skilled as they approach their prime working years. In 1960, only 11 percent of those aged 25 to 29 had a college degree; by 2015, this share had risen to 36 percent.16 Unfortunately, Millennials have had to pay dramatically more in tuition as the costs of going to college and graduate school have risen and access to loans has declined. At the same time, there were increases in the number of people not engaged in education, employment, or training who also had a high school degree. Incorporating people from this group into the future labor force may prove difficult.
These trends have translated to lower incomes generally for the Millennial cohort. In the aggregate, Millennials currently earn 20 percent less than Boomers did at the same stage of life, despite being better educated.17 Specifically, the median earnings today for 18- to 34-year-olds are lower than they were in 1980, and income flows are more volatile.18 Between 1970 and 2002, the probability that a working-age American would unexpectedly lose at least half her family income more than doubled.19 A rise in freelance and contract work associated with employers’ drive for flexibility has shortened employment tenure, weakened access to employee benefits, and contributed to an overall decline in income.
Poverty remains pervasive. Millennials were more likely to be living in poverty than Gen-Xers and Baby Boomers at similar ages, with one in five Millennials officially classified as poor.20 From 1979 to 2014, the poverty rate among young workers with only a high school diploma more than tripled to 22 percent.21 Beyond distinctions in educational attainment, race and ethnicity continue to be associated with large differences in economic outcomes.
Changing Milestones of Adulthood
Poor finances appear to be playing a role in redefining how Millennials mark reaching adulthood. Specifically, Millennials today are less likely to marry than their parents. When they do, they do so later. The median age for a first marriage today is about five years older than it was in the 1960s.22 Among young adults, cohabitation with a committed partner is increasingly common, rising to over 9 percent today from around 6 percent in 1997.23 In recent years, the social acceptance and legal sanction of same-sex marriages has created new opportunities for family formation, as has the rise in interracial marriage, which has increased from 5 percent in 1980 to 14 percent in 2015. Still, Millennials are less likely to form independent households; instead, more of them are opting to live with their parents, relatives, or other unrelated adults than previous generations.
Regardless of marital status, child rearing is on the decline. The overall birth rate hit a record low in 2018, dropping for the seventh straight year.24 Today’s fertility rate is 1.72 percent, significantly below the “replacement” rate of 2.1 percent. Only 29 percent of women ages 18 to 29 have ever had children, down from 41 percent in 1998.25 Some of these declines may be attributed to trends that began before the Great Recession took hold, including the rise in women’s labor force participation and pursuit of higher education, along with greater access to birth control and fewer teen pregnancies.
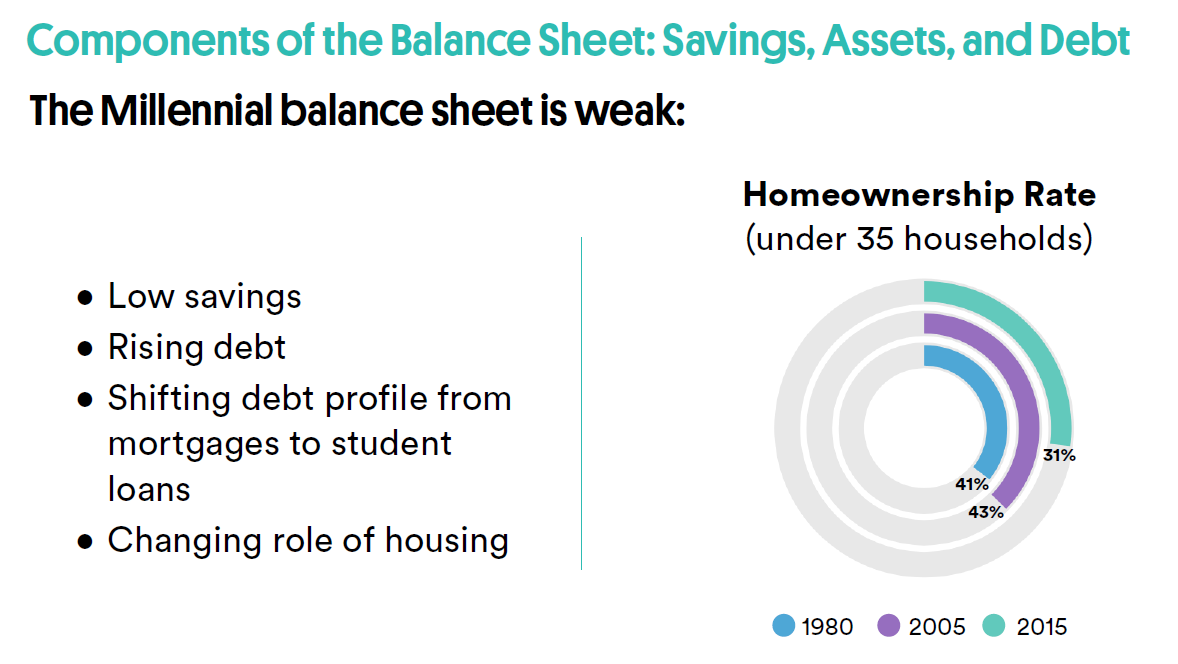
Along with fewer children, marriages, and independent households, fewer Millennials have become homeowners compared to previous generations at the same age. While the homeownership rate peaked at 47 percent in 2005, it fell to 37 percent by 2015. In addition to changing preferences, the severity of this decline likely reflects the increased difficulty in saving for a down payment or qualifying for a mortgage loan, which became progressively harder in the years following the financial crisis.
These trends in marriage, children, and home purchase—previously key features of the American Dream—provide hints at the new economic realities that are complicating how young people assemble the traditional building blocks of success. The divergent outcomes experienced by Millennials have made financial security its own aspiration.
Diverse Outcomes among Communities of Color
To acknowledge the diversity of the Millennial generation is to acknowledge that the experiences of Millennials of color are particularly distinct—and perilous. Specifically, Millennials of color are faring decidedly worse than many White and Asian American Millennials on a number of socioeconomic measures, such as educational attainment, employment levels, household income, and homeownership rates.26
While the economy and employment levels have gained ground in recent years since the post-recession lows, poverty levels for African Americans and Hispanic Millennials, aged 25–34, are 24 percent and 21 percent respectively, far outpacing the 11 percent poverty rate for White Millennials.27 Among Millennials of color, unemployment rates are substantially higher, as is involvement with the criminal justice system.
Given the range of these socioeconomic outcomes, race and ethnicity should be included as an essential component of any generational analysis. Taking a closer look at the impact of race and ethnicity on a person’s financial profile reveals clear disparities in some of the fundamental components that make up a person’s balance sheet, such as amount of savings, homeownership status, and debt levels. These analyses offer an opportunity to break down simplistic explanations of universal experience and increase our understanding of the diverse variables contributing to the emerging Millennial wealth gap.
The Emerging Millennial Wealth Gap
The most recent findings from the Federal Reserve Board’s Survey of Consumer Finances confirm that the wealth holdings of young adults in America today have fallen dramatically below historic trajectories. The accumulated wealth of Millennials has failed to match previous generations of young adults and significantly lags behind older households. Digging deeper into the data reveals several other significant factors, namely the influential experience of the Great Recession, a new dynamic between wealth and age, the continued role of homeownership, and the enduring and expanded racial wealth gap.
The Impact of the Great Recession
From a variety of perspectives, it is clear that the Great Recession was responsible for dramatic declines in wealth that were broadly experienced. Regardless of household characteristics, such as income, race, and ethnicity, and educational attainment, families lost net worth with the onset of the economic downturn. Although the recession began in 2007 and officially lasted only until 2009, the wealth of a typical family was 30 percent lower in 2016 ($97,300) than it was in 2007 ($139,000), when measured in constant dollars.28
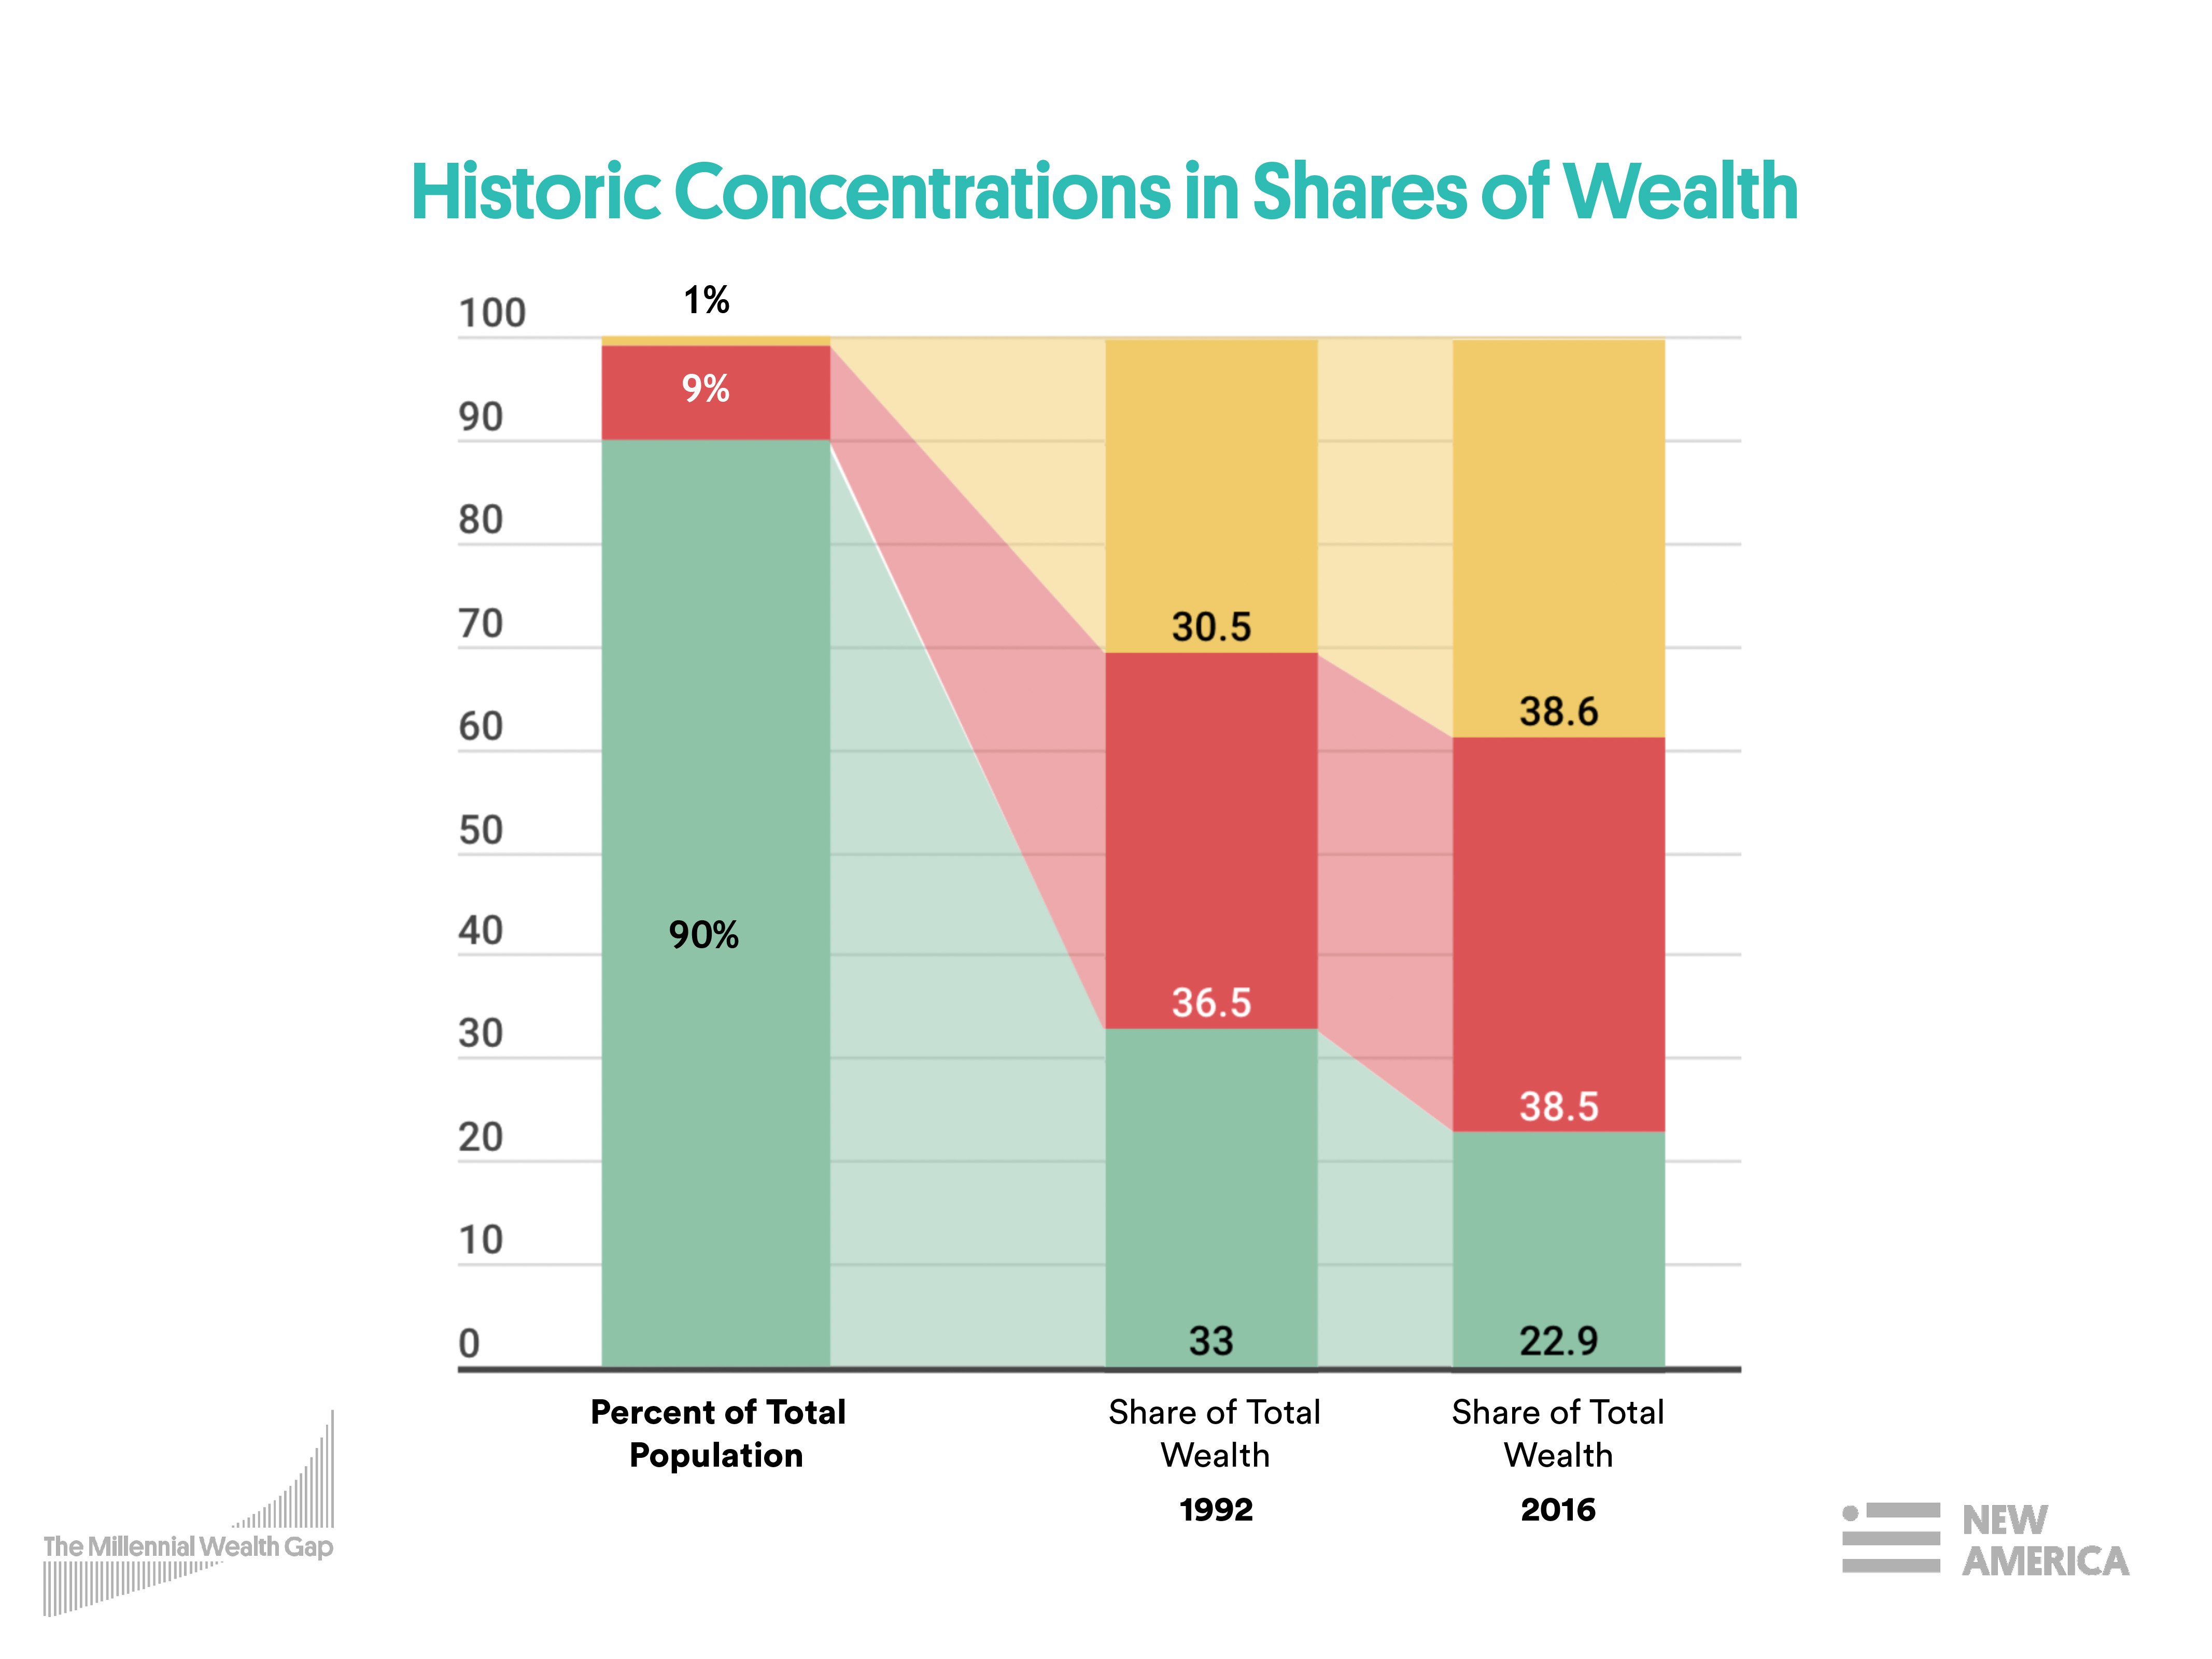
Even as the economy steadily added back jobs lost, the protracted recovery was experienced unevenly, with well-off households doing better at the expense of others. According to economists at the Federal Reserve, the concentration of “shares of income and wealth held by affluent families have reached historically high levels.”29 This is particularly apparent when looking at the top 10 percent of households, as ranked by both income and wealth.30
Ranked by income, the top 10 percent received 50 percent of the country’s total income. In 1992, this figure was 38 percent. During the same period, the top 1 percent of income earners have fared even better, doubling their share. They garnered 24 percent of total income in 2016, up from 12 percent in 1992. Ranked by wealth, the richest 10 percent held over 77 percent of wealth, while the richest 1 percent of households owned almost 40 percent of the nation’s wealth in 2016. In 1992, it was 30 percent. Conversely, the wealth share of the bottom 90 percent of families has been falling over the past 25 years, dropping from 33 percent in 1989 to 23 percent in 2016.
Divergent Fortunes of the Young and the Old
Beyond these levels of concentration at the top, a snapshot of the wealth distribution as grouped by age offers an indication of a new life cycle pattern for the typical family. While there remains evidence of increasing assets as a head of household ages through their mid-30s to mid-50s, median wealth has continued to grow for households aged 75 and older, and it has done so at a higher rate. This is remarkable, since it counters the expectation that these households will begin to draw down on their wealth as they leave the workforce and their incomes decline.
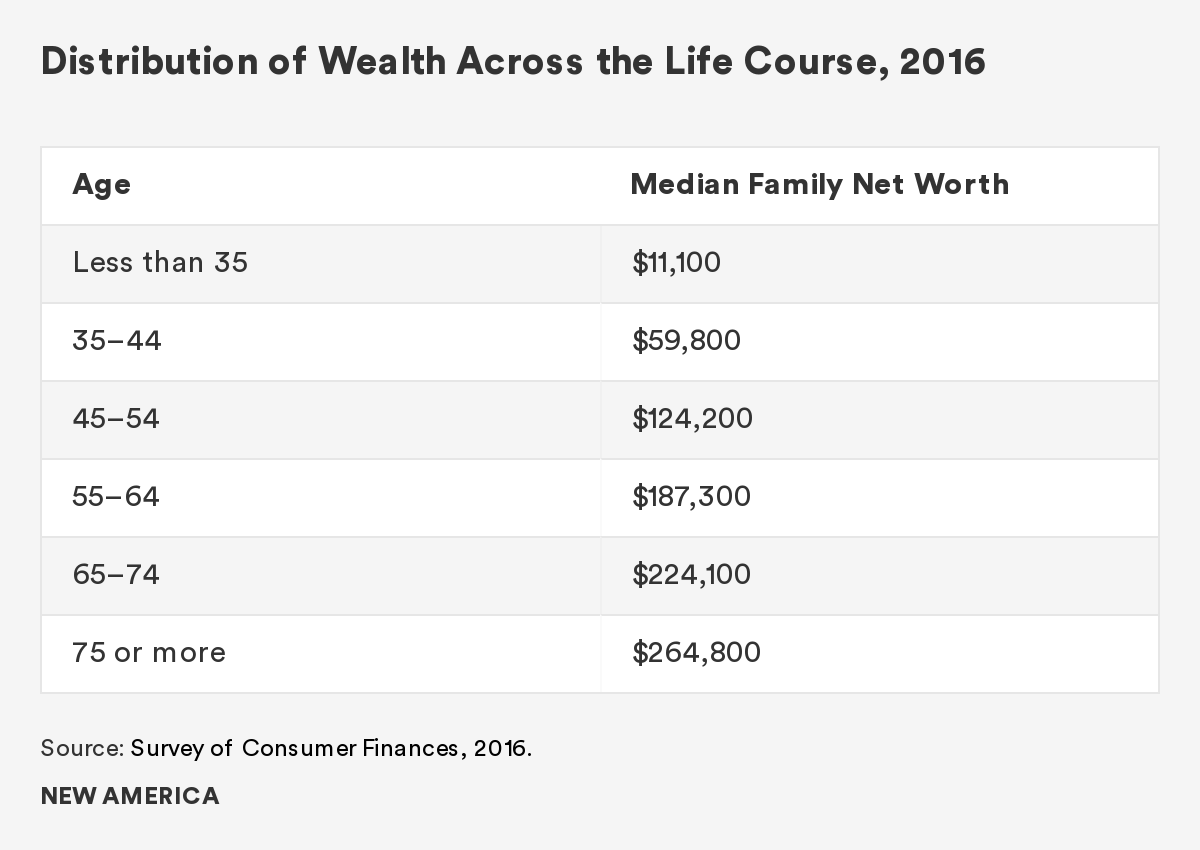
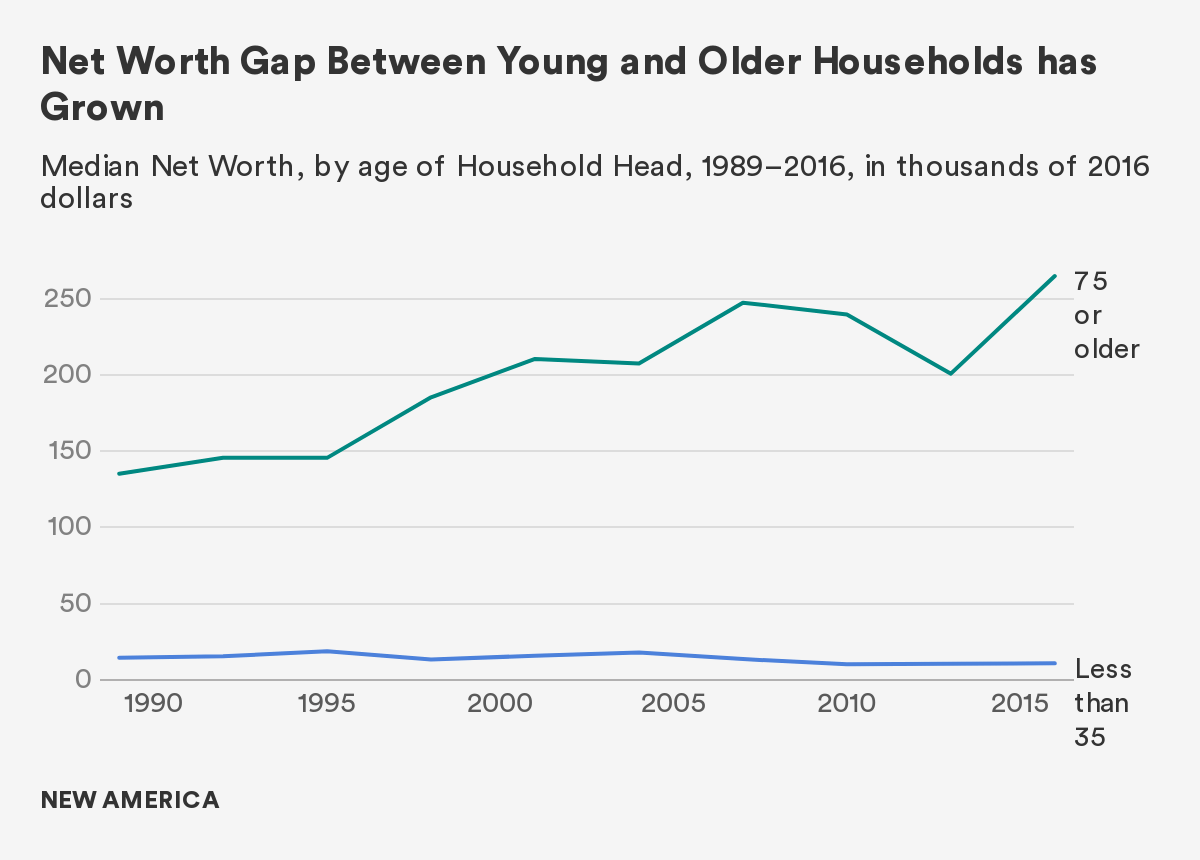
While the net worth for all households has increased by 16 percent from 2013 to 2016, young families haven’t fared as well. The median net worth for families headed by a person under the age of 35 is $10,900, which is a 2 percent rise over the previous three years but still $8,000 less than it was in 1995, a 41 percent decline (in 2016 dollars).31 In contrast, households over age 75 have seen their wealth dramatically rebound, rising 32 percent in the last three years to $264,000.32
For families headed by an individual under the age of 35, net worth was 41 percent lower in 2016 than 1995. In contrast, households headed by someone over age 75 have seen their wealth rise. The recent growth of net worth among older households has been especially pronounced. It has increased 32 percent from 2013 to 2016, reflecting new growth in the generational wealth gap.
In their analysis of the historic links between birth year and wealth, economists from the Center for Household Financial Stability at the Federal Reserve Bank of St. Louis identified the amount of wealth we would expect a family to own at each age. They found that typical families headed by someone born in the 1960s, 1970s, and 1980s were “significantly below their wealth benchmarks in 2016.”33 More specifically, the 32-year-old cohort remained 34 percent below predicted levels in 2016. Alternatively, families headed by someone older (cohorts born in the ’50s, ’40s, and ’30s) were significantly above their age-specific targets.34
Another indication of trouble for Millennials revealed by their analysis is that the typical 32-year-old lost further ground between 2010 and 2016, a period of generally rising asset values in the stock and housing markets, while older cohorts saw their balance sheets strengthen. This leads them to conclude that while all age groups lost wealth after the Great Recession, younger families suffered the steepest losses, and are regaining lost ground more slowly.35 Since these younger families are entering or are in their prime earning years, this raises the question of whether they will be able to get back on track or risk becoming a “lost generation” in terms of wealth accumulation.
Rising Debt but Declining Homeownership
Rather than wealth, Millennials are accumulating debt. Not only does the typical Millennial have higher debt relative to both their income and their assets than any other previous generation at the same age, but their debt profile is distinct. In previous generations, starting families and forming households was associated with buying homes and taking out a mortgage. For Millennials, other forms of debt have replaced mortgage debt, including student loans, car loans, and credit card debt. These types of consumer debt cannot be used to finance the purchase of assets, like homes, that can appreciate in value. While there are advantages to investing in human capital development, student loans cannot be leveraged directly to boost wealth on the balance sheet.
Over time, it may turn out that Millennials will benefit from responding to the recession by staying in school and pursuing more postsecondary degrees. They are clearly better educated and credentialed than earlier generations. However, this debt and delayed earnings have created a weak generational balance sheet and prevented more of them from the experience of homeownership, which is one of the most significant predictors of future wealth building.
The declines in homeownership may be especially consequential, in that they could pose an enduring challenge for Millennials’ wealth building. This is because for those families that do accumulate significant wealth holding, owning a home is often the largest asset on the family balance sheet—so much so that it is relatively uncommon for renters to accumulate even average amounts of wealth. While the typical homeowner had a net worth of $231,400 in 2016, the typical renter had a net worth of $5,200, making this single variable among the most significant in explaining different wealth trajectories among American households.
The disparity in wealth holdings among renters and homeowners should prompt a series of policy questions—e.g., what are the current impediments to homeownership? Are there alternative leverage opportunities besides housing to build wealth? How has historic discrimination against race and ethnicity groups historically cut off avenues to wealth building,s and what should be done about it now?
This last question is especially pertinent because homeownership rates vary significantly by race and ethnicity. As of 2016, homeownership rates ranged from approximately 45 percent for Black and Hispanic families to 73 percent for White families. Among those who do own their homes, White families have more housing equity ($215,800), compared to Hispanic families ($129,800) or Black families ($94,400).36 The racial wealth gap has been an enduring feature of American society, and with the increasing diversity of the rising generations, it is one of the primary drivers of the emerging Millennial wealth gap.
While subsequent chapters in this book will present a deeper analysis of both Millennial debt and declines in home purchases, the main point here is that these trends reflect the extent to which Millennials are in a fundamentally different economic “place” than previous generations. They are on a lower trajectory of asset building.
The Racial Wealth Gap
Describing the racial wealth gap with numbers on a balance sheet doesn’t do justice to the historic legacy of slavery and the entire African American experience. The history is brutal. Nor does it capture the experiences of the native people of the Americas, or those of the immigrant families of non-European origins who came to America from across the globe. Still, using the tools and categories of social science and economics to aggregate and broadly compare experiences among racial and ethnic groups in America is dramatically revealing. The racial wealth gap is a chasm, with roots at the core of American history, culture, and economy.
Throughout the country’s past, the traditional paths to wealth building—land, higher education, access to credit, and homeownership—have been systematically denied to African-Americans and other non-White persons. Even when wealth and resources have been accrued, they have also been systematically stripped through land theft and lynching. Disparities in wealth among race and ethnic groups in the U.S. are, simply put, enormous. It is this historic racial wealth gap, with its devastating consequences, that is compounding the emergence of the Millennial wealth gap launched by the Great Recession.
The most recent available data from the Federal Reserve’s Survey of Consumer Finances shows that in 2016 the median net worth of non-Hispanic White households was $171,000, almost 10 times the net worth of Black families ($17,600) and over eight times the net worth of Hispanic households ($20,700).37 For all race and ethnicity groups, the mean is substantially higher than the median, which reflects the concentration of wealth among the wealthiest in each category.
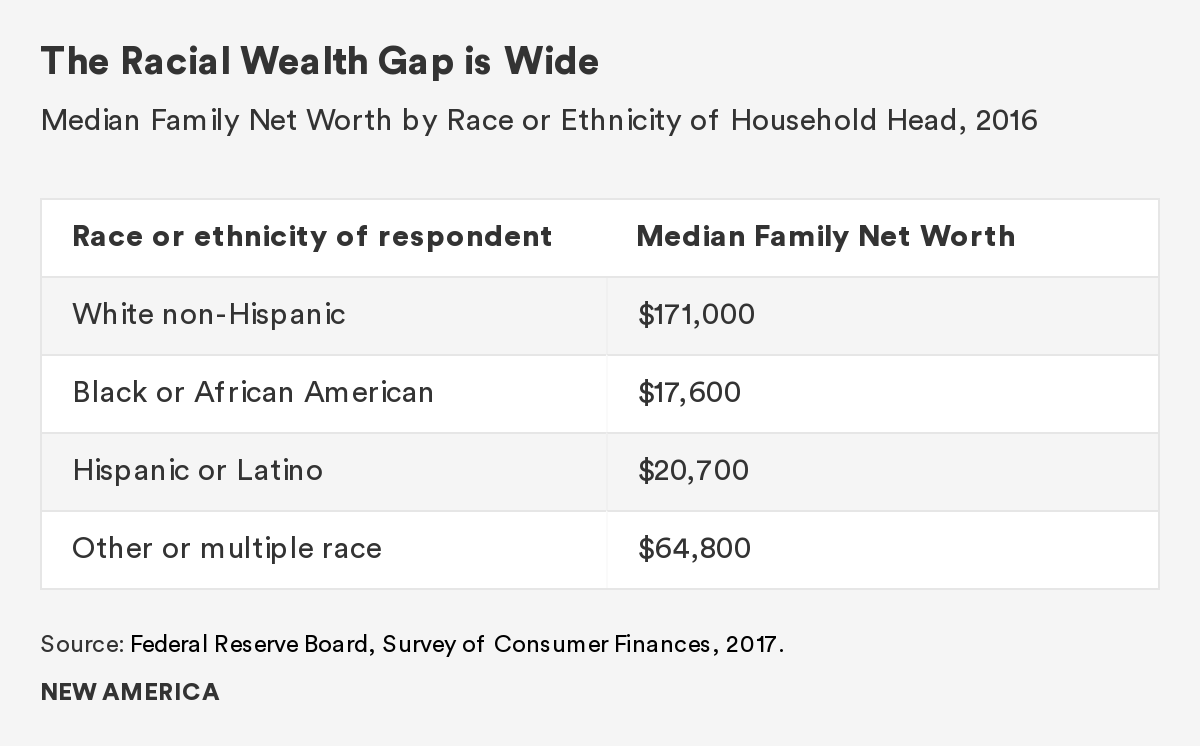
The racial wealth gap in 2016 is larger than it was in the early 2000s, when the average non-Hispanic White household had “only” six to seven times the wealth of the average African American household.
Looking exclusively at “median” or “average” figures masks variation. Although most families do have some wealth, some have zero or negative wealth (where debts exceed assets). These shares vary by race/ethnicity. Almost 20 percent of Black households and 15 percent of Hispanic households had zero or negative net worth, compared with 9 percent for White households.38
These outcomes cannot be viewed in isolation from the history of race in America. To take one example, housing, the earliest federal homeownership programs that began in the 1930s prevented minorities from accessing mortgage financing that enabled White families to build their wealth through housing equity. The Fair Housing Act of 1968, passed in the days following the assassination of Martin Luther King, Jr., made this discrimination illegal, and modest gains in homeownership for families of color eventually followed. Unfortunately, less attention was paid to policing the financial services marketplace, which allowed predatory lending practices and poor mortgage underwriting to spread without oversight.
As the housing market collapsed with the advent of the Great Recession, Black homeownership rates fell more than non-Hispanic Whites’, and their houses lost more value. In 2017, homeownership for Black American households was 28 percent lower than it was for non-Hispanic Whites, and many of the gains in Black homeownership since the Fair Housing Act was passed have been erased.39
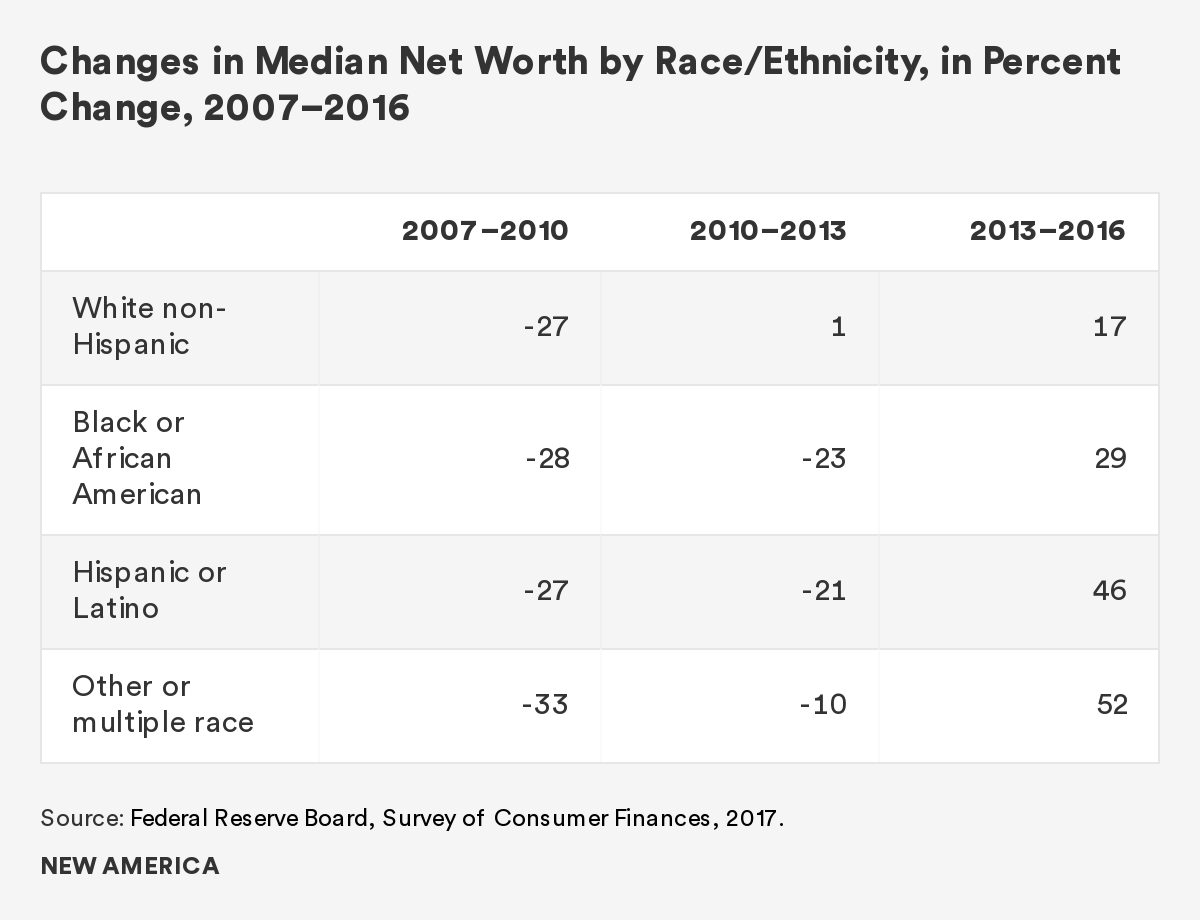
Not only did the Great Recession wipe out gains that had been made by communities of color in terms of their collective wealth holdings, but also for many minority families it has been harder to navigate the aftermath. While all groups lost net worth after the Great Recession, White families began to recover between 2010 and 2013, while minority families continued to experience net worth declines. It took until the 2013–16 period for all groups to experience gains. In fact, minority groups outpaced gains by White families over this period, but their delayed recovery reflects another source of inequality.
Additionally, declines in homeownership have been most pronounced for younger Black households. According to the Urban Institute, the homeownership rate for families headed by Black Americans between the ages of 35 and 44 fell from 45 percent in 1990 to 33 percent in 2015, lower than the Black homeownership rate in 1960.40 On top of that, in recent years, only 22 percent of younger Black Americans aged 24 to 34 were homeowners.41
Beyond homeownership, there are many variables that appear to influence wealth accumulation, which also vary by race and ethnicity. For example, 60 percent of White families own a retirement security account, while only 34 percent of Black families and 30 percent of Hispanic families do.42 Additional factors that vary by race and ethnicity are family formation, postsecondary education, and intergenerational transfers of money through inheritance and gifts during life. Twenty-six percent of White families report having received an inheritance, compared with 10 percent of Black and Hispanic families.43 Clearly, the historic legacy of slavery and sanctioned discrimination has undermined the ability of communities of color to build wealth and pass it along intergenerationally.
While the racial wealth gap is a long-standing feature of American society that impacts the current distribution of economic resources, there is evidence that it is not merely a historic phenomenon. As will be described in subsequent chapters, new developments have taken hold in the run-up to, and aftermath of, the Great Recession, and have exacerbated wealth disparities among racial and ethnic groups. Given the increased diversity of the Millennial generation, this new and expanded racial wealth gap deserves greater attention and should prompt a commensurate policy response.
Implications for a Policy Response
The current accumulation of wealth and its distribution are departing from previous life cycle trajectories. The data are not ambiguous. There is a dramatic generational wealth gap. Perhaps worse, the contemporary financial profile of the Millennial generation is out of step with social policy expectations that families amass a pool of economic resources that can be used to invest in their children, support their own retirement, and manage risks.
Additional evidence and analysis by a range of authors will be presented in the chapters that follow, which will explore the underlying trends shaping the generational distribution of wealth. Their work is informed by a common set of concerns and questions: How can Millennials catch up and get back on track? What policy changes can be made to help the next generation of young adults avoid this fate?
In order to fashion a policy response to the emerging Millennial wealth gap, it is instructive to acknowledge the pillars that historically have anchored the ladder of economic opportunity. These include being able to access education, skills, and training; secure a well-paying job with benefits in a growing economy; increase savings and asset ownership over time; and benefit from family gifts, inheritances, and transfers. For some, these pillars were never there at all; for others, they have weakened in the years since the Great Recession.
If we are to address wealth disparities, we will need to look broadly at these pillars, and assess how they can be strengthened to support the finances of Millennials. In doing so, there are significant advantages for targeting policies to the diverse race and ethnic groups that constitute the Millennial generation. Specific policy ideas are considered in the final chapter of this book, but regardless of the details, there is a strong case to be made for focusing the attention of policymakers on creating new pathways to financial progress, for both the current generation of Millennials and those who will follow.
References
Addo, Fenaba et al. 2016. “Young, Black, and (Still) in the Red: Parental Wealth, Race, and Student Loan Debt.” Race and Social Problems 8(1):64–76.
Addo, Fenaba. March 2018. “Parents’ Wealth Helps Explain Racial Disparities in Student Loan Debt.” In the Balance: Perspectives on Household Balance Sheets. Center for Household Financial Stability, Federal Reserve Bank of St. Louis.
Allen, Reniqua. 2019. It Was Just a Dream: A New Generation Confronts the Broken Promise to America. New York: Nation Books.
Altonji, Joseph, Lisa Kahn, and Jamin Speer. 2016. “Cashier or Consultant? Entry Labor Market Conditions, Field of Study, and Career Success.” Journal of Labor Economics.
Bialik, Kristen and Richard Fry. 2019, February 14. “Millennial File: How Young Adulthood Today Compares with Prior Generations.” Pew Research Center.
Braga, Breno, Signe-Mary McKernan, Caroline Ratcliffe, and Sandy Baum. April 2017. “Wealth Inequality is a Barrier to Education and Social Mobility.” The Urban Institute.
Bricker, Jesse, Lisa J. Dettling, Alice Henriques, Joanne W. Hsu, Lindsay Jacobs, Kevin B. Moore, Sarah Pack, John Sabelhaus, Jeffrey Thompson, and Richard A. Windle. September 2017. “Changes in U.S. Family Finances from 2013 to 2016: Evidence from the Survey of Consumer Finances.” Federal Reserve Bulletin. Vol. 103, No. 3. Washington: Board of Governors of the Federal Reserve System.
Canon, Maria, Marianna Kudlyak, and Yang Liu. 2015, January 26. “Youth Labor Force Participation Continues To Fall, but It Might Be for a Good Reason.” Federal Reserve Bank of St. Louis.
Cohen, Cathy J., Matthew Luttig, and Jon Rogowski. June 2017. “The Economic Lives of Millennials.” GenForward.
Cohen, Cathy J. and Jon Rogowski. 2015. “Black Millennials in America: Documenting the Experiences, Voices, and Political Future of Young Black Americans.” Center for the Study of Race, Politics, and Culture at the University of Chicago. Black Youth Project.
Cramer, Reid. 2018. “The Case for Crafting a Millennial Public Policy Agenda. In The Millennials Initiative 2018: New Voices and Ideas on Care, Community, Technology, and Civic Engagement. Edited by Reid Cramer and S. Melody Frierson. New America.
Desilver, Drew. 2016. “10 Facts about American Workers.” Pew Research Center.
Dettling, Lisa, Joanne W. Hsu, Lindsay Jacobs, Kevin B. Moore, and Jeffrey P. Thompson. 2017, September 27. “Recent Trends in Wealth-Holdings by Race and Ethnicity: Evidence from the Survey of Consumer Finances.” FEDS Notes. Washington: Board of Governors of the Federal Reserve System.
Dimock, Michael. 2018, March 1. “Defining Generations: Where Millennials End and Post-Millennials Begin.” Pew Research Center.
Emmons, William, Ana Hernández Kent, and Lowell Ricketts. May 2018a. “A Lost Generation? Long Lasting Impact of the Great Recession on Young Families.” Essay No. 2, The Demographics of Wealth, 2018 Series. Center for Household Financial Stability, Federal Reserve Bank of St. Louis.
Emmons, William, Ana Hernández Kent, and Lowell Ricketts. May 2015a. “Race, Ethnicity, and Wealth.” Essay No. 1, The Demographics of Wealth, 2015 Series. Center for Household Financial Stability, Federal Reserve Bank of St. Louis.
Federal Reserve Board. 2017. Survey of Consumer Finances.
Fishman, Rachel. 2018. The Wealth Gap PLUS Debt: Hoe Federal Loans Exacerbate Inequality for Black Families.” New America.
Frey, William H. January 2018. “The Millennial Generation: A Demographic Bridge to America’s Diverse Future.” Brookings Institution.
Frey, William H. January 26, 2018. “Old Versus Young: The Cultural Generation Gap. Trend. Winter 2018. The Pew Charitable Trusts.
Fry, Richard. 2018, March 1. “Millennials Projected to Overtake Baby Boomers as America’s Largest Generation.” Pew Research Center.
Fry, Richard and Kim Parker. November 2018. “Early Benchmarks Show ‘Post-Millennials’ on Track to Be Most Diverse, Best-Educated Generation Yet.” Pew Research Center.
Garon, Thea, Andrew Dunn, Katy Golvala, and Eric Wilson. 2019. “U.S. Financial Pulse: 2018 Baseline Survey Results.” Financial Health Network.
Goodman, Laurie, Jun Zhu, and Rolf Pendall. February 2017. “Are Gains in Black Homeownership History?” Washington, DC: Urban Institute.
Hobbes, Michael. 2018. “Millennials are Screwed.” Huffington Post.
Huelsman, Mark. 2018. “College without Debt.” New York: Demos.
Huelsman, Mark. 2018. “Social Exclusion: The State of State U for Black Students.” Demos.
Jacobs, Elisabeth and Liz Hipple. 2018. “Are Today’s Inequalities Impacting Tomorrow’s Opportunity.” Washington Center for Equitable Growth.
Joint Center for Housing Studies. 2017. “Improving America’s Housing: Demographic Change and the Remodeling Outlook.”
Kalish, Emma Cancian. 2016, April 22. “Millennials Are the Least Wealthy, but Most Optimistic, Generation.” Washington, DC: Urban Institute.
Kiersz, Andy. 2014. “Millennials Aren’t Making as Much as Their Parents Did When They Were Young.” Business Insider.
Killewald, Alexandra and Brielle Bryan. 2018. "Falling Behind: The Role of Inter- and Intragenerational Processes in Widening Racial and Ethnic Wealth Gaps through Early and Middle Adulthood" Social Forces.
Kurz, Christopher, Gene Li, and Daniel J. Vine. “Are Millennials Different?” Finance and Economics Discussion Series 2018-080. Washington: Board of Governors of the Federal Reserve System.
Maag, Elaine, Elizabeth Peters, Anthony Hannagan, Cary Lou, and Julie Siwicki. “Income Volatility: New Research Results with Implications for Income Tax Filing and Liabilities.”
McCarthy, Mary Alice, Lul Tesfani, and Kim Dancy. 2018. “Paying More and Getting Less: How Nondegree Credentials Reflect Labor Market Inequality Between Men and Women.” New America.
McKernan, Signe-Mary, Genevieve Kenney, and Robert Abare. 2017, February 28. “Why Do a Larger Share of Millennials and GenX have Past-due Medical Debt Than Older Americans? Washington, DC: Urban Institute.
Mezza, Alvaro, Daniel Ringo, and Kamila Sommer. January 2019. “Can Student Loan Debt Explain Low Homeownership Rates for Young Adults?” Federal Reserve Board Division of Research and Statistics. Consumer and Community Context.
Miller, Ben. 2014. “The Student Debt Review: Analyzing the State of Undergraduate Student Borrowing.” Washington, DC: New America Foundation.
Pew Research Center. 2018. “Defining Generations.”
Pfeffer, Fabian and Alexandra Killewald. 2018, June 1. “Generations of Advantage: Multigenerational Correlations in Family Wealth.” Social Forces 96(4):1411–1442.
Resolution Foundation. 2018. “A New Generational Contract: The Final Report of the Intergenerational Commission.”
The Pew Charitable Trusts. 2018. “American Families Face a Growing Rent Burden.”
U.S. Census Bureau. April 2018. “Quarterly Residential Vacancies and Homeownership.”
Vespa, Jonathan. April 2017. “The Changing Economics and Demographics of Young Adulthood: 1975–2016.” Current Population Reports. U.S. Census Bureau.
Wething, Hilary, Natalie Sabadish, and Heidi Shierholz. May 2012. “The Class of 2012: Labor Market for Young Graduates Remains Grim.” Economic Policy Institute.
Young Invincibles. January 2017. “Financial Health of Young America: Measuring Generational Declines between Baby Boomers and Millennials.”
Citations
- Michael Dimock. “Defining Generations: Where Millennials End and Post-Millennials Begin.” Pew Research Center. March 1, 2018.
- With the arrival of young immigrants, the size of the Millennial generation will actually continue to grow, perhaps reaching 76 million by 2036, as estimated by the U.S. Census Bureau.
- Michael Dimock, 2018.
- Richard Fry, 2018.
- This is a global phenomenon. The U.S. is actually getting relatively young, as it is aging at a slower rate than other countries. The share of seniors in the U.S. is expected to increase from 13 percent in 2010 to over 21 percent by 2050. However, it may triple in countries such as Mexico and Brazil.
- Conventions continually evolve as to how to analytically describe and label racial and ethnic groups. Choices in capitalization and hyphenation mask the sociological insight that race is a social construct. The reduction of people to a color is absurd. Still, if people share experiences and outcomes, it is instructive to examine them as a group.
- William H. Frey, 2016.
- Cohen et al., 2017.
- The United States is home to more immigrants than any other country in the world—almost 43 million in 2010. Russia has the second largest immigrant population at just over 12 million.
- William H. Frey, 2018.
- William H. Frey, 2018.
- Hilary Wething, Natalie Sabadish, and Heidi Shierholz, 2012.
- Joseph Altonji, Lisa Kahn, and Jamin Speer, 2016.
- Drew Desilver, 2016. The unemployment rate does not include those in school or not actively looking for work. The labor force participation rate is the sum of all employed workers divided by the working age population.
- Canon et al., 2015.
- U.S. Census Bureau.
- Young Invincibles, 2017.
- Andy Kiersz, 2014.
- Elaine Maag et al., 2017.
- William H. Frey, 2018.
- U.S. Census Bureau. Historic Poverty Tables. 2017.
- According to the U.S. Census, the median age for a first marriage in the 1950s was 20 years old for women and 22 years old for men. In 2015, this figure rose to 27 years old for women and 29 years old for men.
- Jonathan Vespa, 2017.
- National Center for Health Statistics, 2017.
- Jonathan Vespa, 2017.
- Cohen and Rogowski, 2015.
- William H. Frey, 2018.
- The Pew Charitable Trusts, 2018.
- Jesse Bricker et al., 2017.
- Jesse Bricker et al., 2017.
- The Pew Charitable Trusts, 2018.
- The Pew Charitable Trusts, 2018.
- William Emmons, Ana Kent, and Lowell Ricketts, May 2018a.
- William Emmons, Ana Kent, and Lowell Ricketts present a more detailed analysis of changes in predicted wealth by age in their chapter.
- William Emmons, Ana Kent, and Lowell Ricketts, May 2018a.
- Dettling et al., 2017.
- Federal Reserve Board, Survey of Consumer Finances, 2017. (REVISE)
- Dettling et al., 2017.
- U.S. Census Bureau. “Quarterly Residential Vacancies and Homeownership.” April 2018.
- Goodman et al., 2017.
- Goodman et al., 2017.
- Dettling et al., 2017.
- Dettling et al., 2017.