
The Emerging Millennial Wealth Gap
Table of Contents
- The Emerging Millennial Wealth Gap: Opening Note
- Building Ladders of Success for the Rising Millennial Generation: An Initiative Funded by the Citi Foundation
- Part 1: Generational Wealth and Financial Health
- Framing the Millennial Wealth Gap: Demographic Realities and Divergent Trajectories
- Trends, Origins, and Implications of the Millennial Wealth Gap
- The Millennial Racial Wealth Gap
- The Young and (Economically) Restless: The Nature of Work for American Millennials
- The Financial Lives of Millennials: Evidence from the U.S. Financial Health Pulse
- Part 2: Components of the Millennial Balance Sheet: Assets and Liabilities
- Wealth and the Credit Health of Young Millennials
- Millennials and Student Loans: Rising Debts and Disparities
- Young Adults and Consumer Debt: The Quiet Crisis Next Time
- Homeownership and Living Arrangements among Millennials: New Sources of Wealth Inequality and What to Do about It
- Part 3: Implications for Social Policy
- Public Policy Implications of the Millennial Wealth Gap
- Addressing the $1.5 Trillion in Federal Student Loan Debt
- Policy Responses to the Millennial Wealth Gap: Repairing the Balance Sheet and Creating New Pathways to Progress
Abstract
The Millennial generation is on a much lower trajectory of wealth accumulation than their parents and grandparents. Dramatically so. Their generational balance sheet, tabulating assets and liabilities, is historically poor. Despite its dramatic emergence and real world consequences, the Millennial wealth gap has received scant attention to date. This publication is an attempt to address that. By examining the data, identifying trends, and exploring the underlying dynamics of the generational distribution of wealth in America today, the authors included in this volume have committed to participating in a constructive policy discourse to address the misalignment between public policy and the lived experience that threatens to undermine the potential of an entire generation. It is time to incubate large-scale policy interventions to respond to the economic vulnerability of the Millennial generation and create new pathways to progress. Absent a concerted policy response, the troubling disparities in wealth and opportunity will persist for years to come.
Acknowledgments
This publication has been made possible by support from the Citi Foundation. Through their Pathways to Progress initiative, they are advancing a range of efforts to expand opportunities for a diverse set of young adults, in the U.S. and worldwide. Julie Hodgson has been an outstanding program officer and thought partner. Her colleagues at the Citi Foundation, especially former President Brandee McHale and current Director of Programs Florencia Spangaro, have been long-term leaders in the field of youth services. Their engagement and encouragement to pursue this project has been greatly appreciated.
I am particularly grateful to the authors whose work is presented in this collection: Fenaba R. Addo, Colleen Campbell, Jung Choi, Brent J. Cohen, Cathy Cohen, William R. Emmons, Matthew Fowler, Thea Garon, Charlotte Hancock, Liz Hipple, Julie Hodgson, Ana H. Kent, Signe-Mary McKernan, Vladimir Enrique Medenica, Genevieve Melford, Ben Miller, Ida Rademacher, Caroline Ratcliffe, Lowell R. Ricketts, Trina Shanks, Wesley Whistle, and Yiling Zhang. Each has contributed their insights, analysis, and time in order to elevate a set of issues impacting the lives of others.
Much of my own thinking on this topic was sharpened as a result of a daylong convening held at the Washington DC office of New America in April 2019. It was an interdisciplinary and cross-cutting day of discussion. Many of the authors initially shared their work there and responded to feedback from a broad array of experts in the room. I would like to acknowledge and thank the participants at the convening: Davide Azzolini, Velvet Bryant, Allie Aquilera DiMuzio, Reginald Exum, Hala Farid, Jennifer Fernandez, Rachel Fishman, Jessica Fulton, Melissa Grober-Morrow, Mark Huelsman, Elisabeth Jacobs, Rob Levy, Jonathan Lykes, Mary-Alice McCarthy, Jen Mishory, Julie Margetta Morgan, David Newville, Sophie Nguyen, Chayenne Polimédio, Mark Schmitt, PJ Tabit, Jonathan Vespa, and Taylor White.
Their collective expertise and critical feedback helped strengthen the final versions of the essays featured here. I’d like to give a special shout-out to Amarins Laanstra-Corn, who served as our rapporteur for the day, and Reniqua Allen, a New America fellow alum who shared highlights from her new book, It Was All A Dream: A New Generation Confronts the Broken Promise to Black America.
The agenda for the convening and this subsequent publication has been shaped by extended conversations with two long-time colleagues, Ray Boshara and Signe-Mary McKernan. For years, I have benefited from their insights. Ray was the inaugural director of New America’s Asset Building Program when he hired me away from OMB in 2003. In the years since he has been a mentor, intellectual partner as well as a friend. Under his leadership, the Center for Housing Financial Stability at the Federal Reserve Bank of St. Louis informs and enriches the public discussion of family finances by producing the most sound and insightful analysis, relentlessly. His whole team deserves our collective kudos. Signe-Mary has been a guiding light from her perch at the Urban Institute, where she has served as a long-term director of the Opportunity and Ownership Initiative. In this capacity, she has had a hand in producing some of the most insightful and reliable analysis of data impacting the economic lives of families, which has provided a foundation for the best type of policy reform discussions—those that are actually informed by evidence.
As this project got under way, I was inspired by the work of a political science professor at the University of Chicago, Cathy J. Cohen. She is the founder and principal investigator of the indispensable GenForward Survey, which conducts policy-relevant public opinion work focused on Millennials and the diverse voices that make up the generation. When she committed her team to the convening, I knew it was going to be a success. I am very pleased to feature their work here and expose more people to their ongoing analysis.
I am especially grateful to Melody S. Frierson, who introduced me to Dr. Cohen’s work, and also was among the most capable project managers I have ever worked with. From 2017 to 2018, she ran New America’s Millennial Public Policy Fellowship program, which produced an impressive body of work that this publication has built upon.
Finally, I’d like to thank my colleagues at New America who assisted with the production of this book as well as the planning and execution of the convening. The competence and poise of our events, communication, and production team is high, and I’d like to specifically thank Maria Elkin, Fuzz Hogan, Angela Spidalette, James Stewart, Narmada Variyam, Alison Yost, Joanne Zalatoris, and Joe Wilkes.
It is a collective task to create a more equitable future, where people can thrive regardless of their economic standing at birth, how long their parents have been in the country, or their membership in any particular racial or ethnic community. This work is dedicated to all those who believe America can do better. We can.
Reid Cramer
Director, The Millennials Initiative
New America
Downloads
The Emerging Millennial Wealth Gap: Opening Note
Reid Cramer
A popular story line took hold only a few years ago, depicting Millennials in America as an ascendant generation. Their parents were attentive, the technology was dazzling, and they grew up optimistic about the future. Along the way some of their elders felt they were coddled and prone to an inflated sense of entitlement and privilege. Yet less encumbered by tradition, they were open to cooperation and more tolerant of differences among their peers. They were poised to seize the day and remake society in their image.
As they have entered adulthood, this narrative picture has crumbled. The generalizations foisted upon them didn’t quite capture the actual diversity and complexity of their experiences. If there is an overarching force coalescing this generational cohort, it is more likely to be their shared sense of economic insecurity, born from coming of age in the wake of the Great Recession.
Even as memories of the recession recede, disruptive ripples launched by the financial crisis continue to upset the economic lives of this rising generation. Although they bore no responsibility for creating the economy, or failing to regulate it effectively, young adults have had to live with the consequences. Just as Millennials approach their prime work and family-forming years, poor finances are complicating how they assemble the building blocks of success. Stagnant incomes, rising debts, and a broadly weakened financial profile have contributed to creating a new story line: Millennials appear unlikely to replicate the economic success of their parents and grandparents. Central to this unfolding era of uncertainty is their relative failure to begin the process of accumulating wealth and assets.
By many measures, America remains a prosperous country—among the richest in the world—and many individuals are thriving financially. While the distribution of wealth has never been equitable—the country was founded with the enslavement of Africans on land previously inhabited by native peoples—there has been a sense of generational progress. A growing middle class and expanding civil rights fostered a widely held belief that prosperity might increasingly be shared. The recent performance of the economy has undermined this expectation. Instead, more Americans recognize that there has been an increasing concentration of resources among those at the top of the economic ladder. As concern about inequality has grown, wealth inequities have been widely acknowledged. Yet less attention has been given to the emergence of a new and generational dimension to wealth inequality. Simply stated, the Millennial generation has less wealth and a poor generational balance sheet. While the income of a typical Millennial is only slightly below levels predicted by the experience of past generations, young adults in America today are on a much lower trajectory in their wealth accumulation than their predecessors. Dramatically so.
One insightful distillation of the Millennial wealth gap and the relative failure of young adults to begin their lifelong wealth building process has been described by scholars with the Center for Household Financial Stability at the Federal Reserve Bank of St. Louis. Using the most comprehensive data of household wealth to compare the net worth of young adults over time, they found that the typical Millennial today holds 41 percent less wealth than a similarly aged adult in 1989. Whether or not this cohort gets back on track or misses out on the experience of wealth building altogether will have long-term impacts and broad ramifications.
A closer look at the data shows how the Great Recession essentially has catalyzed the Millennial wealth gap. While the initial destruction of wealth was widespread, the recovery experience has been uneven generationally. Two particular trends stand out when summarizing the experience of age cohorts in the economy since 2008. First, older households have rebuilt their balance sheets and grown their wealth holdings, while young adults have lagged behind. Second, wealth gains made by Black and Hispanic families over the preceding decades were largely wiped out and have been slow to recover, which has amplified historic inequities and created new sources of inequality. As a result, the overall racial wealth gap has not narrowed over the last 30 years. The gap remains a chasm.
Given the increasing diversity of the Millennial generation—one of its most salient characteristics—the racial wealth gap is clearly exacerbating the Millennial wealth gap. The most recent wealth data from the Federal Reserve shows that the average wealth holdings of the typical Black Millennial are approximately $5,700, compared to $26,100 for White Millennials, while the typical Hispanic Millennial had a net worth of $14,690. And while there are disparities in the distribution of both income and wealth according to race and ethnicity, the wealth gap is wider. Among Black and White Millennials, wealth inequality was 2.6 times greater than income inequality, according to the most recent data; among Hispanic and White Millennials it was 1.5 times greater. These findings should motivate increased scrutiny on the role of race and ethnicity in the emerging Millennial wealth gap, and focus attention on solutions to address it.
Unfortunately, there is a growing disconnect between the economic conditions the diverse generation of Millennials face and their government’s response. This misalignment between public policy and lived experience threatens to undermine the potential of an entire generation, and handicap the next. This is because Millennials are not just the future—they are already powering our workforce, steering our economy, and poised to exert their influence as the largest generation. Perhaps most significantly, they are the ones deciding if, when, and how to start families, and will be assuming responsibility for raising the country’s most prized resource: the children of the next generation. We all have a stake in their welfare.
Guiding Insights
Despite its dramatic emergence and real world consequences, the Millennial wealth gap has received scant attention to date. This publication is an attempt to address that. By examining the data, identifying trends, and exploring the underlying dynamics of the generational distribution of wealth in America today, the authors included in this volume have committed to participating in a constructive policy discourse. Collectively, we seek to promote policy reforms capable of responding to current conditions and expanding access to viable pathways to progress. In this opening note, a few of the primary ideas, assumptions, and aspirations that have guided this inquiry will be clarified.
Wealth is a Foundation for Economic Security
In the pantheon of economic variables, income is revered. It attracts attention because it represents the flow of resources into a household and correlates closely with consumption of other resources, such as food and housing. It’s also easier to count. But besides the flow of money, having a stock of economic resources matters a great deal for a household’s welfare. Access to wealth—in the form of savings, assets, and even access to credit—is one of the most impactful variables determining long-term social and economic outcomes.
Wealth takes many forms. Tangible and intangible. Real and unrealized. Values change over time and can fluctuate arbitrarily. Yet savings and assets also can accrue over time, as can debt and liabilities. Studies of household wealth often use net worth as a proxy because it is the amount left over after liabilities are subtracted from the market value of assets. While wealth and net worth are harder to track than income, and are subject to external market forces, the overall condition of one’s balance sheet can create opportunities or obstacles, impacting a person’s life and work choices.
Wealth is a key to financial security and economic mobility for a number of reasons. It has an insurance function that can be activated to smooth over unexpected income fluctuations, respond to emergencies, and avoid debt. Wealth also has an investment function: it can be strategically deployed in ways that trigger future benefits, such as paying for tuition, making a down payment on a home, capitalizing a small business enterprise, or buying into other enterprises that can become more productive and increase in value. Although wealth connotes luxury, it is shorthand for things of value, and is most relevant to those who have less.
Income can be a source of wealth in the sense that income not immediately consumed becomes part of the stock of resources that can be available for later use. It is this extended time horizon which makes wealth unique, and confers it special properties. Research pursued in the last 20 years has identified a number of significant “asset effects” that can accrue to the holders of wealth.1 Research confirms that even small amounts available at key moments can make a difference, and can be especially valuable to those with low incomes living in poverty.2 One of the most significant asset effects is how owning financial assets can trigger a sense of economic security and promote mental health that facilitates the ability to plan for the future. Conversely, those with low or no access to wealth are by definition financially insecure, limited in many ways from participating in the economy and reaching their full potential.
The study of wealth and economic security opens up a window to consider what impacts the generational balance sheet. Changes in net worth can be linked to business cycles of the economy, behavioral trends at the household level, and the revision of public policies, such as levels of taxation and subsidies. Beyond individual households, aggregate net worth trends can identify patterns of wealth holding among groups of people, revealing degrees of equity. This applies to racial and ethnic groups, regions of the country, and even generations. There should be widespread special concerns if large groups of people or communities are unable to access wealth or begin an extended asset building process.
Wealth Building Public Policies Should Match the Life Cycle
By its nature, wealth building is a long-term process. In fact, many benefits compound over time and are often realized at a much later date than when initially acquired. For many families, there is a distinct life cycle pattern to wealth holding in America, and we should aim to match public policies to promote wealth building with distinct stages of the life course.
Most young adults start out with negligible savings. As they begin to form households and grow their earnings during their 30s, their assets start to modestly grow, before accelerating into the 50s in preparation for retirement in the late 60s. This is what’s typical. Median wealth figures describe those precisely in the middle, with half having more and half having less. There are many who don’t own anything and never will accumulate much wealth. Still, these patterns of generational wealth building, and changes since the Great Recession, offer clues to the moments in the life course that are associated with greater potential for wealth accumulation.
This approach creates a window to think more generationally. Evidence abounds that contemporary finances have altered life choices and shifted previously prevalent milestones of adulthood. For instance, fewer young people today are getting married, forming households, buying homes, and having children. Some of these socioeconomic trends may have begun before the financial downturn took hold, while others have been intensified by it.
Especially for young adults, there are key moments in the life course that have long-term impacts on economic outcomes. These include moments such as the birth of a child, pursuing an education, entering the workforce, forming a household, starting a family, and even the end of life. Public policy can be designed to take advantage of these moments. There is a special role for public policy to support young families at the time when they are raising children. Unfortunately, this is precisely when the feeling of financial stress is greatest. Similarly, the prime work years are economically formative, and exert a strong influence on longer-term trajectories.
Generational Fairness is Part of the Social Contract
Just as with families, our society is bound together by mutual obligations among the generations that form the basis of an implicit intergenerational contract. Different generations support each other depending upon where they are in the life course. Children depend on their parents, the elderly are assisted to age with dignity, and there is an expectation that each generation can do better than the last.
The emergence of the Millennial wealth gap presents a particularly acute challenge to the concept of “generational fairness.” With persistently poor finances, Millennials are having difficulty assuming their responsibilities. If the young adults raising families and powering the workforce feel they are shouldering more burdens than they can handle financially, basic assumptions about social responsibility may be upended. There is a collective interest in ensuring that sufficient generational assets are available to Millennials to meet their obligations.
Previously, conceptions of the intergenerational contract informed what government could and should be able to do. Societal assumptions are actually codified in public policy. At times people contribute by paying taxes, and at other times they receive benefits based upon their place in the life course. There are expectations that our government will provide support for us when we need help the most. Often these benefits have been delivered as incentives to employers to pass along to their workforce. Yet over the last 30 years, there have been a series of policy shifts—in areas such as health care and retirement—that have transferred the responsibility for managing economic risks from employers and government to individual households. Increasingly, families are expected to build up resources to meet their individualized responsibilities. This risk shift has raised the stakes for wealth building, both for individual households and among generations.
A comparative cohort analysis of wealth trends reveals clear tensions, both economic and cultural, which have the potential to trigger a larger political reckoning that will play out in policy debates. The Millennial wealth gap may increasingly become the context for calls to cut benefits for the elderly or address the level of debt passed on to the next generation. Despite inherent tensions, a more constructive approach is to design policies that address concerns of both the young and the old. In doing so, a number of choices will have to be made to address equity imbalances, distinguishing among different types of households and incentivizing certain types of behaviors. Given current trends and our national history, issues of race and ethnicity should be broadly assessed. If fairness and equity receive proper attention, social and economic justice will be included in the discussion, creating an opportunity to consider reparations. Policy choices can and should be made that will impact the distribution of resources, implemented with changes in taxation and subsidies. The goal should be to rebuild and rebalance the intergenerational contract by taking account of generational fairness and reciprocity, as well as fairness in the distribution of wealth and power.
Policy Should Align with Millennial Attitudes and Preferences
In designing policies that are capable of responding to mounting generational challenges, it matters how those affected think about current affairs and participate in the political process. In the years ahead, Millennials will lead shifts in public opinion, creating opportunities for large-scale policy change. This creates an imperative to develop policies that can respond to contemporary conditions and align with the prevailing attitudes and behaviors of the rising generations.
With preferences that diverge from those of older Americans, Millennials have already had an impact on a number of social-issue policy debates—such as marijuana legalization, gun control, and gay rights. However, as a cohort, Millennials remain skeptical of political parties; 44 percent identified as political independents in 2017, far exceeding GenX-ers (39 percent) and Baby Boomers (32 percent).3 Although Millennials are not monolithic in their political beliefs, as a group they tilt toward the liberal side of the political spectrum. When “lean” is considered in survey answers, more Millennials associate themselves with the Democratic Party (59 percent) than the Republican Party (32 percent); the 27 percent spread exceeds those for GenX (6 percent) and Boomers (2 percent).4 Yet only 49 percent of Americans ages 18 to 35 voted in the last presidential election, compared to about 70 percent of Boomers.5
In crafting a policy response to the Millennial wealth gap, it will be necessary to consider the contemporary political dynamics which are shaping the policy discourse and influencing the extent of their future political participation. There’s little doubt that the current political moment presents major challenges in crafting a Millennial public policy agenda. Chief among these is the prevailing political polarization that has weakened the norms of governance and poses significant obstacles to policy reform efforts. Still, there is value in the task of identifying durable policy solutions that respond to current conditions and can be effective when implemented at scale.
This will be particularly relevant during the unfolding presidential campaign of 2020, which will drive discourse and set the course for future policy changes. The extended campaign season will create an opportunity for new ideas to emerge that might gain momentum. Accordingly, it is a time to incubate large-scale policy interventions and a broad agenda to address the issues faced by the current generation of Millennials as well as those who will come next. Absent a concerted policy response, the troubling disparities in wealth and opportunity may persist for years to come.
Guide to the Volume
Exploring the connections between wealth and financial health, the first section of this book uses a generational perspective to clarify how large cohorts of Americans are indeed on different trajectories, reflected in their financial profiles. My opening chapter seeks to frame the inquiry by establishing a set of reference points for a generational analysis and describing some of the prevailing demographic realities shaping the Millennial generation, including the extent of their relative diversity and how their group experience is diverging from those of their predecessors.
The two chapters that follow offer insight into the most prevalent wealth trends as they are playing out generationally. William Emmons, Ana Kent, and Lowell Ricketts of the Center for Household Financial Stability at the St. Louis Federal Reserve Bank present an innovative analysis of age and net worth. Working with the most comprehensive wealth data supplied by the Fed’s Survey of Consumer Finances, they are able to compare the amount of wealth we expect a typical young adult to have accumulated, given past performance of the economy, against what that typical young adult actually owns. The results are striking. Not only are Millennials behind previous cohorts, but they demonstrate how older households are faring particularly better. This move of equity up the generational ladder represents a profound shift in the distribution of wealth, raising a number of policy questions.
Another striking trend is the erosion of wealth held by families of color and the persistence of the racial wealth gap that many had expected to close in the post–civil rights era. Instead, this gap endures. Fenaba Addo and Yiling Zhang, scholars at the University of Michigan, innovatively describe several vital manifestations of the racial wealth gap, with a focus on young adults. Recognizing that racial wealth inequities have been a central feature of American history, they show how they have been reproduced and actually extended among Millennials in recent years. Their findings are sobering and should motivate a deeper consideration of ways policy might respond. They offer additional insights into key drivers of these outcomes, specifically through pathways that include relative access to higher education, degree completion, and marriage to others with education and economic resources.
In order to assess how young people are experiencing the economy, it helps to ask them. Vladimir Enrique Medenica, Matthew Fowler, and Cathy Cohen present an analysis of Millennial public opinion as collected by the GenForward Survey at the University of Chicago , a nationally representative survey of young adults that pays special attention to how race and ethnicity shape people’s attitudes and experiences. Specifically, they report on how young people feel about work and the economy. Their analysis elevates how distinct racial and ethnic groups experience changes in the economy differently. The variations they uncover in perceptions, attitudes, and behaviors can and should be used to inform policy interventions.
This section concludes with an article by Thea Garon summarizing evidence from the U.S. Financial Health Pulse, an innovative project of the Financial Health Network designed to track the totality of people’s financial lives by considering how they spend, save, borrow, and plan. Among the innovations of this project is a metric of financial health that can distinguish people who are financially vulnerable, coping, or healthy, depending upon their behaviors. When applied to Millennials, this metric indicates that only a quarter of the population can be considered financially healthy, and deeper analysis reveals wide gaps among racial and ethnic groups. This work reflects how widespread financial security is among this generation, with the overwhelming majority living as poor, near poor, or one calamity away from financial hardship.
The book’s second section examines key components of the Millennial balance sheet in greater detail, which features changing relative shares of assets and liabilities. Signe-Mary McKernan and Caroline Ratcliffe of the Urban Institute, and Trina Shanks of the University of Michigan, use an innovative approach to assess the current financial position of the Millennial generation. They look at both wealth data and collateral evidence provided by private-sector credit agencies that track consumers’ borrowing and payment behaviors. The credit scores assigned to borrowers are a proxy for financial health, and also subsequently determine the cost of accessing future credit. Extending their analysis of wealth and credit health among Millennials to geography, they reveal how financial hardship is also regionally concentrated, an insight that has important policy ramifications.
The next set of chapters examines the liability side of the generational balance sheet. Rather than building wealth, many Millennials have accumulated debt, but the nature of this debt has changed. Instead of mortgage debt, which previous generations have historically begun to accrue by the time they reach their early thirties, Millennials have accumulated rising levels of consumer and student loan debt.
The current state of federal student loan portfolio reveals a staggering $1.5 trillion in outstanding debt. In his analysis of the federal student loan system, Wesley Whistle from New America’s Education Policy Program is able to describe trends in student debt and distinguish among different types of borrowers. Looking at debt levels, defaults, and loans in collection, he describes the relatively poor outcomes by those that don’t finish their degrees, have excessive repayment burdens given their subsequent income, attended a for-profit school, and African Americans generally. Along with his analysis of the data, he presents a series of policy reform ideas targeted to borrower characteristics that can reduce extended financial hardship, if implemented at scale.
Beyond student loans, other consumer debt among young adults has increased too. Ida Rademacher and Genevieve Melford of the Aspen Institute’s Financial Security Program assess this growth and argue that debt has reached such unsustainable levels that it is sowing the seeds for the next financial crisis. They highlight work in the field that is beginning to identify innovative solutions to address consumer debt, specifically with reforms in the management of student loans, the reduction of government fines, and the regulation of collection agencies.
The section concludes with a closer look at the changing relationship of Millennials to housing. Analysis by Jung Choi of the Urban Institute’s Housing Finance Policy Center shows that not only do Millennials have a lower rate of homeownership as traditionally measured, but they have lower rates of household formation generally. The increasing prevalence of living with parents or relatives is a logical response to income and debt constraints, but it can undermine wealth building prospects. By considering both the lower homeownership rate and the lower household formation rate, Choi is able to provide a more realistic estimate of the potential wealth loss experienced by Millennials. In this sense, changing patterns of living arrangements, which have led to declines in homeownership, are actually among the most significant new sources of wealth inequality that have taken hold since the Great Recession.
The final section features articles that explore the policy implication of the emerging Millennial wealth gap. Liz Hipple of the Washington Center for Equitable Growth reviews the accumulating social science research that attests to the relationship between a family’s economic resources and a child’s subsequent outcomes, and identifies a key measure of intergenerational mobility. She argues that this should be the foundation for a policy response. Further, she makes the case for going beyond solutions that merely equalize access to activities that support human capital development, such as education and skills attainment, to solutions which ensure that young adults can benefit from deploying their potential in the economy. In doing so, she focuses on the need for higher wages and coherent career ladders, as well as the need to address discrimination experienced by people of color, which she shows to be a persistent feature of American society and its economy.
This approach is particularly relevant given the dramatic rise in student loan debt and its role in undermining future wealth building and economic security. Ben Miller, Colleen Campbell, Brent Cohen, and Charlotte Hancock of the Center for American Progress and Generation Progress present four specific policy options to address the $1.5 trillion of outstanding federal student loan debt. To facilitate a comparative assessment, they articulate a set of criteria with which to assess the merits of a policy response. Their options vary in scale and take into account different borrower characteristics. For instance, many young adults carry student loan debt even though they did not complete a degree. This group has a relatively high rate of default, which makes them particularly vulnerable financially. Those who completed a degree, especially at the graduate level, are less likely to default, but may still face struggles related to repayment. These are the nuances that should inform a policy response to one of the most pervasive problems afflicting the Millennial generation.
Finally, I seek to advance a forward-looking policy agenda to respond to the unfolding reality of the Millennial wealth gap. The last chapter presents a set of specific policy responses that can be pursued at scale to reduce generational inequities. These responses are intended to address the dual imperatives of helping the current generation repair their balance sheets and simultaneously creating new pathways to progress for future generations.
Without a dramatic change in the fortunes of Millennials, an entire generation will miss out on the chance to reach their full potential, imperiling our democracy in the process. If the diverse cohort of young adults who constitute the Millennial generation can’t improve their financial balance sheets by earning more, increasing their assets, and lowering their liabilities, their climb up the economic ladder won’t be delayed—it won’t occur at all. There is a role for all of us, and particularly our policymakers, to help this generation chart a new course.
Citations
- Robert Lerman and Signe-Mary McKernan. “Effects of Holding Assets on Social and Economic Outcomes: A Review of Theory and Evidence.” U.S. Department of Health and Human Services. 2008.
- Reid Cramer, Justin King, and Elliot Schreur. “Flexible Savings: The Missing Foundation for Financial Security and Economic Mobility.” New America. 2014.
- Pew Research Center. “The Generation Gap in American Politics.” 2018.
- Pew Research Center. “Trends in Party Affiliation among Demographic Groups.” March 20, 2018.
- Richard Fry. “Millennials and Gen Xers Outvoted Boomers and Older Generations in 2016.” Pew Research Center. July 2017.
Building Ladders of Success for the Rising Millennial Generation: An Initiative Funded by the Citi Foundation
Julie Hodgson
Young people today face a number of significant challenges as they strive to achieve financial security. Stagnant incomes, extended periods of unemployment, rising student debt, and scarcity of affordable housing have created conditions that make the transition to adulthood much more difficult. The youth unemployment rate is three times higher than that of adults, and the widening income gap continues to threaten the financial stability of this rising generation.1 Allowing economically disadvantaged young people to grow into economically disadvantaged adults contributes to a destructive cycle that hinders the growth of communities, cities, and economies. Yet, despite these realities, we know that young people are optimistic, entrepreneurial, and realistic about what they need to succeed.2
For this and coming generations to thrive, young people need to be able to access tools, resources, and networks to navigate the obstacles presented by our contemporary economy. Over the last several decades, the Citi Foundation has focused its resources on supporting interventions that were considered traditional pathways to success. Specifically, efforts to increase post-secondary degree attainment, promote homeownership, and help individuals adopt positive financial behaviors can be beneficial when they lead to reduced levels of debt and higher levels of short- and long-term savings. While we still believe that these asset-building approaches are key milestones, my colleagues and I increasingly recognize that today’s youth face greater uncertainty about their future than prior generations. Career trajectories have been altered, definitions of success have changed, and even the decision of when and if to start a family has been impacted. For many of today’s youth, the pathway to success is far from linear.
As part of our Pathways to Progress initiative, the Citi Foundation is investing in innovative interventions to help young people pursue their career and economic ambitions by connecting them with on-ramps to opportunity. In 2017, the Citi Foundation announced its largest philanthropic commitment with the global expansion of Pathways to Progress to continue our efforts tackling youth unemployment beyond the U.S. By 2020, we will have invested $150 million to impact the lives of 600,000 youth globally.
As part of our commitment, the Citi Foundation partnered with New America to further the knowledge and dialogue on the issues facing young people in the U.S. today. We believe that the magnitude and complexity of these challenges have implications for us all and require a holistic, multi-sector response. Government, corporations, civic leaders, and young people need to continue working together not only to better understand the unique challenges facing Millennials and Generation Z, but also to collectively charter a productive path forward. In response, we supported a convening in the spring of 2019 at New America that brought together a diverse group of policymakers, thought leaders, practitioners, and philanthropists to discuss the issues at hand, share knowledge, and engage in a solutions-oriented conversation on how the country can ensure access to opportunity and upward mobility for future generations. It was an enlightening and dynamic day of discussion.
Many of the themes raised in conversations from this convening are reflected in the essays that follow. Our hope is that the ideas set forth here will help spark your own thinking, and prompt us all to further evaluate how we can better support today’s youth. Ultimately, it will require the strengthening of the entire youth-serving ecosystem to ensure that young people have what they need to rise above the challenges they face and create opportunities for themselves, their families, and their communities.
Finally, we want to thank New America, and namely Reid Cramer, for partnering with us on this journey and assembling the insightful essays that follow. Taken together, these pieces make a valuable contribution in helping to illuminate the obstacles that exist for young people today, and also clarifying what is needed to build accessible ladders of success. All of us have a stake in creating new pathways to progress that enable the rising generations to pursue their dreams.
Part 1: Generational Wealth and Financial Health
Part 1 includes:
- Framing the Millennial Wealth Gap: Demographic Realities and Divergent Trajectories by Reid Cramer
- Trends, Origins, and Implications of the Millennial Wealth Gap by William R. Emmons, Ana H. Kent, and Lowell R. Ricketts
- The Millennial Racial Wealth Gap by Fenaba R. Addo and Yiling Zhang
- The Young and (Economically) Restless: The Nature of Work for American Millennials by Vladimir E. Medenica, Matthew Fowler, and Cathy J. Cohen
- The Financial Lives of Millennials: Evidence from the U.S. Financial Health Pulse by Thea Garon
Framing the Millennial Wealth Gap: Demographic Realities and Divergent Trajectories
Reid Cramer
The generational experience of Millennials is far from uniform and differences among them abound, but they do appear to be sharing a pervasive anxiety about their finances. As resources have become increasingly concentrated, economic divides in the country have grown rather than expectations of shared prosperity. Even though achieving economic security is often seen as a result of individual characteristics and behaviors, it is the performance of the overall economy, with its boom-and-bust business cycles, which ultimately creates the opportunity for financial success. Emblematic of the challenges facing young adults in America today is that—for a substantial majority of them—accumulating savings and wealth is turning out to be an elusive proposition.
Although there are regional and local variations in a national economy, macroeconomic trends produce conditions that everyone must navigate. How people respond to changes in the economy depends on a number of factors, including where they are in their life cycle. In this sense, a generational perspective is particularly useful in understanding how economic conditions have large-scale impacts over time.
By considering the demographic foundations, economic realities, and divergent trajectories that are shaping the Millennial generation, this chapter will frame the emerging generational wealth gap. The relative diversity of Millennials, described in the first section, is sowing the seeds for new type of generation gap—one that is fundamentally cultural but which will have economic implications. The second section focuses on the divergent experiences of Millennials in the economy, as reflected in the range of their financial profiles, socioeconomic outcomes, and changing milestones of adulthood that distinguish them from their generational predecessors. In this analysis, two factors loom large: the uneven impacts of the Great Recession and the enduring role of race and ethnicity. The third section offers a description of the most basic contours of the Millennial wealth gap, which is being driven by relatively flat incomes, low savings, decreased housing equity, and higher consumer debt and student loans as well as a widening racial wealth gap. Narrowing this gap and improving their economic prospects is likely to require a concerted policy response aimed at strengthening their generational balance sheet.
Demographic Realities of the Millennial Generation
Assessing the world through the perspective of generations is an analytical approach that has both inherent value and limitations. On the one hand, there are insights to be gleaned from discerning how people born about the same time and in the same place share characteristics and behaviors that shape their experiences. Just as cultures can be studied and compared by examining beliefs, practices, and customs, generational cohorts enable comparisons to contemporary or historic peers. On the other hand, a generational perspective fosters an imprecision, imposing arbitrary demarcations that collapse differences across the life course and force an aggregated analysis. Grouping people within large spans of time and assuming they share characteristics can be presumptuous—consider the differences in a single person’s outlook when they are in their early 20s from when they are in their mid-30s.
Still demographers have traditionally and successfully employed cohort analysis to study variations among geographies and communities, where there is an intermingling of effects related to a person’s age, the period of time when they live, and the variations among a group moving across time. Even though everyone in a society may experience a specific event, the impact of that experience on attitudes and behaviors may differ depending on a person’s age and place in the life cycle. At the generational level, comparing discrete age cohorts can reveal key distinctions in the links between experiences and outcomes.
Generational Cohorts Defined
While generational labels have become ubiquitous in popular culture, they often are loosely applied. For instance, many different cutoff dates have been used to define the Millennial Generation, which variously have fallen between the years 1980 and 2000. The Pew Research Center, a leading source of generational analysis, recently called for a tightening of the Millennial span.1 Based on their assessment of demographic, labor market, attitudinal, and behavioral measures, they proposed a definition of all those born between 1981 and 1996. This means that as of 2019, Millennials are in their early 20s to late 30s, and they can be compared to Gen-Xers (ages 39–54), Baby Boomers (ages 55–73), and the Silent Generation (ages 74–91).
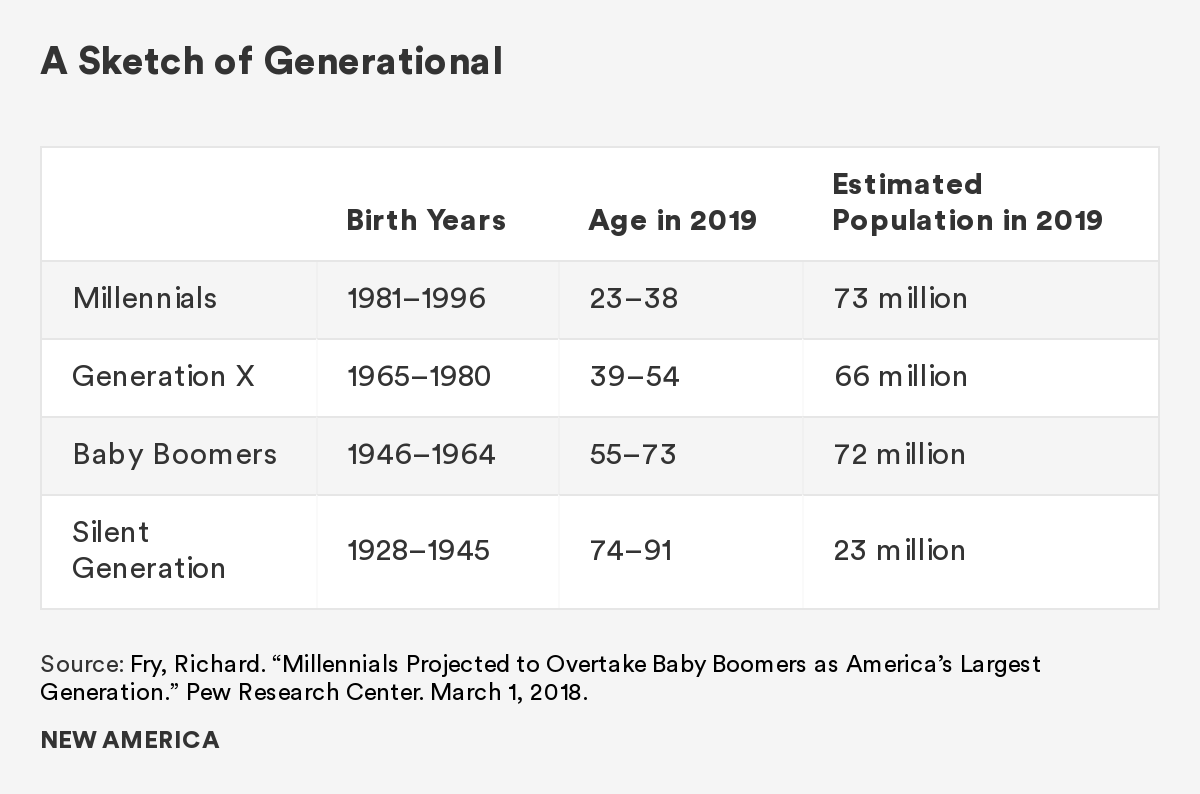
Using these generational labels, basic demographic realities for the United States—products of birth, death, and net migration—can be observed. The general outline of the country’s population pyramid reveals the unfolding dynamic between the large but aging Baby Boomer generation, born after World War II, the smaller number of Gen-Xers, and the increased number of births and immigrant arrivals that created the relatively large Millennial generation.
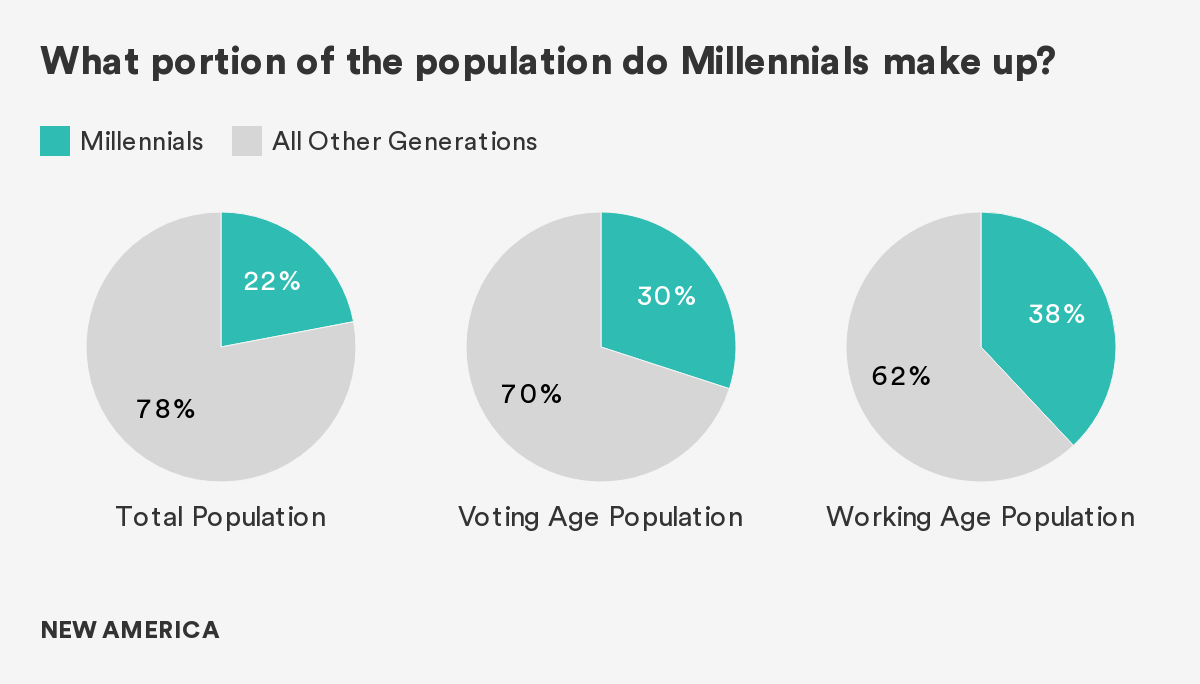
According to the U.S. Census Bureau’s projections, the population of the United States will surpass 328 million during 2019. Over 23 percent of Americans (over 73 million) will be between the ages of 22 and 38 in 2019.2 Recently exceeding the total number of Baby Boomers, Millennials already represent the nation’s largest living adult generation. Currently, Millennials are just over 30 percent of potential voters and are 38 percent of working-age adults; by 2025, they will constitute 75 percent of the workforce.3
While Boomers were more dominant at their peak (33 percent of the population in 1980), their numbers are projected to dwindle to 16.6 million by mid-century.4 In contrast, the influence of Millennials will only expand. Even though Millennials have recently become the largest cohort in absolute numbers, the country’s population will continue to age. This means that seniors are expected to account for much higher proportions of the overall population in the future than they did in the past.5 One implication of an aging population is the potential for a declining share of the population to be in the prime of working life. In 2010, the U.S. had 49 dependents per 100 working-age people; in 2050 that number is expected to rise to 66. As the child and middle-age populations in the U.S. are expected to increase at about the same pace, this increase is a result of the population’s aging.
Having fewer people in the workforce can slow economic growth, especially without increases in productivity. At the same time, more children and seniors may be depending on that shrinking workforce for support. This will have implications, as younger people work to fund the pensions and healthcare of the older generation. Regardless of how these tensions play out in national politics, the relative size of the Millennial generation, especially during their prime working years, is destined to exert a defining influence on the national economy and society.
Shared Experiences
Although individual preferences undoubtedly vary, Millennials do share a range of cultural, historic, and formative experiences that contribute to a generationally distinct worldview. These include early memories of traumatic national events, such as the Oklahoma City bombing in 1995 and Columbine school shooting in 1999, and political developments, such as the impeachment and acquittal of President Clinton in 1998, and the contested results of the presidential election of 2000.
Millennials were between 5 and 20 years old when the 9/11 terrorist attacks occurred, followed by the extended wars in Iraq and Afghanistan. Seven years later, Millennials were between 12 and 27 years old during the 2008 election campaign, when the force of the youth vote helped elect Barack Obama, the first Black president. Their adolescence and early adulthood were spent in the shadow of the Great Recession, with an economy wracked by job losses, business failures, and a slow recovery. The unexpected results of the 2016 election were relatively unpopular among Millennials, creating a new political landscape the entire country is continuing to navigate.

Beyond politics and events, Millennials have clearly been exposed to a dramatically different social landscape enabled by technological innovation and communication tools. The oldest of them came of age along with the internet and the proliferation of cell phones. The youngest have no memories of life before connectivity. Along with advances in telecommunications, many socioeconomic indicators improved. Violent crime in the U.S. fell sharply, as did smoking, drinking, and teen pregnancy. In many respects, the world became much safer. At the same time, there was a growing scientific consensus that environmental changes on a global scale, associated with the large-scale burning of fossil fuels, would increasingly become a source of disasters and displacement.
Millennial Diversity
While Millennials share cultural touchstones that distinguish them from older generations, broad generalizations about their preferences and behaviors will miss their diverse experiences. Indeed, the Millennial generation is defined by its diversity. Large waves of immigration to the U.S. in the 1980s and 1990s, coupled with the aging of the White population, have produced a rising share of new minority groups, particularly people with Hispanic and Asian origins.6 Today, 44 percent of Millennials identify as something other than non-Hispanic Caucasian, greatly exceeding the minority share of any of their predecessor generations.7 It is fair to conclude that Millennials are reordering the country’s race and ethnic composition, and serving as a bridge to a more diverse future.
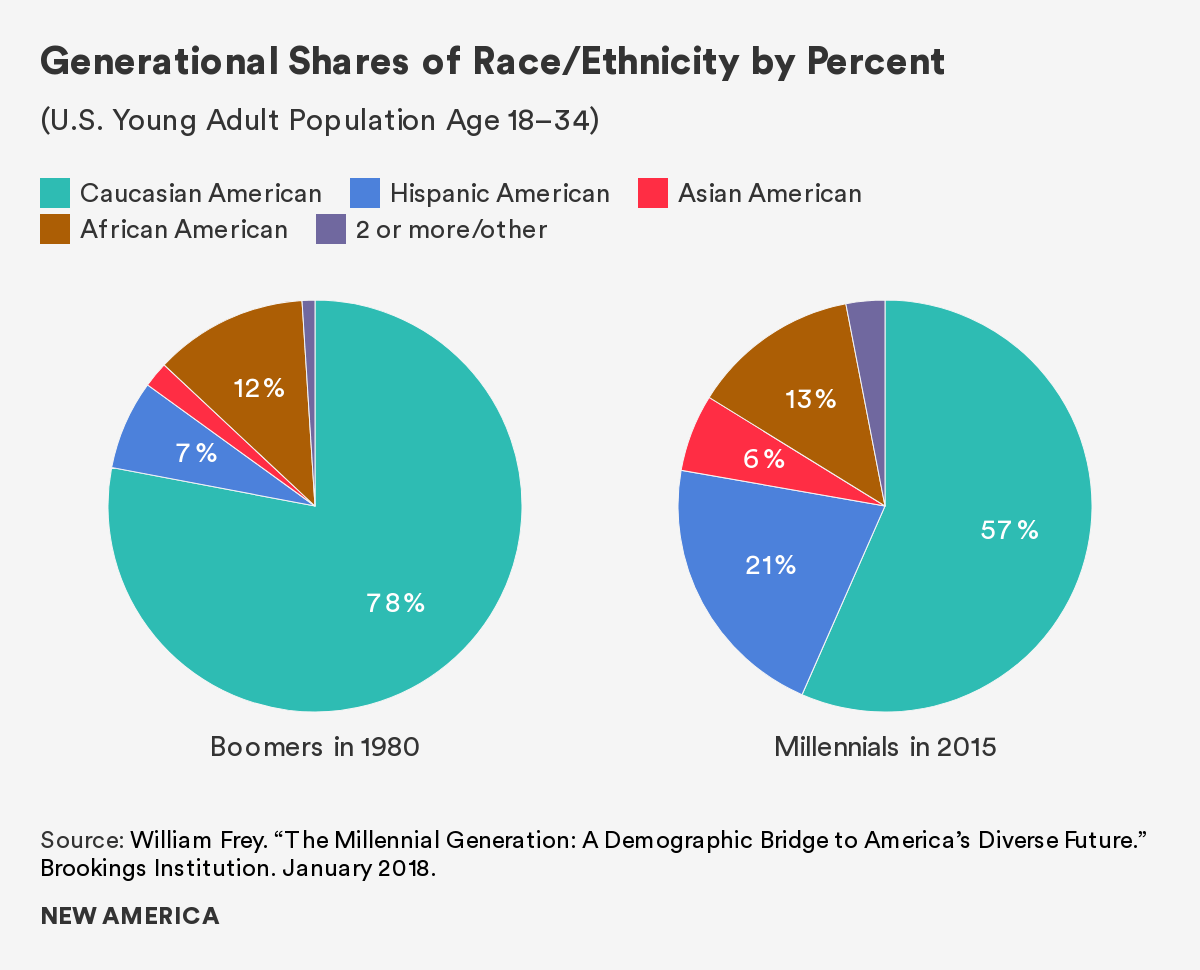
Although Americans of European origin remain the largest among racial and ethnic groups, they will soon no longer be a majority of the country. The Pew Research Center estimates that this will happen by 2055. Specifically, the Hispanic and Asian American slices of the population pie are dramatically increasing, predicted to triple over the next 40 years. While 9 percent of Boomers identify as Hispanic, 19 percent of Millennials identify as being of Hispanic (or Latinx) origin.8 Given current trends, the population of Asian Americans is expected to exceed the total population of African Americans by 2055.
These trends are making the Millennial generation more diverse than its predecessors in a number of respects—such as their country of family origin, languages spoken at home, and patterns of marriage and child rearing—all reflecting a wider range of experiences among the rising generation of Americans.
The experiences of Millennials from newer minority groups are particularly distinct, as both Asian American and Hispanic American Millennials are overwhelmingly made up of first- and second-generation Americans. Immigration by members of these and other groups has been both a primary driver of population growth in the U.S. and a source of diversity. In fact, the share of the U.S. population that is foreign born is among the highest in the world, approximately 14 percent today as compared to 5 percent in 1965.9 The 2015 Census Report predicts that the percentage of the U.S. population that is foreign-born will continue to increase, reaching 19 percent by 2060. More specifically, well over half of Asian American Millennials are foreign born, compared with 36 percent of Hispanic Americans, 10 percent of Blacks, and fewer than 4 percent of Whites. At home, the share of those speaking a language other than English has increased from 11 percent in 1980 to 25 percent in 2015. For Hispanic and Asian American Millennials, more than seven in 10 speak a language other than English with their families.
Since members of these ethnic groups tend to live in proximity, there is a geographic dimension to Millennial diversity. Racial and ethnic minorities make up more than half of the Millennial population in 10 states, including Texas, Arizona, Florida, Georgia, and New Jersey. In another 10 states, minorities account for more than 40 percent of Millennial residents (New York, Illinois, Virginia, and North and South Carolina). Only nine states are home to largely (over 80 percent) White Millennial populations, including Wyoming, Iowa, West Virginia, and Maine.
Given these demographic trends, the transition to a country with more racial and ethnic diversity will continue. Not only have immigrants added to the population generally, but their higher fertility rates are offsetting the steady declines in fertility among native-born women. Without the growth of Hispanic American children, the nation’s child population would have declined from 2000 to 2010.10 Beginning in 2011 and continuing through this year, the majority of babies born in the United States have parents who were traditionally identified as minorities.
Though 75 percent of older Americans—those over age 55—were White in 2015, this percentage drops to half for children under the age of 5.11This means that in only a few years, most children in the United States will likely identify as something other than White.
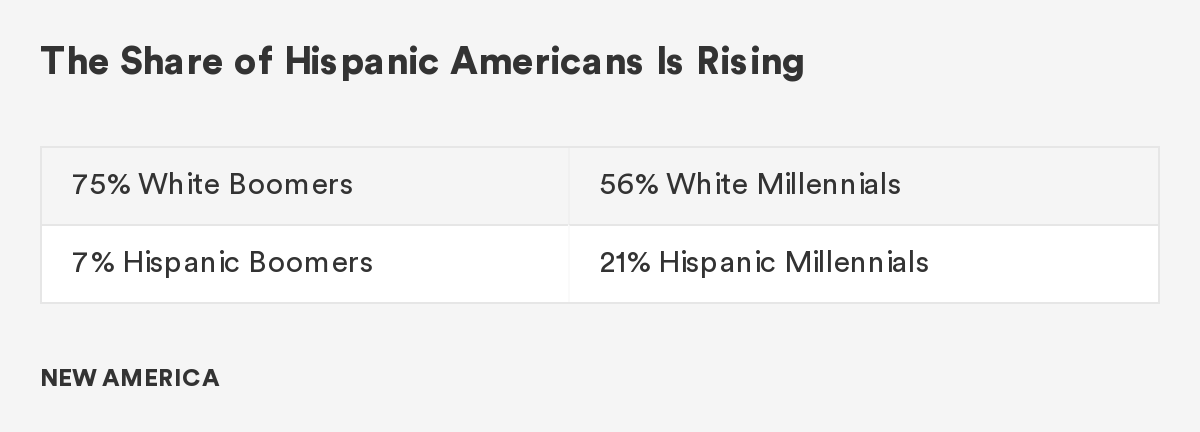
This change is reflected in the rising number of people in the country who identify as Hispanic American. While only 7 percent of Baby Boomers were of Hispanic origin, this has tripled to 21 percent of Millennials. The cultural experience is decidedly different, as most White Baby Boomers were born when immigration to America was historically low, and those who did arrive were mostly White Europeans. At that time, the country’s minority population was mostly African Americans, and there was widespread residential segregation. Today Millennials are heralding the arrival of a new national demography. In the near term, the working population will increasingly have more racial and ethnic diversity, while the nonworking will be overwhelmingly White Baby Boomers. This is creating what demographer William Frey has called a “cultural generation gap,” triggered by the transformation from the “mostly white baby-boom culture that dominated the nation during the last half of the 20th century to the more globalized, multiracial country that the United States is becoming.” With the growing share of racial and ethnic minorities among the young adult population, the country’s future diversity is foreshadowed. In the long term, this new demography will undermine generalizations, remake institutions, and change the country.
Divergent Experiences among the Millennial Generation
The Millennial generation is not monolithic. No generation is, but the combination of their unique demographic composition and the extended impact of the Great Recession have sparked a divergence from past trajectories. Transitioning to adulthood in the years following the financial crisis has had an impact on financial health, which in turn influenced behaviors and life choices that have become a source for many of the divergent experiences that have defined the Millennial generation.
Millennials in the New Socioeconomic Landscape
Initially the financial crisis eroded the value of a large set of assets, which collapsed the overall distribution of wealth. As the stock and real estate markets recovered, inequality rose as those with significant asset holdings did comparatively better, while the majority, and especially young adults, had to navigate a tough economy. For Millennials, entering the workforce immediately after the Great Recession has dramatically altered work and employment trajectories. The labor market consequences have been large, negative, and long lasting.12
In 2007, before the economic downturn, more than 50 percent of college graduates had a job offer lined up when they graduated; for the class of 2009, fewer than 20 percent did.13 The subsequent job losses and the slow recovery, reflected in an unemployment rate that stayed above 8 percent until 2013, have depressed incomes and undermined workforce attachment. Today, over half of the unemployed are young adults, greatly exceeding their share of the workforce. While the unemployment rates have come down in recent years, and currently are near historic lows, wages have barely increased and the labor force participation rate for those between the ages of 18 and 34 remains near its lowest level in four decades.14
Since the Great Recession, young people have experienced substantial declines in labor force participation, which was above 65 percent until 2000, and then dropped to 54.9 percent by 2014.15 These changes have been driven by two distinct dynamics. More young people choose to stay in school, complete high school, and pursue postsecondary education. As a result, Millennials are better educated and credentialed than their predecessors, and may be more skilled as they approach their prime working years. In 1960, only 11 percent of those aged 25 to 29 had a college degree; by 2015, this share had risen to 36 percent.16 Unfortunately, Millennials have had to pay dramatically more in tuition as the costs of going to college and graduate school have risen and access to loans has declined. At the same time, there were increases in the number of people not engaged in education, employment, or training who also had a high school degree. Incorporating people from this group into the future labor force may prove difficult.
These trends have translated to lower incomes generally for the Millennial cohort. In the aggregate, Millennials currently earn 20 percent less than Boomers did at the same stage of life, despite being better educated.17 Specifically, the median earnings today for 18- to 34-year-olds are lower than they were in 1980, and income flows are more volatile.18 Between 1970 and 2002, the probability that a working-age American would unexpectedly lose at least half her family income more than doubled.19 A rise in freelance and contract work associated with employers’ drive for flexibility has shortened employment tenure, weakened access to employee benefits, and contributed to an overall decline in income.
Poverty remains pervasive. Millennials were more likely to be living in poverty than Gen-Xers and Baby Boomers at similar ages, with one in five Millennials officially classified as poor.20 From 1979 to 2014, the poverty rate among young workers with only a high school diploma more than tripled to 22 percent.21 Beyond distinctions in educational attainment, race and ethnicity continue to be associated with large differences in economic outcomes.
Changing Milestones of Adulthood
Poor finances appear to be playing a role in redefining how Millennials mark reaching adulthood. Specifically, Millennials today are less likely to marry than their parents. When they do, they do so later. The median age for a first marriage today is about five years older than it was in the 1960s.22 Among young adults, cohabitation with a committed partner is increasingly common, rising to over 9 percent today from around 6 percent in 1997.23 In recent years, the social acceptance and legal sanction of same-sex marriages has created new opportunities for family formation, as has the rise in interracial marriage, which has increased from 5 percent in 1980 to 14 percent in 2015. Still, Millennials are less likely to form independent households; instead, more of them are opting to live with their parents, relatives, or other unrelated adults than previous generations.
Regardless of marital status, child rearing is on the decline. The overall birth rate hit a record low in 2018, dropping for the seventh straight year.24 Today’s fertility rate is 1.72 percent, significantly below the “replacement” rate of 2.1 percent. Only 29 percent of women ages 18 to 29 have ever had children, down from 41 percent in 1998.25 Some of these declines may be attributed to trends that began before the Great Recession took hold, including the rise in women’s labor force participation and pursuit of higher education, along with greater access to birth control and fewer teen pregnancies.
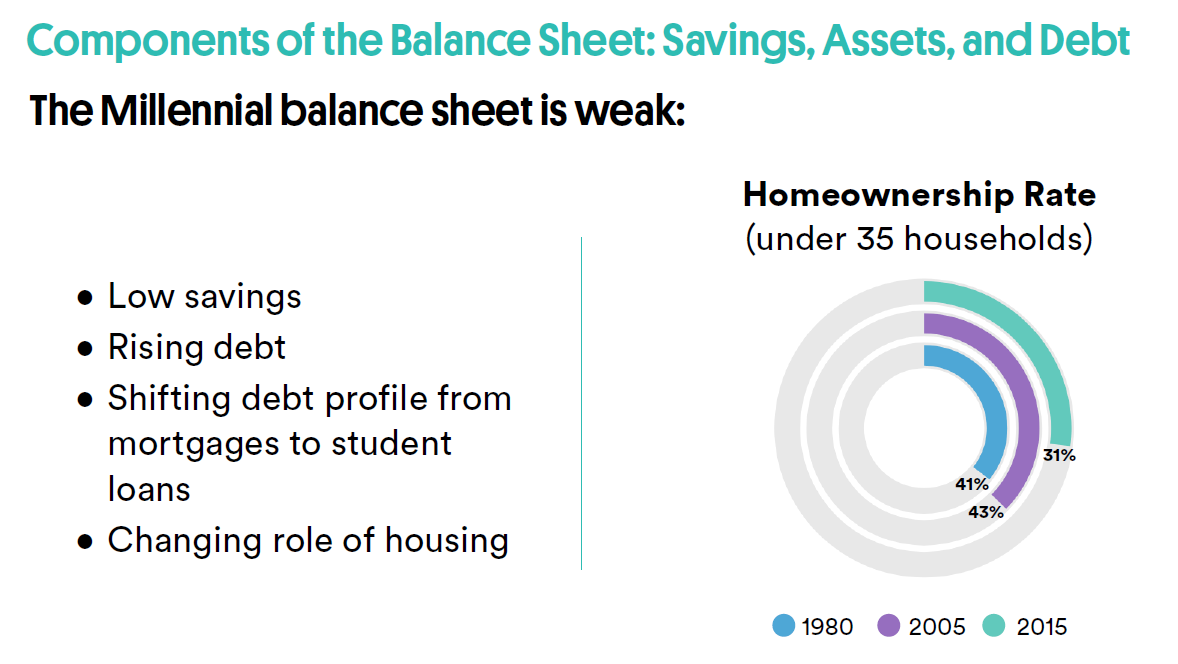
Along with fewer children, marriages, and independent households, fewer Millennials have become homeowners compared to previous generations at the same age. While the homeownership rate peaked at 47 percent in 2005, it fell to 37 percent by 2015. In addition to changing preferences, the severity of this decline likely reflects the increased difficulty in saving for a down payment or qualifying for a mortgage loan, which became progressively harder in the years following the financial crisis.
These trends in marriage, children, and home purchase—previously key features of the American Dream—provide hints at the new economic realities that are complicating how young people assemble the traditional building blocks of success. The divergent outcomes experienced by Millennials have made financial security its own aspiration.
Diverse Outcomes among Communities of Color
To acknowledge the diversity of the Millennial generation is to acknowledge that the experiences of Millennials of color are particularly distinct—and perilous. Specifically, Millennials of color are faring decidedly worse than many White and Asian American Millennials on a number of socioeconomic measures, such as educational attainment, employment levels, household income, and homeownership rates.26
While the economy and employment levels have gained ground in recent years since the post-recession lows, poverty levels for African Americans and Hispanic Millennials, aged 25–34, are 24 percent and 21 percent respectively, far outpacing the 11 percent poverty rate for White Millennials.27 Among Millennials of color, unemployment rates are substantially higher, as is involvement with the criminal justice system.
Given the range of these socioeconomic outcomes, race and ethnicity should be included as an essential component of any generational analysis. Taking a closer look at the impact of race and ethnicity on a person’s financial profile reveals clear disparities in some of the fundamental components that make up a person’s balance sheet, such as amount of savings, homeownership status, and debt levels. These analyses offer an opportunity to break down simplistic explanations of universal experience and increase our understanding of the diverse variables contributing to the emerging Millennial wealth gap.
The Emerging Millennial Wealth Gap
The most recent findings from the Federal Reserve Board’s Survey of Consumer Finances confirm that the wealth holdings of young adults in America today have fallen dramatically below historic trajectories. The accumulated wealth of Millennials has failed to match previous generations of young adults and significantly lags behind older households. Digging deeper into the data reveals several other significant factors, namely the influential experience of the Great Recession, a new dynamic between wealth and age, the continued role of homeownership, and the enduring and expanded racial wealth gap.
The Impact of the Great Recession
From a variety of perspectives, it is clear that the Great Recession was responsible for dramatic declines in wealth that were broadly experienced. Regardless of household characteristics, such as income, race, and ethnicity, and educational attainment, families lost net worth with the onset of the economic downturn. Although the recession began in 2007 and officially lasted only until 2009, the wealth of a typical family was 30 percent lower in 2016 ($97,300) than it was in 2007 ($139,000), when measured in constant dollars.28
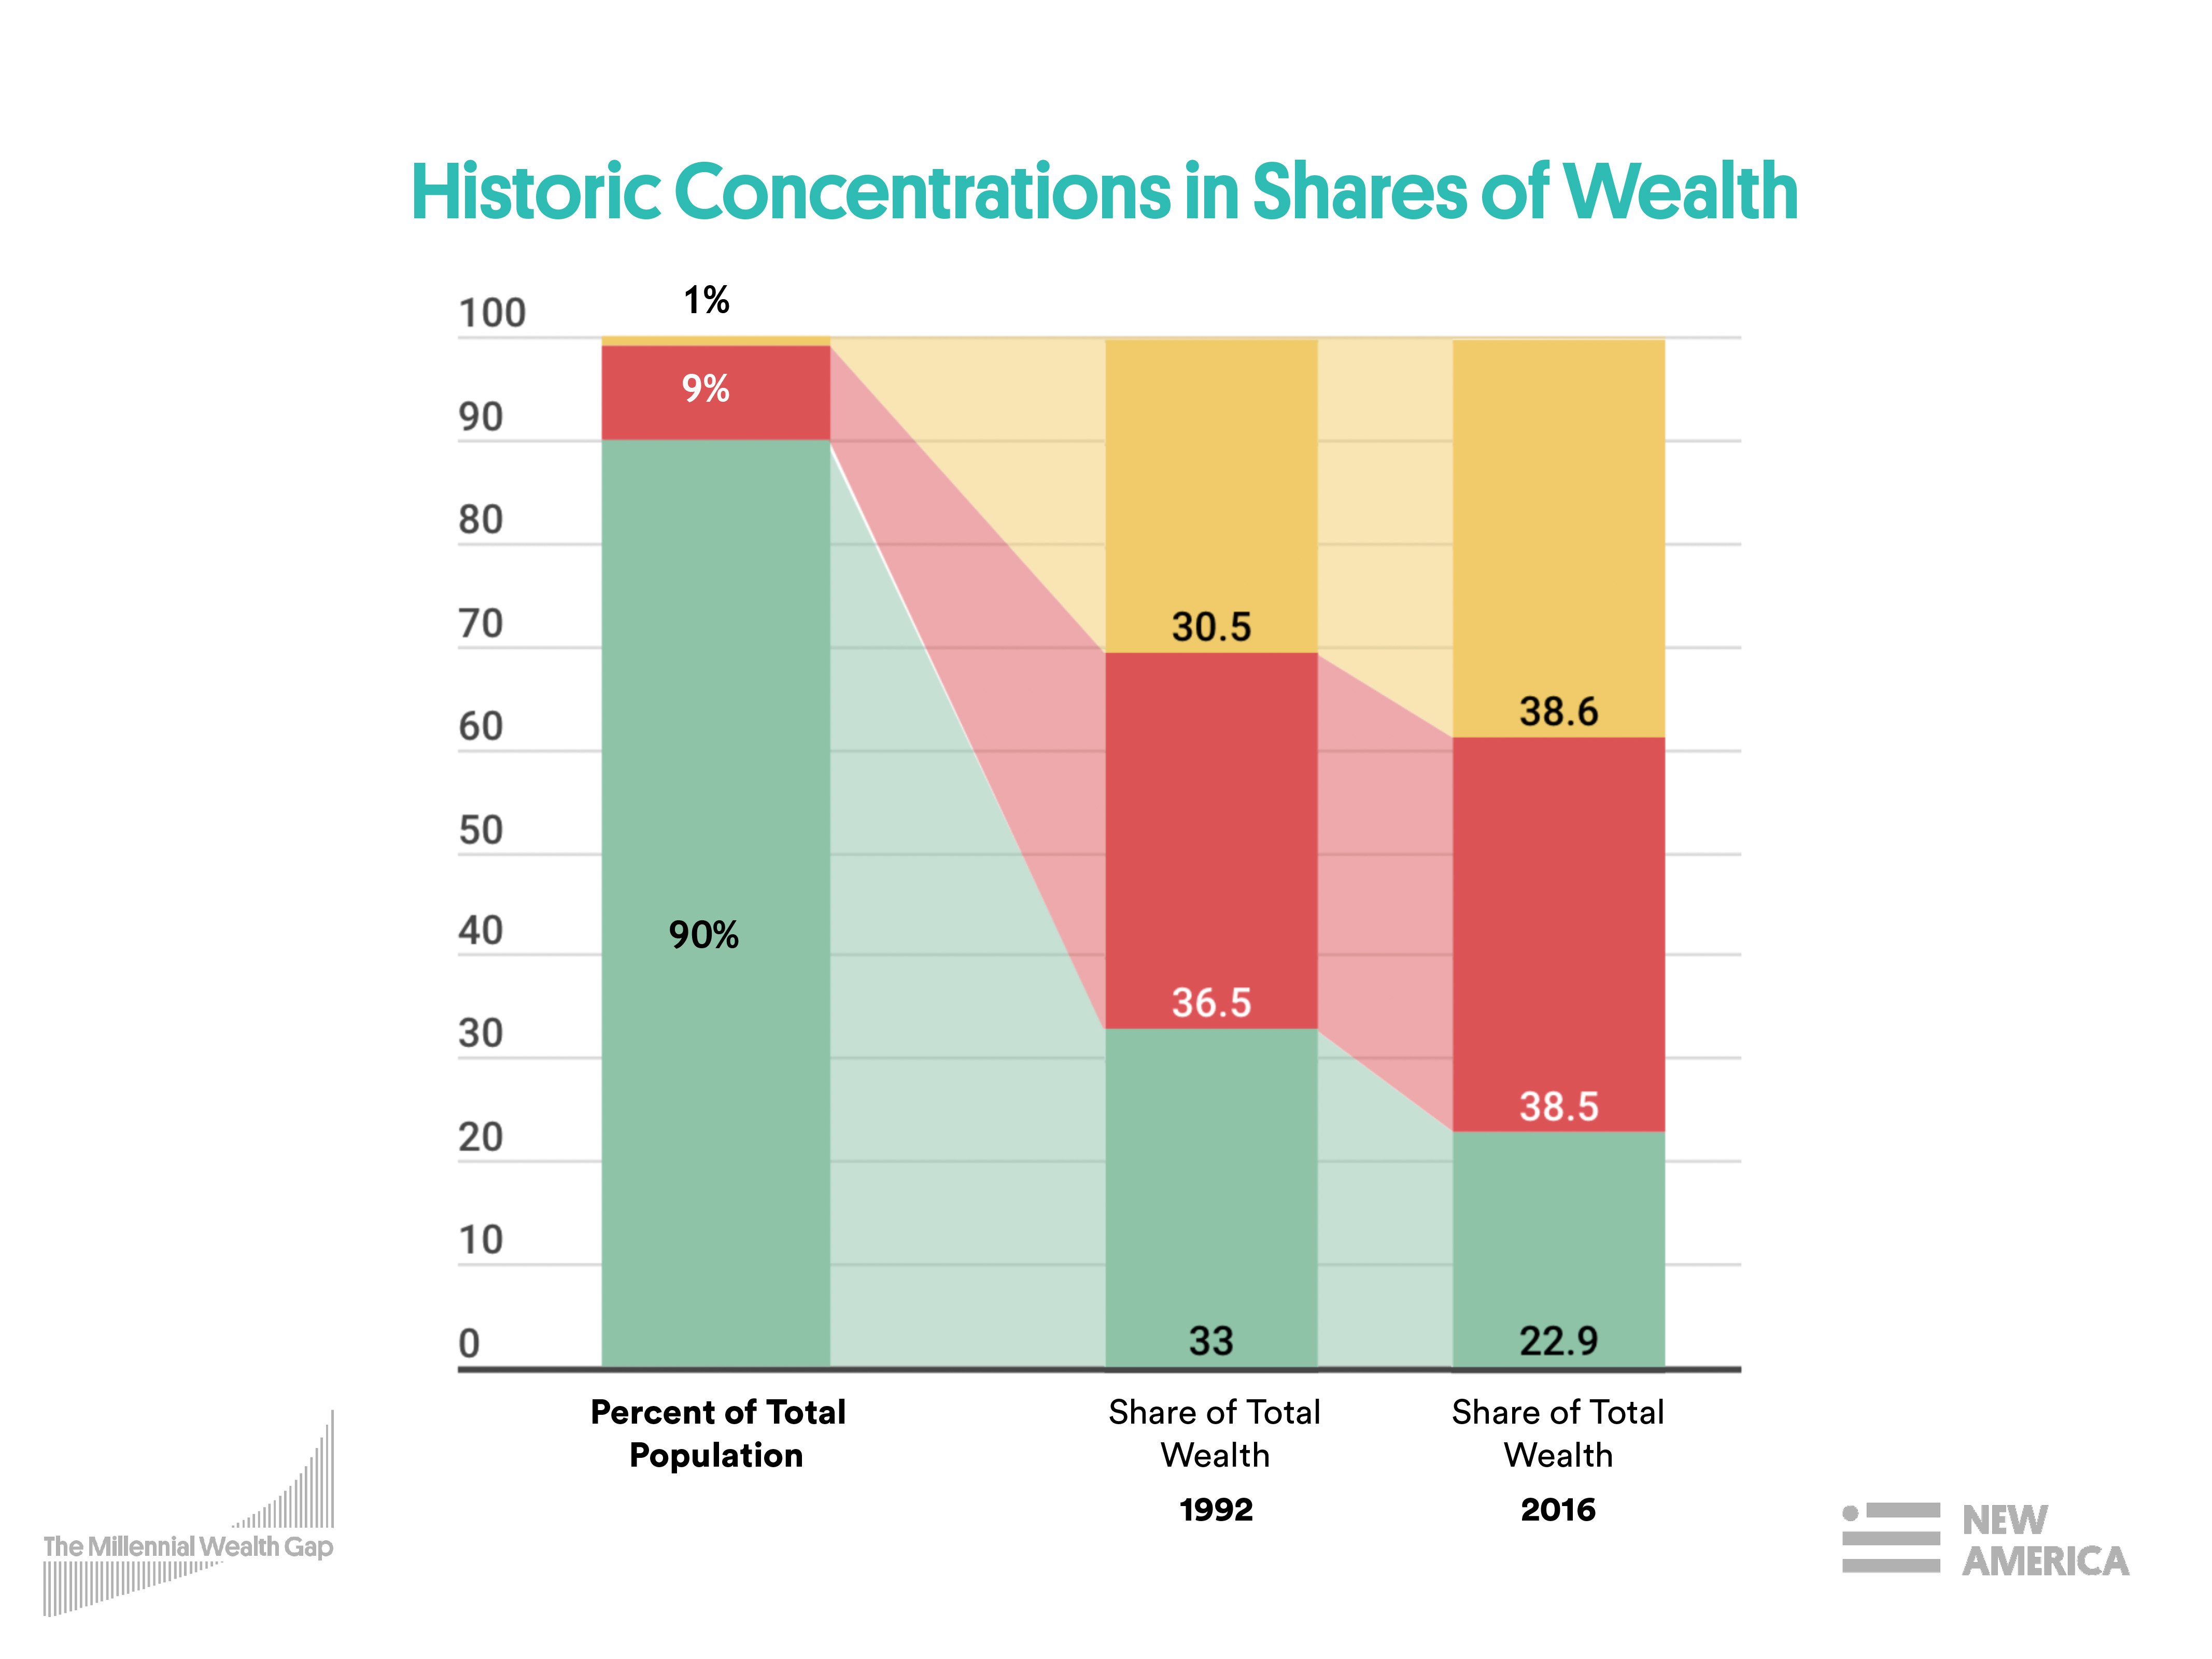
Even as the economy steadily added back jobs lost, the protracted recovery was experienced unevenly, with well-off households doing better at the expense of others. According to economists at the Federal Reserve, the concentration of “shares of income and wealth held by affluent families have reached historically high levels.”29 This is particularly apparent when looking at the top 10 percent of households, as ranked by both income and wealth.30
Ranked by income, the top 10 percent received 50 percent of the country’s total income. In 1992, this figure was 38 percent. During the same period, the top 1 percent of income earners have fared even better, doubling their share. They garnered 24 percent of total income in 2016, up from 12 percent in 1992. Ranked by wealth, the richest 10 percent held over 77 percent of wealth, while the richest 1 percent of households owned almost 40 percent of the nation’s wealth in 2016. In 1992, it was 30 percent. Conversely, the wealth share of the bottom 90 percent of families has been falling over the past 25 years, dropping from 33 percent in 1989 to 23 percent in 2016.
Divergent Fortunes of the Young and the Old
Beyond these levels of concentration at the top, a snapshot of the wealth distribution as grouped by age offers an indication of a new life cycle pattern for the typical family. While there remains evidence of increasing assets as a head of household ages through their mid-30s to mid-50s, median wealth has continued to grow for households aged 75 and older, and it has done so at a higher rate. This is remarkable, since it counters the expectation that these households will begin to draw down on their wealth as they leave the workforce and their incomes decline.
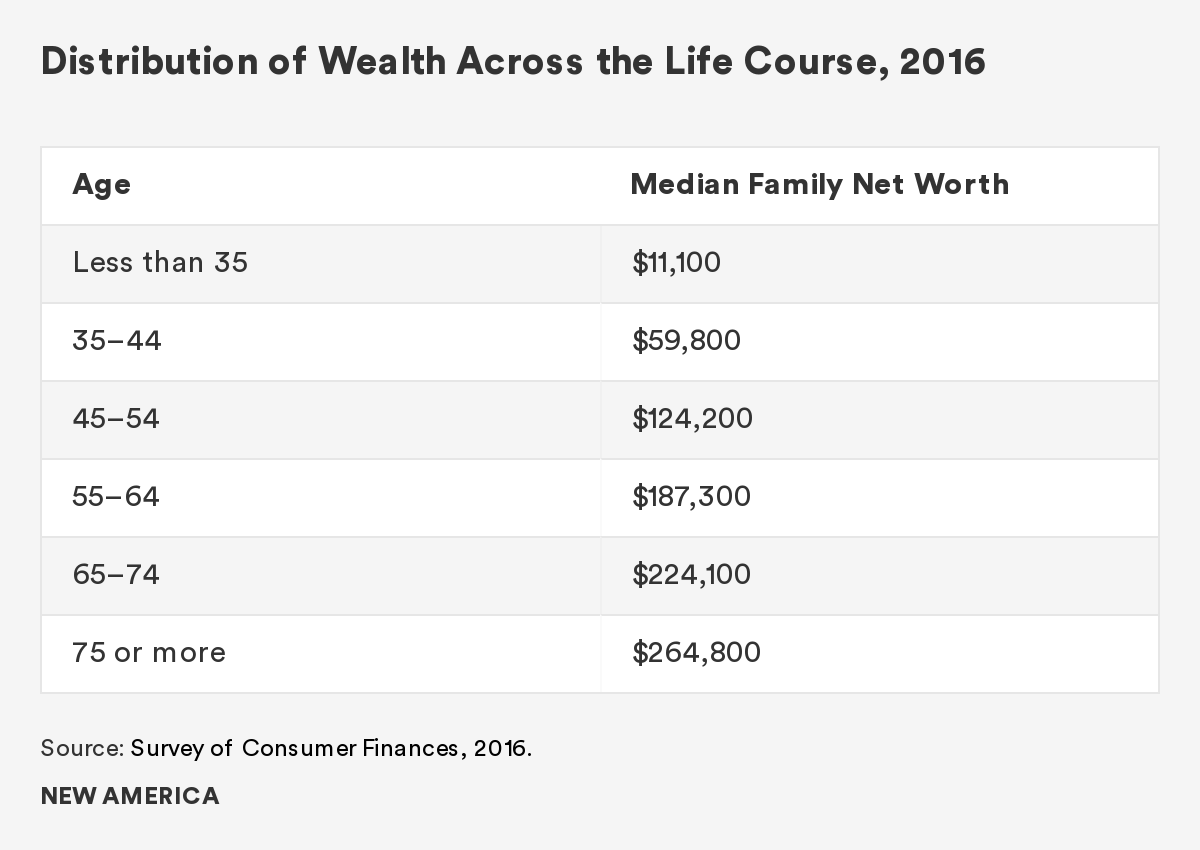
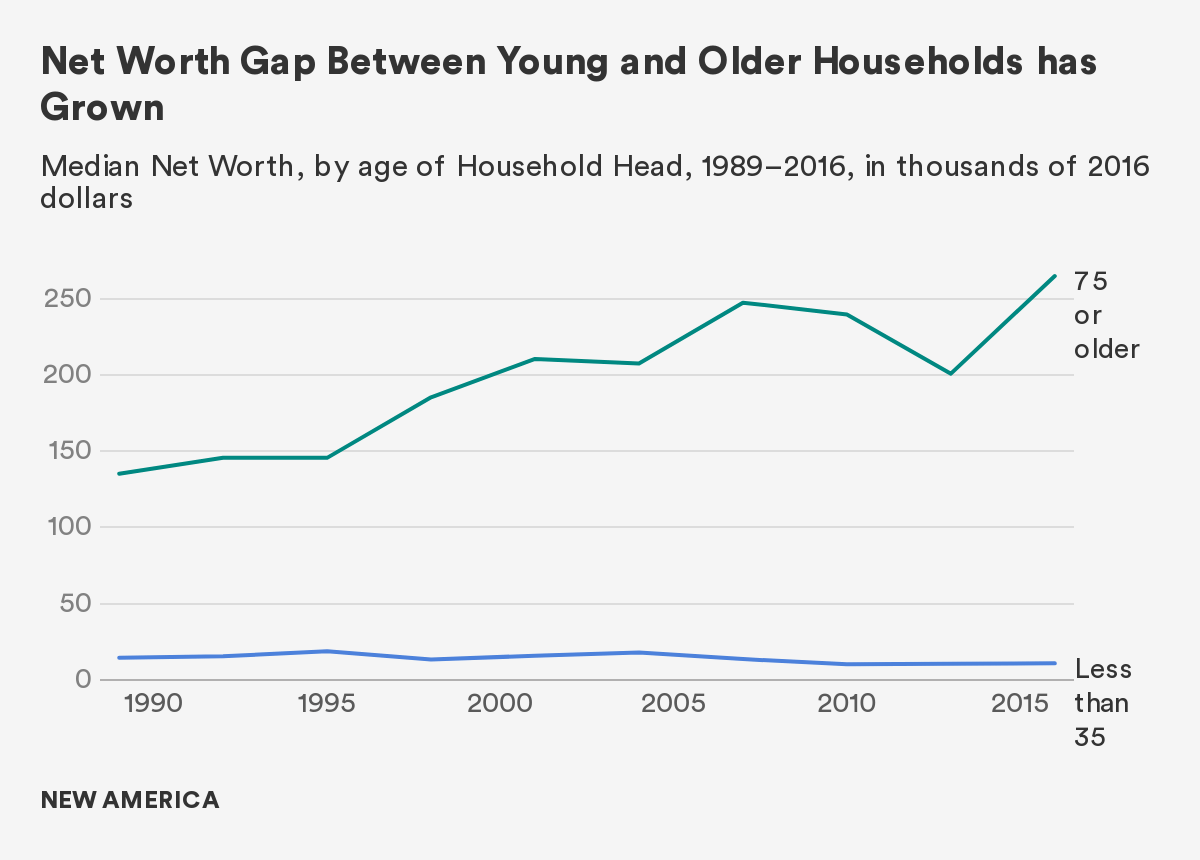
While the net worth for all households has increased by 16 percent from 2013 to 2016, young families haven’t fared as well. The median net worth for families headed by a person under the age of 35 is $10,900, which is a 2 percent rise over the previous three years but still $8,000 less than it was in 1995, a 41 percent decline (in 2016 dollars).31 In contrast, households over age 75 have seen their wealth dramatically rebound, rising 32 percent in the last three years to $264,000.32
For families headed by an individual under the age of 35, net worth was 41 percent lower in 2016 than 1995. In contrast, households headed by someone over age 75 have seen their wealth rise. The recent growth of net worth among older households has been especially pronounced. It has increased 32 percent from 2013 to 2016, reflecting new growth in the generational wealth gap.
In their analysis of the historic links between birth year and wealth, economists from the Center for Household Financial Stability at the Federal Reserve Bank of St. Louis identified the amount of wealth we would expect a family to own at each age. They found that typical families headed by someone born in the 1960s, 1970s, and 1980s were “significantly below their wealth benchmarks in 2016.”33 More specifically, the 32-year-old cohort remained 34 percent below predicted levels in 2016. Alternatively, families headed by someone older (cohorts born in the ’50s, ’40s, and ’30s) were significantly above their age-specific targets.34
Another indication of trouble for Millennials revealed by their analysis is that the typical 32-year-old lost further ground between 2010 and 2016, a period of generally rising asset values in the stock and housing markets, while older cohorts saw their balance sheets strengthen. This leads them to conclude that while all age groups lost wealth after the Great Recession, younger families suffered the steepest losses, and are regaining lost ground more slowly.35 Since these younger families are entering or are in their prime earning years, this raises the question of whether they will be able to get back on track or risk becoming a “lost generation” in terms of wealth accumulation.
Rising Debt but Declining Homeownership
Rather than wealth, Millennials are accumulating debt. Not only does the typical Millennial have higher debt relative to both their income and their assets than any other previous generation at the same age, but their debt profile is distinct. In previous generations, starting families and forming households was associated with buying homes and taking out a mortgage. For Millennials, other forms of debt have replaced mortgage debt, including student loans, car loans, and credit card debt. These types of consumer debt cannot be used to finance the purchase of assets, like homes, that can appreciate in value. While there are advantages to investing in human capital development, student loans cannot be leveraged directly to boost wealth on the balance sheet.
Over time, it may turn out that Millennials will benefit from responding to the recession by staying in school and pursuing more postsecondary degrees. They are clearly better educated and credentialed than earlier generations. However, this debt and delayed earnings have created a weak generational balance sheet and prevented more of them from the experience of homeownership, which is one of the most significant predictors of future wealth building.
The declines in homeownership may be especially consequential, in that they could pose an enduring challenge for Millennials’ wealth building. This is because for those families that do accumulate significant wealth holding, owning a home is often the largest asset on the family balance sheet—so much so that it is relatively uncommon for renters to accumulate even average amounts of wealth. While the typical homeowner had a net worth of $231,400 in 2016, the typical renter had a net worth of $5,200, making this single variable among the most significant in explaining different wealth trajectories among American households.
The disparity in wealth holdings among renters and homeowners should prompt a series of policy questions—e.g., what are the current impediments to homeownership? Are there alternative leverage opportunities besides housing to build wealth? How has historic discrimination against race and ethnicity groups historically cut off avenues to wealth building,s and what should be done about it now?
This last question is especially pertinent because homeownership rates vary significantly by race and ethnicity. As of 2016, homeownership rates ranged from approximately 45 percent for Black and Hispanic families to 73 percent for White families. Among those who do own their homes, White families have more housing equity ($215,800), compared to Hispanic families ($129,800) or Black families ($94,400).36 The racial wealth gap has been an enduring feature of American society, and with the increasing diversity of the rising generations, it is one of the primary drivers of the emerging Millennial wealth gap.
While subsequent chapters in this book will present a deeper analysis of both Millennial debt and declines in home purchases, the main point here is that these trends reflect the extent to which Millennials are in a fundamentally different economic “place” than previous generations. They are on a lower trajectory of asset building.
The Racial Wealth Gap
Describing the racial wealth gap with numbers on a balance sheet doesn’t do justice to the historic legacy of slavery and the entire African American experience. The history is brutal. Nor does it capture the experiences of the native people of the Americas, or those of the immigrant families of non-European origins who came to America from across the globe. Still, using the tools and categories of social science and economics to aggregate and broadly compare experiences among racial and ethnic groups in America is dramatically revealing. The racial wealth gap is a chasm, with roots at the core of American history, culture, and economy.
Throughout the country’s past, the traditional paths to wealth building—land, higher education, access to credit, and homeownership—have been systematically denied to African-Americans and other non-White persons. Even when wealth and resources have been accrued, they have also been systematically stripped through land theft and lynching. Disparities in wealth among race and ethnic groups in the U.S. are, simply put, enormous. It is this historic racial wealth gap, with its devastating consequences, that is compounding the emergence of the Millennial wealth gap launched by the Great Recession.
The most recent available data from the Federal Reserve’s Survey of Consumer Finances shows that in 2016 the median net worth of non-Hispanic White households was $171,000, almost 10 times the net worth of Black families ($17,600) and over eight times the net worth of Hispanic households ($20,700).37 For all race and ethnicity groups, the mean is substantially higher than the median, which reflects the concentration of wealth among the wealthiest in each category.
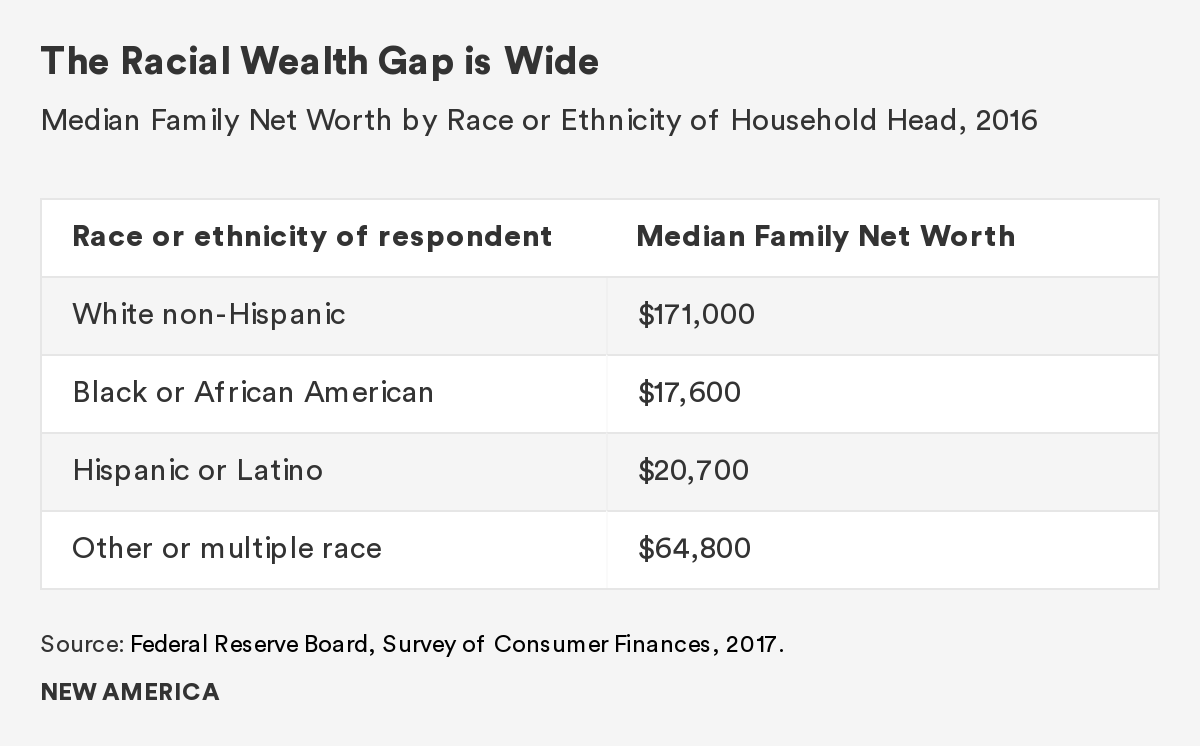
The racial wealth gap in 2016 is larger than it was in the early 2000s, when the average non-Hispanic White household had “only” six to seven times the wealth of the average African American household.
Looking exclusively at “median” or “average” figures masks variation. Although most families do have some wealth, some have zero or negative wealth (where debts exceed assets). These shares vary by race/ethnicity. Almost 20 percent of Black households and 15 percent of Hispanic households had zero or negative net worth, compared with 9 percent for White households.38
These outcomes cannot be viewed in isolation from the history of race in America. To take one example, housing, the earliest federal homeownership programs that began in the 1930s prevented minorities from accessing mortgage financing that enabled White families to build their wealth through housing equity. The Fair Housing Act of 1968, passed in the days following the assassination of Martin Luther King, Jr., made this discrimination illegal, and modest gains in homeownership for families of color eventually followed. Unfortunately, less attention was paid to policing the financial services marketplace, which allowed predatory lending practices and poor mortgage underwriting to spread without oversight.
As the housing market collapsed with the advent of the Great Recession, Black homeownership rates fell more than non-Hispanic Whites’, and their houses lost more value. In 2017, homeownership for Black American households was 28 percent lower than it was for non-Hispanic Whites, and many of the gains in Black homeownership since the Fair Housing Act was passed have been erased.39
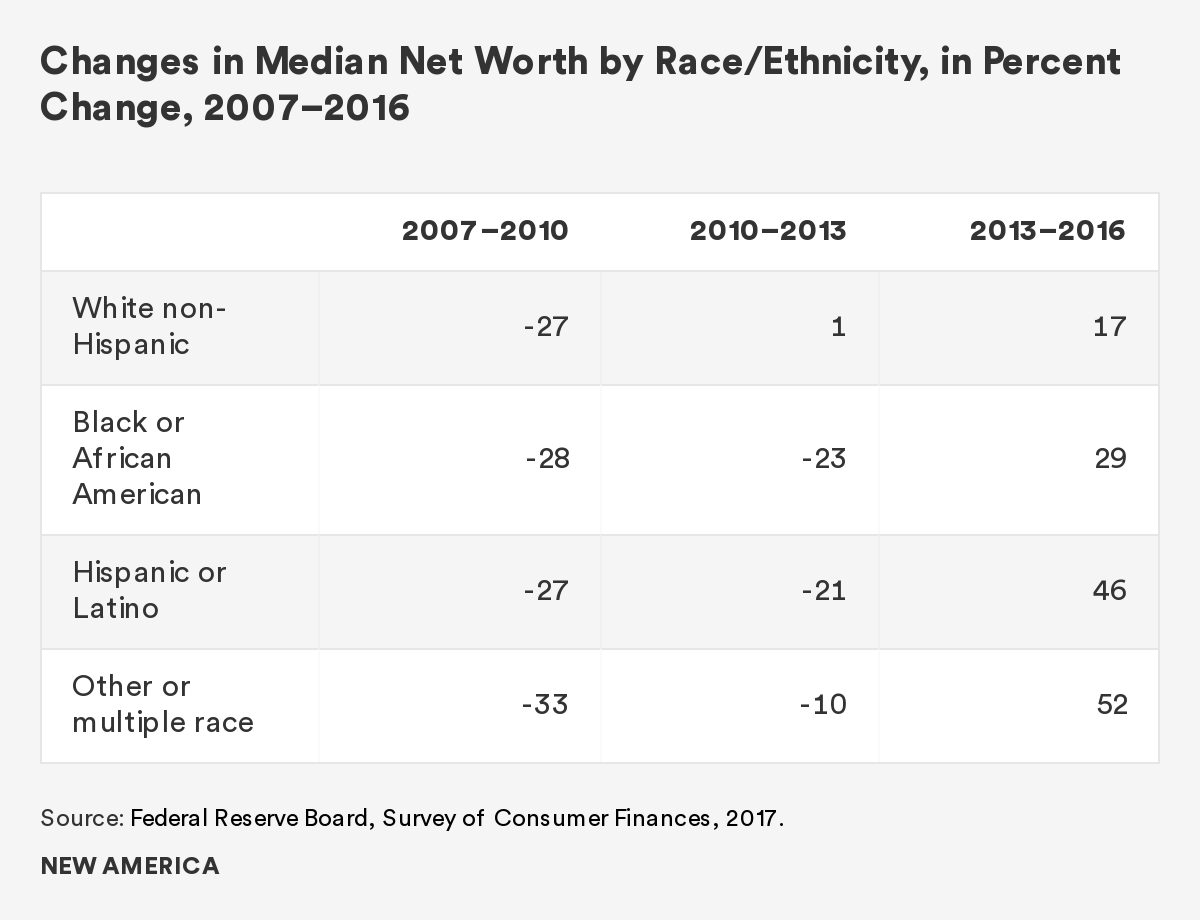
Not only did the Great Recession wipe out gains that had been made by communities of color in terms of their collective wealth holdings, but also for many minority families it has been harder to navigate the aftermath. While all groups lost net worth after the Great Recession, White families began to recover between 2010 and 2013, while minority families continued to experience net worth declines. It took until the 2013–16 period for all groups to experience gains. In fact, minority groups outpaced gains by White families over this period, but their delayed recovery reflects another source of inequality.
Additionally, declines in homeownership have been most pronounced for younger Black households. According to the Urban Institute, the homeownership rate for families headed by Black Americans between the ages of 35 and 44 fell from 45 percent in 1990 to 33 percent in 2015, lower than the Black homeownership rate in 1960.40 On top of that, in recent years, only 22 percent of younger Black Americans aged 24 to 34 were homeowners.41
Beyond homeownership, there are many variables that appear to influence wealth accumulation, which also vary by race and ethnicity. For example, 60 percent of White families own a retirement security account, while only 34 percent of Black families and 30 percent of Hispanic families do.42 Additional factors that vary by race and ethnicity are family formation, postsecondary education, and intergenerational transfers of money through inheritance and gifts during life. Twenty-six percent of White families report having received an inheritance, compared with 10 percent of Black and Hispanic families.43 Clearly, the historic legacy of slavery and sanctioned discrimination has undermined the ability of communities of color to build wealth and pass it along intergenerationally.
While the racial wealth gap is a long-standing feature of American society that impacts the current distribution of economic resources, there is evidence that it is not merely a historic phenomenon. As will be described in subsequent chapters, new developments have taken hold in the run-up to, and aftermath of, the Great Recession, and have exacerbated wealth disparities among racial and ethnic groups. Given the increased diversity of the Millennial generation, this new and expanded racial wealth gap deserves greater attention and should prompt a commensurate policy response.
Implications for a Policy Response
The current accumulation of wealth and its distribution are departing from previous life cycle trajectories. The data are not ambiguous. There is a dramatic generational wealth gap. Perhaps worse, the contemporary financial profile of the Millennial generation is out of step with social policy expectations that families amass a pool of economic resources that can be used to invest in their children, support their own retirement, and manage risks.
Additional evidence and analysis by a range of authors will be presented in the chapters that follow, which will explore the underlying trends shaping the generational distribution of wealth. Their work is informed by a common set of concerns and questions: How can Millennials catch up and get back on track? What policy changes can be made to help the next generation of young adults avoid this fate?
In order to fashion a policy response to the emerging Millennial wealth gap, it is instructive to acknowledge the pillars that historically have anchored the ladder of economic opportunity. These include being able to access education, skills, and training; secure a well-paying job with benefits in a growing economy; increase savings and asset ownership over time; and benefit from family gifts, inheritances, and transfers. For some, these pillars were never there at all; for others, they have weakened in the years since the Great Recession.
If we are to address wealth disparities, we will need to look broadly at these pillars, and assess how they can be strengthened to support the finances of Millennials. In doing so, there are significant advantages for targeting policies to the diverse race and ethnic groups that constitute the Millennial generation. Specific policy ideas are considered in the final chapter of this book, but regardless of the details, there is a strong case to be made for focusing the attention of policymakers on creating new pathways to financial progress, for both the current generation of Millennials and those who will follow.
References
Addo, Fenaba et al. 2016. “Young, Black, and (Still) in the Red: Parental Wealth, Race, and Student Loan Debt.” Race and Social Problems 8(1):64–76.
Addo, Fenaba. March 2018. “Parents’ Wealth Helps Explain Racial Disparities in Student Loan Debt.” In the Balance: Perspectives on Household Balance Sheets. Center for Household Financial Stability, Federal Reserve Bank of St. Louis.
Allen, Reniqua. 2019. It Was Just a Dream: A New Generation Confronts the Broken Promise to America. New York: Nation Books.
Altonji, Joseph, Lisa Kahn, and Jamin Speer. 2016. “Cashier or Consultant? Entry Labor Market Conditions, Field of Study, and Career Success.” Journal of Labor Economics.
Bialik, Kristen and Richard Fry. 2019, February 14. “Millennial File: How Young Adulthood Today Compares with Prior Generations.” Pew Research Center.
Braga, Breno, Signe-Mary McKernan, Caroline Ratcliffe, and Sandy Baum. April 2017. “Wealth Inequality is a Barrier to Education and Social Mobility.” The Urban Institute.
Bricker, Jesse, Lisa J. Dettling, Alice Henriques, Joanne W. Hsu, Lindsay Jacobs, Kevin B. Moore, Sarah Pack, John Sabelhaus, Jeffrey Thompson, and Richard A. Windle. September 2017. “Changes in U.S. Family Finances from 2013 to 2016: Evidence from the Survey of Consumer Finances.” Federal Reserve Bulletin. Vol. 103, No. 3. Washington: Board of Governors of the Federal Reserve System.
Canon, Maria, Marianna Kudlyak, and Yang Liu. 2015, January 26. “Youth Labor Force Participation Continues To Fall, but It Might Be for a Good Reason.” Federal Reserve Bank of St. Louis.
Cohen, Cathy J., Matthew Luttig, and Jon Rogowski. June 2017. “The Economic Lives of Millennials.” GenForward.
Cohen, Cathy J. and Jon Rogowski. 2015. “Black Millennials in America: Documenting the Experiences, Voices, and Political Future of Young Black Americans.” Center for the Study of Race, Politics, and Culture at the University of Chicago. Black Youth Project.
Cramer, Reid. 2018. “The Case for Crafting a Millennial Public Policy Agenda. In The Millennials Initiative 2018: New Voices and Ideas on Care, Community, Technology, and Civic Engagement. Edited by Reid Cramer and S. Melody Frierson. New America.
Desilver, Drew. 2016. “10 Facts about American Workers.” Pew Research Center.
Dettling, Lisa, Joanne W. Hsu, Lindsay Jacobs, Kevin B. Moore, and Jeffrey P. Thompson. 2017, September 27. “Recent Trends in Wealth-Holdings by Race and Ethnicity: Evidence from the Survey of Consumer Finances.” FEDS Notes. Washington: Board of Governors of the Federal Reserve System.
Dimock, Michael. 2018, March 1. “Defining Generations: Where Millennials End and Post-Millennials Begin.” Pew Research Center.
Emmons, William, Ana Hernández Kent, and Lowell Ricketts. May 2018a. “A Lost Generation? Long Lasting Impact of the Great Recession on Young Families.” Essay No. 2, The Demographics of Wealth, 2018 Series. Center for Household Financial Stability, Federal Reserve Bank of St. Louis.
Emmons, William, Ana Hernández Kent, and Lowell Ricketts. May 2015a. “Race, Ethnicity, and Wealth.” Essay No. 1, The Demographics of Wealth, 2015 Series. Center for Household Financial Stability, Federal Reserve Bank of St. Louis.
Federal Reserve Board. 2017. Survey of Consumer Finances.
Fishman, Rachel. 2018. The Wealth Gap PLUS Debt: Hoe Federal Loans Exacerbate Inequality for Black Families.” New America.
Frey, William H. January 2018. “The Millennial Generation: A Demographic Bridge to America’s Diverse Future.” Brookings Institution.
Frey, William H. January 26, 2018. “Old Versus Young: The Cultural Generation Gap. Trend. Winter 2018. The Pew Charitable Trusts.
Fry, Richard. 2018, March 1. “Millennials Projected to Overtake Baby Boomers as America’s Largest Generation.” Pew Research Center.
Fry, Richard and Kim Parker. November 2018. “Early Benchmarks Show ‘Post-Millennials’ on Track to Be Most Diverse, Best-Educated Generation Yet.” Pew Research Center.
Garon, Thea, Andrew Dunn, Katy Golvala, and Eric Wilson. 2019. “U.S. Financial Pulse: 2018 Baseline Survey Results.” Financial Health Network.
Goodman, Laurie, Jun Zhu, and Rolf Pendall. February 2017. “Are Gains in Black Homeownership History?” Washington, DC: Urban Institute.
Hobbes, Michael. 2018. “Millennials are Screwed.” Huffington Post.
Huelsman, Mark. 2018. “College without Debt.” New York: Demos.
Huelsman, Mark. 2018. “Social Exclusion: The State of State U for Black Students.” Demos.
Jacobs, Elisabeth and Liz Hipple. 2018. “Are Today’s Inequalities Impacting Tomorrow’s Opportunity.” Washington Center for Equitable Growth.
Joint Center for Housing Studies. 2017. “Improving America’s Housing: Demographic Change and the Remodeling Outlook.”
Kalish, Emma Cancian. 2016, April 22. “Millennials Are the Least Wealthy, but Most Optimistic, Generation.” Washington, DC: Urban Institute.
Kiersz, Andy. 2014. “Millennials Aren’t Making as Much as Their Parents Did When They Were Young.” Business Insider.
Killewald, Alexandra and Brielle Bryan. 2018. "Falling Behind: The Role of Inter- and Intragenerational Processes in Widening Racial and Ethnic Wealth Gaps through Early and Middle Adulthood" Social Forces.
Kurz, Christopher, Gene Li, and Daniel J. Vine. “Are Millennials Different?” Finance and Economics Discussion Series 2018-080. Washington: Board of Governors of the Federal Reserve System.
Maag, Elaine, Elizabeth Peters, Anthony Hannagan, Cary Lou, and Julie Siwicki. “Income Volatility: New Research Results with Implications for Income Tax Filing and Liabilities.”
McCarthy, Mary Alice, Lul Tesfani, and Kim Dancy. 2018. “Paying More and Getting Less: How Nondegree Credentials Reflect Labor Market Inequality Between Men and Women.” New America.
McKernan, Signe-Mary, Genevieve Kenney, and Robert Abare. 2017, February 28. “Why Do a Larger Share of Millennials and GenX have Past-due Medical Debt Than Older Americans? Washington, DC: Urban Institute.
Mezza, Alvaro, Daniel Ringo, and Kamila Sommer. January 2019. “Can Student Loan Debt Explain Low Homeownership Rates for Young Adults?” Federal Reserve Board Division of Research and Statistics. Consumer and Community Context.
Miller, Ben. 2014. “The Student Debt Review: Analyzing the State of Undergraduate Student Borrowing.” Washington, DC: New America Foundation.
Pew Research Center. 2018. “Defining Generations.”
Pfeffer, Fabian and Alexandra Killewald. 2018, June 1. “Generations of Advantage: Multigenerational Correlations in Family Wealth.” Social Forces 96(4):1411–1442.
Resolution Foundation. 2018. “A New Generational Contract: The Final Report of the Intergenerational Commission.”
The Pew Charitable Trusts. 2018. “American Families Face a Growing Rent Burden.”
U.S. Census Bureau. April 2018. “Quarterly Residential Vacancies and Homeownership.”
Vespa, Jonathan. April 2017. “The Changing Economics and Demographics of Young Adulthood: 1975–2016.” Current Population Reports. U.S. Census Bureau.
Wething, Hilary, Natalie Sabadish, and Heidi Shierholz. May 2012. “The Class of 2012: Labor Market for Young Graduates Remains Grim.” Economic Policy Institute.
Young Invincibles. January 2017. “Financial Health of Young America: Measuring Generational Declines between Baby Boomers and Millennials.”
Citations
- Michael Dimock. “Defining Generations: Where Millennials End and Post-Millennials Begin.” Pew Research Center. March 1, 2018.
- With the arrival of young immigrants, the size of the Millennial generation will actually continue to grow, perhaps reaching 76 million by 2036, as estimated by the U.S. Census Bureau.
- Michael Dimock, 2018.
- Richard Fry, 2018.
- This is a global phenomenon. The U.S. is actually getting relatively young, as it is aging at a slower rate than other countries. The share of seniors in the U.S. is expected to increase from 13 percent in 2010 to over 21 percent by 2050. However, it may triple in countries such as Mexico and Brazil.
- Conventions continually evolve as to how to analytically describe and label racial and ethnic groups. Choices in capitalization and hyphenation mask the sociological insight that race is a social construct. The reduction of people to a color is absurd. Still, if people share experiences and outcomes, it is instructive to examine them as a group.
- William H. Frey, 2016.
- Cohen et al., 2017.
- The United States is home to more immigrants than any other country in the world—almost 43 million in 2010. Russia has the second largest immigrant population at just over 12 million.
- William H. Frey, 2018.
- William H. Frey, 2018.
- Hilary Wething, Natalie Sabadish, and Heidi Shierholz, 2012.
- Joseph Altonji, Lisa Kahn, and Jamin Speer, 2016.
- Drew Desilver, 2016. The unemployment rate does not include those in school or not actively looking for work. The labor force participation rate is the sum of all employed workers divided by the working age population.
- Canon et al., 2015.
- U.S. Census Bureau.
- Young Invincibles, 2017.
- Andy Kiersz, 2014.
- Elaine Maag et al., 2017.
- William H. Frey, 2018.
- U.S. Census Bureau. Historic Poverty Tables. 2017.
- According to the U.S. Census, the median age for a first marriage in the 1950s was 20 years old for women and 22 years old for men. In 2015, this figure rose to 27 years old for women and 29 years old for men.
- Jonathan Vespa, 2017.
- National Center for Health Statistics, 2017.
- Jonathan Vespa, 2017.
- Cohen and Rogowski, 2015.
- William H. Frey, 2018.
- The Pew Charitable Trusts, 2018.
- Jesse Bricker et al., 2017.
- Jesse Bricker et al., 2017.
- The Pew Charitable Trusts, 2018.
- The Pew Charitable Trusts, 2018.
- William Emmons, Ana Kent, and Lowell Ricketts, May 2018a.
- William Emmons, Ana Kent, and Lowell Ricketts present a more detailed analysis of changes in predicted wealth by age in their chapter.
- William Emmons, Ana Kent, and Lowell Ricketts, May 2018a.
- Dettling et al., 2017.
- Federal Reserve Board, Survey of Consumer Finances, 2017. (REVISE)
- Dettling et al., 2017.
- U.S. Census Bureau. “Quarterly Residential Vacancies and Homeownership.” April 2018.
- Goodman et al., 2017.
- Goodman et al., 2017.
- Dettling et al., 2017.
- Dettling et al., 2017.
Trends, Origins, and Implications of the Millennial Wealth Gap
William R. Emmons, Ana H. Kent, and Lowell R. Ricketts
Millennials have been the subject of great scholarly and popular discourse in recent years, and for good reasons. Using a definition of those born between 1981 and 1996, Millennials are now the largest generation in the world, and in the United States they recently surpassed the Baby Boomers to claim the largest generational share of the country’s population pie.1 In part, the focus resides on Millennials because their superior numbers are not matched by corresponding increases in a number of traditional socioeconomic markers of well-being, including household income and marriage rates. Additionally, various sources question their ability to meet longer-term financial goals, such as supporting their children’s college education, saving for retirement and investing, and owning a home.2
Today, Millennials compose the majority of the workforce, are increasingly found in leadership positions, and pay into Social Security. Companies and marketing firms study them avidly and roll out products, like avocado toast and small-batch artisan soaps, in order to attract their purchasing power. They have strength in numbers, yet their per capita consumption ability may be reduced compared to that of older groups. Indeed, as we document, Millennials are significantly behind the wealth benchmarks set by previous generations.3
Last year The Federal Reserve Bank of St. Louis Center for Household Financial Stability published The Demographics of Wealth 2018 Series to explore the links between demographics and financial outcomes. In the second essay of that series, we considered the long-lasting wealth impacts of the Great Recession on young American families. In this chapter, we summarize and extend that work by taking a deeper dive into the short-term and long-term causes of the Millennial wealth gap.
Our research shows that the wealth of the typical Millennial, defined by the median household with half of families above and half below, is much lower than would be predicted based on the wealth accumulated by previous generations at the same ages. It is no wonder that many Millennial families feel burdened by debt, disillusioned by the eroding social contract, and frustrated that the promise of the American Dream and financial stability seem out of reach.
This chapter has four parts. Section I describes our findings in the Demographics of Wealth essay and the impact of the Great Recession on the Millennial wealth gap. Section II identifies two long-term causes of the gap: a secular wealth-redistribution trend from less-educated to more-educated families, and one from younger to older families. Section III discusses the racial wealth gap and the role it plays in the Millennial wealth gap. Section IV concludes with a review of competing scenarios: an optimistic one where Millennials eventually catch up and a pessimistic one where they become a lost generation in terms of wealth accumulation.
Widespread Wealth Losses from the Great Recession
In the past 30 years, the U.S. economy has suffered three recessions; each triggered by unchecked changes in the economy: the savings and loan crisis from 1990 to 1991; the dot-com bubble recession in 2001; and the subprime mortgage crisis or Great Recession from 2007 to 2009. From the beginning to the end of each of these recessions, median household income dropped.4 Net worth (i.e., wealth), however, fell much more steeply during the Great Recession than during the earlier recessions. See Figure 1.
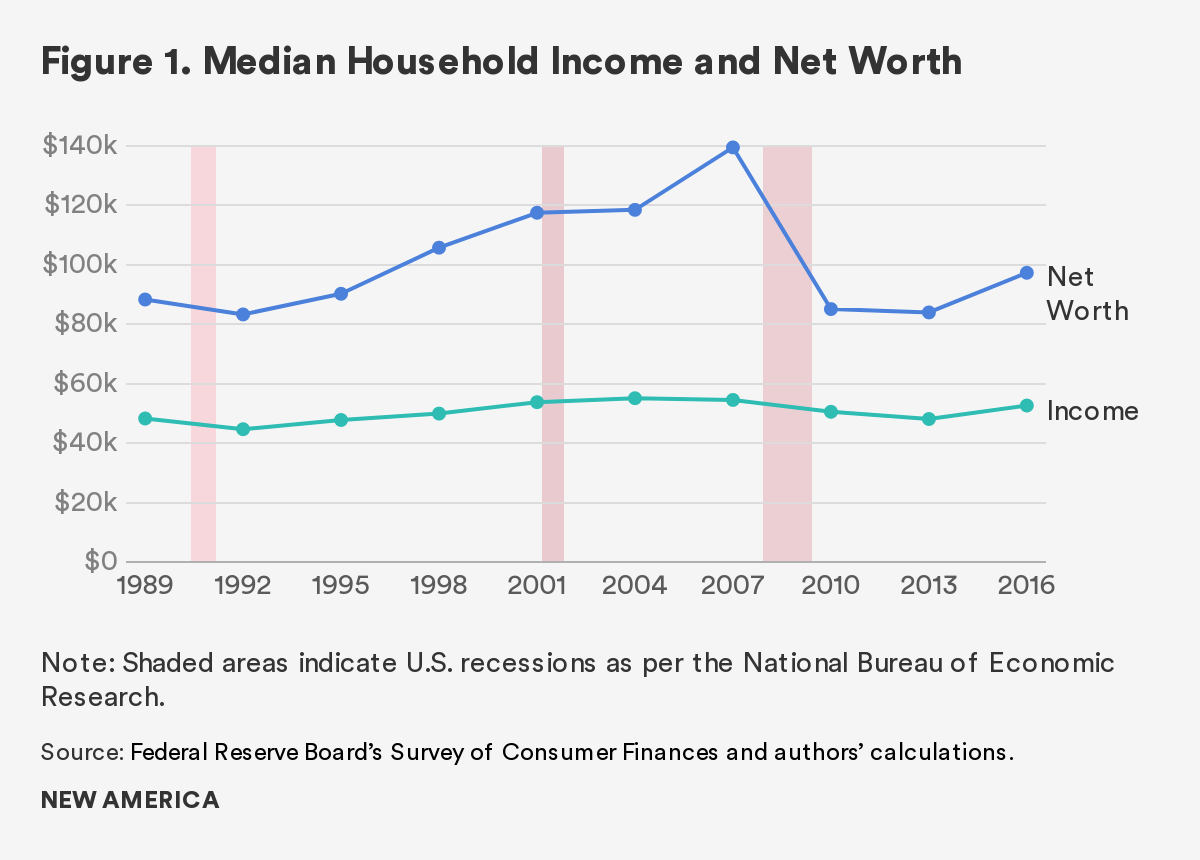
The data are clear that during the Great Recession, American families suffered widespread and deep income and wealth losses. However, younger families were hit particularly hard; they experienced greater financial damage in percentage terms than did retirement-age families. Younger families’ typical household income in 2016 was between 6 percent and 10 percent lower than that of similarly aged families in 2007, while older families’ income never fell below 2007 levels.
Even as wealth losses were widespread, younger families suffered more and have been slow to recover. As of 2016, younger families’ median net worth was between 27 percent and 37 percent below 2007 levels, while retirement-age families’ net worth was only 9 percent lower than similarly aged families.
Our analyses group families by the decade in which the family head was born. As generations span multiple birth decades with unique coming-of-age experiences, we believe this level of differentiation allows us to be more precise with our estimates and conclusions. Since the 1980s-born group is the youngest cohort that had fully reached adulthood by the start of the Great Recession (ages 18 to 27 in 2007), we consider the results of the 1980–1989 group to represent the experience of Millennials.
Using data from nearly 48,000 families in the triennial Survey of Consumer Finances between 1989 and 2016, we are able to estimate typical income and wealth building trajectories.5 These calculations allowed us to predict the amount of income or wealth a typical family could be expected to have at a given age.6 We are then able to compare actual values of income and wealth to the predicted values to describe relative gaps in earnings and accumulations. See Figures 2 and 3. If the typical family is doing better than we would expect based on all families, the bars are above zero; if they are doing worse, the bars fall below zero.
Income and wealth were relatively high for all families before the crash. See Figure 2. For example, the average Millennial (i.e., 1980s-born family head) was 24 in 2007. We would expect a typical 24-year-old to make about $28,6007 in income and have about $5,100 in wealth. Median 1980s Millennials were flying high, with income and wealth 17 percent and 20 percent above these predictions, at $33,300 and $6,100, respectively. Families whose heads were born in the 1940s, 1950s, and 1960s had wealth levels even farther above normal.
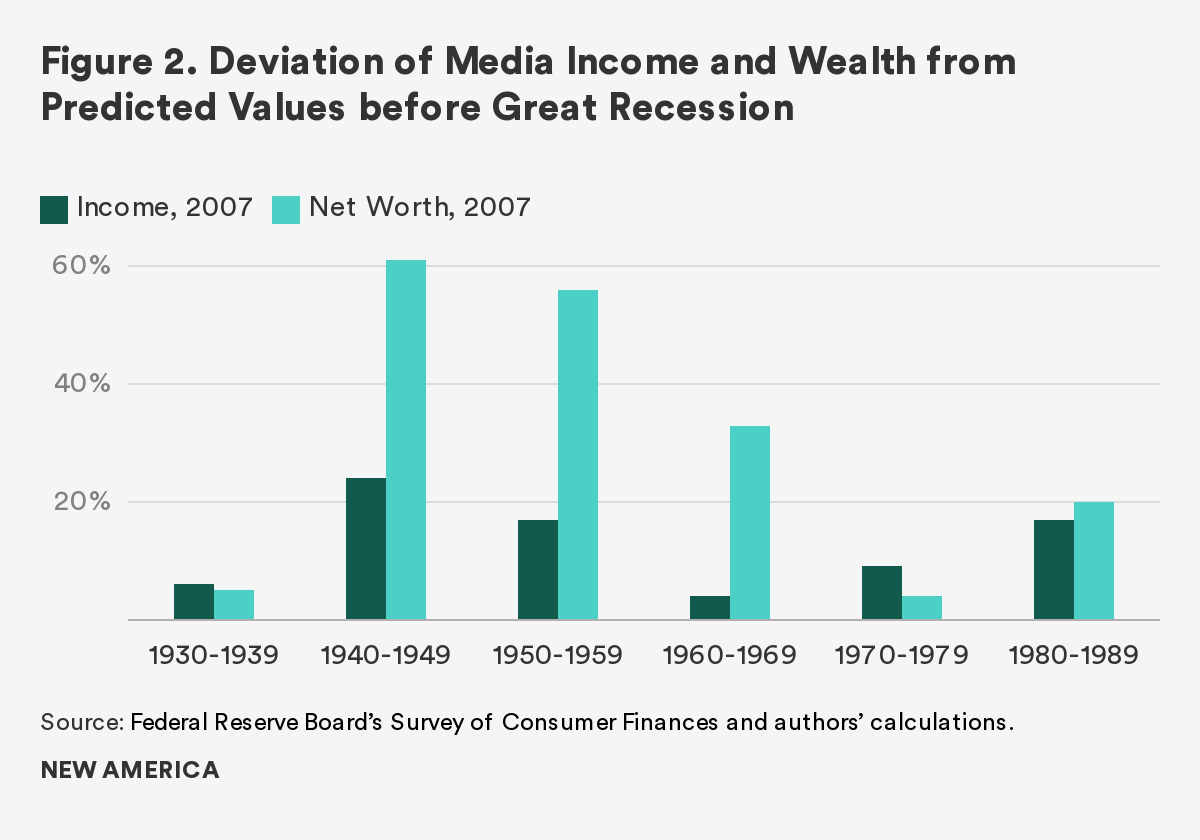
When the housing bubble burst with the onset of the Great Recession, the income and wealth advantages of each generation were also deflated. The typical Millennial family’s relative wealth standing plunged by 45 percentage points in comparison to 2007. See Figure 3. For all cohorts, wealth declined more sharply than income. In fact, in 2010, the year following the end of the recession, income had fallen below predictions only for the 1970s Gen-Xers and the 1980s Millennials.
Recovery between 2010 and 2016 is evident for most birth decades. Income recovered by an average of 15 percentage points while wealth recovered by 7 percentage points on average. However, gains were not shared equally. Older cohorts, measured by the typical family, fared better on both income and wealth recoveries.
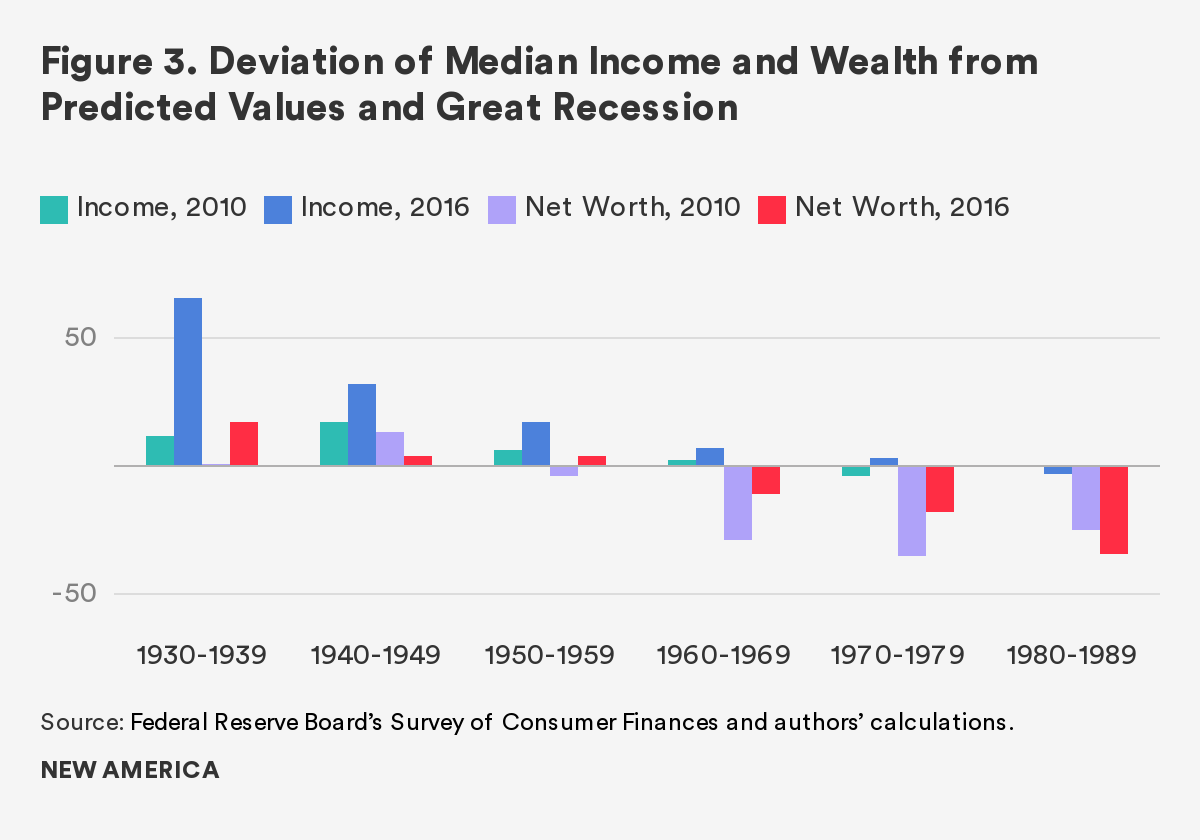
The 1980s Millennial group was the only cohort to fall below both income and wealth benchmarks in 2010 and then further behind in 2016. Income fell by 3 percentage points to -3 percent below predictions, and wealth fell by 9 percentage points to -34 percent below predictions. In 2016, the average 1980s-born Millennial family was 32, with an expected median income of $52,800 and an expected median wealth of $35,200. Instead, their actual median income was $51,200 and their actual median wealth was much lower: $23,200. This wealth shortfall of 34 percent is substantial.
Of course, many Millennials came of age during the unfavorable financial and economic conditions of the Great Recession. The 1980s-born group was economically vulnerable as they entered the labor force during a weak job market. Additionally, while asset prices—including stocks, bonds, and housing—had reached high levels relatively early in the recovery, many Millennials were not yet at an age where purchasing those types of assets is common. Long-term wealth accumulation may be difficult going forward in part because it is unlikely that asset appreciation will remain at these historical highs. These concerning trends call into question Millennials’ ability to recover in time to meet major financial life-goals, including buying a home, financing college education for their children, and saving and investing for retirement.
Wealth Redistribution Trends
The Great Recession amplified two long-term trends of wealth redistribution, which demand greater attention. First, the distribution of wealth has shifted from families with less than a four-year college degree to families with at least a bachelor’s degree (hereafter referred to as college grads).8 Second, wealth is also increasingly concentrated among older families, and younger families’ share has decreased.
Wealth Going to the More Educated
The belief that college leads to better financial outcomes is widespread and evident across a variety of disciplines.9 In fact, higher education is often touted as a solution to income and wealth inequality (but see Emmons et al. 2019 for a more nuanced discussion).10 The popularity of the belief that college is “worth it” is manifested in the rising share of U.S. families that are headed by terminal four-year college graduates and postgraduates. In 1989, a college graduate headed 15 percent of families and 9 percent were headed by postgraduates; by 2016, these figures respectively rose to 21 percent and 13 percent.
In fact, the 1980s Millennial group is the most educated decade we studied. College-grad Millennials made up 23 percent of the cohort in 2007. By 2016, their share had risen to 37 percent. College graduates have steeper income and wealth accumulation trajectories than do nongrads.11 Thus, it is instructive to look at four-year college grads and nongrads separately.
Using data from the Survey of Consumer Finances, we estimated new income and wealth predictions using all college grads and then using all nongrads (from 1989 to 2016). We then compared actual levels to predicted levels, keeping education consistent. Thus, for college-grad families the benchmarks are all college-grad families, and for nongrads the benchmarks are all nongrad families.
We found that college-grad Millennials were doing quite well prior to the recession. Both income and wealth were above the predictions, by 23 and 27 percent respectively. See Figure 4. The average Millennial college grad was 25 years old in 2007, with a median household income of $49,800 and a median household net worth of $11,800.
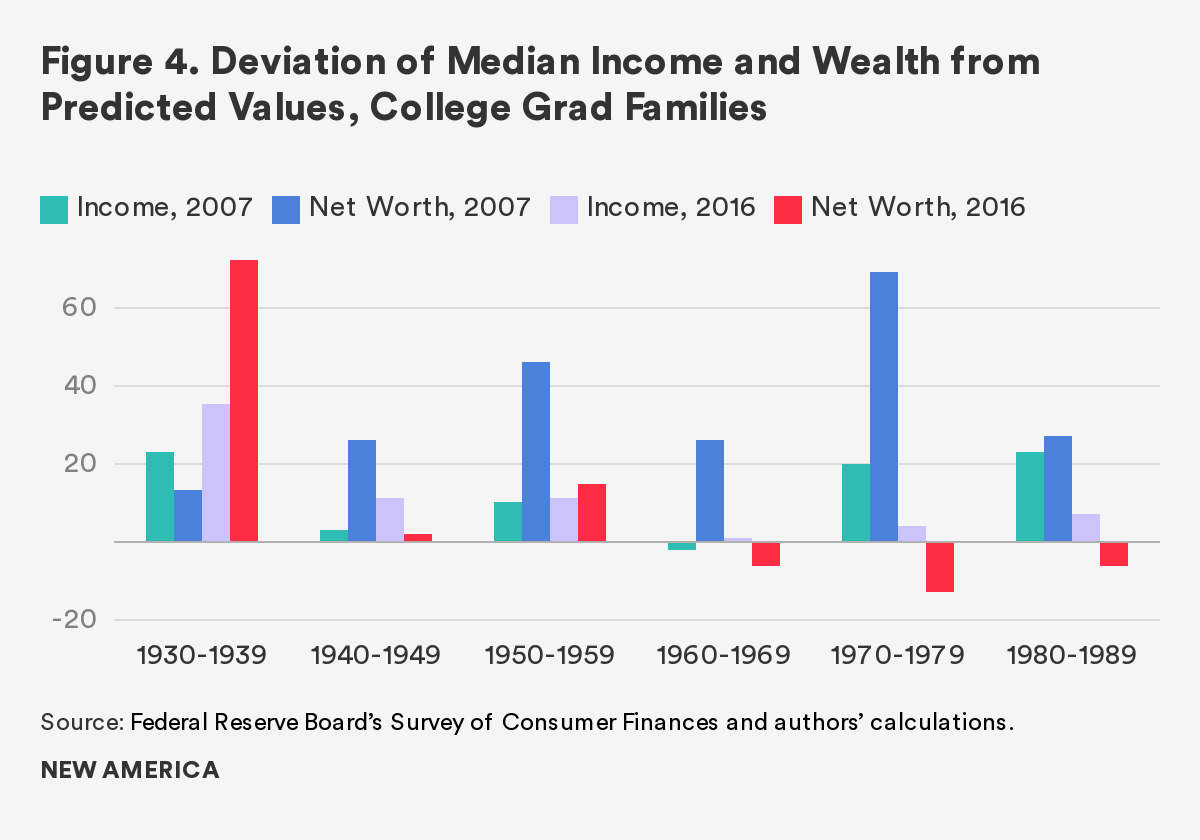
The recession depleted these advantages. Millennial income dropped 16 percentage points relative to the historical norm, though it stayed 7 percent above predictions. College grad Millennial wealth, on the other hand, was knocked down below predictions by 33 percentage points, to -6 percent. Millennial college grads were 31 years old on average in 2016, with an expected median income of $73,900 and expected net worth of $58,200. Instead, their income was $79,000, but their wealth was below predictions at $55,000.
Older college graduates were better able to weather the storm. Income did not fall below benchmarks and neither did wealth for the college grad groups born in the 1930s, ’40s, and ’50s. In fact, grads born in the 1930s and ’50s actually increased their wealth advantage relative to the historical norms between 2007 and 2016. While younger graduates born in the 1960s to 1980s had wealth levels lower than predicted, the effect of the Great Recession was tempered compared to the overall sample.
In contrast, Millennials with less than a four-year college degree fared much worse than did college-grad Millennials. These households were already at or below predicted levels in 2007. See Figure 5. Their median income was 4 percent above benchmarks set by all nongrad families, while their median wealth was 31 percent below. The average nongrad Millennial was 24 in 2007, with a median income of $29,500 and a median net worth of $5,200.
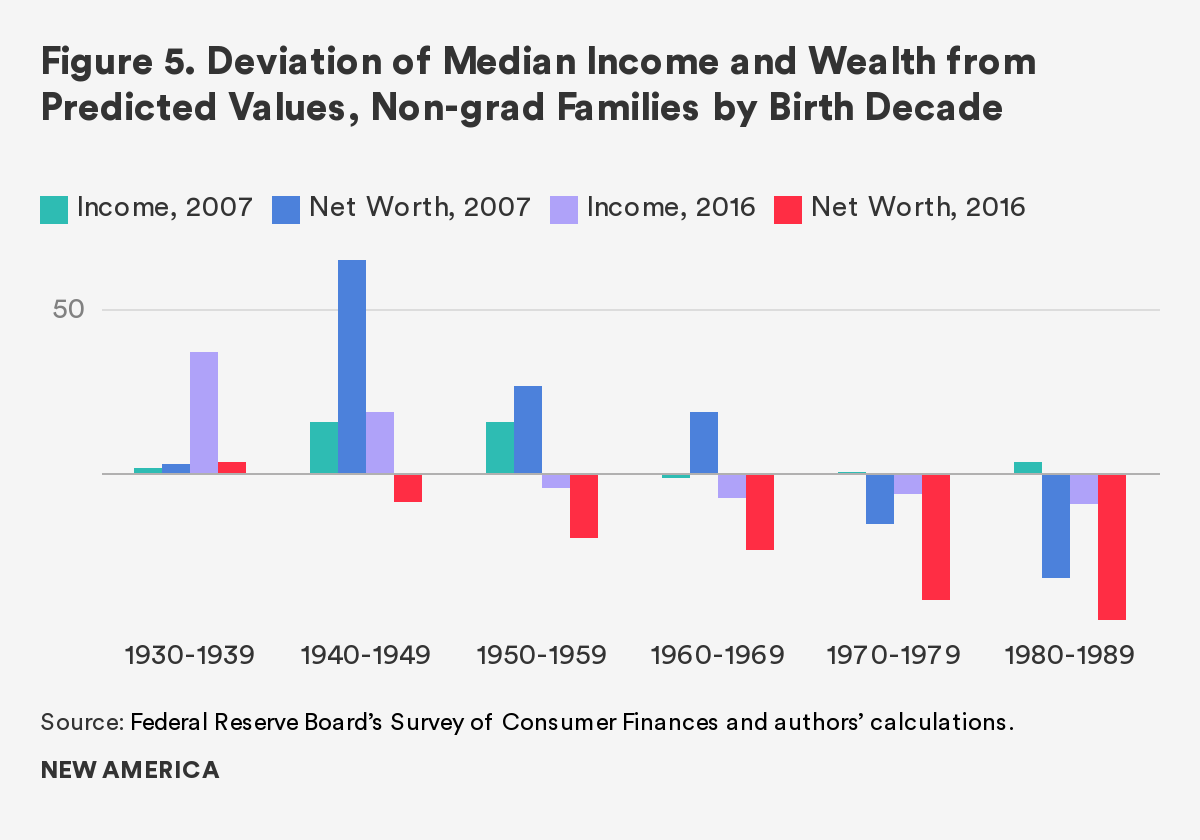
The Great Recession pushed nongrad Millennials back even further, and the most recent estimates for this group indicate that there has been no recovery. Their median household income dropped by 13 percentage points relative to the historical norm, from 4 percent above predicted values to -9 percent below, while their median household net worth, which was already -31 percent below predictions, dropped another 13 points to -44 percent below. The 1980s nongrad Millennials are the only group for which wealth has continued to drop further behind expectations each survey year after 2007.
Nongrad Millennials were 32 on average in 2016 with an expected income of $45,800 and expected wealth of $24,700. In reality, their median income was $41,700, and their median wealth was more than $10,000 lower, at $13,800. Considering that the average tuition and fees at public, four-year in-state colleges and universities was roughly $9,50012, this difference is very significant and may have long-lasting consequences for the wealth building potential of Millennial nongrads.
Wealth Going to Older Generations
The Great Recession also amplified an ongoing trend of wealth being redistributed from younger to older generations. Figure 6 shows that the generational wealth gap has been growing for many decades. In 2007, almost all of the age groups shown had a predicted wealth level higher than predicted levels for a same-age family in 1989. Yet the predicted wealth of those age 25 (born in 1982) was 11 percent below the predicted wealth of a 25-year-old in 1989. In contrast, the predicted wealth of a 75-year-old in 2007 was 84 percent higher than predicted for a 75-year-old in 1989.
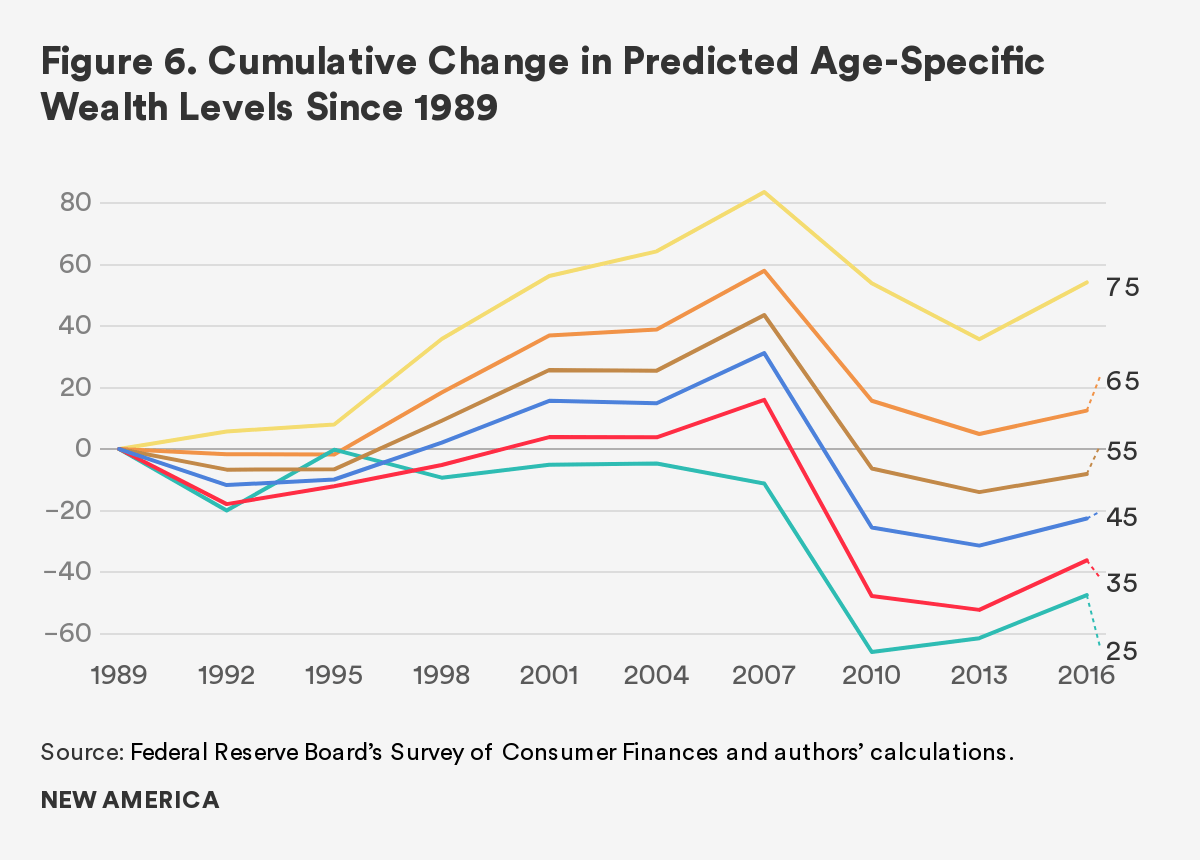
Even though the recession resulted in widespread wealth losses across the board, our findings show that younger families’ predicted wealth in 2016 was dramatically lower than a same-aged family in 1989. Older families have fared much better. While predicted wealth dropped from 2007 highs, it remained above that expected of same-aged older families in 1989.
In 2007, the predicted wealth of a family whose head was age 25 (born in 1982) was 11 percent below the predicted wealth of a 25-year-old family head in 1989. The predicted wealth of a 75-year-old family head was 84 percent higher than predicted for a 75-year-old in 1989. By 2016, the generational gap in predicted wealth had widened even further. The younger family was even further below 1989 levels (-47 percent) while older families’ predicted wealth remained significantly above 1989 levels (54 percent). Importantly, the generational wealth gap has also grown in absolute terms. The gap in predicted wealth between a 25- and a 75-year-old in 1989 was $152,600. By 2016, this gap had grown astronomically by nearly $100,000 to $248,700.
In the most basic terms, those near retirement age and older are predicted to have more wealth than their elders, while those younger have less. Age 60 appears to be a turning point. See Figure 7. The average age of a 1980s Millennial in 2016 was 32; their predicted wealth of $28,000 was 41 percent below a 32-year-old’s predicted wealth in 1989. For a 1950s-born Baby Boomer (average age 61 in 2016), their predicted wealth of $191,000 was 3 percent higher than a 61-year-old’s predicted wealth in 1989. Taken together, these findings show the extent to which the Great Recession helped to widen an already-growing generational wealth gap.
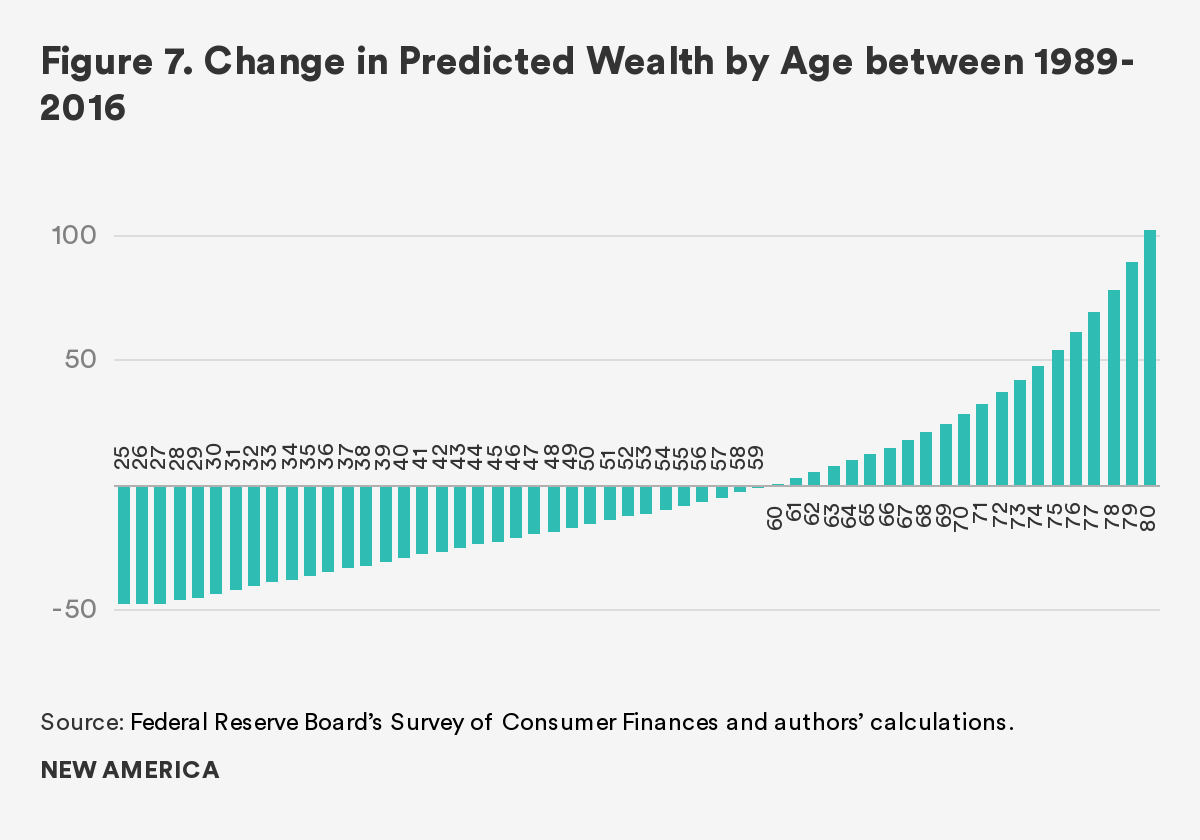
A Brief Discussion of Race/Ethnicity and the Millennial Wealth Gap
A compounding factor in the growing generational wealth gap is the role of race and ethnicity. Members of minority groups have historically had lower levels of income and wealth than non-Hispanic whites.13 The fact that Millennials are not reaching their expected financial potential may be related to their greater racial and ethnic diversity and the fact that predictions are based on all generations (the vast majority of whom are older and whiter).
Our analyses find that the 1980s Millennials are the most diverse group we studied. In 2016, 59 percent were non-Hispanic white, 17 percent were non-Hispanic black, 17 percent were Hispanic of any race, and the remainder were in a diverse catch-all group including Asians, American Indians, Alaskan Natives, Native Hawaiians, Pacific Islanders, other races, and those who identified with more than one race.14 Using these categories, we see how dramatic differences in wealth accumulation continue to persist, outpacing differences in income.
For example, non-Hispanic white15 Millennials had the highest median household income of all race/ethnicity groups at $60,800 in 2016. See Figure 8. Their income was 63 percent higher than that of black Millennials and 50 percent higher than that of Hispanic Millennials.
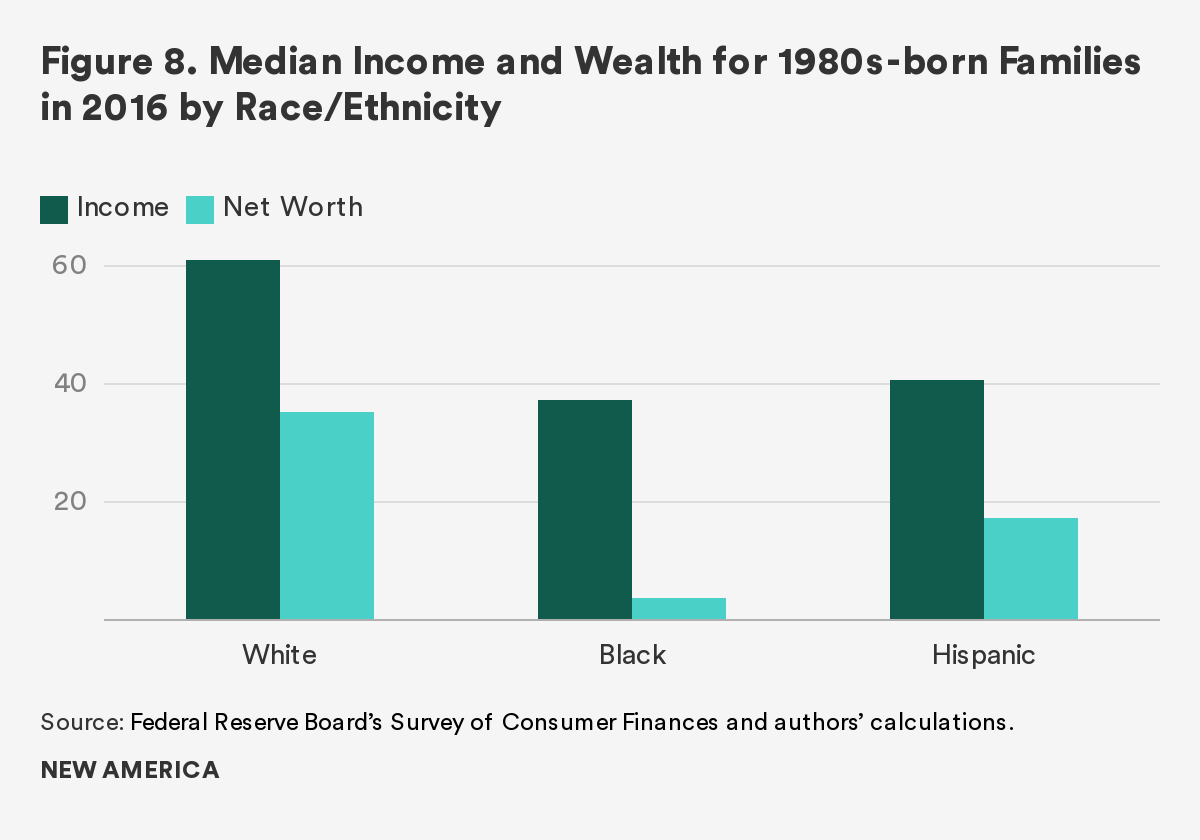
White Millennials’ wealth advantage was even more evident, especially as compared to non-Hispanic blacks. Black Millennials had 11 cents per every dollar of wealth owned by white Millennials. This gap is similar to the overall black/white wealth gap. The median wealth gap was smaller for Hispanic Millennials; they owned about 49 cents per every dollar owned by whites.
These trends are mirrored in the overall racial wealth gap, which is quite sizeable and has barely budged since 1989. The median wealth of black and Hispanic families has roughly doubled since that time, yet the gap is still more akin to a chasm. In 2016, the typical white family owned 10 times as much wealth as the typical black family and 7.5 times as much wealth as the typical Hispanic family.
A Lost Generation? Time Will Tell
These findings highlight the challenging path ahead for Millennials if they are to regain their footing and get on the type of trajectory of wealth accumulation required to catch up to previous generational cohorts. As wealth plays a fundamental role in the achievement of many financial life goals, the late start of the Millennial generation is troublesome and already having an impact on a variety of indicators, including delayed rates of homeownership, marriage, and child rearing.16
While the Millennial wealth gap is stark, a case can be made for optimism. Two key factors on the side of 1980s-born families are time and education. Millennial families have the majority of their working lives ahead of them, so there will be opportunities for greater earnings, savings, and investing—all of which can promote higher rates of wealth accumulation. The likely pinnacle of their income earning years is still some distance away, as is the time when their wealth is expected to peak.
Additionally, they are a very highly educated group, with nearly two out of five family heads having at least a four-year college degree. Given the strong association between education and wealth, it is possible that their income and wealth trajectories will pick up pace. If they do, Millennials may be able to catch up to and possibly surpass the benchmarks set by previous generations.
On the other hand, Millennials will have to overcome significant financial shortfalls to get back on track. For instance, with median wealth that is 34 percent below predictions, the scale of the deficit is particularly large. While Millennials do have many years left when they can be accumulating wealth, the rate of wealth accumulation is typically faster in percentage terms when people are younger.17 Additionally, the Millennial balance sheet is structurally different than that of previous generations. Their debt reflects lower frequency of mortgage debt and much higher borrowing rates of student loan debt.
While there should be no mistaking that the Millennial wealth gap is large and their predicament severe, the relative size of their cohort may help trigger a policy response. Already, many Millennials are moving into leadership positions and are increasingly able to stimulate change. In a number of key areas, Millennials are influencing social norms and fighting for social change, including addressing racial and ethnic wealth inequities.
The balance sheet perspective presented here highlights some promising areas for public policy. The burdensome nature of student loans and rising college costs in general underscore the potential impact of loan forgiveness and publicly subsidized higher education. Given that Millennials have had a difficult time attaining homeownership, due in part to a lack of affordable housing and inhibiting student debt, greater support (on par with incentives directed toward homeownership) for renting seems reasonable.18 These potential developments lend hope for the future, though only time will tell whether Millennials will recover, or if they will become part of a lost generation.
Citations
- Richard Fry. “Millennials Projected to Overtake Baby Boomers as America’s Largest Generation.” Pew Research Center. March 1, 2018. source
- Christie Smith and Stephanie Turner. “The Millennial Majority Is Transforming Your Culture.” Deloitte University report. 2017. source
- William R. Emmons, Ana H. Kent, and Lowell R. Ricketts. “A Lost Generation? Long-Lasting Wealth Impacts of the Great Recession on Young Families.” Demographics of Wealth 2018 Series, Number 2, May 2018. source
- See chart of Real Median Household Income of the United States. source
- See Appendix 2 in Emmons, Kent, and Ricketts (2018) for more information.
- We also removed the effect of survey year.
- Figures rounded to the nearest $100. All dollar amounts are expressed in 2016 dollars.
- We recognize that there are many two-year college graduates as well as individuals with certificate or technical degrees. We delineate at the four-year college degree because median wealth outcomes for those with less than a four-year degree but more than a high school degree parallel the median wealth of those with at most a high school degree. This trend has been consistent for many decades. See slide 15: source
- See Emmons, William R.; Kent, Ana. H.; and Ricketts, Lowell, R. “Is College Still Worth It? The New Calculus of Falling Returns,” Federal Reserve Bank of St. Louis, Working Paper, January 2019, for a more nuanced discussion. Our results in this paper suggest that college and postgraduate education may be failing some recent graduates as a financial investment.
- Lael Brainard, “Is the Middle Class within Reach for Middle-Income Families?” Federal Reserve Board, May 10, 2019. source
- Emmons et al., 2019.
- College Board. Trends in Higher Education: Published Prices. 2018. source
- William R. Emmons and Bryan J. Noeth. “Race, Ethnicity and Wealth,” Demographics of Wealth, Number 1, February 2015. source
- Due to sample-size constraints, we are unable to accurately explore the income and wealth outcomes of the catchall other-race group.
- Hereafter, non-Hispanic whites and non-Hispanic blacks are referred to as whites and blacks, respectively.
- Mark Carter. “The Economic Plight of Millennials,” Federal Reserve Bank of Atlanta Econ South, 2014. source
- For example, it is easier to double one’s wealth when the amount is small (say $500) than when it is large (e.g., $50,000). See Emmons, William R.; Kent, Ana. H.; and Ricketts, Lowell, R. “Is College Still Worth It? The New Calculus of Falling Returns,” Federal Reserve Bank of St. Louis, Working Paper, January 2019.
- Alvaro Mezza, Daniel Ringo, Shane Sherlund, and Kamila Sommer. “Student Loans and Homeownership,” Journal of Labor Economics, forthcoming.
The Millennial Racial Wealth Gap
Fenaba R. Addo and Yiling Zhang
Wealth inequality among different racial and ethnic groups has been a defining feature of American society. However, new dynamics are emerging with the rise of the Millennial generation that will likely impact the extent of future divides. In this chapter, we examine racial wealth inequality among Millennial young adults. Along with summarizing wealth profiles of young Millennials of color, we explore wealth inequality within the context of historical legacies of Black-White wealth inequality, the proliferation of debt—specifically student loan debt—and the ongoing marital retreat. We also examine how the association of income and education with wealth vary significantly by race and ethnicity and contribute to pre-existing/intergenerational wealth gaps. If the trends we describe continue—and are ignored by policymakers—dramatic levels of inequality according to race and ethnicity will endure for decades to come.
Wealth Inequality and Race
According to the US Federal Reserve Bank, median household wealth in 2016 was $97,300 (Bricker et al. 2017).1 This is the amount of wealth owned by the typical family, where half have more and half have less. In general, households with higher incomes hold more wealth, and household wealth profiles increase with the age of the household head. Aggregate information of median wealth levels and its correlations with income and age, however, mask significant inequalities in wealth holdings. Wealth in the United States is highly skewed. Most of the population is concentrated at the lower ends of the wealth distribution, holding zero or negative net wealth, where their debts exceed their assets. Concurrently, the top one percent of households held 38.6% of the country’s wealth, and the top 10% held 77.2%, leaving 22.8% for the bottom 90% (Bricker et al. 2017).
The political, legal, and social context in which wealth generation has occurred historically favored White Americans, while the availability of resources to gain wealth has systematically been denied Black Americans. In other instances, factors affecting consumption choices were constrained, and incremental efforts to participate in the US economy have been far less likely to generate, accumulate, and maintain wealth (Oliver & Shapiro 2013). Given that wealth is often passed down intergenerationally, racial wealth inequalities have been reproduced over the course of American history and endure to this day (Oliver & Shapiro 2013; McKernan et al. 2014). The most recent wealth data from 2016 indicates that the median net wealth of White households was $171,000, compared with $20,700 for Latinx households and $17,600 for Black households. These figures identify the basic parameters of the racial wealth gap by capturing the wealth experience of typical families in each group. Yet absolute gaps based on average wealth are even larger given extreme concentrations of wealth at the high ends of the distribution (Bricker et al. 2017). In some respects, these figures should not be surprising given how prevailing US racial wealth inequality is rooted in intergenerational racial wealth inequality, with wealth gaps present in younger generations. However, the current distribution of wealth should also be acknowledged for its significance in creating fundamental privilege and disadvantage and undermining national aspirations of fairness and equality.
Income and Wealth
Millennials transitioned to adulthood during a period of both economic prosperity and instability, shaped significantly by the Great Recession, which spanned 2007 to 2009. Despite the large number of young adults that went to college and obtained degrees, they entered a tight labor market with young adult Millennials more likely to be unemployed compared to other working-age adults (Taylor et al. 2012). Even after the economy began to rebound, labor force participation and unemployment trends varied by race and ethnicity. Notably, Black young adults continued to have higher rates of unemployment with slower job growth post-Recession (Jones & Schmitt 2014; Kochhar 2012; Taylor et al. 2012).
Since low wages and labor market disconnectedness are often posited as dominant explanatory factors for racial wealth differentials, this experience of different groups in the wake of economic downturns is important to consider (Aliprantis & Carroll 2019; Barsky et al. 2002). This, however, implies that the direction of causality runs from income to wealth, and ignores the intergenerational transmission of wealth and the potential for the relationship to run the other way—from familial wealth to income. In fact, Millennials’ wealth mirrors that of their parents. Among the oldest Millennials, those born between 1980 and 1984, who have had some time to get farther along on their economic trajectory, the median wealth of Latinx adults lies between that of Black and White adults. Specifically, the median wealth of Latinx Millennials is $14,691, more than twice the median wealth of Black Millennials, who hold $5,676, and slightly more than half the wealth of White Millennials, at $26,109. At the very least, racial gaps in Millennial income reflect economic inequality only to a lesser extent. By their early thirties, the median household income of Latinx adults ($69,478) was greater than that of Black Millennials ($46,300), but lower than White Millennials ($81,137).
The median net wealth by income quintiles of Millennials (presented in the table at the end of chapter) shows both a distinct hierarchy and stark disparities according to race and ethnicity. The wealth holdings across the income distribution for both Black and Latinx Millennials are below White Millennials. Specifically, Black Millennials in the top income quintile hold less than half of the median wealth of Latinx Millennials, and Latinx Millennials in the top income tier hold less than half the median wealth of White Millennials. Even at the top of the income distribution, both Black and Latinx Millennials hold significantly less wealth.
While there are disparities according to race and ethnicity in the distribution of both income and wealth, the racial wealth gap is wider. This holds true among young adults. Wealth inequality between Black and White Millennials was 2.6 times larger than income inequality, and 1.5 times larger for Latinx and White Millennials. Despite less variation in median incomes across race and ethnicity, wealth gaps among different racial and ethnic groups are large and significant.
Post-secondary Schooling and Education Debt
Higher education is the best example of unequal returns to wealth generating resources for Millennials. The data show that Millennials have pursued post-secondary schooling and obtained college degrees in young adulthood to a greater extent than previous generations (NCES 2016). While 44% of White Millennials have gone to college by the age of 30, and 35.3% have completed their degrees, in contrast, 25% of Black Millennials have gone to college, with only 18% obtaining a degree. Among Latinx Millennials, 24% have at least some post-secondary education, and 17% hold a college degree.
Not only is racial wealth inequality present in the Millennial population, but the gap also grows even larger when examining Black and White young adults with college degrees. Recent work suggests that student loan debt disparities may be contributing to these racial wealth gaps among Black and White Millennials (Houle & Addo 2018). When looking at student loan debt data, it is clear that Black Millennials took on a great deal more financial risk in pursuit of a college degree. They have acquired more education debt, and their repayment of education debt is slower (Houle & Addo 2018; Scott-Clayton & Li 2016).
Several mechanisms contribute to these observed debt disparities, including family background, postsecondary characteristics, and credit and labor market factors (Houle & Addo 2018). In response to rising tuition, students and their families have had to increasingly make up the difference between college costs and insufficient financial aid packages. However, research indicates that there were different impacts of parental wealth depending on race and ethnicity. For White young adults, their amount of education debt decreased as their parent’s wealth increased. Whereas for Black young adults, parental wealth was not associated with the amount of debt their children accumulated (Addo, Houle & Simon 2016). The Black-White wealth distributions are so incongruent that Black parents only comprise 3.2% of the top wealth quintile, which was defined as holding at least $191,000 (Addo 2018). This work suggests that intergenerational class status was not guaranteed for Millennial Black young adults. Similar to their parents and grandparents’ generations, they may find the pathway to middle-class status and long-term financial security a tenuous one.
Black borrowers also turned to private loan markets in greater percentages (Dillon & Carey 2009). Relative to federal loans, these loans are associated with costlier debt given the high and variable interest rates. They also lack similar protections afforded federal loans, such as loan forbearance, with a negligible chance of discharge in bankruptcy. And once in the labor market, Black young adults still face discrimination (Gaddis 2014). They are more likely to be unemployed or underemployed, holding jobs that do not require a college degree (Jones & Schmitt 2014). High-cost loans, discriminatory practices, and unequal wages are just a few of the structural barriers that inhibit college-attending Black Millennials from paying down their education debt at similar rates as their White counterparts.
These factors can have long-lasting consequences. There is suggestive evidence that not only are young adult Millennials acquiring student debt because of the limited wealth resources of their families, but that student loan debt is associated with lower wealth accumulation for Millennials. Young adult Millennials with student loan debt by age 30 have significantly less wealth than their counterparts with no debt, inclusive of those who never attended college and those who did. The wealth returns to a college degree appear to have greater benefits for those who either had no loans or were able to pay them back quicker.
These patterns are consistent for Black, Latinx, and White Millennials, yet the racial wealth differentials persist across all categories. Depending on whether they have outstanding student loans, White wealth is two to four times greater than Black wealth and 1.2 to 1.8 times larger than Latinx wealth holdings. Compositionally, Black and White educational debt disparities account for 10.5% of the racial wealth gap (Houle & Addo 2018); and for college graduates, for whom racial wealth gaps are greatest, it explains close to 20% (Addo 2019). Alternatively stated, if the education loan debt disparity was eliminated, wealth inequality between Black and White young adults with college degrees would decrease by 20%.
It is not surprising that the median wealth of all Millennials with any debt at age 30 is lower than those with no debt who attended college; however, their median wealth levels are also lower than young adults who never attended college. Uncovering these realities has led scholars to express concern that student loan debt may be reproducing racial wealth inequalities among the latest generation of youth (Addo, Houle & Simon 2016; Scott-Clayton & Li 2016).
It is important to note that gender wealth disparities persist despite the relative gains women continue to make in their educational pursuits. The relationship is more nuanced once the racial and ethnic diversity of Millennials is considered, however. Similar to Gen Xers, Millennial women have higher graduation rates than men, 39% compared with 30% (Frey 2018). White women have the highest graduation rates at 39.62% followed by White men, 31.24%. The wealth of White female college graduates ($52,406) far exceeds Black ($3,316) and Latinx ($29,889) female graduates but is lower than White men by almost $20,000.
The gender disparity in college completion is even greater among Black Millennials, where Black women completed college (22.76%) at almost twice the rate of Black men (13.36%). Yet, the median wealth of Black male Millennials ($8,105) was 2.5 times greater than Black female graduates ($3,316). Latinx women and men have the smallest gap in graduation rates, with less than a 4% difference. Comparable to the aggregate wealth levels, the figures for Latinx graduates lie in between the Black and White median values.
Interestingly, Millennial college graduates of Latinx descent are the closest to having gender wealth parity, with only a $5,000 difference in median wealth. And unlike Black and White college graduates, it is Latina women who have the higher median wealth. Significantly, this relationship exists only among college graduates. Not only does the median wealth of Latinx men with some college ($37,152) exceed the wealth of Latinx women with some college ($25,284), but it is greater than the median wealth of Latina college graduates ($29,889). This relationship also holds among Black college attendees (Bhattacharya, Price & Addo 2019). These wealth differences indicate that obtaining some of the highest levels of education did little to close racial wealth gaps among Millennials and is no guarantee of gender economic equality, for Black women in particular (Hamilton et al. 2015). Of course, these numbers reflect differences in several wealth-generating domains beyond education, including inherited wealth from their parents and grandparents, labor market returns, occupational segregation, asset ownership, and family structure, which we turn to next.
Marriage and Wealth
Along with distinct trends in wealth, education, and education debt that vary by race and ethnicity, Millennials’ relationship with marriage continues to diverge from previous generations and also varies by race. Specifically, Millennials are getting married later, reflected in the highest median age at first marriage, and are more likely to be never married (Bialik & Fry 2019).
With a smaller proportion married in young adulthood, the marital retreat has spread throughout the income and wealth distribution. However, it has not occurred uniformly across race and ethnic groups. Marriage rates for White, Latinx, and Asian Millennials are within eight percentage points of one another—48%, 45% and 52% respectively—and when combined with those with any marital history, more than half of their ethnoracial groups have ever married (Frey 2018). Marriage rates for Black Millennials are the lowest, at just over a quarter ever married and a fifth currently married.
The low number of women who married in young adulthood among Millennials also means there are more children born to unmarried women. A quarter of Millennial Black women were unmarried at the time of the birth of their first child, compared with 11% of Latina and 7% of White unmarried mothers. Differences in family building patterns, such as the sequencing of childbearing and marriage, and the timing of union formation, are associated with different wealth and economic outcomes. Since married individuals tend to have more per capita wealth than unmarried or cohabiting individuals, these trends in family formation and child rearing reflect another source of inequality that is compounded by characteristics of race and ethnicity (Addo & Ricketts, 2019). Not unlike previous generations of Black women, marriage is not a panacea for Millennial Black women, but it does appear to impact economic and social stratification (see Addo & Lichter 2013).
In particular, marriage’s relationship with wealth differs among White, Black, and Latinx married Millennials. Although Black married Millennials hold over two times the amount of per capita wealth of unmarried Black Millennials, their wealth holdings, $9,625, are less than single White Millennials, $12,032. This is important given the standard trope that marriage disparities cause racial wealth inequality. Married Latinx Millennials, whose marital rates are closer to White Millennials, have a little more than half their wealth, $13,777. Independent of marital status at birth, the median wealth holdings of Black mothers is low, less than $5,000; however, the median wealth holdings of Black Millennial married mothers ($4,200) was also lower than that of unmarried Black mothers at birth ($4,065).
This data indicates that among Millennials the economic bar to marriage is high and is more pronounced for Black women, in particular. Although the marriage rates of Latina women are closer to White women, their wealth holdings are about half. As fewer Millennials marry, wealth is concentrated among this small share of married households, who are already more likely to be White and socioeconomically advantaged. Given that economic markers of current and future financial insecurity, like education debt, are associated with remaining single or cohabiting among Millennials (Addo 2014), it is unsurprising that debt and wealth disparities stratify family formation patterns by race and ethnicity among Millennials.
Increasing Racial/Ethnic Diversity and Its Impact on the Racial Wealth Gap
The relative wealth positions of White and Black Millennials are analogous to those in previous generations, with White households positioned at the top and Black households at the bottom. White Millennials have more than three times the median wealth of Black Millennials, and a smaller share of them hold negative or zero net wealth. However, the story of race and wealth in America is changing with an increasingly diversified population. Due to the rise in in-migration from Latin American and Asian countries from the late 1970s through the early 2000s, the racial and ethnic composition of the Millennial population differs from earlier birth cohorts (Migration Policy Institute 2019). For example, sizeable portions of Millennials are immigrants who were not born in the United States. Fifty-six percent of Asian Millennials were not born in the US, and 36% of Latinx Millennials were born abroad, compared with 10% of Black Millennials and 4% of White Millennials (Frey 2018). Others are the first generation of children born to immigrant parents. Some have argued that racial and ethnic diversity among Millennials is evidence that the US is transforming from a majority White past to a future composed of a broad set of people of color (Frey 2018). Others, however, challenge the inevitability of this assertion given historic norms of immigrant populations to self-identify over time within the Black-White race-based binary in the US (Alba 2016; Darity 2016).
Based on the demographic composition of Millennials, a more accurate assessment of Millennial differences in wealth by race and ethnicity should account for intra-group variation in national origin,2 and the amount of wealth immigrant families bring with them to the United States. For example, data limitations have been a persistent problem when attempting to obtain more comprehensive information on the wealth holdings of Asian Americans.3 There is currently no publicly available nationally representative information on the wealth profiles of Millennial Asian Americans, who compose 6% of the Millennial population (Frey 2018).4 Their socio-economic experience is distinct in so far as Asian American Millennials have the highest college graduation and marriage rates, and their homeownership rates surpass Black and Latinx Millennials, second only to White Millennials (Frey 2018). There is evidence suggesting that in some geographic regions across the US, Asian Americans have been able to translate their educational success into greater wealth. In Los Angeles, for example, the wealth of Japanese, Asian Indian, and Chinese Americans has outpaced White households (De la Cruz-Viesca et al. 2016).5 The demographic diversity present in the Millennial population raises important questions about the relationship between race and wealth in America within the context of the labor market, post-secondary education, and marriage.
New Millennial Dimensions to the Historic Racial Wealth Gap
The racial wealth gap has been a central feature of American history. The experience of slavery and its aftermath have been endemic to the national story, driving the economy of the country, producing a Civil War, and defining political divides up to the present day. Looking closely at the experience of Millennials broken down by race and ethnicity demonstrates that this history is still with us. Specifically, there are elements of the current racial wealth gap that are historical artifacts. Given how wealth is distributed intergenerationally, we would expect these inequities to be passed down. And they have been.
There are, however, additional ways that current conditions can exacerbate wealth inequalities that are present from birth. Specifically, we have explored how persistent racial wealth gaps among young adult Millennials are extended through pathways that include access to higher education, degree completion, minimal or modest debt, and marriage to others with education and economic resources. As the Millennial and other rising generations have become more diverse, these trends are reinforcing and compounding past inequalities. Even though the Millennial wealth gap has deep roots and connections to the racial wealth gap of previous generations, it has, in fact, been extended through more recent experiences.
For example, young adult Millennials experienced significant wealth loss during the Great Recession (Emmons et al. 2018). The collapse of the housing market and subsequent foreclosure crisis disproportionately impacted neighborhoods with high concentrations of Latinx and Black homeowners (Bocian, Li, & Ernst 2010). Compared with White households, Black and Latinx households were slower to recoup this wealth post-Recession, which contributed to an increase in racial wealth inequality (Fry & Kochnar 2014). There is significant evidence that predatory and discriminatory lending practices were contributing factors in inflating the housing market in ways that triggered the onset of the Great Recession (Bocian et al. 2011). In this sense, it was traditional forms of discrimination repackaged under new systems that contributed to and compounded the country’s racial wealth gap, which is increasingly reflected in the balance sheets of today’s Millennials.
Shifts in the demographic composition of America, due in large part to immigration, are reflected in greater racial and ethnic heterogeneity. Although White Millennials are still the majority at 56%, Black, Latinx, and Asian American Millennials combined are over 40%. And yet, Millennial racial wealth inequality today reflects previous patterns, with Black households having the least amount of wealth. Evidence points to a new racialized wealth hierarchy emerging, with Latinx Americans situated in between Black and White American Millennials, and some Asian American communities at the top.
As the Millennial generation continues to age, the underlying dynamics impacting the distribution of wealth will become more complex. In the near term, the racial wealth gap in America will persist and remain large. Over an extended time horizon, the extent of the future racial wealth gap in America will hinge on a number of factors, including the potential for redistributive public policy interventions and also how Millennials choose to identify within the black-white binary.6 Undoubtedly, if we are to meet our national aspirations of fairness and equity, we will need to continue to focus attention on the role of race and ethnicity in the country’s distribution of wealth.
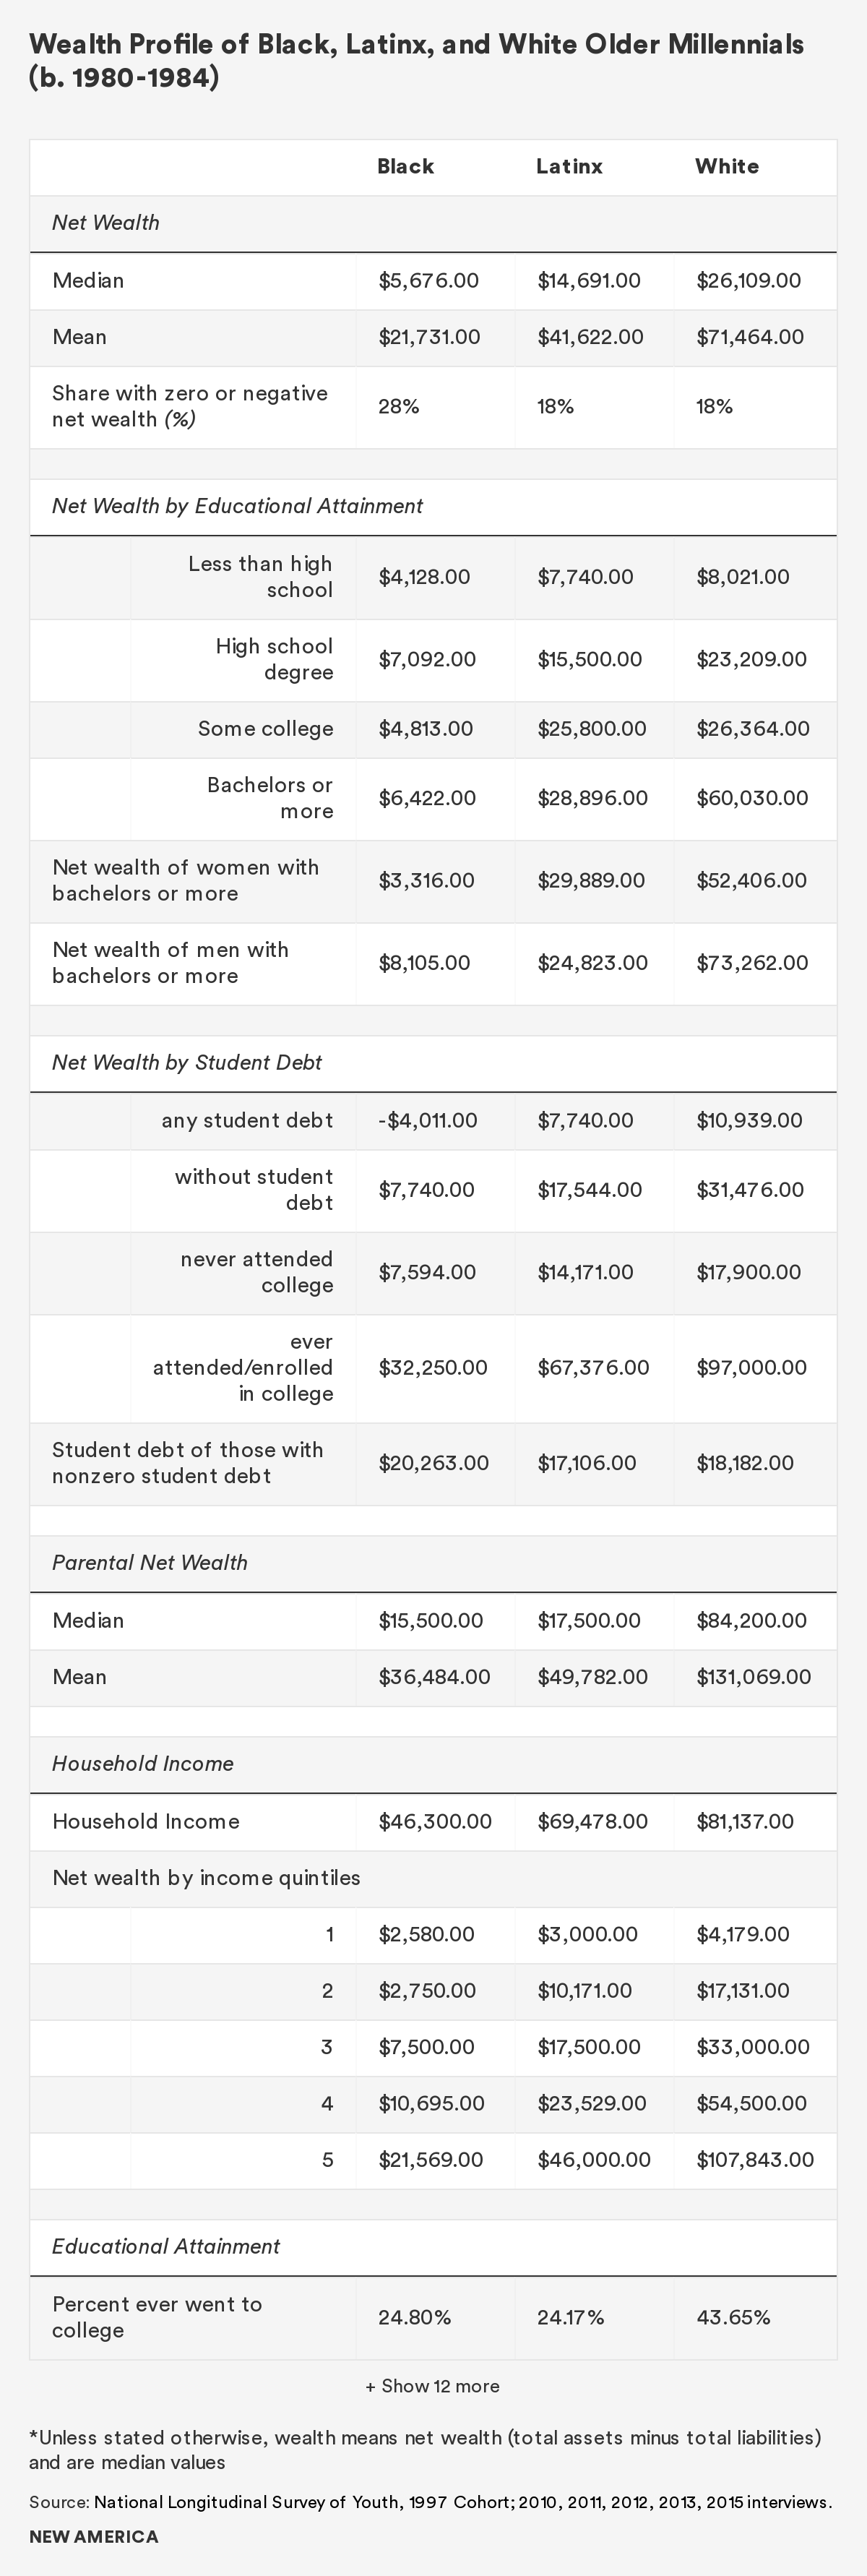
References
Addo, F. R., & Lichter, D. T. (2013). Marriage, Marital History, and Black–White Wealth Differentials Among Older Women. Journal of Marriage and Family, 75(2), 342-362.
Addo, F. R., Houle, J. N., & Simon, D. (2016). Young, Black, and (Still) in the Red: Parental Wealth, Race, and Student Loan Debt. Race and Social Problems, 8(1), 64-76.
Addo, F. R. (2018). Parents’ Wealth Helps Explain Racial Disparities in Student Loan Debt. In the Balance, (19), 1-3.
Addo, F.R. (2019). Racial Disparities in Student Loan Debt and the Reproduction of Inequality. Presentation.
Addo, F. R., & Ricketts, L. R. (2019) As Fewer Young Adults Wed, Married Couples’ Wealth Surpasses Others’. In the Balance. Federal Reserve Bank of St. Louis.
Alba, R. (2016). The Likely Persistence of a White Majority. The American Prospect, 27(1), 67-71.
Aliprantis, D. & Carroll, D. R. (2019) What Is Behind the Persistence of the Racial Wealth Gap? Economic Commentary (2019-03). Federal Reserve Bank of Cleveland.
Barsky, R., Bound, J., Charles, K. K., & Lupton, J. P. (2002). Accounting for the Black–White Wealth Gap: A Nonparametric Approach. Journal of the American statistical Association, 97(459), 663-673.
Bhattacharya, J., Price, A. & Addo, F. (2019). “Clipped Wings: Closing the Wealth Gap for Millennial Women.” The Insight Center.
Bialik, K. & R. Fry (2019). “Millennial Life: How Young Adulthood Today Compares with Prior Generations.” Pew Research Center.
Bocian, D. G., Li, W., & Ernst, K. S. (2010). Foreclosures by Race and Ethnicity. Center for Responsible Lending, 4-6.
Bocian, D. G., Li, W., Reid, C., & Quercia, R. G. (2011). Lost Ground, 2011: Disparities in Mortgage Lending and Foreclosures. Center for Responsible Lending, 3.
Bricker, J., Dettling, L. J., Henriques, A., Hsu, J. W., Jacobs, L., Moore, K. B., Pack, S, Sabelhaus, J., Thompson, J., & Windle, R. A. (2017). Changes in US Family Finances from 2013 to 2016: Evidence from the Survey of Consumer Finances. Fed. Res. Bull., 103, 1.
Darity Jr, W. (2016). The Latino Flight to Whiteness. The American Prospect.
De La Cruz-Viesca, M., Chen, Z., Ong, P. M., Hamilton, D., & Darity Jr, W. A. (2016). The Color of Wealth in Los Angeles. Durham, NC/New York/Los Angeles: Duke University/The New School/University of California, Los Angeles.
Dillon, E., & Carey, K. (2009). Drowning in Debt: The Emerging Student Loan Crisis. Charts You Can Trust.
Duncan, B., & Trejo, S. J. (2011). Tracking Intergenerational Progress for Immigrant Groups: The Problem of Ethnic Attrition. American Economic Review, 101(3), 603-08.
Emmons, W. R., Kent, A. H., & Ricketts, L. R. (2018) A Lost Generation? Long-Lasting Wealth Impacts of the Great Recession on Young Families. The Demographics of Wealth.
Frey, W. H. (2018). The Millennial Generation: A Demographic Bridge to America’s Diverse Future. Brookings Metropolitan Policy Program.
Kochhar, R., & Fry, R. (2014). Wealth Inequality has Widened along Racial, Ethnic Lines since End of Great Recession. Pew Research Center, 12(104), 121-145.
Gaddis, S. M. (2014). Discrimination in the Credential Society: An Audit Study of Race and College Selectivity in the Labor Market. Social Forces, 93(4), 1451-1479.
Houle, J. N., & Addo, F. R. (2018). Racial Disparities in Student Debt and the Reproduction of the Fragile Black Middle Class. Sociology of Race and Ethnicity, 2332649218790989.
Hamilton, D., Darity Jr, W., Price, A. E., Sridharan, V., & Tippett, R. (2015). Umbrellas Don’t Make it Rain: Why Studying and Working Hard Isn’t Enough for Black Americans. New York: The New School.
Jones, J., & Schmitt, J. (2014). A College Degree is no Guarantee. Washington, DC: Center for Economic and Policy Research.
Kochhar, R. (2012). The Demographics of the Jobs Recovery: Employment Gains by Race, Ethnicity, Gender and Nativity. Pew Research Center.
McKernan, S. M., Ratcliffe, C., Simms, M., & Zhang, S. (2014). Do Racial Disparities in Private Transfers Help Explain the Racial Wealth Gap? New evidence from longitudinal data. Demography, 51(3), 949-974.
Migration Policy Institute (2019). MPI Data Hub: Migration Facts, Stats, and Maps.
Oliver, M., & Shapiro, T. (2013). Black Wealth/White Wealth: A New Perspective on Racial Inequality. Routledge.
National Center for Education Statistics (NCES). (2016). Table 302.60. Percentage of 18- to 24-year-olds enrolled in degree-granting postsecondary institutions, by level of institution and sex and race/ethnicity of student: 1970 through 2015.
Scott-Clayton, J., & Li, J. (2016). Black-White Disparity in Student Loan Debt More than Triples after Graduation. Economic Studies, Volume 2 No. 3.
Taylor, P., Parker, K., Kochhar, R., Fry, R., Funk, C., Patten, E., & Motel, S. (2012). Young, Underemployed and Optimistic: Coming of Age, Slowly, in a Tough Economy. Pew Research Center.
Citations
- We use the term wealth to connote net wealth, typically calculated as the total value of a household’s assets minus the household’s total liabilities.
- Data limitations limit our ability to explore wealth differences by national origin in the present analysis.
- This is also the case for Native American Millennials. Their share of the millennial population has marginally increased, yet due to their small relative size, data sources and independent analyses are limited.
- Recent initiatives to gather more comprehensive data of wealth disparities within communities of color using multicity designs include The National Asset Scorecard for Communities of Color, which reveals vast inter-ethnic variations in wealth holdings within immigrant populations.
- In their sample, the wealth of Korean and Vietnamese households is lower than White households, but greater than Black and Mexican American households.
- See Duncan and Trejo (2011) on ethnic attrition of immigrant populations.
The Young and (Economically) Restless: The Nature of Work for American Millennials
Vladimir E. Medenica, Matthew Fowler, and Cathy J. Cohen
The portrayal of the Millennial generation in the popular press has unwittingly flattened the experiences of those who belong to what is now the largest generation of citizens in the country. The public has become familiar with the disparagement of this generation, labeled notably on a Time cover as “lazy, entitled narcissists who still live with their parents.” While no doubt increasing numbers of young adults live with their parents, this trend might have more to do with the economic challenges this generation has faced, rather than a failure to launch. Millennials have come of age just as neoliberalism was deepening its roots in their communities; where a controlled disinvestment in too many communities, often poor communities of color, was contained by policing and mass incarceration. They have experienced the reality of globalization, learning that national political institutions had diminishing control over their economic futures, while watching the living-wage jobs of their parents become part of the past.
Millennials now confront the increasing financialization of the economy, which benefits, as some authors note, “takers instead of makers.”1 And we can add on to their coming-of-age economic experience the fact that many Millennials entered the labor force just as the job market was disrupted by the Great Recession of 2008. Millennials have lived the restructuring of our economy and the increasing polarization of our politics. It therefore seems critical not to belittle this generation, but instead to understand how they see the world and more fundamentally how they understand their economic futures.
Far from being lazy, Millennials now constitute the largest share of the workforce in this country, and they seem to be working so hard that they are now becoming, as Anne Helen Petersen writes in BuzzFeed News, "the burnout generation”:
Financially speaking, most of us lag far behind where our parents were when they were our age. We have far less saved, far less equity, far less stability, and far, far more student debt. The “greatest generation” had the Depression and the GI Bill; boomers had the golden age of capitalism; Gen-X had deregulation and trickle-down economics. And Millennials? We’ve got venture capital, but we’ve also got the 2008 financial crisis, the decline of the middle class and the rise of the 1 percent, and the steady decay of unions and stable, full-time employment.2
And while Petersen describes a daunting economic picture for many Millennials, she readily admits that such challenges are exacerbated for those without college degrees and many Millennials of color. Surprisingly, however, not enough is known about Millennials’ economic lives, financial insecurities, perspectives on economic policies, and aspirations for their economic futures. To explore how young adults experience the economy, structure their work, and assess proposed economic policies, we use data from the GenForward Survey at the University of Chicago, paying special attention to how race and ethnicity influence the financial landscape for Millennials.
The GenForward Survey
The GenForward Survey was founded in 2016 with the goal of expanding our understanding and amplifying the voices of Millennials, in particular Millennials of color. Part of the work of the GenForward Survey is to generate reliable and rigorous data that will facilitate the inclusion of the preferences of Millennials and other emerging generations into our national political conversations. Founded by Dr. Cathy J. Cohen and housed at the University of Chicago, the GenForward Survey is a nationally representative survey of young adults between the ages of 18 and 34 that is conducted every other month and pays special attention to how race and ethnicity shape people’s attitudes and experiences. To date, the GenForward Survey is the most frequent survey of young adults in the United States.
A defining feature of the Millennial (and subsequent rising) generation is their racial and ethnic diversity. As the United States continues to rapidly diversify demographically, examining differences between racial and ethnic groups must be an essential component of any analysis, but especially generational analyses of the United States population. GenForward data allow us to not only shine a spotlight on young Americans writ large, but further disaggregate the larger category often referred to as Millennials by race and ethnicity. By doing so, our data clarify when and how race and ethnicity are associated with different attitudes, experiences, and behavior. We pay attention to identities such as race and ethnicity because previous research has shown important differences in the experiences, attitudes, and behavior of young adults from different racial and ethnic backgrounds.3
In order to speak meaningfully about communities of color, each GenForward Survey includes oversamples of at least 500 African American, 500 Latinx, and 250 Asian American respondents and is offered in both English and Spanish and via telephone and web modes. Oversampling non-white racial and ethnic groups allows us to compare group attitudes with a higher degree of confidence than other surveys. For instance, the 2016 survey of the American National Election Studies (ANES)—a long-running survey typically considered the gold standard of national political opinion data—interviewed only 122 African Americans, 161 Latinxs, and 41 Asian Americans between the ages of 18 and 34. Low sample sizes such as those of the ANES present a challenge to researchers by introducing substantially more uncertainty into the inferences analysts can draw about those populations, as well as limiting the ability to explore subgroup differences along lines of gender or education, to name only two examples.
In this chapter, we try to address gaps in our knowledge about the economic lives of young adults, especially African American, Latinx, and Asian American young adults. In the following pages, we present a high-level overview of some our data as it relates to young people and work, highlighting important differences by race and ethnicity. We draw from two GenForward data sets, February 2019 and April 2017, covering five main themes. First, we will present data outlining the structure of work and economic lives of Millennials; second, young adult perceptions of their economic futures; third, experiences with credit, banking, and retirement planning; fourth, readiness for financial emergencies and external support; and lastly, economic policy preferences.
What the Data Tell Us about Millennials’ Economic Attitudes and Experiences
The Structure of Work / Economic Lives
A natural starting point for considering the structure of work for Millennials is employment. How many Millennials are actually working, and how does that number vary by race and ethnicity?4 According to our February 2019 data, we find that Asian American Millennials are more likely to say they’re working full-time (61 percent) when compared to their African American (50 percent), Latinx (49 percent), and white (53 percent) peers. This represents a slight change from April 2017, when 61 percent of white Millennials reported being employed in full-time work compared to 52 percent of Asian Americans and 44 percent of both Latinx and African American Millennials. In fact, more Millennials of color seem to be working in 2019 than 2017 overall; the percentages of African American, Asian American, and Latinx Millennials who reported not working in 2019 dropped 8, 11, and 10 points, respectively, compared to 2017. We should note that the Bureau of Labor Statistics (BLS) does an excellent job of providing detailed employment data, and our estimates of the employment rate for 18- to 34-year-olds are virtually identical to those reported by the BLS.
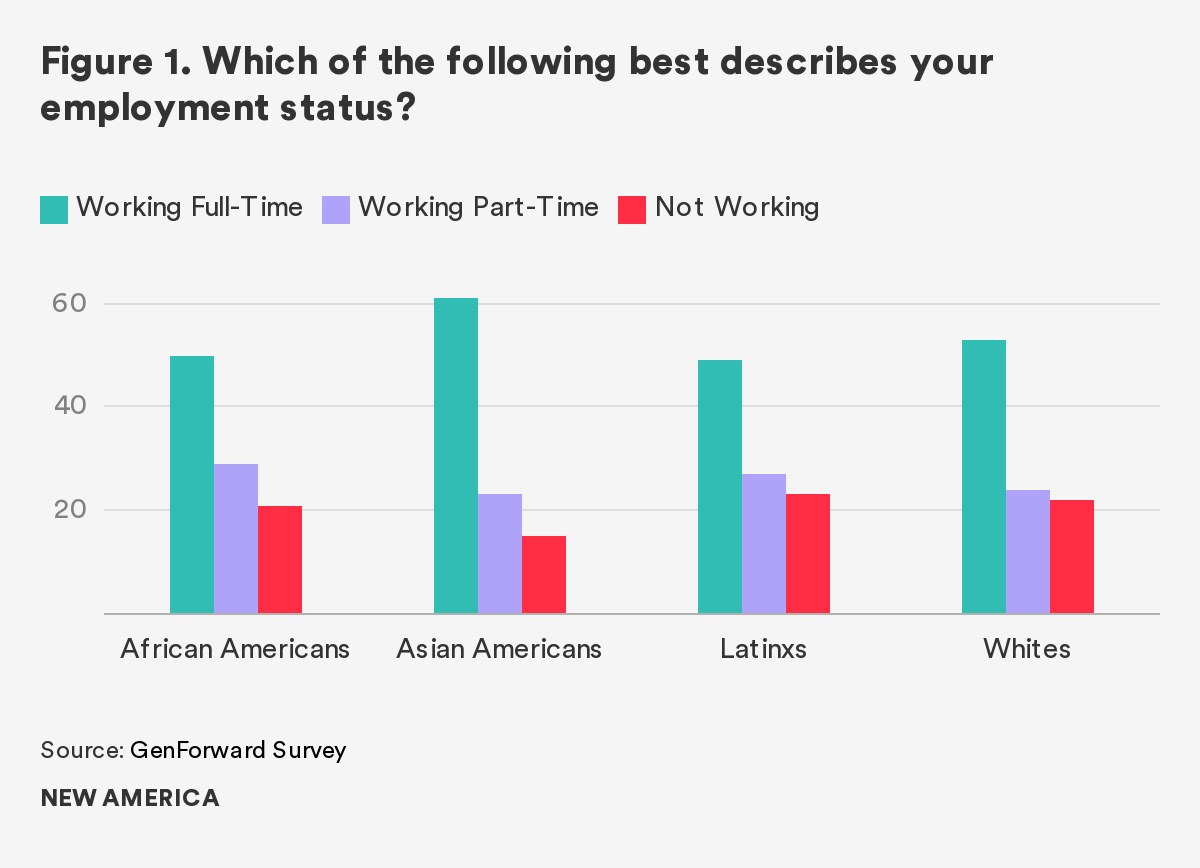
However, employment data reveals only one part of a larger economic story, and the GenForward data allows us to go beyond employment and dig deeper into the economic lives of Millennials. Looking beyond employment offers the opportunity for a more thorough understanding of the economic landscape Millennials face and how it varies by race and ethnicity. For instance, while we find that the overwhelming majority of Millennials in the aggregate—about 77 percent—have not been personally laid off from a job before, over a quarter of African American Millennials say that they have personally experienced a job layoff in their lives. African Americans are also the most likely to be engaged in supplementary employment, meaning they currently hold a secondary job or are engaged in temp or contract work outside of their primary employment. Among employed Millennials, approximately 31 percent of African Americans report engaging in supplementary employment, compared to 20 percent of Latinxs, 18 percent of whites, and 11 percent of Asian Americans.
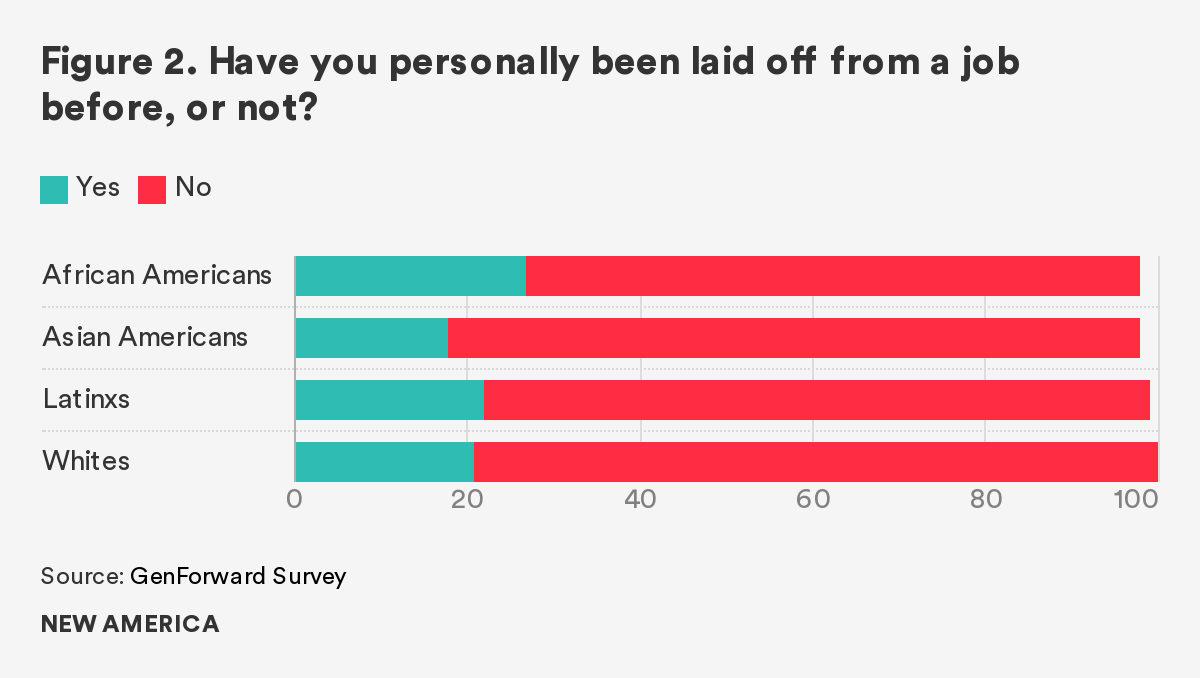
We know that employment can take a number of forms outside of holding one job, and indeed meaningful percentages of Millennials report working multiple jobs. Working multiple jobs demands a large investment of time. Among those who report being engaged in supplementary work, about 38 percent of African Americans say they spend at least 16 hours per week working outside of their primary employment, the most of any racial or ethnic group in our sample. Approximately 29 percent of whites, 28 percent of Latinxs, and 19 percent of Asian Americans say they spend at least 16 hours per week on their supplementary employment.
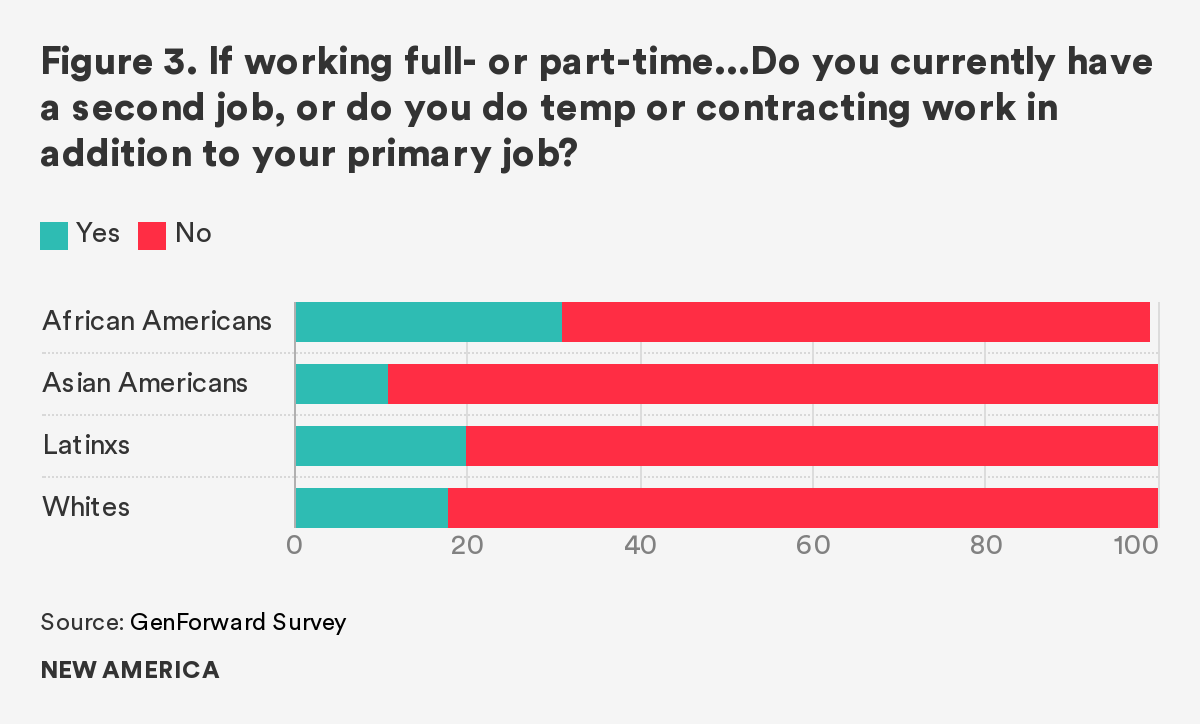
Interestingly, despite working multiple jobs, we do not find strong evidence that Millennials are as plugged into the sharing or gig economy—either by working for or using services provided by companies like Uber or Airbnb—as we might expect, given popular narratives about Millennial preferences for short-term contract work. That said, the data does suggest that African Americans are the most likely to work for a company in the sharing economy. Approximately 17 percent of African Americans say they work for a company in the sharing economy, perhaps a modest percentage on its face but substantially more than the 6 percent of Asian American, 7 percent of white, and 9 percent of Latinx Millennials who respond similarly.
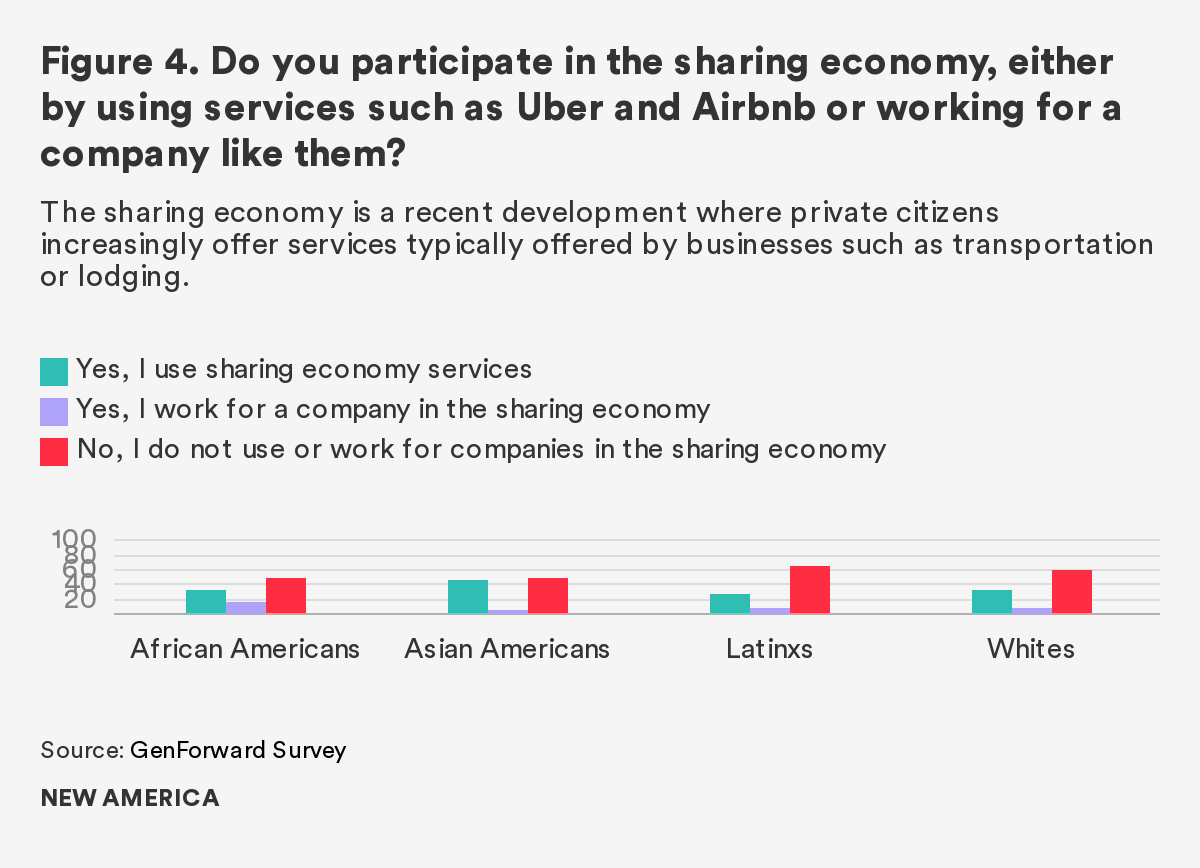
Indeed, when asked if the new structure of work centering on the gig economy—where people function as independent contractors with multiple jobs based on short-term contracts, instead of one long career, often with one company—is preferable, we find that strong majorities of Millennials, and especially white Millennials, believe that having one long career is preferable. Approximately 72 percent of African American, Asian American, and Latinx Millennials and fully 85 percent of white Millennials would prefer having a more traditional job arc spanning one long career to working multiple gigs in the sharing economy.
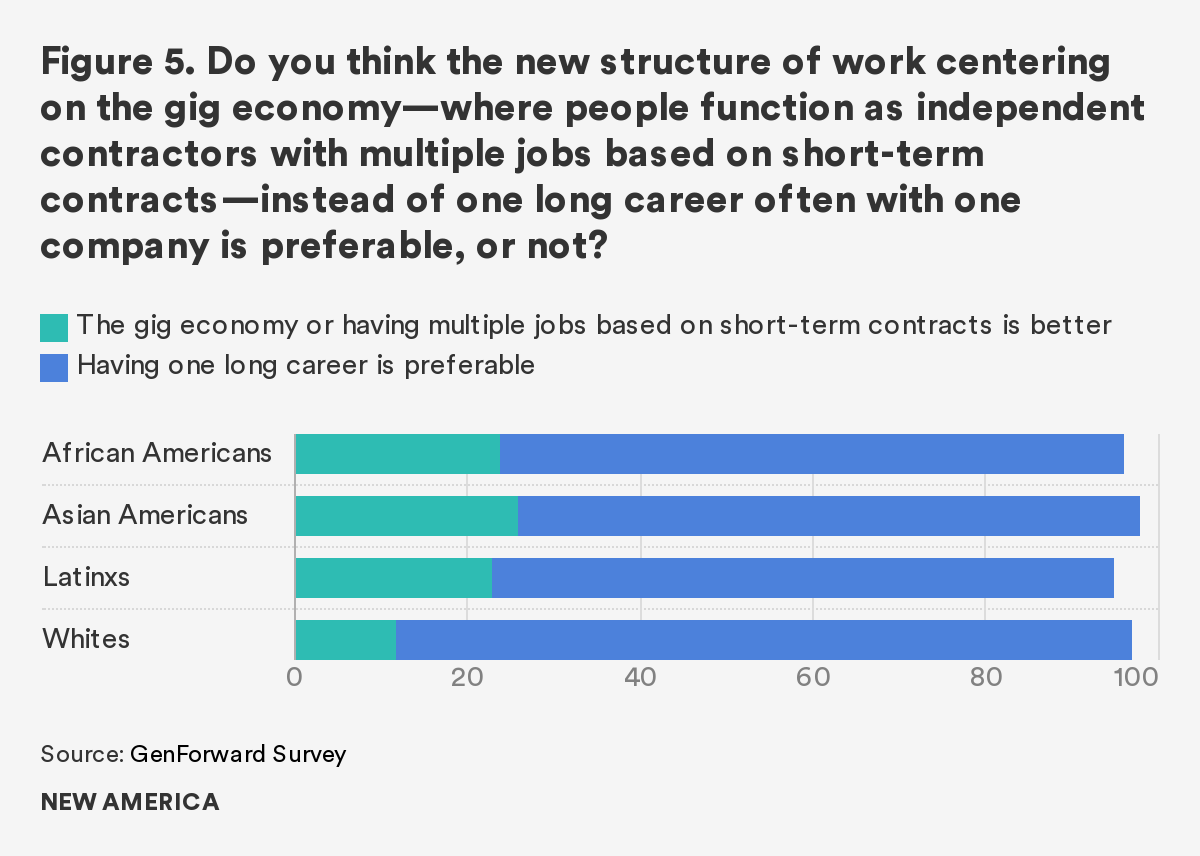
Unfortunately, most Millennials are not engaged in work related to their careers; about 69 percent of Millennials overall consider their current job to be just a job “to get by” or a stepping stone to a career. This is especially true among Latinx and African American Millennials, 78 percent and 73 percent of whom, respectively, say their job is something to get them by or a stepping stone, compared to 63 percent of Asian Americans and 66 percent of whites. Our data further suggests that many of these jobs are not providing Millennials with adequate resources for a strong economic future. Roughly 27 percent of Latinx, 19 percent of white, 16 percent of Asian American, and 14 percent of African American Millennials report not receiving any benefits at their current jobs.
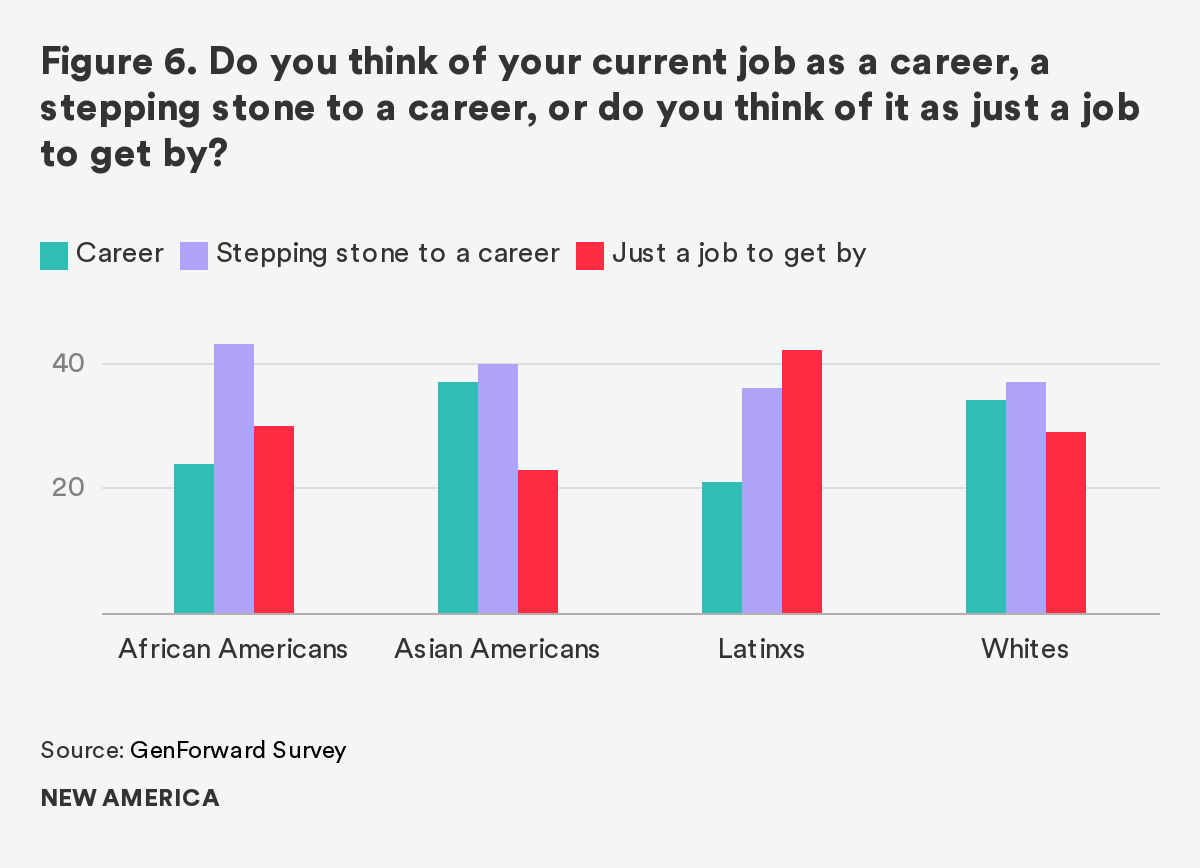
While these data paint a bleak portrait of Millennial employment, those who are employed are fortunate compared to their unemployed peers. Indeed, many Millennials report not having many available options when looking for a job. Roughly 30 percent of young adults between the ages of 18 and 34 say that they do not have access to good jobs, either because such jobs do not exist in their area or because they have no viable transportation options to reach the good jobs that do exist. Once again, African American and Latinx Millennials are particularly disadvantaged when it comes to job options. Nearly 40 percent of African Americans and 44 percent of Latinx Millennials report not having access to good jobs, compared to 29 percent and 31 percent of their white and Asian American peers, respectively. A lack of job options may be a reason why strong majorities of Millennials across race and ethnicity—more than 72 percent overall—say that they are willing to relocate for the right job opportunity.
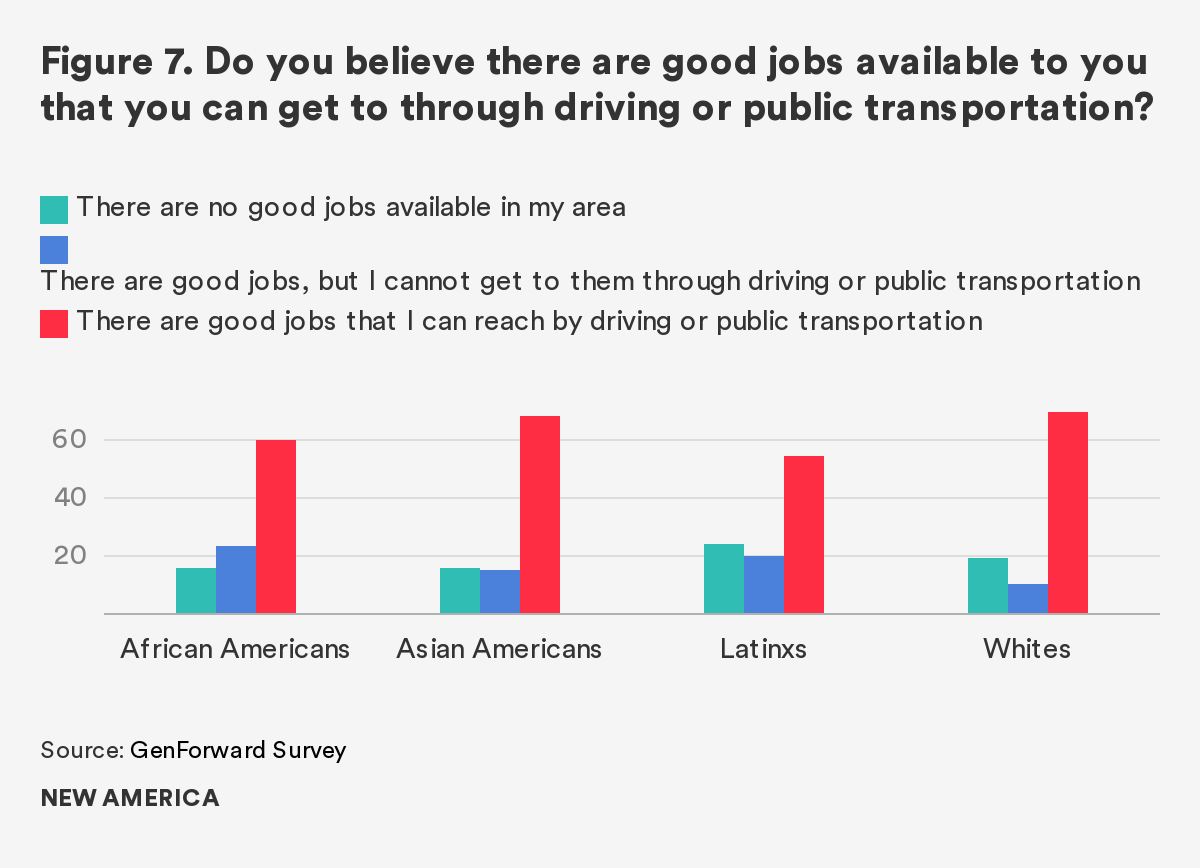
Perceptions of Their Futures
Despite challenging employment prospects and economic conditions, Millennials are generally optimistic that their generation will have a better life than their parents’ generation. African American and Asian American Millennials express particular optimism, with 69 percent and 76 percent saying that they believe it is somewhat or very likely that their generation will have a better life than their parents. Latinxs and white Millennials are not quite as optimistic, though majorities (63 percent and 56 percent, respectively) do say they believe it is at least somewhat likely their generation will have a better life than their parents’ generation.
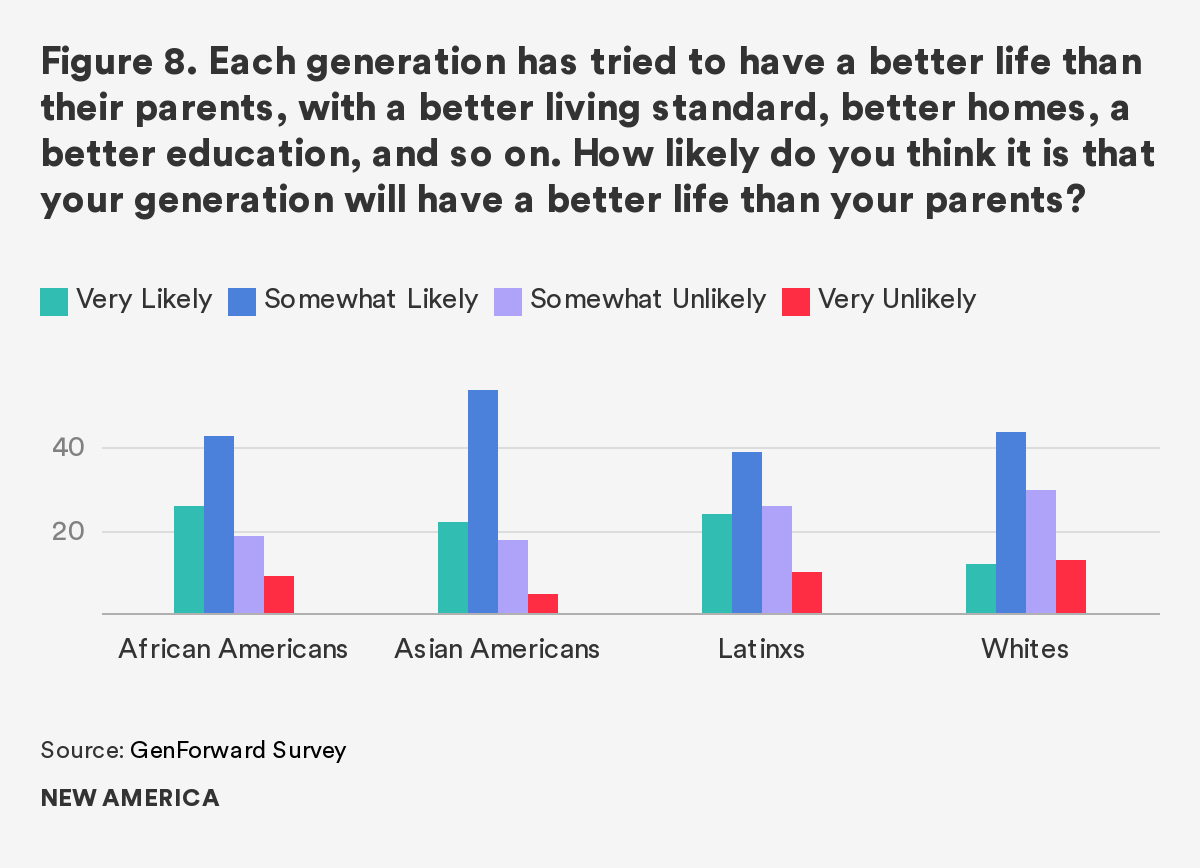
Compared to responses on this same measure in 2017, we find that, overall, Millennials are not significantly more or less optimistic in 2019. On average, 59 percent of Millennials across race and ethnicity in 2017 felt their generation would do better than their parents, compared to 60 percent in 2019. Aggregate perceptions have remained relatively stable despite popular narratives that perceptions of the economy have actually improved over the last couple of years.
Optimism about their generation extends to optimism about their own economic futures. When we change the focus from the generation at large to their own personal prospective evaluations, we find that Millennials generally think they personally will also do better than their parents. Approximately 66 percent of African Americans and Latinxs, 69 percent of Asian Americans, and 53 percent of whites think they will eventually do better than their parents in their household finances. While this perception is somewhat lower among whites than their peers of color, interestingly it is higher among whites than it was in 2017 when we first asked the question. In 2017 less than a majority of white Millennials (47 percent) believed they would do better than their parents financially. This finding makes sense when considering the activation of white concerns around loss of status and standing in society as evidenced by the 2016 presidential election, and the uncertain economic future that Millennials have faced following 2008’s Great Recession.
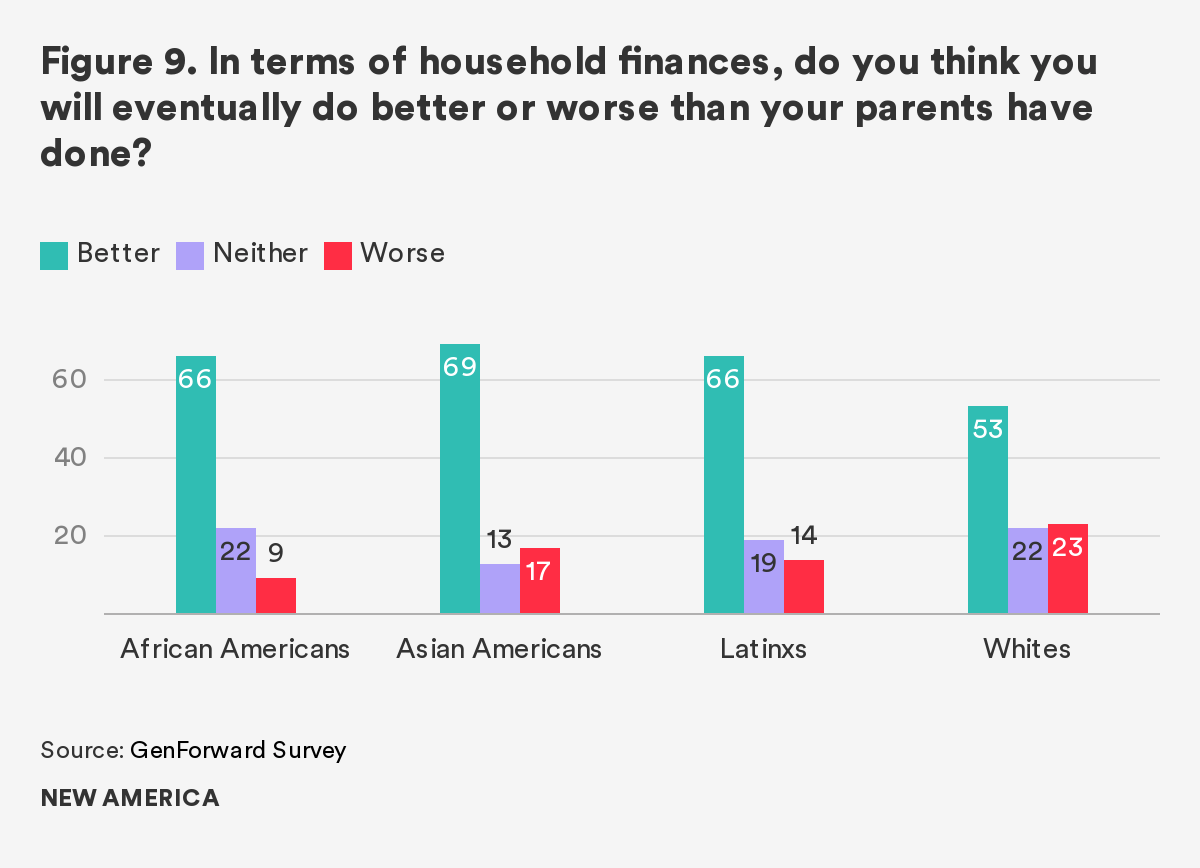
Credit, Banking, and Retirement
Unfortunately, Millennials’ confidence in their economic futures does not extend to retirement. Young adults feel insecure about the future of their savings and investments. In our February 2019 data, we find that nearly half of African American (46 percent) and white (47 percent) Millennials, and over half of Latinx (56 percent) Millennials, are not very or not at all confident that their savings and/or investments will provide them with enough money for their retirement. Asian Americans feel relatively more confident about retirement than their peers, though substantial numbers—36 percent—do not feel very or at all confident that they will have enough money to retire.
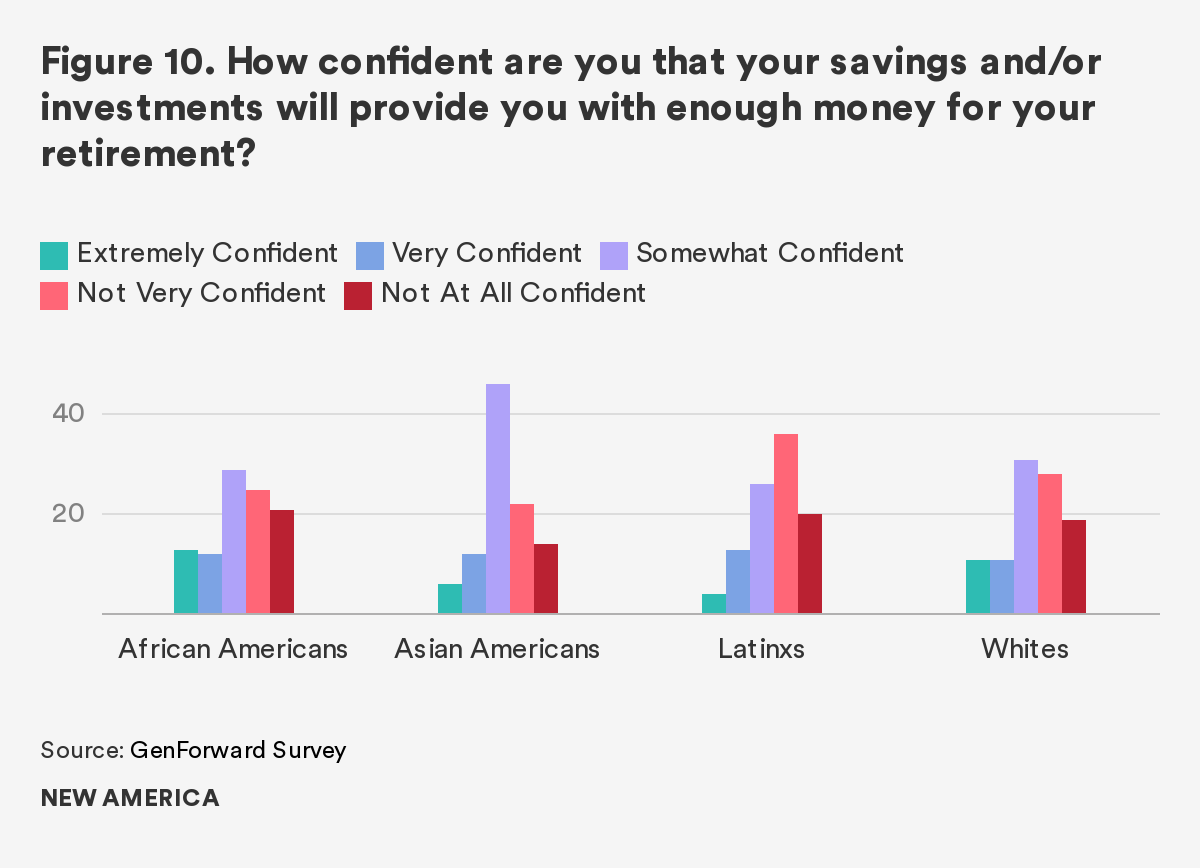
Confidence is also low across the board when respondents are asked about the future of Social Security as opposed to their own savings and investments. Majorities of Millennials, regardless of race and ethnicity, report having very little confidence in the future of the Social Security system. Roughly 55 percent of African Americans, 68 percent of Asian Americans, 60 percent of Latinxs, and 68 percent of whites say they do not feel very or at all confident in the future of Social Security. This is a modest, though by no means insignificant, change from 2017, when large majorities of Millennials also reported feeling not very or not at all confident about Social Security. In 2017, 73 percent of African Americans, 79 percent of Asian Americans, 66 percent of Latinxs, and 77 percent of whites reported feeling not very or not at all confident. Importantly, 62 percent of Millennials in 2017 said that they were planning to rely on Social Security at least a little when they retire. African American and Latinx Millennials were the groups most likely to say they were planning to rely on Social Security a lot, with 21 percent and 16 percent of each respective group reporting planning to rely on Social Security a lot.

Millennials’ reliance on Social Security is not terribly surprising when placed in the larger context of their economic lives. In our same April 2017 survey, significant numbers of Millennials, regardless of race and ethnicity, indicated that they did not have any sort of retirement or pension plan. Approximately 39 percent of Asian American, 41 percent of African American, 42 percent of white, and over half—52 percent—of Latinx Millennials reported not having any retirement savings or pension. Latinx and African American Millennials were also the least likely to have a savings account. Approximately, 57 percent of Latinxs and 63 percent of African Americans said they had a savings account compared to 76 percent of Asian Americans and 81 percent of whites.
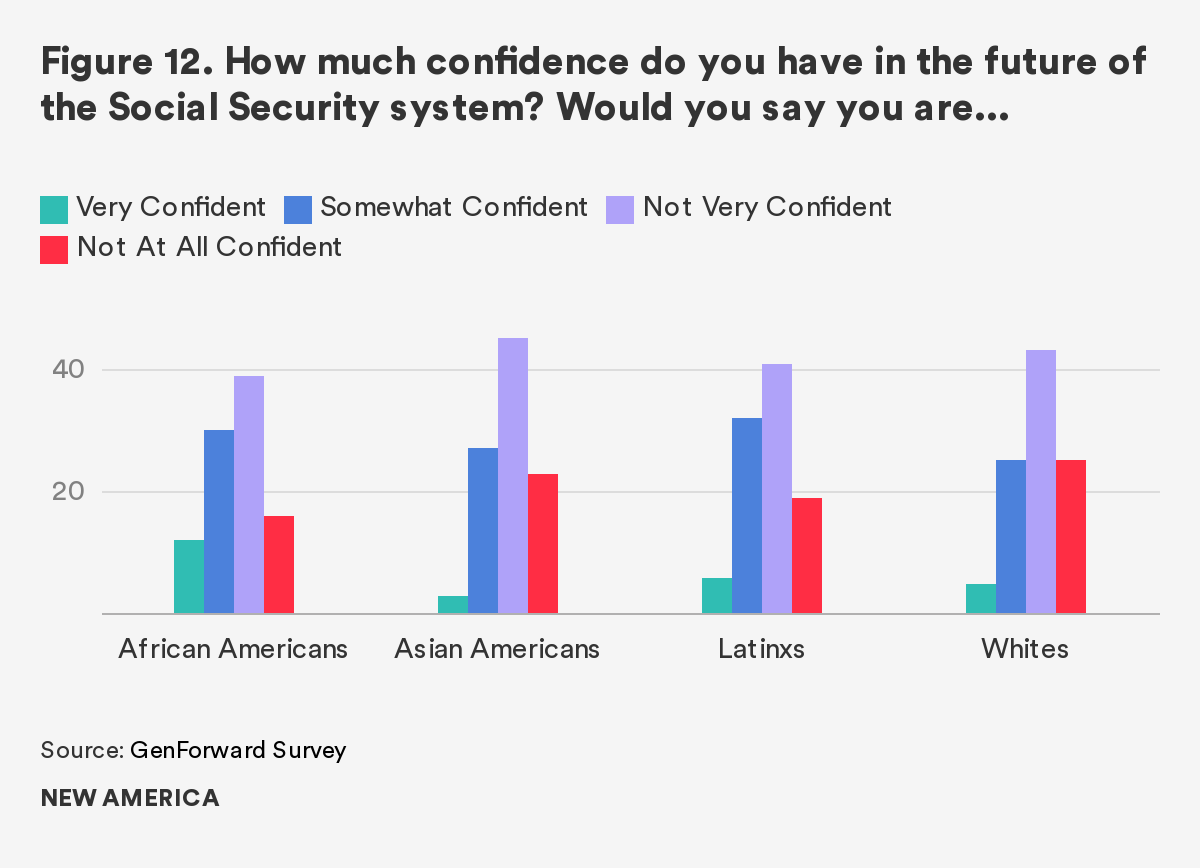
In addition to retirement savings, many Millennials lack access to credit in the form of credit cards. Once again, significantly fewer Latinxs and African Americans reported having a credit card compared to other racial and ethnic groups surveyed. Among African American respondents, only 38 percent reported having a credit card. The percentage was substantially higher among Latinx respondents, 52 percent of whom said they had a credit card. But both African Americans and Latinx respondents were much less likely to have a credit card than Asian Americans or whites, of which 74 percent and 64 percent, respectively, indicated they had a credit card. Interestingly, there were important differences in how white and Asian American Millennials reported using their credit cards; whites report being substantially less likely to use their credit cards for everyday expenses (34 percent) when compared to Asian Americans (62 percent).
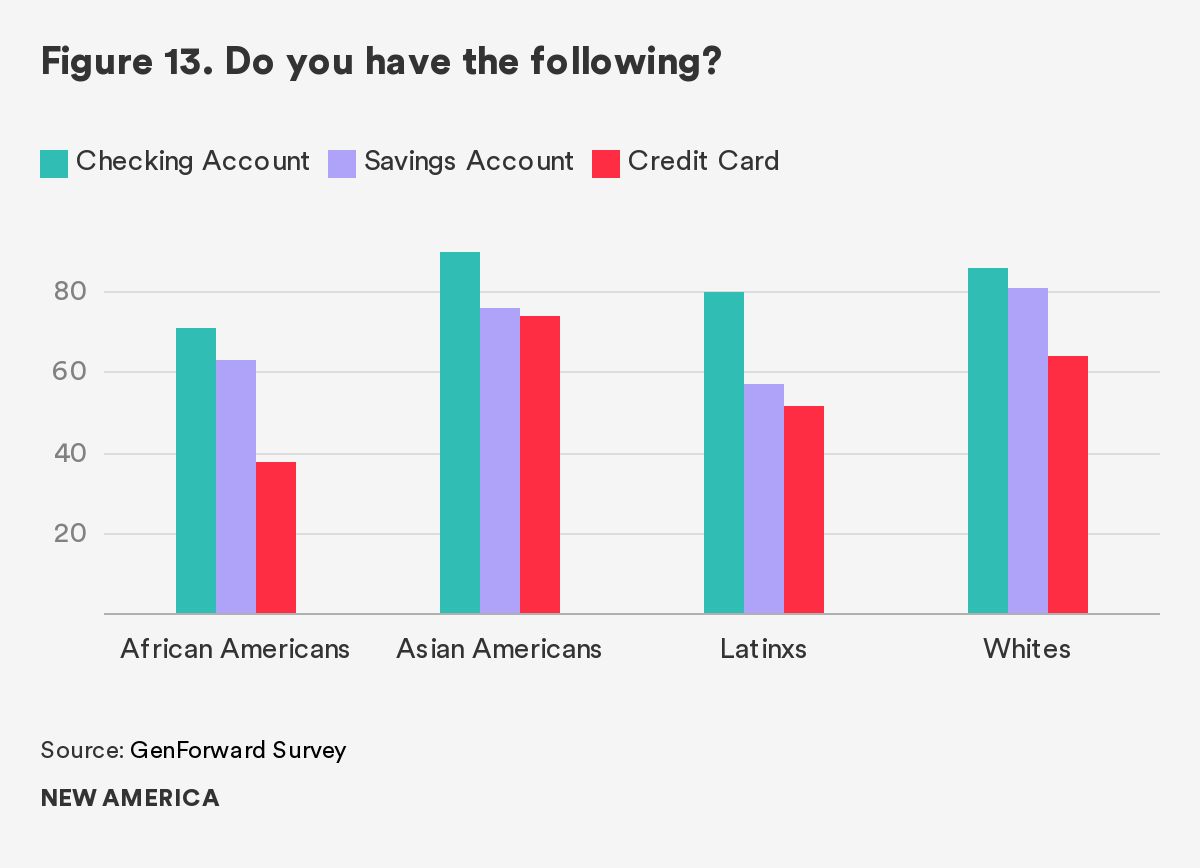
Notably, African Americans were the least likely to have a checking account. Approximately 71 percent of African Americans reported having a checking account, compared to fewer than 80 percent of Latinxs, 86 percent of whites, and 90 percent of Asian Americans who responded similarly. Lack of access to banking services is likely a contributing factor in African Americans’ reliance on non-banking financial services, such as payday loans, check cashing services, and pawnshop loans. Services such as these are known to be predatory and negatively impact the financial health of those who rely on them, which our data suggests is often people of color. A significantly higher number of whites say that they have never used these services when compared to their peers of color. Inversely, African American Millennials seem to rely on or at least use these services more than their peers. For example, 88 percent of white Millennials say they have never used a payday loan, compared to 65 percent of African American Millennials. When asked about check cashing services, 69 percent of white Millennials report never having used a check cashing service. On the other hand, far fewer African Americans—approximately 37 percent—say they have never used a check cashing service instead of a bank.
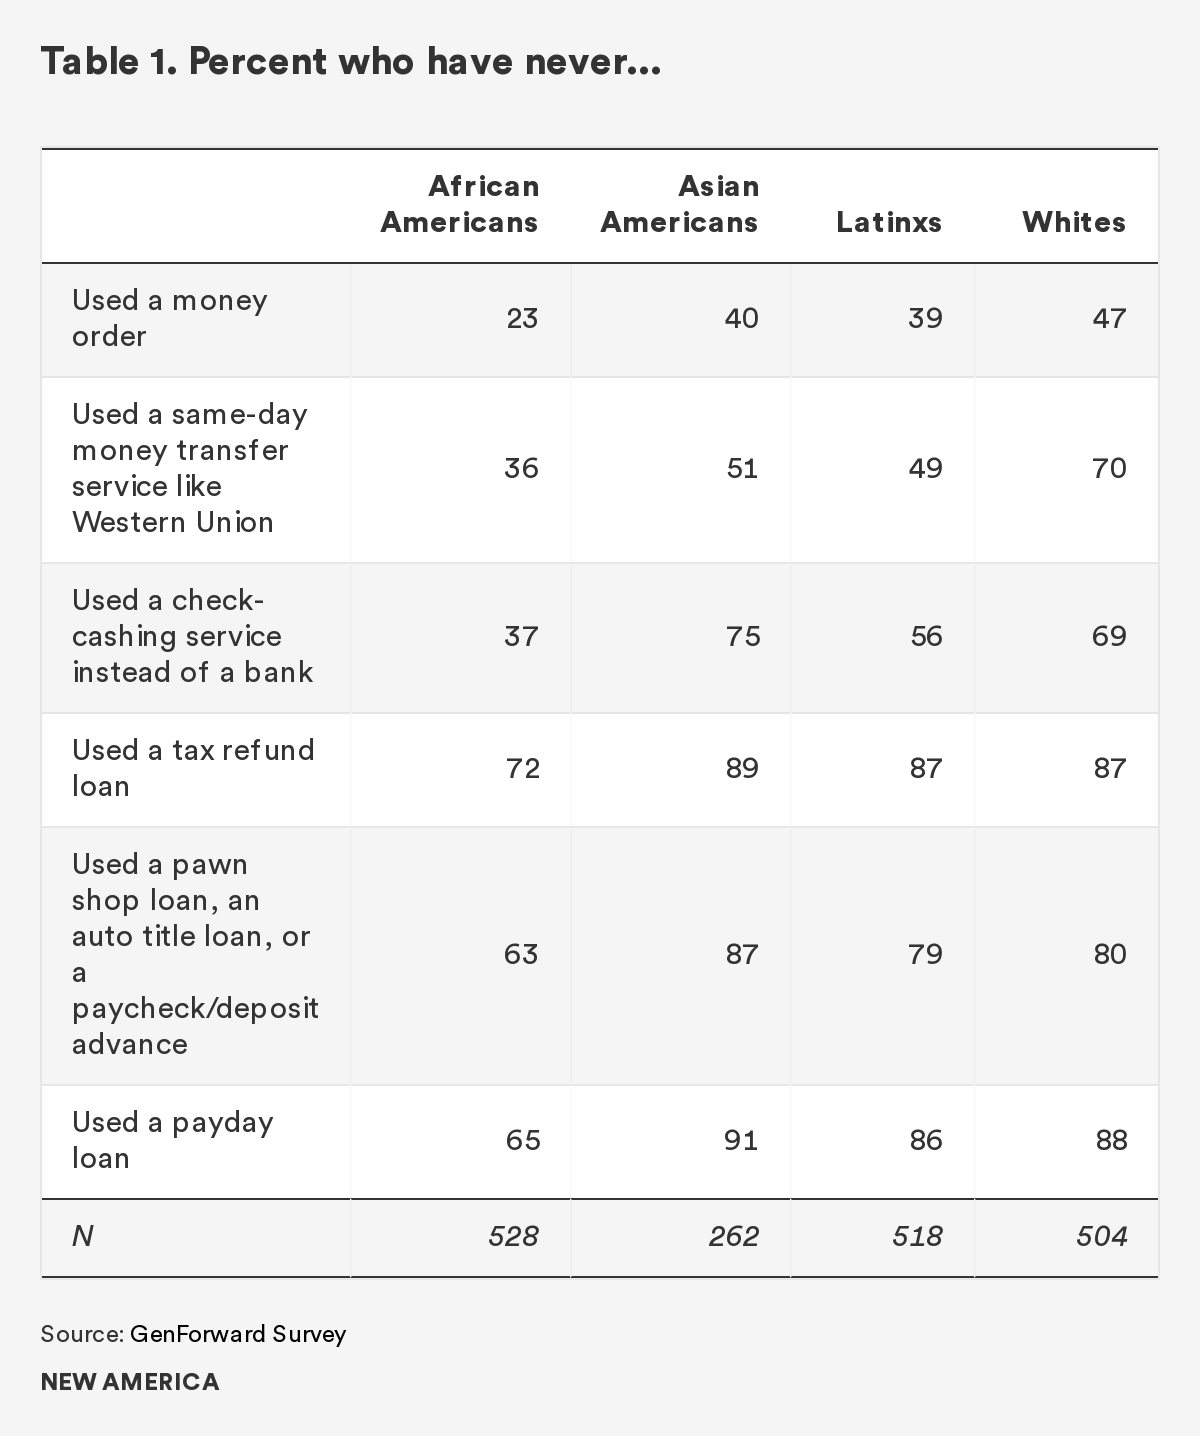
Financial Emergencies and Family Support
Encountering a financial emergency would have severe deleterious effects on the economic health of many Millennials. Nevertheless, facing an unexpected financial emergency would have disparate impacts on Millennials depending on their race and ethnicity. These effects would be most severe for Millennials of color. For example, in our April 2017 survey, exactly half of African American Millennials we sampled said they would have a lot of financial difficulty paying an unexpected bill of $1,000. Approximately 43 percent of Latinx Millennials also reported that paying an unexpected bill of $1,000 would cause them a lot of financial difficulty, compared to 35 percent of white and 28 percent of Asian American Millennials.
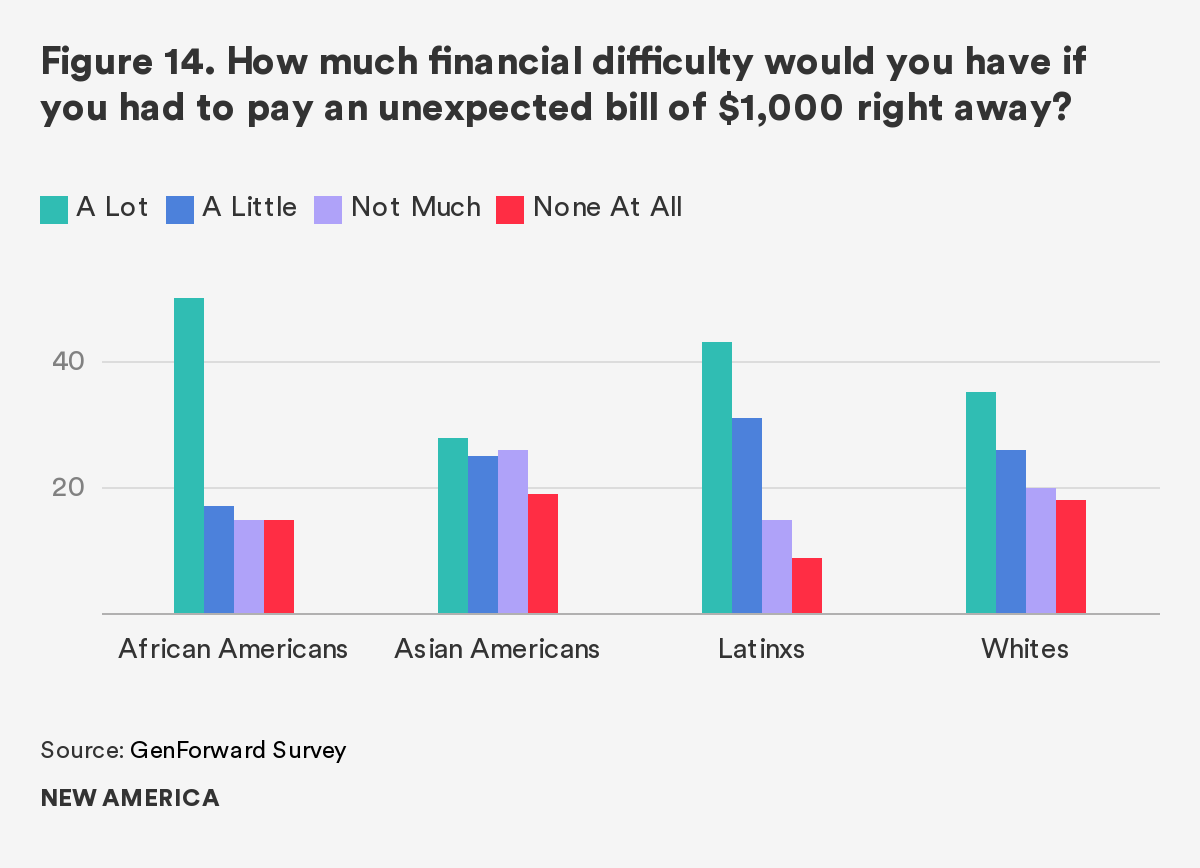
Moreover, fully 30 percent of African American Millennials reported that they would not be able to pay for an unexpected emergency. Only 7 percent of Asian Americans, 14 percent of whites, and 18 percent of Latinxs said they would not be able to pay for an emergency. Asian American (47 percent) and white (35 percent) Millennials in particular reported simply paying for the emergency using money from their savings. Fewer Latinx respondents said that they would pay for the financial emergency using savings (20 percent). Instead, the plurality of Latinx respondents, 30 percent, said that they would borrow money from family and friends to pay off the unexpected expense.
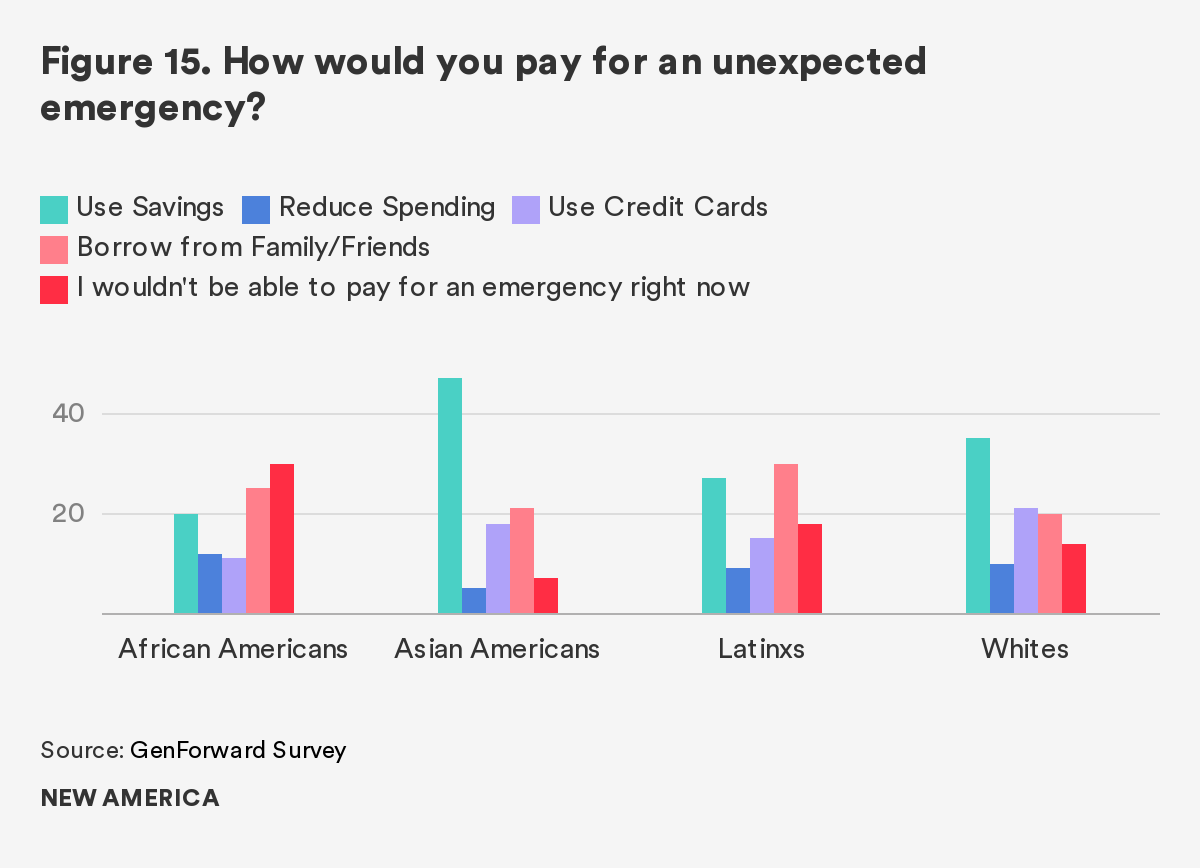
Despite indicating that they would rely on family and friends, 45 percent of Latinxs reported that it would be somewhat or very unlikely that their family could help pay for an unexpected bill of $1,000. This percentage of Latinx Millennials is still lower than that of African Americans, roughly 61 percent of whom say it would be somewhat or very unlikely that their parents could help pay for a financial emergency. What is more, of those 61 percent of African Americans, a full 40 percent indicate that it would be very unlikely, which is substantially higher than their Latinx (33 percent), Asian American (24 percent), and white (26 percent) peers.
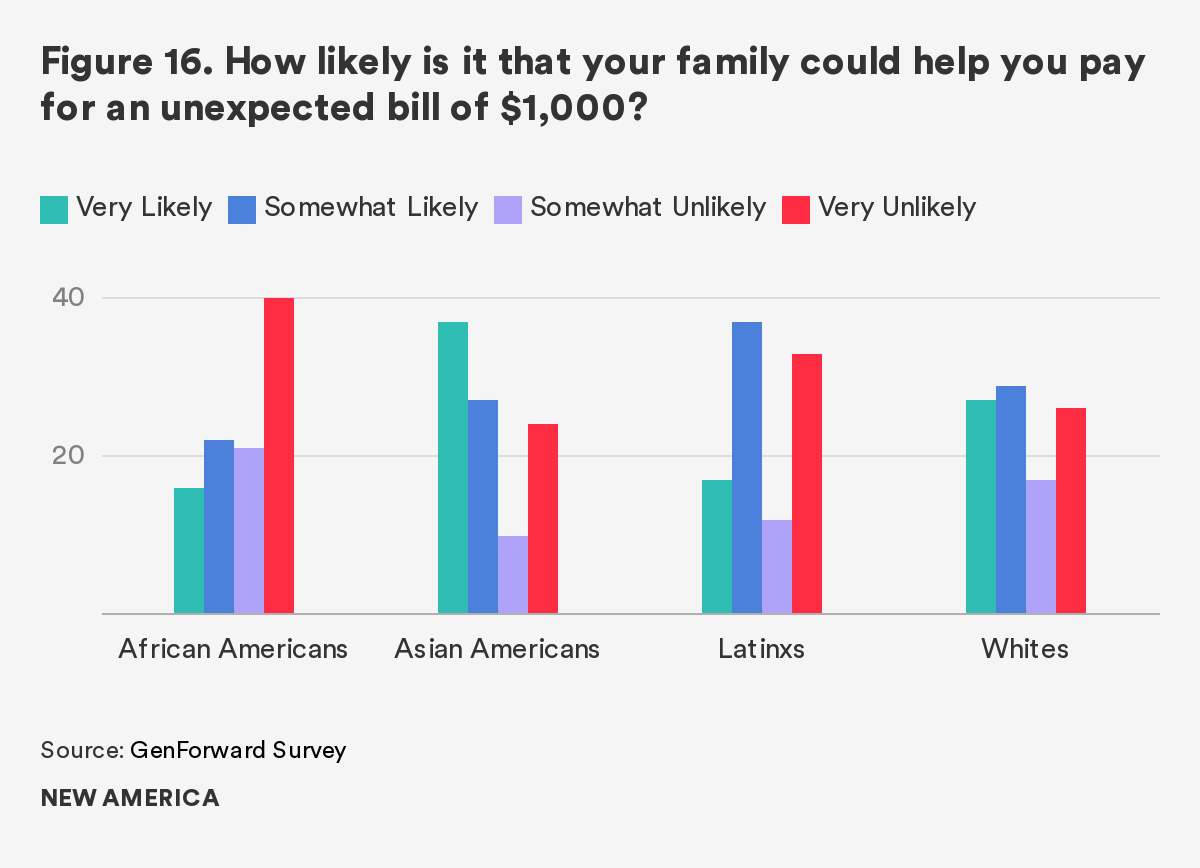
Economic Policy Preferences
Taken together, the data presented above on the nature of work for Millennials, their perceptions of their financial futures, and access to savings, credit, and external financial support by family complement and strengthen recent narratives of Millennials as a generation facing real economic challenges. These data also provide important contextual information for understanding their economic policy preferences. On average, the preferences of young adults are significantly more progressive than those of older citizens.5
By and large, Millennials express strong support for more government action aimed at reducing economic inequality, and endorse progressive economic policy prescriptions put forward by political elites like Sen. Elizabeth Warren.
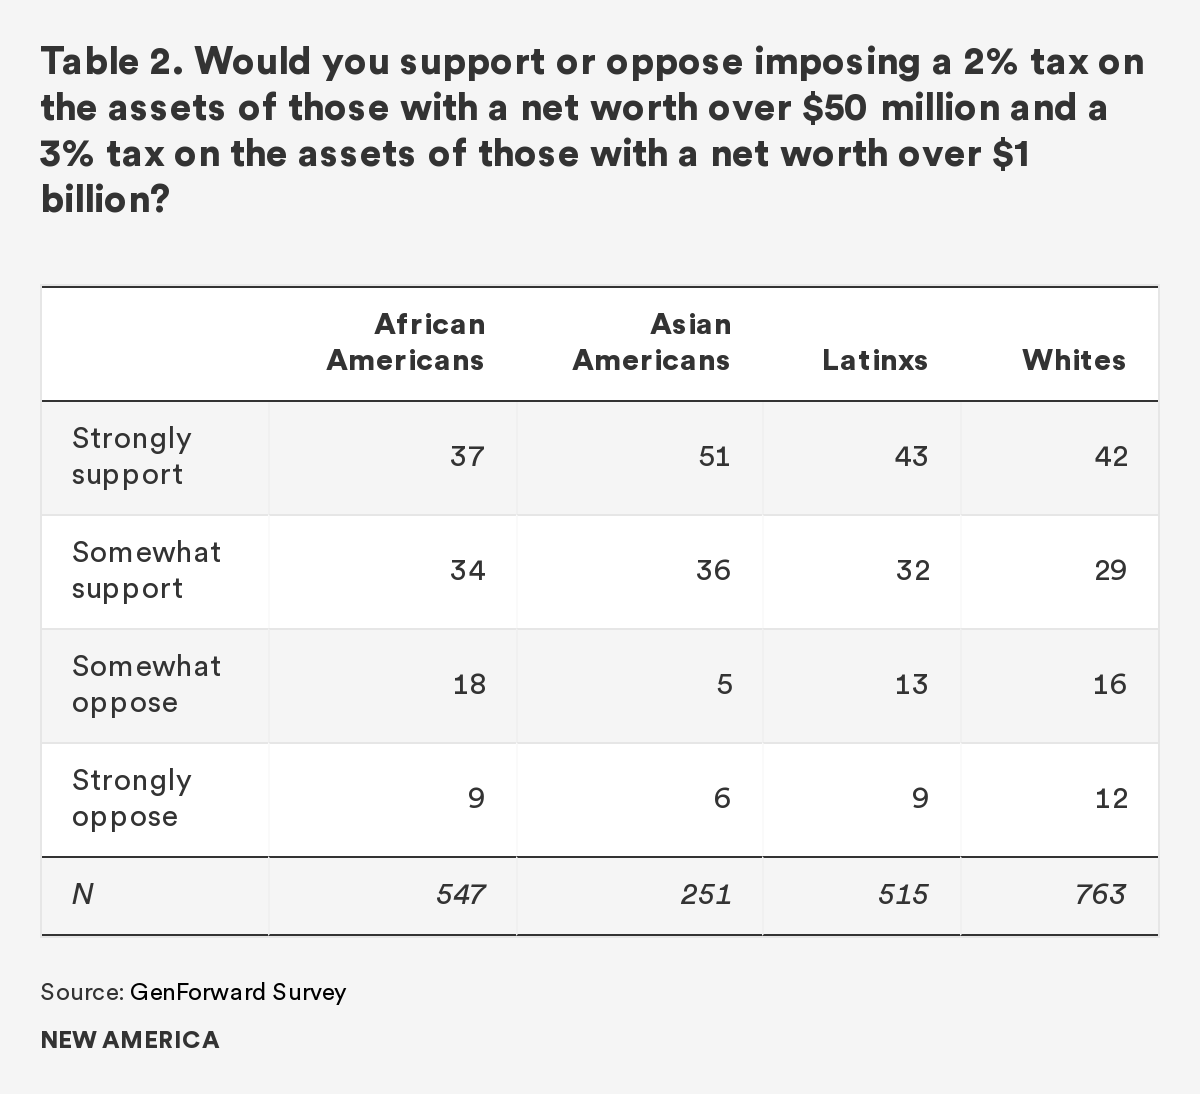
In her current campaign for president, Sen. Warren has announced a number of detailed policy proposals. One of her earliest and most discussed proposals centers on a new wealth tax that would impose a 2 percent tax on the assets of people with a net worth over $50 million and 3 percent tax on the assets of those with a net worth over $1 billion. The proposal has caused a flurry of debate and controversy at a national level, but our 2019 data suggests it is overwhelmingly popular among 18- to 34-year-olds, regardless of race and ethnicity. Approximately 71 percent of African American, 75 percent of Latinx, 87 percent of Asian American, and 71 percent of white Millennials support Sen. Elizabeth Warren’s proposed wealth tax.
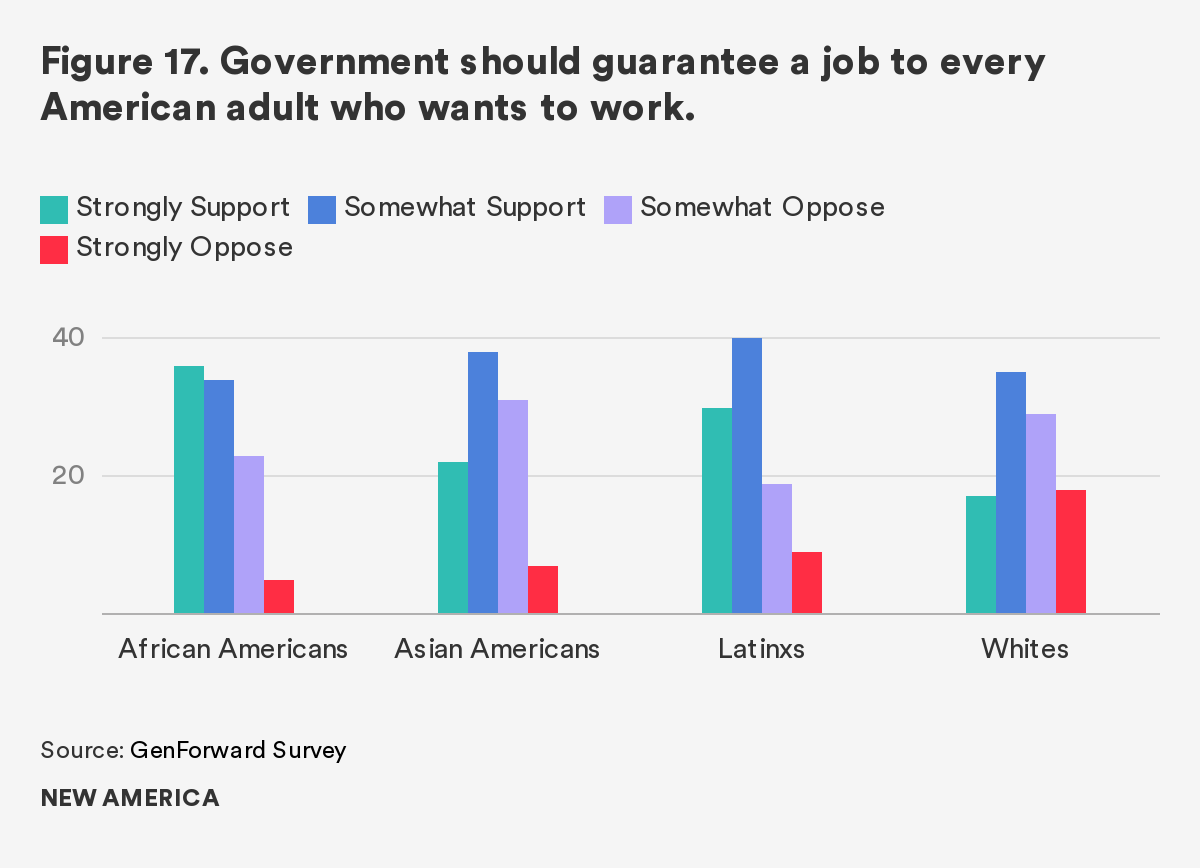
We find similar support for a perhaps even more controversial policy proposal put forward by the left flank of the Democratic Party and other political progressives: a universal job guarantee. Approximately 70 percent of African Americans, 70 percent of Latinxs, 60 percent of Asian Americans, and 52 percent of whites in our February 2019 survey believe that the government should guarantee a job to every American adult who wants to work. Notably, support is highest among Millennials of color, especially African American and Latinx Millennials, compared to white Americans. When considering the racial ethnic divides in the larger portrait of Millennials’ economic lives, however, the expressed differences in policy preferences between white Millennials and Millennials of color are not as surprising.
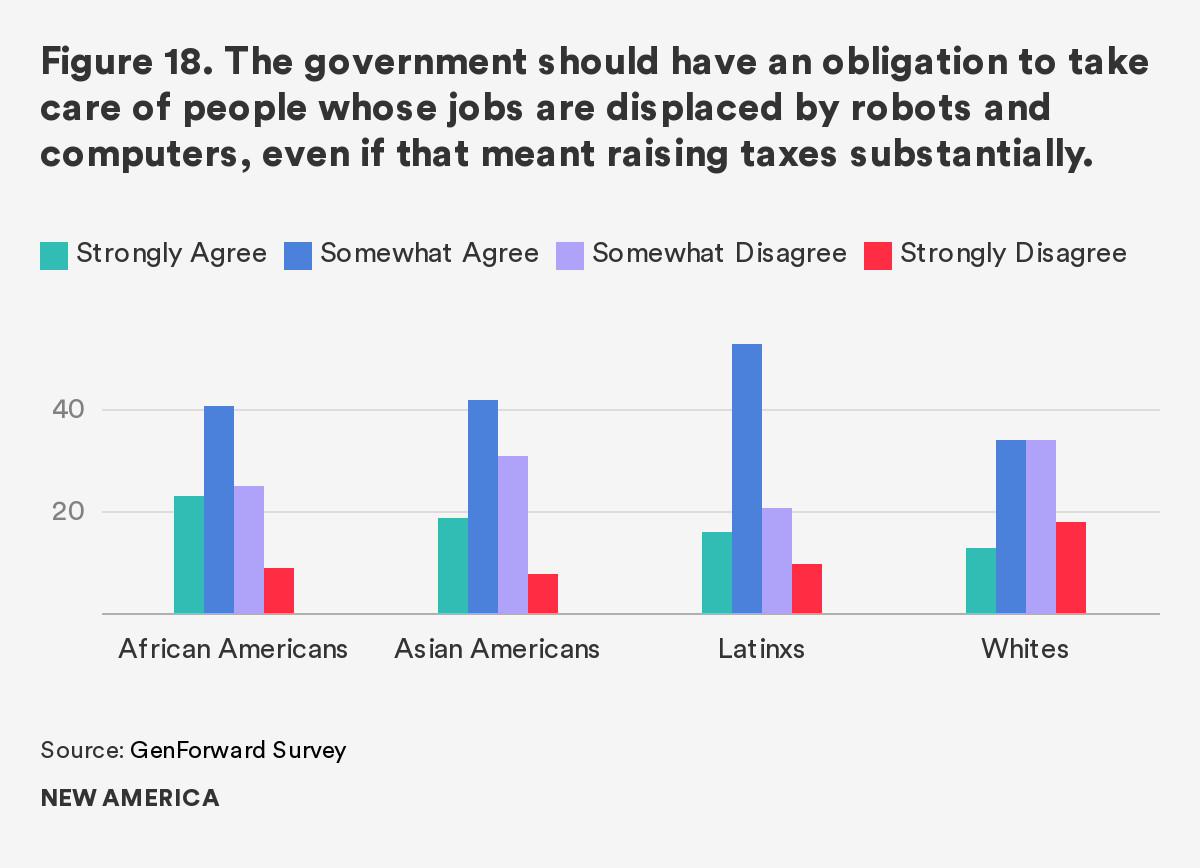
Millennials’ expressed preference for strong government protections remains steadfast even in the face of increased taxes. In general, Millennials report strong support for the government taking care of people whose jobs are displaced by robots and computers, even if that means raising taxes substantially. Approximately 72 percent of African Americans, 88 percent of Latinxs, 69 percent of Asian Americans, and 64 percent of whites strongly or somewhat support a policy that requires companies to pay a tax that goes to retraining displaced workers. And support among Millennials of color doesn’t drop as much as analysts might expect when they are explicitly told that enacting such a policy would mean raising taxes substantially. Support remains high, with about 64 percent of African Americans, 69 percent of Latinxs, and 61 percent of Asian Americans indicating they strongly or somewhat support the government having an obligation to take care of workers displaced by robots and computers, even if it means raising taxes substantially. Support drops to under a majority, or less than half of respondents, only among whites, roughly 47 percent of whom say that they support the government taking care of displaced workers even if it means raising taxes.
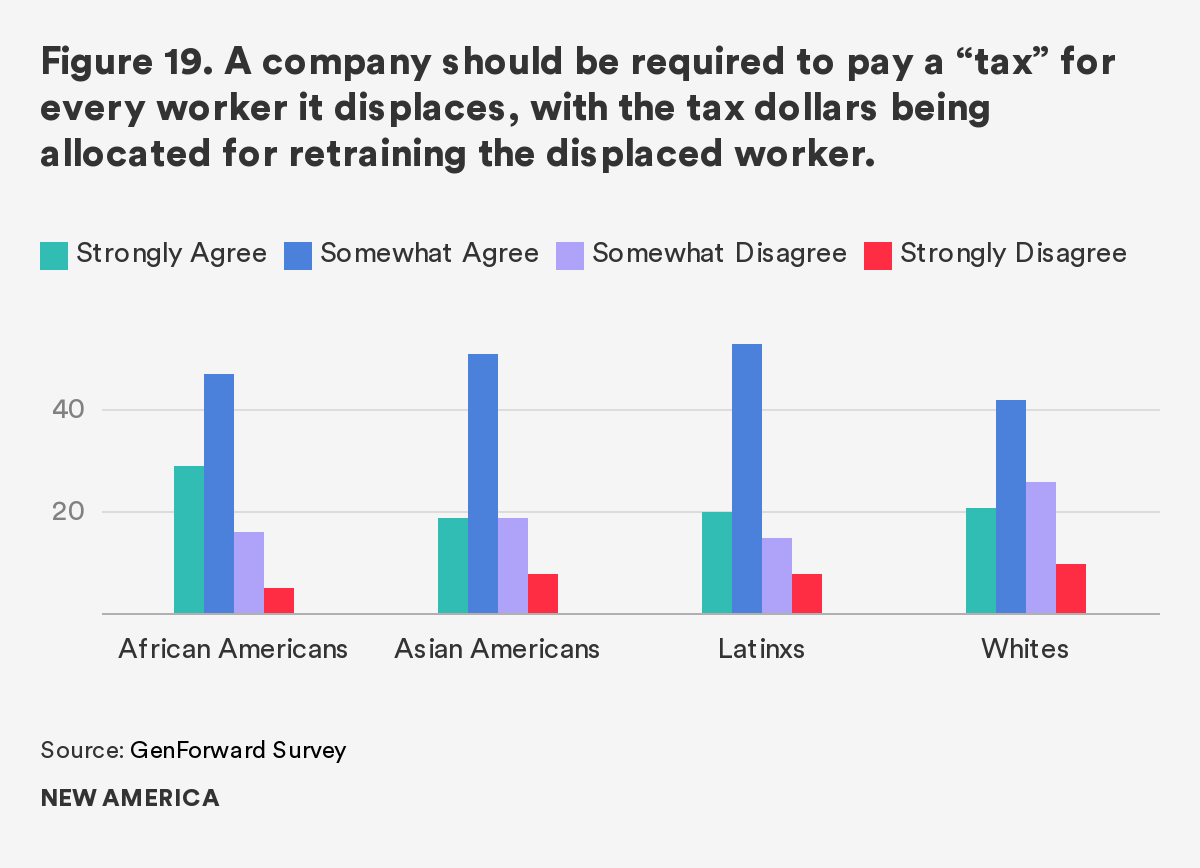
However, Millennials do not view being taken care of by the government as the ideal outcome. Instead, large majorities of Millennials across race and ethnicity exhibit support for taxes being used to retrain displaced workers. Approximately 76 percent of African American, 73 percent of Latinx, 70 percent of Asian American, and 63 percent of white Millennials say they somewhat or strongly support companies being required to pay a tax for every worker they displace, with the tax dollars being allocated to retraining the displaced workers.
Conclusion
While Millennials share unique cultural touchstones that distinguish them from older generations, universalizing generalizations about their preferences and behaviors miss their diverse perspectives. It is true that Millennials as a generation face common realities, as they have experienced the same shifts in the American economy. Nevertheless, different subsets of Millennials encounter and experience these economic shifts in very different ways as a function of their distinct social histories and group positions.
Millennials are not a monolith, and as such, it is crucially important that analysts acknowledge and examine the Millennial generation with a deliberate understanding that race and ethnicity structure the lives of individuals distinctly. Understanding when and how race and ethnicity shape the lived experiences of Millennials is vitally important from a practical policy perspective. Privileging race and ethnicity in analyses of Millennials has important implications for how we understand the economic issues Millennials confront, and, perhaps more importantly, for how we design policy in the face of that understanding. Ignoring or overlooking demographic differences will continue to produce misalignment between public policy and the lived experiences of individuals. Gathering and sharing more nuanced data by race and ethnicity allows us to more accurately diagnose and prescribe policy interventions aimed at closing the economic gaps both between and within generational cohorts.
Citations
- Rana Foroohar. Makers and Takers: The Rise and Fall of American Business. New York, NY: Crown Publishing Group. 2016.
- Anne Helen Petersen. “How Millennials Became The Burnout Generation.” BuzzFeed News. January 5, 2019. source
- Vincent L. Hutchings and Nicholas A. Valentino. “The Centrality of Race in American Politics.” Annual Review of Political Science 7(1): 383–408. 2014.
- While we recognize that generational cutoffs are the subject of ongoing debate, we use the term Millennials to describe all individuals between the ages of 18 and 34 for ease of explication.
- Stella M. Rouse and Ashley D. Ross. The Politics of Millennials: Political Beliefs and Policy Preferences of American’s Most Diverse Generation. Ann Arbor, MI: University of Michigan Press. 2018.
The Financial Lives of Millennials: Evidence from the U.S. Financial Health Pulse
Thea Garon
The financial challenges of Millennials have been well-documented in the pages of this volume and elsewhere. Coming of age in the shadow of the Great Recession, Millennials entered the job market during one of the worst economic downturns in decades, and now face mounting student loan debt, sky-high housing and healthcare costs, and increasingly precarious work environments.
Yet too often these challenges are considered in isolation from one another. This is a mistake. To truly understand the complex financial lives of Millennials, we need to consider the totality of their financial lives and how their ability to spend, save, borrow, and plan is facilitating—or hindering—their ability to be resilient and thrive over the long run. Only by considering the financial lives of Millennials through a holistic lens can financial service providers, policymakers, regulators, and other industry stakeholders develop solutions that help today’s young people lead financially stable lives now and in the future.
Measuring Financial Health
At the Financial Health Network, we suggest looking at the lives of Millennials through the lens of “financial health,” a composite metric that pulls together the multiple strands of an individual’s financial life. A financially healthy life comes about when one’s daily financial systems function well and set them up to be resilient and pursue opportunities over time. Unlike narrow metrics like credit scores, financial health considers the totality of an individual’s financial health across four areas: spending, saving, borrowing, and planning.
Financial health can be measured by collecting survey data that align with eight indicators of financial health. For every individual who responds to all eight survey questions, one aggregate financial health score and four sub-scores can be calculated.
Financial health scores:
- 80 – 100 are considered Financially Healthy; people with scores in this range are spending, saving, borrowing, and planning in a way that will allow them to be resilient and pursue opportunities over time.
- 40 – 79 are considered Financially Coping; people with scores in this range are struggling with some, but not necessarily all, aspects of their financial lives.
- 0 – 39 are considered Financially Vulnerable; people with scores in this range are struggling with all, or nearly all, aspects of their financial lives.1
Exploring the financial lives of Millennials through a financial health framework offers new insight into the needs and challenges of this unique demographic. According to data from the 2019 U.S. Financial Health Pulse consumer survey, only 24 percent of Millennials are Financially Healthy.2 These individuals are spending, saving, borrowing, and planning in a way that will allow them to be resilient in the face of unexpected events and pursue opportunities over time. Just over half of Millennials (54 percent, approximately 43.4 million people) are Financially Coping; these individuals are struggling with some, but not necessarily all, aspects of their financial lives. A sizeable portion of Millennials (22 percent, approximately 17.8 million people) are Financially Vulnerable; these individuals are struggling with most, if not all, aspects of their financial lives.
Disaggregating the Data
Of course, Millennials are not a monolithic group. As with other socioeconomic outcomes, financial health diverges sharply along racial and ethnic lines. White Millennials are more likely to be financially healthy than Black and Hispanic Millennials (27 percent, compared with 16 percent and 19 percent, respectively). These patterns hold true across many of the eight indicators of financial health. For example, 47 percent of Hispanic Millennials and 48 percent of Black Millennials report paying all of their bills on time, compared with 62 percent of White Millennials. Black and Hispanic Millennials are also far less likely to report having strong credit scores: 33 percent of Hispanic Millennials and 26 percent of Black Millennials say they have “very good” or “excellent” credit scores, compared with 46 percent of White Millennials.
These disparate financial health outcomes are the result of decades of discriminatory policies that have made it far harder for non-White Americans to build and transfer wealth to future generations. The enduring legacy of these policies can be observed in our data in terms of self-reported rates of generational mobility. While comparable numbers of White, Black, and Hispanic Americans say their families struggled financially while they were growing up, Black and Hispanic respondents are far less likely than their White counterparts to be financially healthy today. Among all respondents who say they struggled financially growing up, only 18 percent of Black respondents and 14 percent of Hispanic respondents are financially healthy today, compared with 29 percent of White respondents.3 These disparate outcomes suggest that the legacy of historic policies have had a lasting effect on opportunities for generational mobility among Black and Hispanic Americans.
Workplace Instability and Employee Benefits
Beyond demographics, Millennials’ financial health is shaped by the nature of their employment, and the corresponding impact this has on their income. Millennials who say their schedules are consistent, or that their hours vary at their request, are 2.2 times more likely to be financially healthy than those who say they their schedules vary based on their employers’ needs. Likewise, Millennials who say their income is roughly the same amount each month are 2.3 times more likely to be financially healthy than those who say their income varies month to month. These associations hold true even after controlling for socioeconomic and demographic factors, such as age and income.4
Access to workplace benefits also plays an important role in shaping one’s financial health: Millennials whose employers offer health insurance and paid sick leave are 2.3 times and 1.9 times, respectively, more likely to be financially healthy than their counterparts who do not have access to these workplace benefits.5 Collectively, these findings suggest that there are opportunities to address workplace instability in two key ways: at its source, by making employees’ hours and wages more predictable and less volatile, and by treating the symptoms of instability through employee-provided benefits, such as paid leave and healthcare. Since finances are the greatest source of employee stress, employers can offer products and solutions to help employees budget their money, manage debt, build emergency savings, and plan for the future.6
The Role of Financial Service Providers
Financial service providers have an essential role in responsibly meeting the financial needs of Millennials. By leveraging their comfort with technology, providers can design high-quality digital products and services that help today’s young people lead financially healthy lives. A majority of Millennials (65 percent) say they have used online banking in the last 12 months, and even more (72 percent) say they have used mobile banking in the last 12 months.7 Millennials also report high levels of engagement with other types of digital tools, such as personal financial management apps that categorize and track spending and automatic transfers to move money from checking accounts to savings accounts. Financial service providers can capitalize on these behaviors by developing affordable, accessible, and customizable products that help their clients manage their finances and achieve their financial goals.
Indeed, our data show that Millennials expect nothing less from financial service providers. A majority of Millennials (57 percent) say that it is “extremely” or “very” important that their primary financial institution help them improve their financial health.8 More than one in five rank “how much a financial institution cares about [my] financial wellbeing” as one of the top three reasons for why they would choose to do business with a financial institution.
And yet, just 14 percent of Millennials “agree strongly” with the statement: “[My primary financial institution] helps me improve my financial health.” This is a missed opportunity. Millennials who say their primary financial institution is helping them improve their financial health are far more likely to be satisfied with that company, to recommend the company to family or friends, and to say that they will obtain financial products and services from that company in the future. These trends hold true across financial health tiers and demographics. Investing in the financial health of customers is not just the right thing to do, it’s also the profitable thing to do, especially as more Millennials are turning to mobile-first “neo-banks” that promise great consumer centricity and social impact.
Policy and Regulatory Opportunities
Policymakers and regulators have essential tasks to assume in improving the financial health of Millennials. For starters, these entities can invest in clear and consistently applied consumer protections that support consumers’ financial wellbeing. Policy innovations that balance the need for short-term savings and debt management with long-term savings can help individuals build financial resilience. Modernizing the Community Reinvestment Act can provide opportunities to reward banks for their focus on consumer outcomes, especially those related to financial health. Lawmakers can join forces with industry stakeholders to ensure that consumers can safely and conveniently access their financial data, and securely share that data with financial institutions and tech companies. These regulatory actions should be accompanied by sustained efforts to recognize the lingering effects of structural racism on households of color and design policies that allow all Americans to build and transfer wealth to future generations.
For our part, the Financial Health Network is committed to providing data, insights, and tools that financial service providers, regulators, and policymakers can use to diagnose, understand, and track the financial lives of Millennials. Armed with longitudinal data from the U.S. Financial Health Pulse, we plan to release ongoing data and insights about the financial health of Americans and how it is changing. While the challenges before us loom large, we are confident that we can collectively help today’s young people lead financially healthy lives, now, and in the years to come.
Citations
- Learn more about measuring financial health at source
- Unless otherwise noted, financial health data come from the 2019 U.S. Financial Health Pulse consumer survey, fielded April – June 2019 to members of the University of Southern California’s nationally representative Understanding America Study panel.
- “2018 Baseline Survey – U.S. Financial Health Pulse.” Financial Health Network (November 2018).
- These findings are based on unpublished data from the U.S. Financial Health Pulse 2018 baseline survey.
- These findings are based on unpublished data from the U.S. Financial Health 2018 Pulse baseline survey.
- Read more about how employers can invest in their employees’ financial wellbeing in: “Better for Employees, Better for Business: The Case for Employers to Invest in Employee Financial Health.” Financial Health Network (May 2019).
- These figures are higher than the general population, 61 percent of whom have used online banking and 50 percent of whom have used mobile banking in the last 12 months.
- This figure is higher than for the general population, 51 percent of whom say it is “extremely” or “very” important that their primary financial institution helps them improve their financial health.
Part 2: Components of the Millennial Balance Sheet: Assets and Liabilities
Part 2 includes:
- Wealth and the Credit Health of Young Millennials by Signe-Mary McKernan, Caroline Ratcliffe, and Trina Shanks
- Millennials and Student Loans: Rising Debts and Disparities by Wesley Whistle
- Young Adults and Consumer Debt: The Quiet Crisis Next Time by Ida Rademacher and Genevieve Melford
- Homeownership and Living Arrangements among Millennials: New Sources of Wealth Inequality and What to Do about it by Jung Choi
Wealth and the Credit Health of Young Millennials
Signe-Mary McKernan, Caroline Ratcliffe, and Trina Shanks1
As Millennials age and become a higher percentage of the workforce, their overall financial health is increasingly consequential for the economy as a whole. With fewer career pathways to progress and expectations that they will be less well off financially than their parents, Millennials are feeling financially insecure. Such prevailing realities of their finances are raising questions about the economic future of the Millennial generation. What is their current wealth position?2 Are they on track to be financially secure as they age, and how does this trajectory compare with previous generations? Are there natural points of intervention that could improve their circumstances?
To address these questions, it is instructive not only to examine the collective balance sheet of Millennials, but also to dig deeper among collateral evidence provided by private-sector credit agencies that track consumers’ borrowing and payment behaviors and score their worthiness as borrowers. Accordingly, this chapter describes the wealth and credit health of young Millennials, as reflected in recent data from the Survey of Consumer Finances and a major credit bureau. We define “young Millennials” as families headed by people ages 18 (or 20) to age 29 in the Survey of Consumer Finances and people with a credit report ages 18 to 29 in the credit bureau data.
Millennial Family Wealth is Stagnating
While there is more wealth in the country since the 1980s, the increases have not been evenly distributed generationally. Millennial family wealth has stagnated. Looking at the more than 30 years between 1983 and 2016, young and older Millennial families (ages 20 to 39 in 2016) experienced only small increases in wealth compared with earlier generations (Figure 1). Our comparisons show that Millennials are barely breaking even with the wealth their parents’ generation had back in the early 1980s. Young Millennial families have 31 percent more wealth than young families the same age in 1983, and older Millennial families have only 2 percent more. Baby boomers and the Silent Generation families, by comparison, have far more wealth (135 percent to 195 percent more) on average than families at their age roughly three decades earlier.
A lower Millennial homeownership rate may be one explanation (Choi et al. 2018), but a closer look at the debt side of the balance sheet provides additional insight into the phenomenon of Millennial wealth stagnation. While other types of debt, including car loans and credit card debt, fell in the aftermath of the Great Recession and remained relatively low, student loan debt increased sharply (Figure 2)—the result of more people taking out student loans and of people borrowing more money. By 2016, the average young Millennial family had $11,624 more in student loans than the average young family had in 1989, adjusted for inflation.
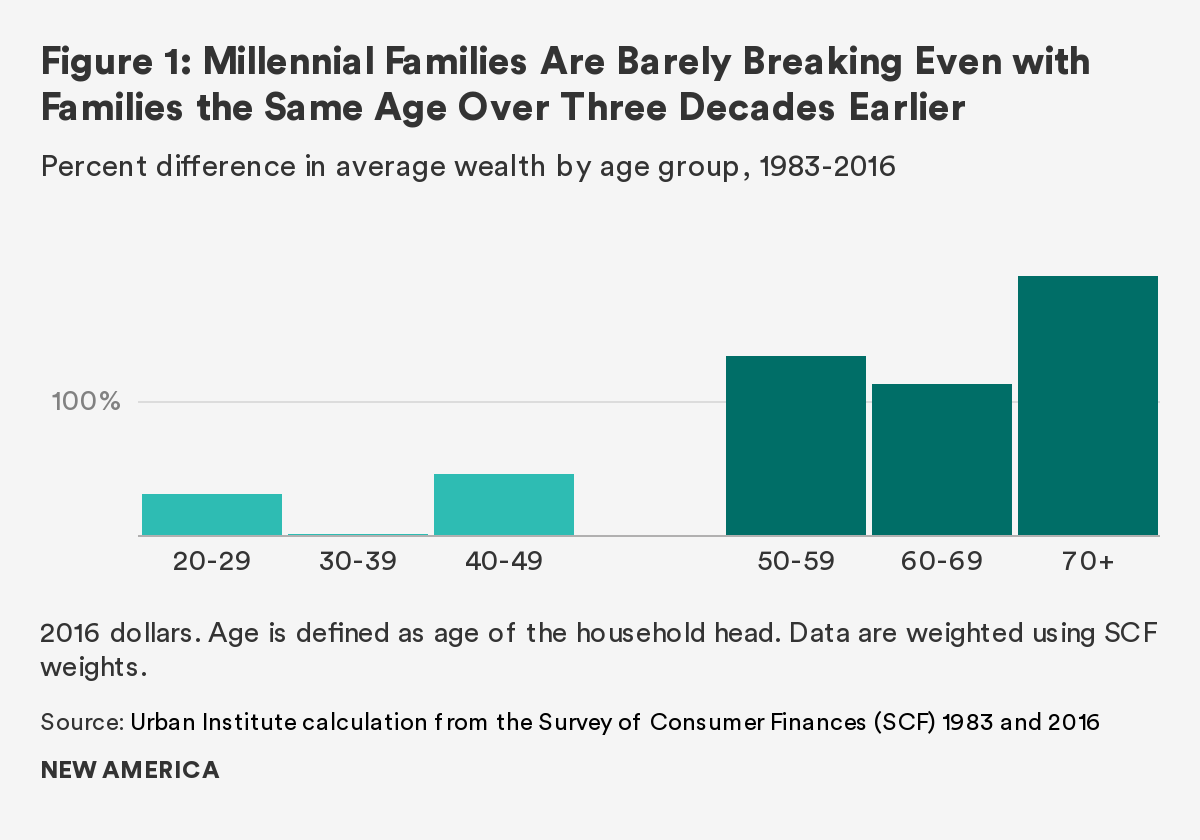
A Picture of Young Millennials’ Assets and Debts
Shifting focus to 2016 (away from differences across generations) reveals important differences in the asset and debt portfolios of typical young Millennial families compared with all families. For example, vehicle equity makes up a relatively large share of young Millennial families’ assets (27 percent versus 15 percent for all families) and home equity a relatively small share (6 percent versus 21 percent for all families, Figure 3). That vehicle equity is important to young Millennial families may come as a surprise, as not everyone thinks of vehicles when thinking of wealth holdings. That home equity is a relatively small share is likely consistent with expectations. Even if young Millennial families do own homes, initial down payments can be small and it takes time to build equity.
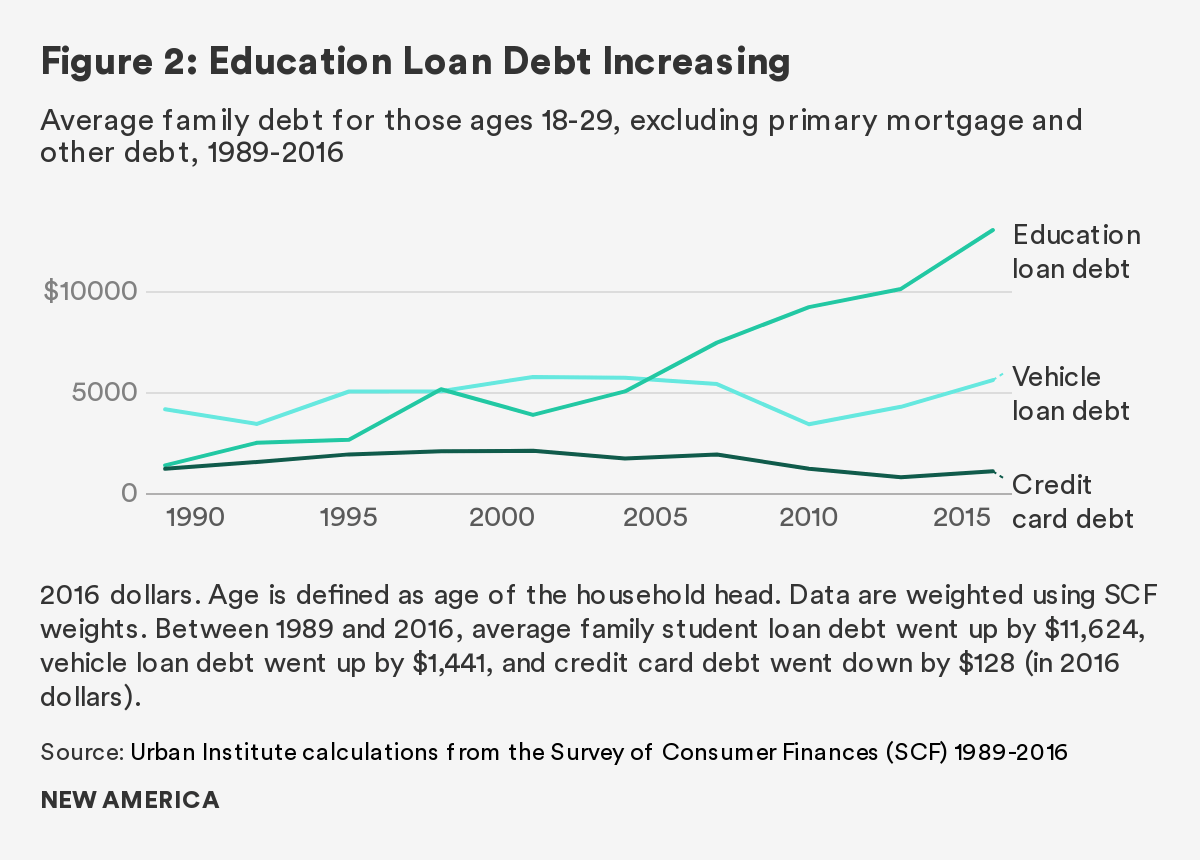
When considering the full range of debts incurred, several categories of debt dominate the Millennial balance sheet. Specifically, young Millennials hold the largest share of their debt in student loans (38 percent), car loans (21 percent), and mortgage loans (21 percent). We expect student loans and car loans to be a large share of young Millennial family debt. That mortgage loans are equally important is somewhat surprising. This finding is likely because mortgage loans tend to be large relative to student loans and car loans, so even if fewer people have them, they account for a larger share of debt. In contrast to young Millennial families, all families hold the largest share of their debt in mortgage loans (44 percent) and the smallest share in student loans (8 percent; Figure 4).
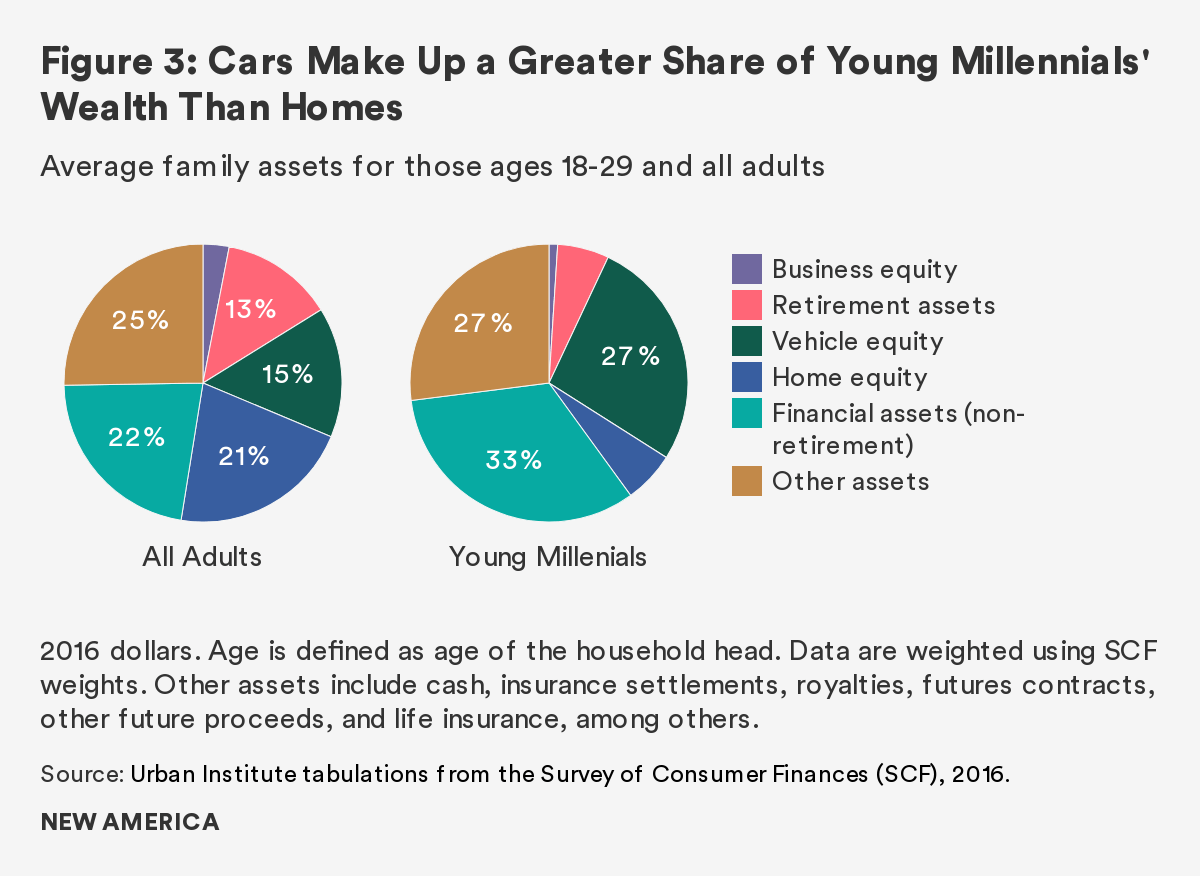
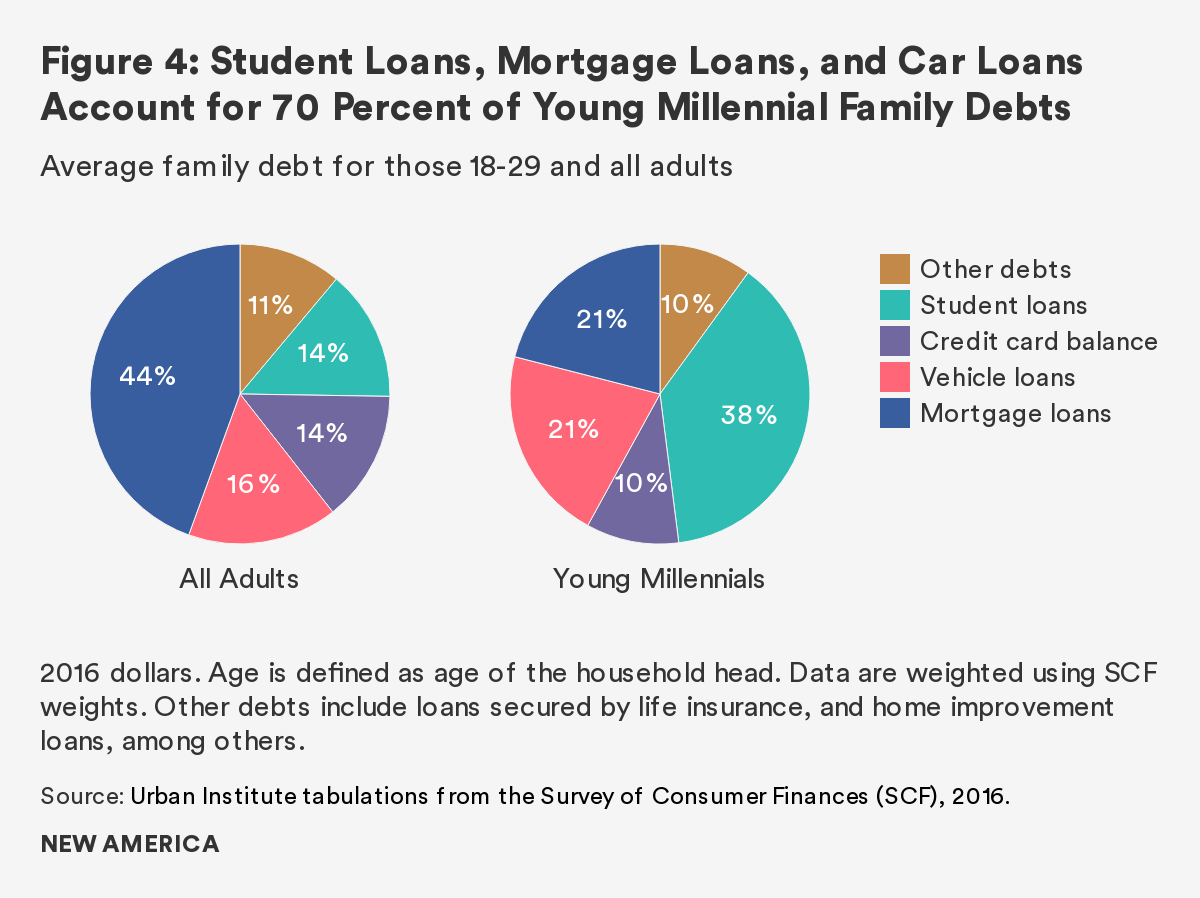
A Fuller Picture of Young Millennials’ Credit Health
Establishing a credit record and a prime credit score is an important foundation for building wealth and economic security. A consumer’s credit score is a three-digit number (generally between 300 and 850) that is designed to capture his or her creditworthiness (i.e., the likelihood of repaying or becoming delinquent on a loan). Having a subprime score is costly, as it brings higher interest rates that make the purchase of common items much more expensive. A consumer with a subprime (versus prime) credit score can pay three times more for a four-year car loan, almost three times as much for a refrigerator, and almost twice as much for a $550 car repair (Figure 5; Elliott and Lowitz 2018). This can also impact the cost of mortgages, as consumers with subprime credit could pay almost 50 percent more ($268,943 versus $182,324) over a 30-year mortgage than consumers with prime credit (Braga, McKernan, and Hassani 2019).
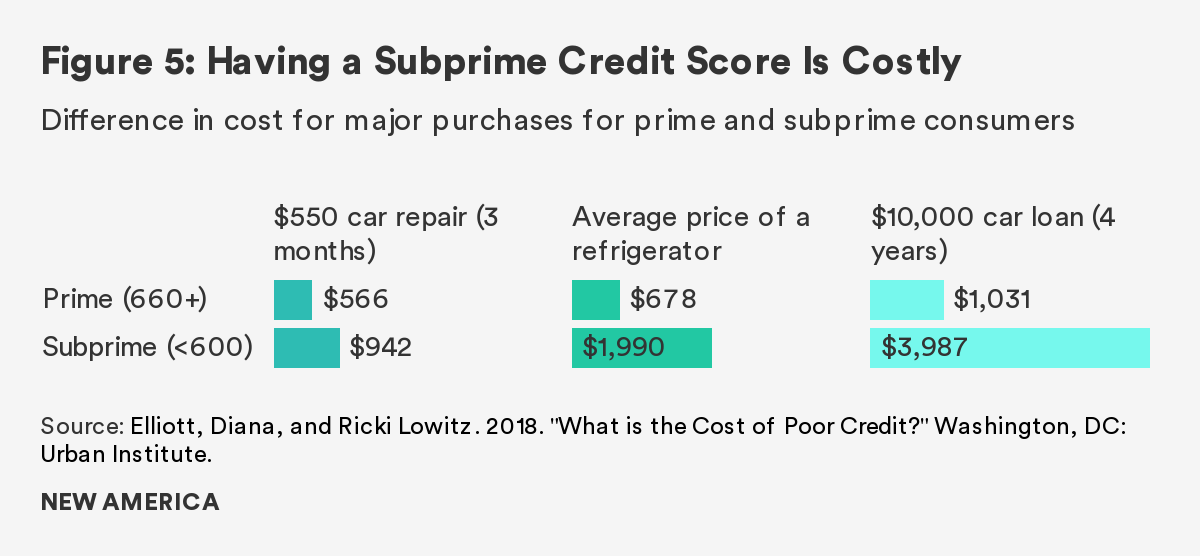
Using 2017 data from a major credit bureau, we examine the credit scores of young Millennials ages 18–29 (born 1988 to 1999) to provide evidence on how credit health evolves during the stages of young adulthood—ages 18–20, 21–24, and 25–29. We examine the Vantage credit score, where a score at or below 600 is “subprime,” between 601 and 660 is “near-prime,” and above 660 is “prime.” With these data, our analysis is restricted to people with a credit bureau record. Estimates suggest that 11 percent of U.S. adults—or 26 million people—do not have a credit record (Brevoort, Grimm, and Kambara 2015). Consumers acquire a credit record when they get some type of loan or credit access (e.g., student loan, credit card) or have a severely delinquent bill (e.g., medical or utility bill in collection status). A larger share of people have credit records as they move from their late teens into their 20s. While 65 percent of 18- to 19-year-olds do not have a credit record, the share falls to 20 percent for 20- to 24-year-olds and 9 percent for 25- to 29-year-olds (Brevoort, Grimm, and Kambara 2015). Thus, in the analyses that follow, there is a larger share of U.S. consumers in the older versus young age groups.
Among young Millennials with a credit record, the share of people with a subprime credit score increases with age (Figure 6). While 27 percent of 21- to 24-year-olds with a credit record have a subprime credit score, the share increases to 39 percent for those ages 25 to 29—a 12 percentage-point increase. The median credit score is similar and in the near-prime range for the three age groups, however (645–647; Figure 6). Taken together, these data suggest a worsening of credit health for a group of consumers at the bottom but not for the typical (median) young consumer.
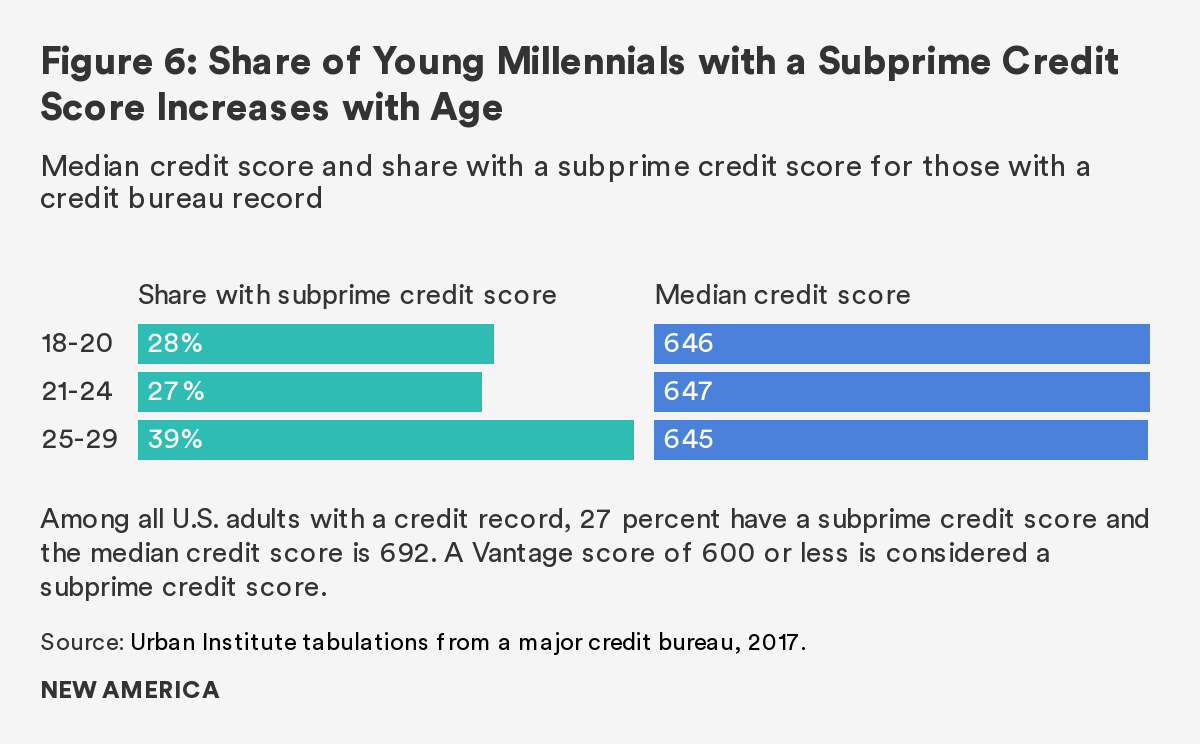
To further examine which young consumers are struggling to get on firm financial footing, we separately examine the credit scores of young adults who live in majority-white communities (i.e., ZIP codes) and those who live in communities of color.3 We find that, among people with a credit record, the share of people with a subprime credit score increases with age for both groups, but increases more for Millennials in communities of color.
Among people in majority-white communities who have a credit bureau record, 26 percent of 18- to 20-year-olds and 34 percent of 25- to 29-year-olds have a subprime credit score—a difference of 8 percentage points (Figure7). Among people in communities of color, the shares of people with subprime scores are significantly higher at 34 percent and 48 percent, respectively—a difference of 14 percentage points. These numbers highlight the different patterns that prevail depending upon the racial and ethnic makeup of the communities where people live.4
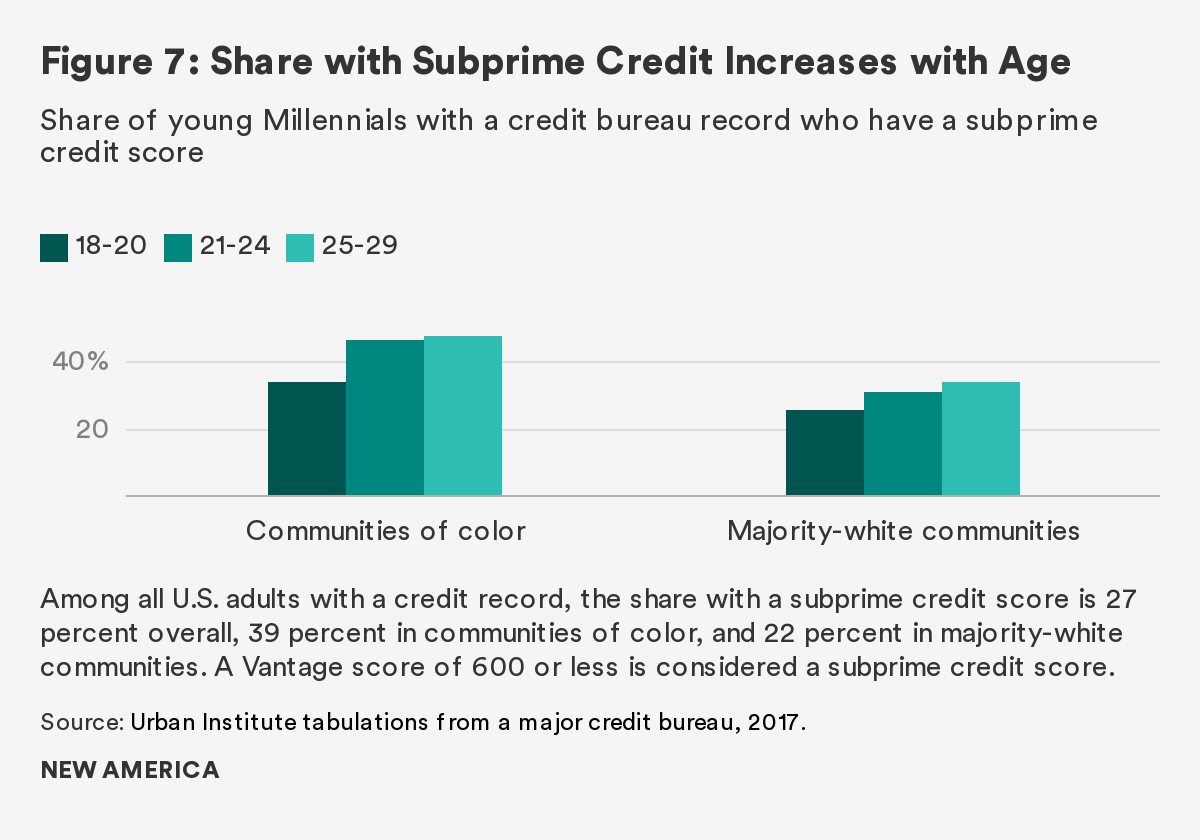
Digging in deeper, we find that the median credit score increases with age in majority-white communities (from 651 to 662), while it declines with age for those in communities of color (from 623 to 603; Figure 8). This means that the typical (or middle) youth with a credit record who lives in a community of color experiences a declining credit score as she moves into her early 20s. The generally lower incomes and greater financial fragility of families in communities of color suggests that these youth are less likely to have a personal financial safety net (e.g., parents who can help as they work to meet financial obligations). The fact that youth in communities of color are more likely to struggle with credit and debt is consistent with the large racial wealth gap in the U.S. (e.g., the median White family has 10 times the wealth of the median Black family; McKernan et al. 2017) and the more limited intergenerational transfers Black families receive (e.g., White families are five times more likely than Black families to receive a large gift or inheritance; McKernan et al. 2014).

Importantly, nearly half of Millennials ages 21 to 29 with a credit record who live in a community of color have a subprime credit score. This subprime score leaves them vulnerable to high-cost predatory lending and can severely limit their ability to build wealth as they move into their 30s and beyond. In fact, examining average family wealth back to the early 1980s shows that racial disparities are already apparent for people in their early 30s but then continue to grow sharply with age (McKernan et al. 2017). Specifically, looking at people from an earlier generation (those born between 1943 and 1951), the average White family had three times more wealth than the average Black family in their 30s ($210,742 versus $63,444), but the gap grew to seven times higher by their 60s and 70s ($1,338,360 versus $203,688; Figure 9). The racial wealth gap has been growing over time (McKernan et al. 2017), and if such trends hold true for Millennials, then Black children and households will continue to face increasing economic insecurity and have fewer resources to pursue their dreams and aspirations.
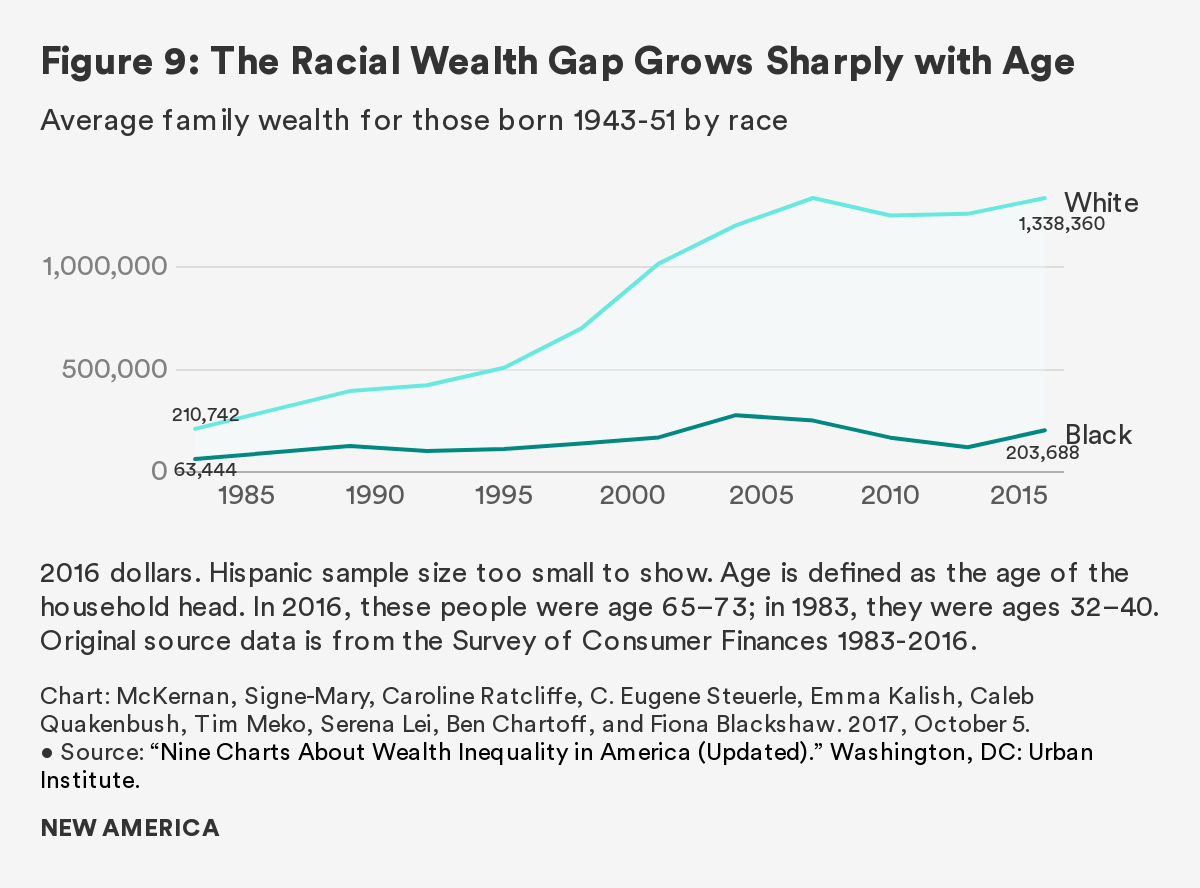
Patterns of Young Millennials’ Delinquent Debt
Another measure of financial distress reflected in the credit bureau data is the prevalence of debt in delinquency, where someone is behind on paying off their loan obligations or has not paid a bill (e.g., medical, phone, utility). Among Millennials with a credit record, the share with delinquent debt (past due or in collections) increases with age (Figure 10). The majority of delinquencies on people’s credit bureau records are for unpaid medical, phone, and utility bills (Consumer Financial Protection Bureau 2019),5 which suggests that young adults are primarily struggling to pay their bills (versus making payments on a credit card or loan).
The higher share of delinquent debt among Millennials in their late 20s holds overall and for those in both majority-white communities and communities of color. We also see higher rates of delinquency for young adults in communities of color than in majority-white communities, which is consistent with lower credit scores for young adults in communities of color. The rates, however, are high for both groups. For example, among 25- to 29-year-olds who have a credit bureau record, nearly four in 10 (38 percent) of those in majority-white communities have debt in collections and roughly half (52 percent) of people in communities of color do so. This shows that young adults across different communities are struggling to meet their financial obligations. This suggests that targeting financial-health interventions to teens and young adults could be an important step in improving Americans’ long-term financial well-being.
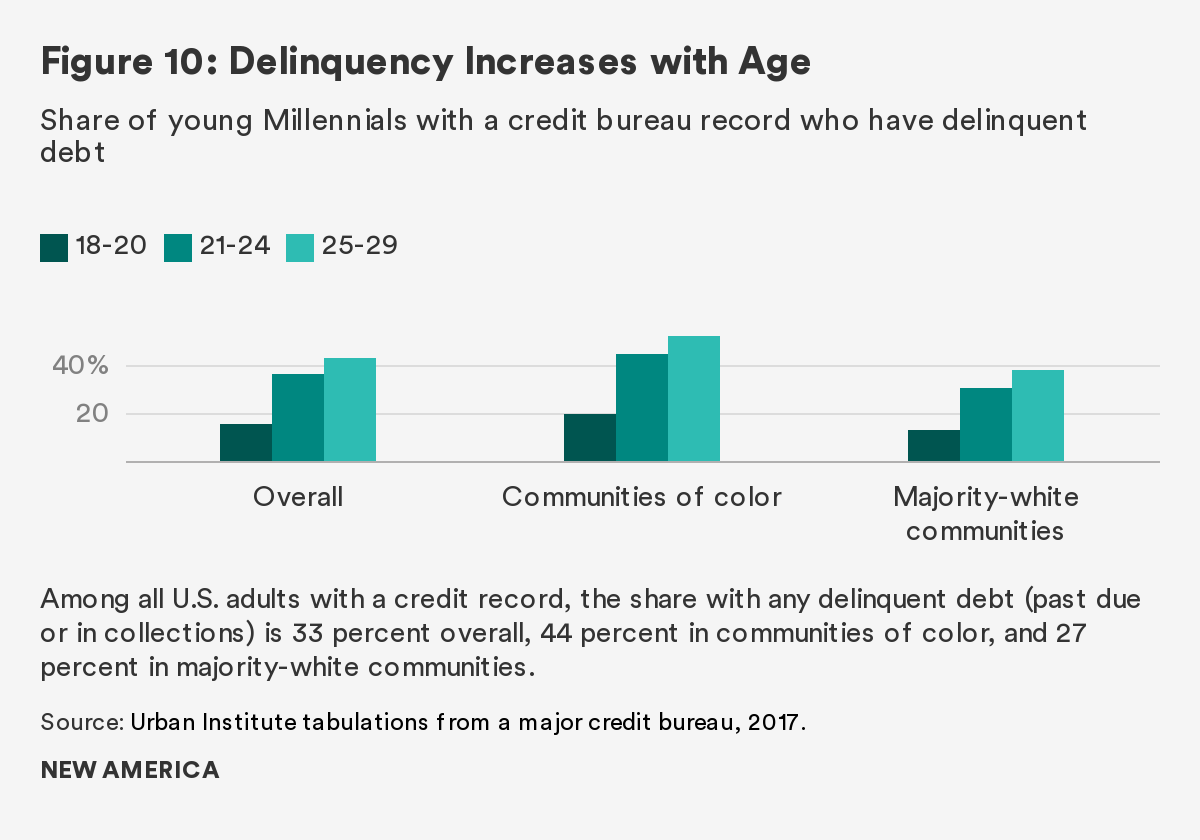
Examining geographical patterns, we find that youth debt in collections is concentrated in the South (Figure 11). This pattern is consistent with the general patterns of lower incomes and greater financial distress in the South (Ratcliffe et al. 2018) and suggests that interventions could be particularly beneficial in Southern communities.
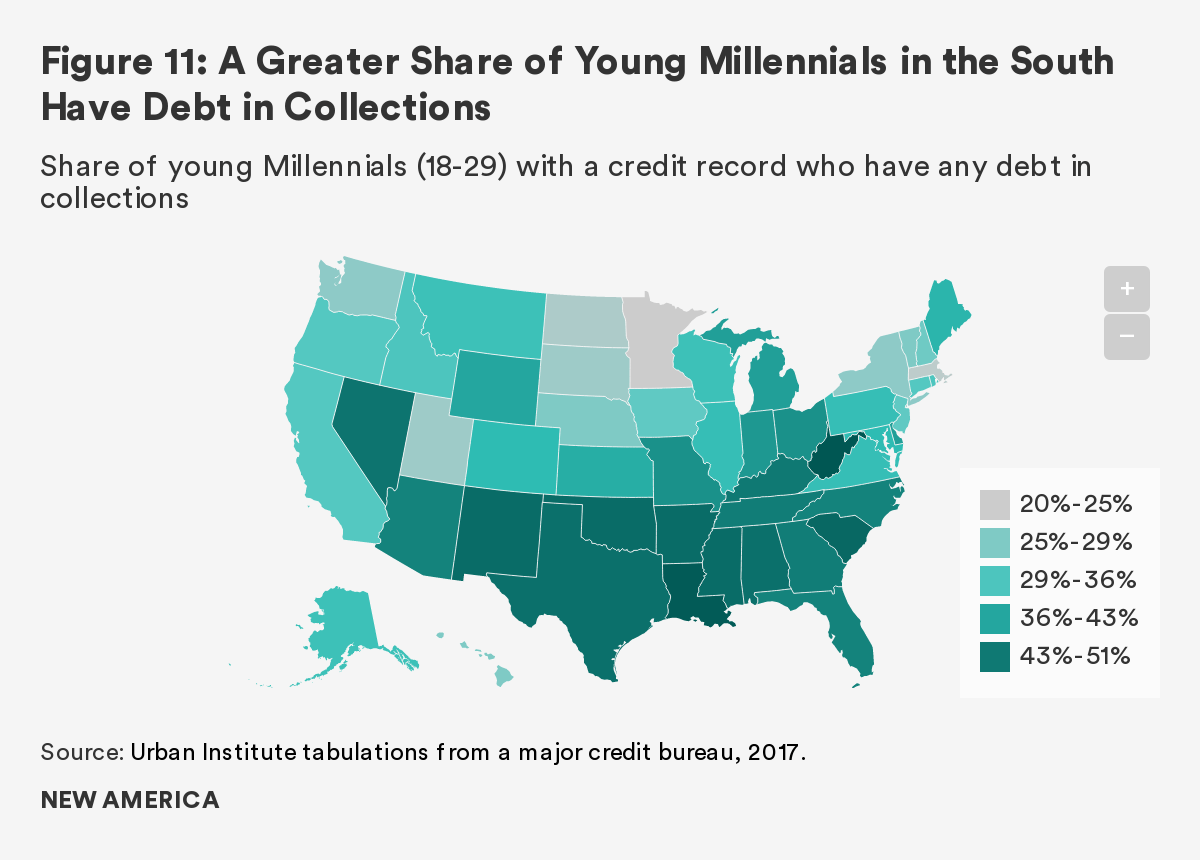
Peeling back the layers to look at the types of delinquent debt, we see that Millennials are struggling with both medical and student loan debt. Contrary to popular belief, Millennials are more likely than people ages 65 and older (Silent Generation and older Baby Boomers) to have past-due medical debt. While 10 percent of people ages 65 and older report having past-due medical debt, 25 percent of Millennials ages 18 to 34 do so. Millennials are also less likely to have health insurance, which leaves them financially exposed to unexpected illnesses (McKernan, Kenney, and Abare 2017).6
The data clearly reflect that Millennials are struggling to repay their student loans. Among student loan holders ages 25 to 29, one in five (20 percent) have student loan debt that is in collections (Figure 12).7 Again we see that student loan holders in communities of color are having more difficulty repaying these loans. Student loan repayment is particularly problematic for students who have student debt but have not finished their degrees (Baum et al. 2017), which tends to be those who have lower student debt balances but are more economically disadvantaged (Blagg 2018).
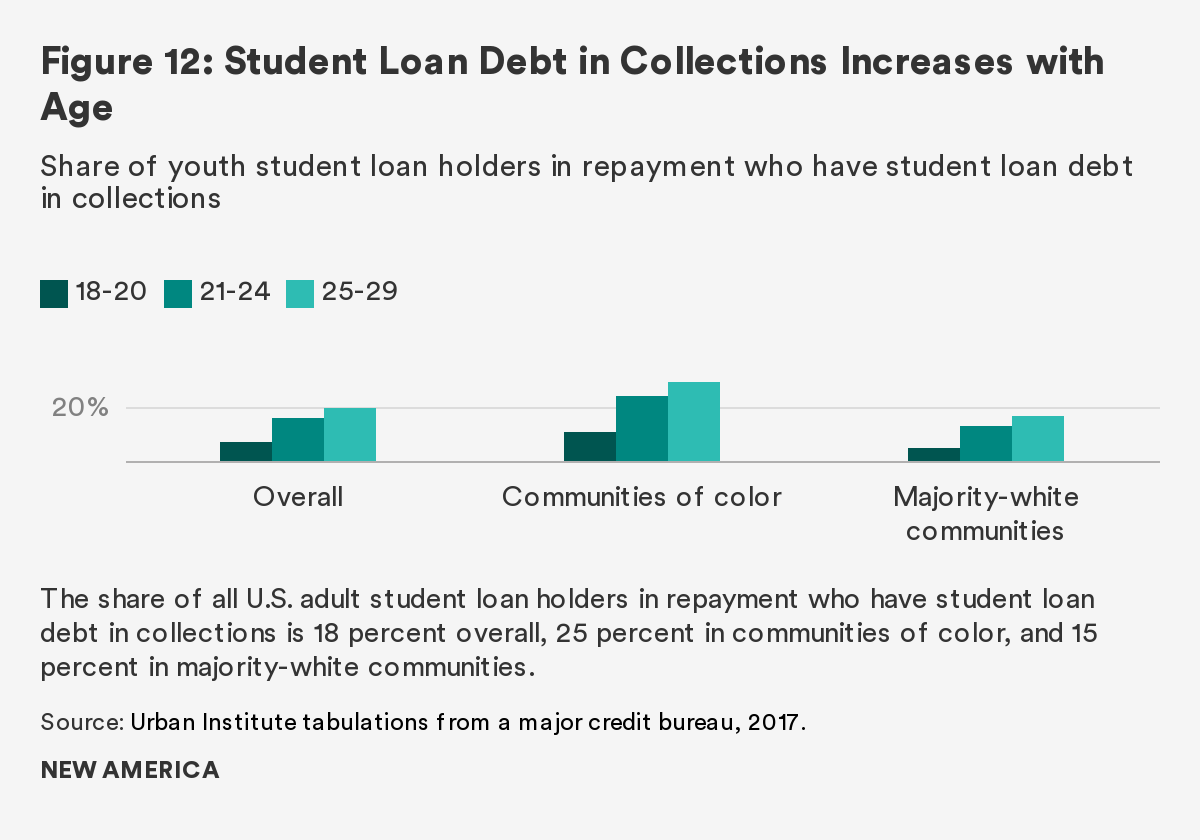
Millennial Wealth and Credit Health Have Broad Ramifications
Our survey of the Millennial balance sheet shows that this generation is on a very different trajectory for wealth building. Not only are young Millennials accumulating less wealth, but their debt holdings look fundamentally different. Specifically, the financial profile of Millennials generally includes less home equity and more student debt than those before them. This reflects a broadly distinct set of financial experiences for young Millennials that are very different both from their parents’ generation and from all adults in 2016. Examining credit bureau data from a private-sector credit bureau reveals additional insights, such as how Millennials’ credit health worsens as they move into their late 20s and that young Millennials in the South are more likely to have poor credit health.
Initial interactions with the financial and credit system can either set young Millennials up for success or place them in a precarious position later in life. This chapter’s findings suggest that age 21 to 24 is a critical period for potential interventions and that targeting resources to youth in the South could have a particularly meaningful impact. Credit health—especially debt in collections—has significant ramifications and is an important indicator for young adults to monitor because it can lower their credit scores. This, in turn, can make qualifying for a mortgage or other type of small business loan more difficult, and certainly more expensive. When people with poor credit do borrow, they are charged a higher interest rate and their purchases end up costing more. And poor credit doesn’t only affect one’s ability to borrow, but it can also have an impact on other areas of life. Credit report information can be used to determine eligibility for jobs, access to rental housing, and insurance premiums.
If the financial struggles of today’s Millennials lead to increases in wealth inequality down the line, it is an issue for everyone, since a strong, vibrant, and thriving middle class is a key ingredient for sustained economic growth (Stiglitz 2012). Inequality can weaken the economy, increase crime (Demombynes and Özler 2005), and result in a less educated population and more people needing help from the safety net. Wealth inequality is also a barrier to education and social mobility. Young people from high-wealth families are more than 1.5 times as likely to complete at least two or four years of college by age 25 as those in low-wealth families (Braga, McKernan, Ratcliffe, and Baum 2017). Among families in which parents did not graduate from college, young people from high-wealth families are roughly twice as likely to be upwardly mobile as those from low-wealth families (Braga et al. 2017).
If current trends continue, coming generations will be on shaky footing economically. A combination of policy, workplace programming, higher-education reform, and regulation targeting teens and young adults is warranted. One possible option is to offer child savings accounts or a variant, such as baby bonds, so that every young person starts out in life with assets and financial literacy associated with them (Huang et al. 2017; Sherraden, Clancy, and Beverly 2018; Berlin 2019). Progressive benefits targeted to low-wealth families could help reduce wealth inequality and relieve current disparities by geography, race, and ethnicity. In addition, proposals to make higher education more affordable, along with better advice and counseling as young people make postsecondary education decisions and take on student debt, would be helpful.
Another strategy is offering financial supports to young adults as they start their first jobs. This could include health insurance, automatic enrollment in savings plans, support in paying off student loan debt, and professional advice when making significant purchases, such as for a car or home. Identifying ways to intervene at key moments of financial transactions would make a difference, including real-time consultation and term negotiation with lenders when employees face serious life events, such as illness or job loss.
Although financial decisions are typically made at the individual or household level, recent disturbing trends among young Millennials offer evidence that more collective attention may be necessary. Lower wealth, rising student loan debt, and poor credit health make starting out in life more economically precarious. If a stronger foundation for economic security were institutionalized for all, it could make life better for young Millennials, future generations, and the country as a whole.
Acknowledgements
This research was funded in part by the Annie E. Casey Foundation. The views expressed are those of the authors and should not be attributed to the Urban Institute, its trustees, or its funders.
The authors thank Hannah Hassani and Kassandra Martinchek for their assistance in creating figures and providing helpful comments, and Reid Cramer for helpful edits and suggestions.
References
Baum, Sandy, Martha Johnson, Victoria Lee, Alexandra Tilsley, Elizabeth Forney, Daniel Matos, Hannah Recht, Vivian Hou, Ben Chartoff, and Jerry Ta. 2017. “Understanding College Affordability.” Washington, DC: Urban Institute.
Berlin, Loren. 2019, March 26. “Shrinking the Racial Wealth Gap without Focusing on Race: An Interview with the Kirwan Institute’s Darrick Hamilton.” Next50 (blog). Washington, DC: Urban Institute.
Brevoort, Kenneth, Philipp Grimm, and Michelle Kambara. 2015. “Data Point: Credit Invisibles.” Washington, DC: Consumer Financial Protection Bureau.
Brevoort, Kenneth and Michelle Kambara. 2017. “Data Point: Becoming Credit Visible.” Washington, DC: Consumer Financial Protection Bureau.
Blagg, Kristin. 2018. “Underwater on Student Debt: Understanding Consumer Credit and Student Loan Default.” Washington, DC: Urban Institute.
Braga, Breno, Signe-Mary McKernan, and Hannah Hassani. 2019. “Delinquent Debt Decisions and Their Consequences Over Time.” Washington, DC: Urban Institute.
Braga, Breno, Signe-Mary McKernan, Caroline Ratcliffe, and Sandy Baum. 2017. “Wealth Inequality Is a Barrier to Education and Social Mobility.” Washington, DC: Urban Institute.
Choi, Jung Hyun, Jun Zhu, Laurie Goodman, Bhargavi Ganesh, and Sarah Strochak. 2018. “Millennial Homeownership: Why Is It So Low, and How Can We Increase It?” Washington, DC: Urban Institute.
Consumer Financial Protection Bureau. 2019. “Market Snapshot: Third-Party Debt Collections Tradeline Reporting.” Washington, DC: CFPB.
Demombynes, Gabriel and Berk Özler. 2005. “Crime and Local Inequality in South Africa.” Journal of Development Economics, 76(2): 265-292.
Elliott, Diana, and Ricki Granetz Lowitz. 2018. “What Is the Cost of Poor Credit?” Washington, DC: Urban Institute.
Huang, Jin, Margaret S. Sherraden, Margaret M. Clancy, Michael Sherraden, and Trina Shanks. 2017. “Start Lifelong Asset Building with Universal and Progressive Child Development Accounts.” Cleveland, OH: American Academy of Social Work & Social Welfare, Grand Challenges for Social Work Initiative.
McKernan, Signe-Mary, Caroline Ratcliffe, Margaret Simms, and Sisi Zhang. 2014. “Do Racial Disparities in Private Transfers Help Explain the Racial Wealth Gap? New Evidence from Longitudinal Data.” Demography, 51(3).
McKernan, Signe-Mary, Caroline Ratcliffe, C. Eugene Steuerle, Emma Kalish, Caleb Quakenbush, Tim Meko, Serena Lei, Ben Chartoff, and Fiona Blackshaw. 2017, October 5. “Nine Charts About Wealth Inequality in America (Updated).” Washington, DC: Urban Institute.
McKernan, Signe-Mary, Genevieve M. Kenney, and Robert Abare. 2017, March 1. “Why do a Larger Share of Millennials and Gen X Have Past-due Medical Debt than Older Americans?” Urban Wire (blog). Urban Institute.
Ratcliffe, Caroline, Signe-Mary McKernan, Cary Lou, Hannah Hassani, and Caleb Quakenbush. 2018, December 13. “Debt in America: An Interactive Map.” Washington, DC: Urban Institute.
Sherraden, Michael, Margaret M. Clancy, and Sondra G. Beverly. 2018. “Taking Child Development Accounts to Scale: Ten Key Policy Design Elements.” St. Louis, MO: Washington University, Center for Social Development.
Stiglitz, Joseph E. 2012. The Price of Inequality: How Today’s Divided Society Endangers Our Future. New York: W.W. Norton & Co.
Citations
- The views expressed are those of the authors and do not necessarily reflect those of their affiliated institutions: the Urban Institute (Signe-Mary McKernan), Consumer Financial Protection Bureau (Caroline Ratcliffe), and the University of Michigan (Trina Shanks).
- Wealth is what you own (the sum of all your assets) minus what you owe (the sum of all your debts).
- The credit bureau data do not have information on consumers’ race. The racial makeup of the individuals’ communities of residence provides information about the characteristics of where they live, but it can also be viewed as a proxy for the person’s race. Communities of color are defined as those where at least half of the residents are people of color.
- Analyses also show differences by the economic status of communities. People in low-income (versus higher-income) neighborhoods are less likely to enter the credit system from an account that someone else is responsible for (e.g., as an authorized user on a parent’s credit card) and more likely to enter because of unpaid bills that are sent to collections (Brevoort and Kambara 2017).
- The Consumer Financial Protection Bureau report finds that 78 percent of third-party debt collections trade lines were for medical, phone, or utility bills.
- The shares for people in Generation X (ages 35–50) and the Baby Boom generation (ages 51–64) are 26 percent and 20 percent, respectively (McKernan, Kenney, and Abare 2017).
- Student loan debt that is in collections is also in default by definition, but not all student loans in default are in collections.
Millennials and Student Loans: Rising Debts and Disparities
Wesley Whistle
One measure of inequality in America today is the widening earnings gap between college-educated workers and those with only a high school diploma. The good news is Millennials who earn a college degree are more likely to earn higher wages. Yet many young adults have found that pursuing education beyond high school can have downsides too. Tuition costs are up, wages have been stagnant, some start but don’t finish their degree programs, and the increased reliance on student loans have all driven down the value of pursuing a college education. With rising costs and increased enrollment—particularly at the height of the Great Recession—overall student debt was bound to increase. Still, it has reached dramatic levels, and tripled over the last 15 years. With total outstanding federal student debt of $1.5 trillion, some have decreed a “student debt crisis” is afflicting the Millennial generation.
Sharpening an effective policy response requires distinguishing among the factors that have contributed to its rise. Part of this increase is directly related to rising costs of college—both from tuition as well as living expenses. Another source of increased student debt is higher college attendance. Since 2000, undergraduate enrollment has increased by more than 3.5 million students.1 More people are getting graduate degrees too.2 For many, borrowing money to pay for training and education can yield returns over a lifetime. Since student loans are often repaid over extended periods of time—as much as 30 years—the theory is that these debts can be managed along with other financial obligations. This means that some debt borrowed years ago still contributes to the cumulative numbers today.
Unfortunately, for a growing number of borrowers, student debt consumes a larger share of income for years on end. Consequently, the burden of student debt has become a source of widespread generational anxiety, and increasingly is garnering attention from policymakers.
This piece focuses on student debt, particularly from the perspective of Millennials. First, it will discuss how the Millennial experience has impacted trends in student loan debt and borrowing. Then, it will examine the data available on student debt to understand what Millennials’ debt looks like beyond the cumulative loan balance. Next, it will discuss research on the nuances of student debt and identify the groups of people with the most excessive debt loads, as well as discuss the existing protections available to borrowers today. Finally, it will provide policy recommendations to improve the student loan experience of Millennials and ways to provide relief to the most vulnerable.
Millennials and the Rise in Student Debt
Millennials came of age during a time of transition in the economy and in the landscape of higher education. During their lifetimes, the costs of attending college rose significantly, with the net price of tuition, fees, and room and board at a public, four-year college increasing 68 percent since the 1999-2000 academic year.3 The sheer amount of loans borrowed annually for higher education has doubled since that same year.4 Despite growing evidence that a college degree leads to higher incomes and career success, students’ perceptions of debt are deeply negative. In a recent poll, 57 percent of Millennials thought student debt was the largest source of consumer debt, even though student pales in comparison to mortgages.5
Although the Great Recession was a catalyst for Millennials’ student debt, the impact varied for students of different ages within the generation. Unemployment for 18- to 35-year-olds hit 13 percent at the height of the recession in 2010, a time when many Millennials were high school.6 Due to such poor labor market conditions, college enrollment spiked as many enrolled in college though they hadn’t planned to originally.7 Others who were already working lost their jobs and enrolled in an effort to reskill and increase their chances of better employment once the economy recovered. And while public institutions—making up for the difference in state appropriations through higher tuition charges to students—absorbed most of the increase, the for-profit sector more than doubled its undergraduate enrollment within six years.8 A sector already more expensive on average, for-profit institutions have been plagued with dismal graduation rates, low job placement success, and even fraud, leaving students saddled with debt they often can’t afford. As the economy has recovered, the problems of the for-profit sector have persisted.
Graduate enrollment also increased as the economy slowed.9 When Millennials with college degrees lost their jobs, some decided to pursue graduate degrees, often with loans. Millennials graduating college were faced with few job prospects and many opted to continue their education. This increase in graduate enrollment has mostly remained steady, and some believe this has led to a tightening job market where people continue to pursue graduate degrees—often with student loans—to remain competitive in the labor market.
Distinguishing among Millennial Student Debt
Data on student debt is somewhat limited, inhibiting experts’ ability to diagnose problems. The federal student loan portfolio offers a snapshot of the existing cumulative debt for Millennials. As of Q2 of the 2019 fiscal year, for borrowers ages 25 to 34—a significant share of the Millennial population—there were $497.6 billion dollars in outstanding student loan debt for about 15.1 million borrowers.10 This translates to an average (mean) student debt of around $33,000 dollars for each borrower. For those ages 24 and younger, there was a cumulative loan balance of $124.6 billion for 8.1 million borrowers—an average of about $15,000 per borrower, though many of those borrowers may still be in school.
These numbers mask several important distinctions. Many of these loans are already in repayment and have been for some time—particularly for the older borrowers. This means they have left school already and begun to repay their loans. Some are reducing their debt, and those who are paying something but not enough to cover their full obligations may actually be seeing their debts grow. The cumulative balance also includes those from graduate school, likely increasing the average debt load per borrower, given that undergraduates are tightly limited in how much they can borrow. Unfortunately, the data does not reflect if a student has graduated, dropped out, or is still enrolled.11
Millennial Undergraduate Debt by Degree
Data from a survey of borrowers conducted by the U.S. Department of Education allows us to see how Millennials borrowed for their undergraduate degree at different times. Table 1 depicts the borrowing of Millennials for their undergraduate education across four separate snapshots of academic years in which they received their degrees. It shows the percentage of graduates who borrowed and, of those students who borrowed, their median debt at graduation. Depending on the year in which a student graduated, they borrowed at different rates and borrowed differing amounts.
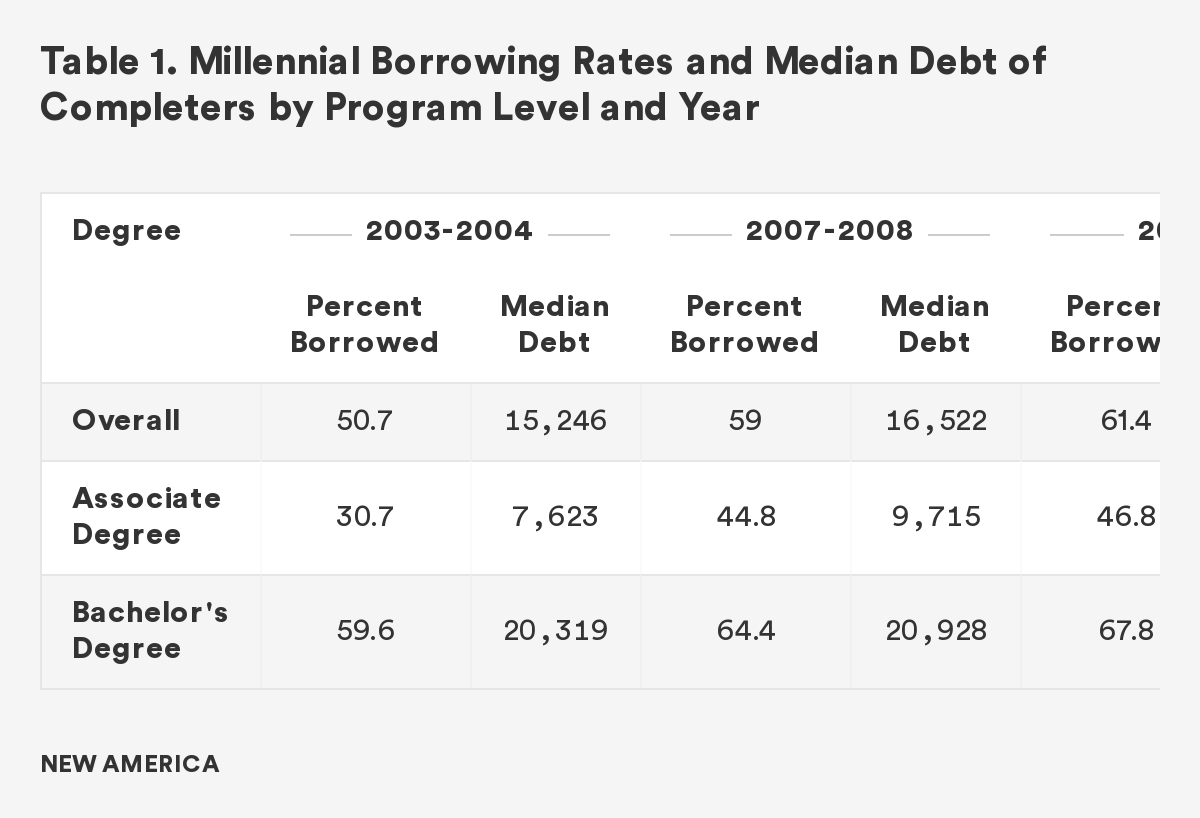
As college costs increased, more students borrowed and they borrowed more. While rates increased for both bachelor’s and associate degree recipients, borrowing for 2-year associate degrees increased much more, at 46 percent, compared with a 13 percent increase for bachelor’s degree graduates. Dollar amounts—adjusted for inflation—also increased over time. Not surprisingly, the largest increase in total borrowed was from the 2007-2008 graduates to the 2011-2012 graduates, during the height of the Great Recession.
Millennial Undergraduate Student Debt by Race
Borrowing trends among racial/ethnic groups can help us understand how debt impacts groups of students differently. Table 2 presents the borrowing rates and the amounts for Millennial graduates by race and ethnicity in the 2015-2016 academic year.
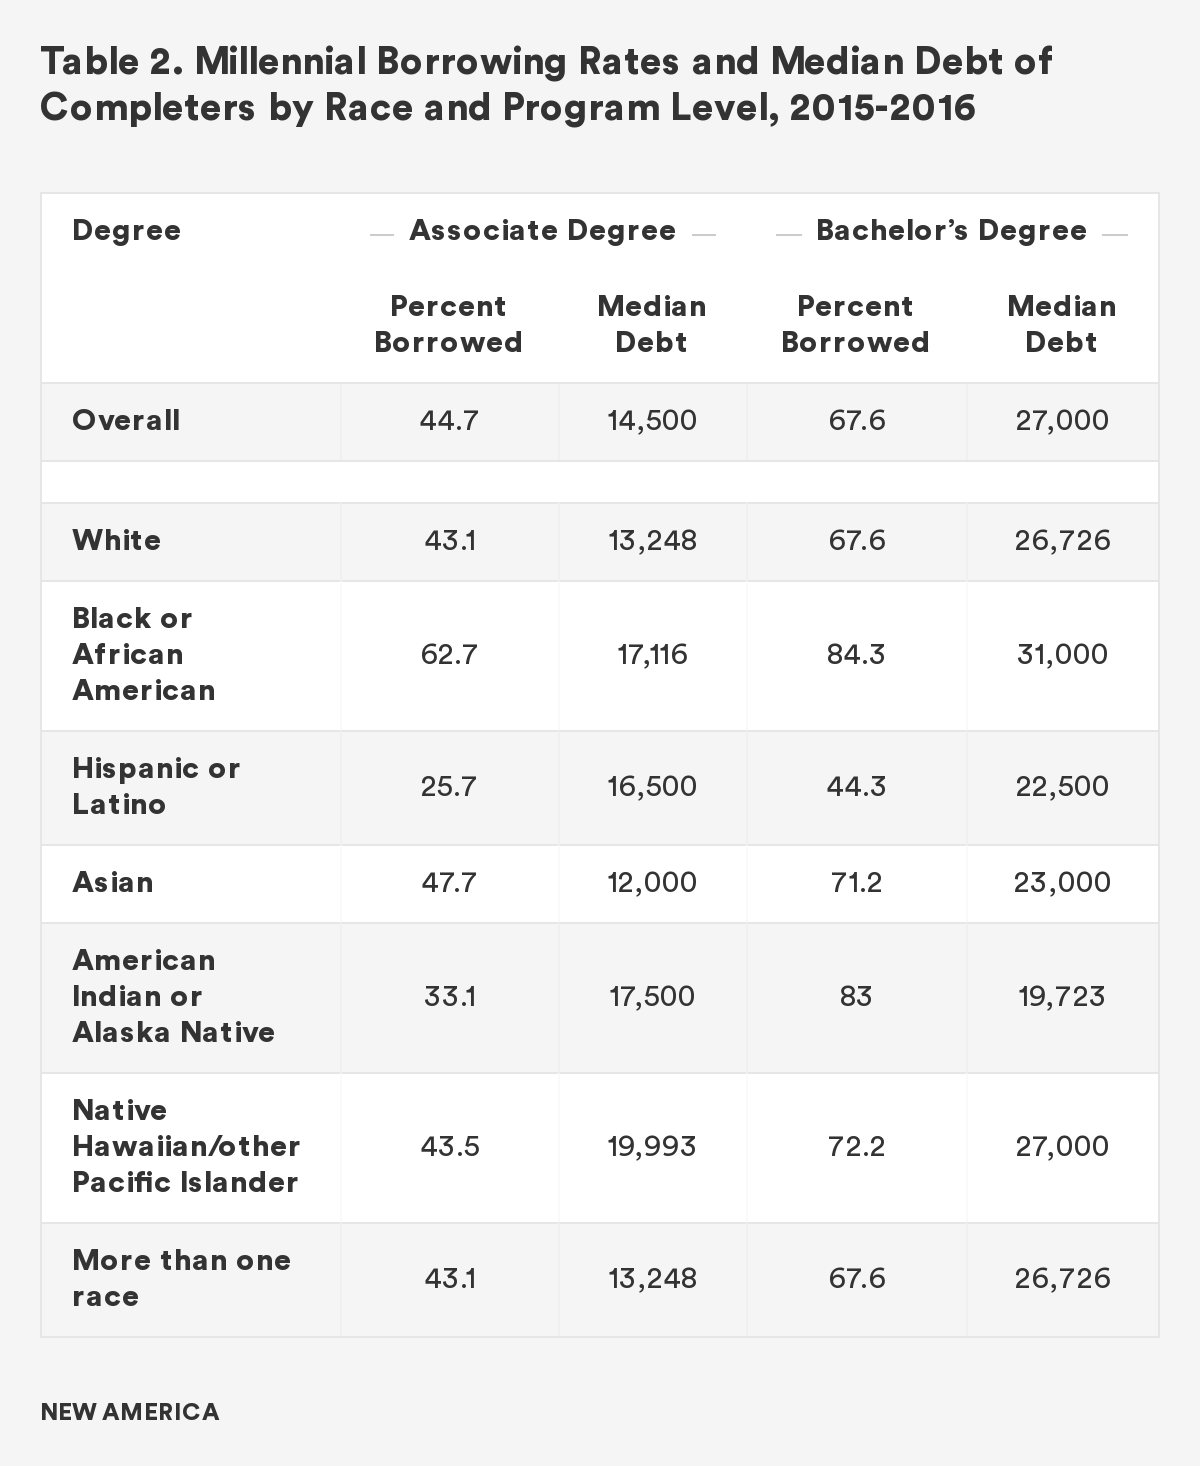
The data shows that Black Millennial graduates are much more likely to take out loans for their education, at a rate 17 percentage points higher than their White peers for a bachelor’s degree and 20 percentage points higher for an associate degree. And Black students borrowed more. This is likely due to the racial wealth gap where Black families have fewer resources on hand than other families. As a result, 31 percent of Black families have education loans compared with only 20 percent of White families, despite the lower college-going rate for Black students than White students.12
Conversely, even though they suffer from racial wealth disparities Latinx Millennial graduates borrow at a lower rate compared with their White peers, especially at the associate degree level.13 Research has shown that Latinx students are more likely to be loan-averse than White students.14 Latinx students also borrow smaller amounts than their White peers, something that can be attributed to White students generally attending more expensive schools.15
Millennial Undergraduate Debt by Gender
Women are more likely to enroll in college than men.16 Differences in borrowing exist across genders, though they are smaller differences. The median amounts borrowed for a bachelor’s degree are less than $300 apart. Female borrowers also borrow at a higher rate, though only five percentage points higher than males. The biggest disparity is at the associate degree level, where female borrowing is 10 percentage points higher and about $3,000 more total.
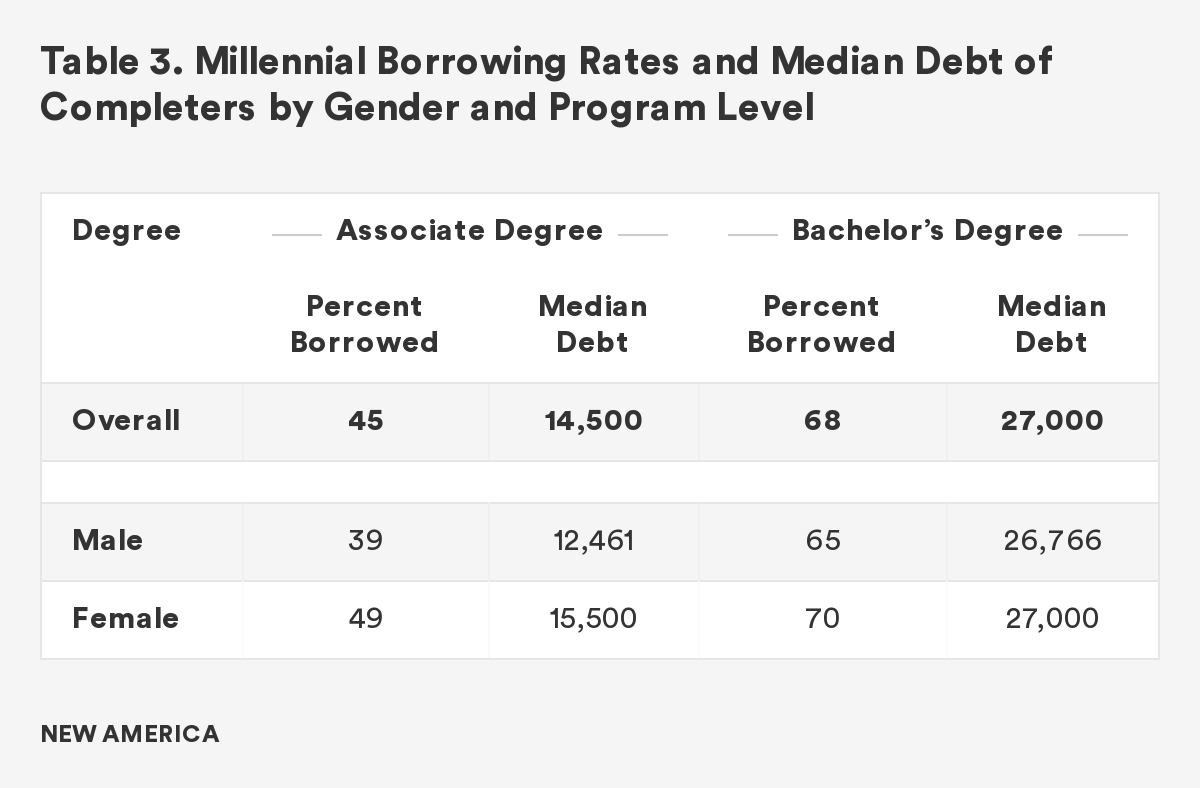
Millennial Undergraduate Debt for Low-Income Students
The federal government provides one primary source of financial aid to low-income students—the Pell Grant. Depending on a student’s family income and family size, low-income students can receive a Pell Grant to lower the net cost of higher education. The amounts vary depending on the determined “need” of a student. The maximum grant in the 2019-20 academic year is just over $6,000. Table 4 shows the borrowing rates and amount borrowed for Millennial graduates, broken out by whether students received a Pell Grant in the 2015-2016 year or not.17
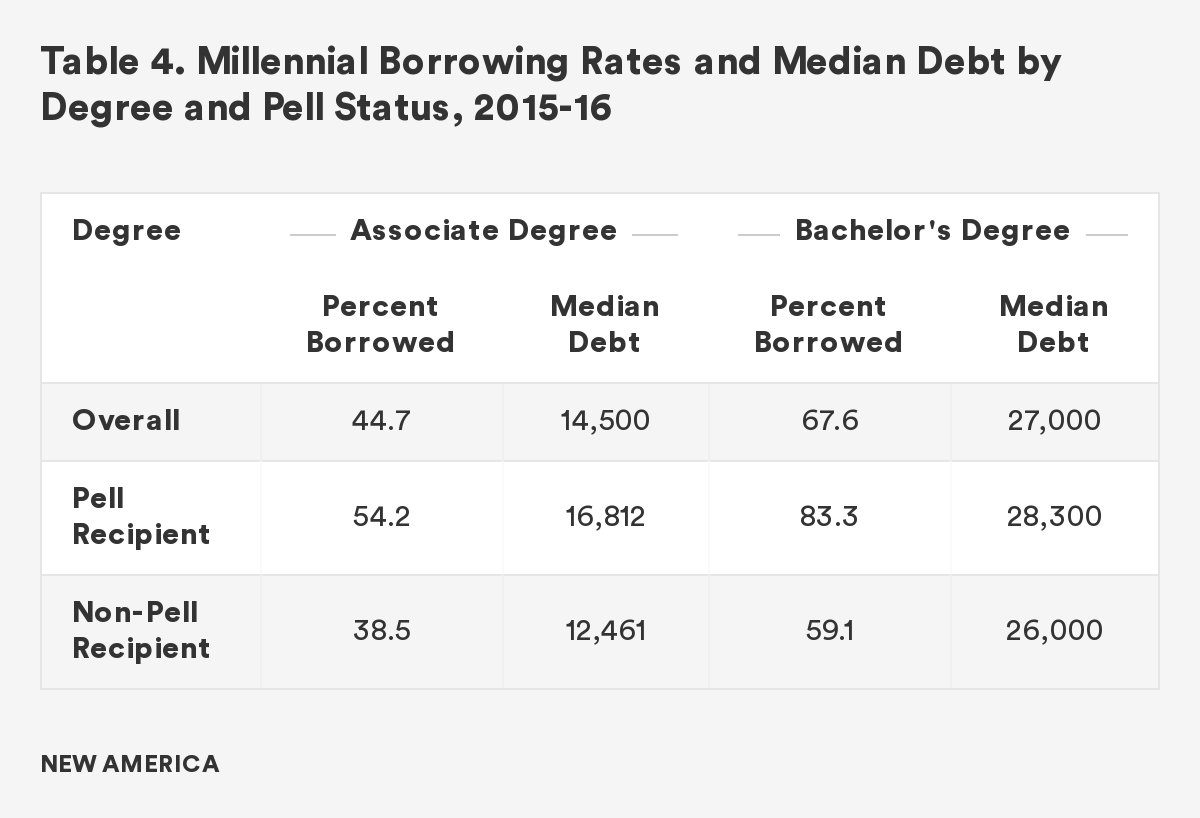
In the 2015-16 academic year, students who received Pell Grants borrowed at a much higher rate than their higher-income peers. To earn an associate degree, Pell students borrow at a rate almost 16 percentage points higher. For a bachelor’s degree, the difference is greater, at 24 percentage points. These disparities point to the fact that the Pell Grant has not kept up with the cost of college. Not only do they borrower at much higher rates, Pell students borrow more, reflecting a reality that the grant is not adequately “leveling the playing field” for these students.
Millennial Graduate Degree Debt
Borrowing for graduate school is another component of Millennial student debt. This is especially true since graduate enrollment greatly increased—as did undergraduate enrollment—during the Great Recession, and has remained steady since. As more students went to college, more also went to graduate school, and increased their debt loads in the porcess. While undergraduate students have strict annual limits on federal loans, graduate students can borrow up to the full cost of attendance as defined by the college—a number that includes tuition, fees, and living costs.
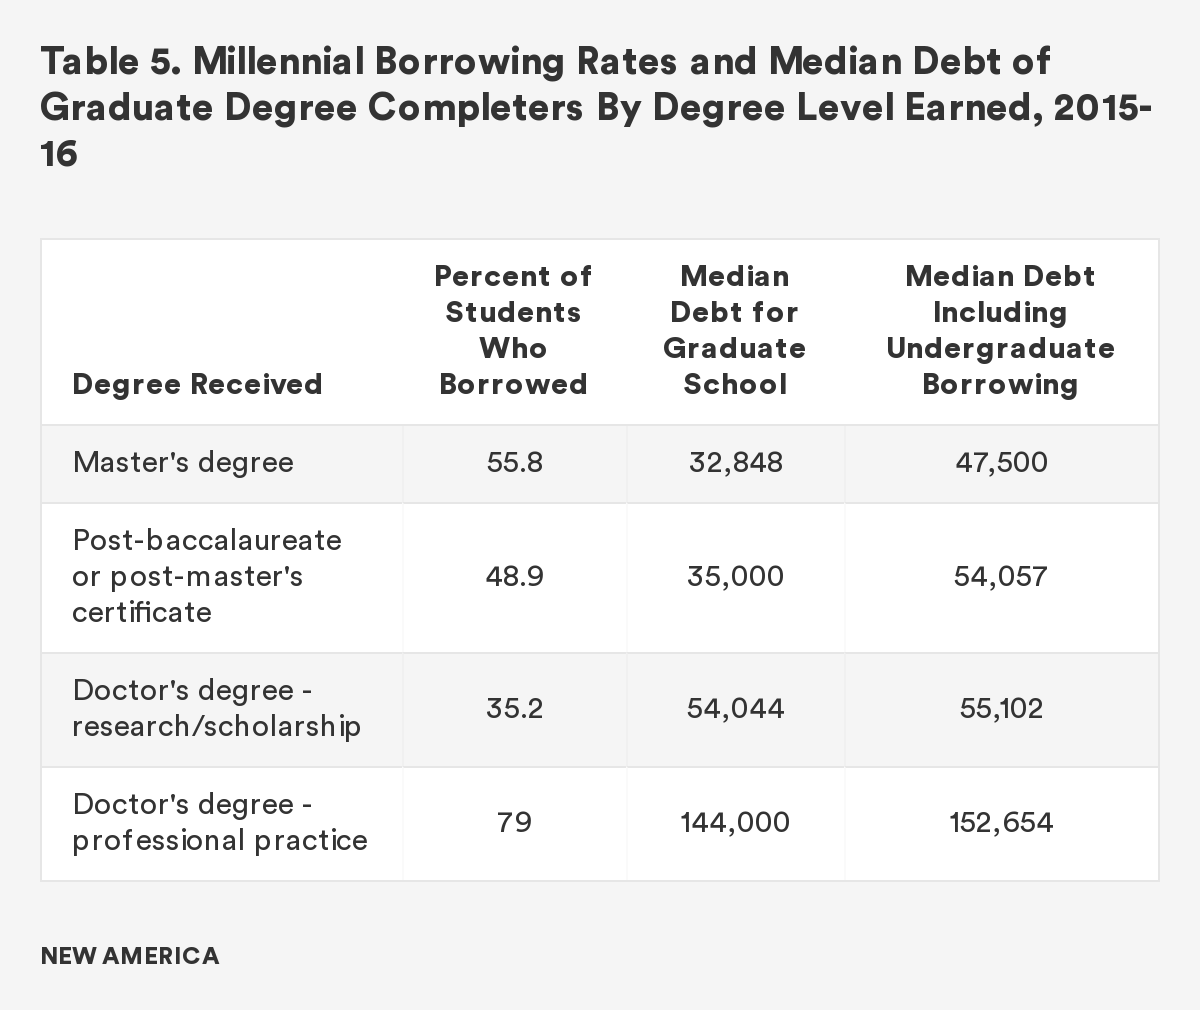
Borrowers who attend graduate school have higher cumulative debt—from both their graduate and undergraduate degrees. Master’s degree students borrow less than those who pursue doctoral degrees, who are usually in school longer.
Although many news stories feature borrowers with high debt loads, often exceeding $100,000, the typical borrower at every graduate education level at the median, doesn’t approach six-figure debt. In fact, only one degree level surpasses $100,000 in student loan debt—professional doctorates. “Doctor’s degree – professional practice” as shown in Table 5 is just a technical way of saying professional school graduates. Those degrees—MDs, JDs, etc.—are the ones who become physicians, dentists, lawyers, and more, and they often end up earning six-figure salaries that ensure they can afford to repay the debt. The next highest level of debt is other doctorates (PhDs), with a median debt of about $55,000. Borrowers with a master’s degree have just under $50,000, on average, including their debt from undergraduate borrowing.
Repayment Outcomes and Defining a Student Loan “Crisis”
Students borrow to attend college in hope of a return on their investment in the form of greater employability and increased earnings. Even though costs for college—and eventually loan payments—can be significant, it can still be a worthwhile investment, particularly considering the alternative of never enrolling in the first place. College graduates see immediate earnings bumps and they earn more over time. Bachelor’s degree graduates earn about $1 million more throughout their lives than people with only a high school degree, and are far less likely to be unemployed or underemployed. This means that for many debt can be both affordable and a good choice.18
One measure of how borrowers are doing in managing their debt is to assess their ability to repay their loans. Most Millennial borrowers are up to date on their payments. According to data from the Direct Loan portfolio by delinquency status, 86 percent of non-defaulted borrowers ages 25 to 34 are current on their loans.19 Five percent are 31 to 90 days delinquent, meaning they are just a little late on their payments, leaving just nine percent of those in this group who are more than 90 days delinquent.
The average balance for those who are delinquent in this age group is about $10,000 less than those who are current on their loans. And the more delinquent the borrower, the lower the average balance on their loans. The average balance for severely delinquent Millennials is almost $20,000 lower than borrowers who are up-to-date on their payments. This indicates that the amount of debt outstanding on a loan might not always reflect the degree of financial hardship to stay current on payments. Most recent data shows us that about 11 percent of borrowers default within three years of leaving school and it is likely that most of them are Millennials.20
$1.5 trillion in student loan debt is a big number and it has grown dramatically in recent years. But is it a “crisis?” Some argue that debts of this magnitude are hindering the economy because borrowers may be unable to spend more elsewhere, are unable to pay their existing debt, or cover their living expenses. However, that misses the varying experiences of borrowers. Some large-balance borrowers may struggle, but they are the exception for high-debt students. Challenges in repaying student loans are much more prevalent among smaller-balance borrowers struggling to manage their finances. Several groups of borrowers who are experiencing particularly acute financial hardship deserve greater attention, and should be the focus of the struggling borrower conversation.
Non-Completers
Quality varies across institutions of higher education. Many colleges and universities would be labeled dropout factories if they were a K-12 school given their abysmal graduation rates.21 Students who enroll in college, but don’t complete, default on their loans at nearly three times the rate as those who do.22 The majority of defaulters (65%) have relatively low loan balances, under $10,000. On average, a college degree pays off for most borrowers—even accounting for cost—as long as they graduate.23 If they don’t graduate, they typically don’t reap the earning premium and can have the most difficulty repaying their obligations. Even if their outstanding balances are below average—sometimes just a few thousand dollars—non-completers are often in greater financial crisis.
Borrowers of Color
Income and wealth inequality are an enduring and cross-cutting problem in the United States, but this is an endemic crisis hitting families of color the hardest. Stemming from historic racism and the legacy of slavery, the racial wealth gap has left borrowers of color instantly disadvantaged when—and even before—they enter higher education.
Black students are more likely to borrow for their education, and when they do, they borrow more. Once they graduate, Black students face a discriminatory labor market paying them less, meaning they often can’t recoup the costs of their degrees at the same rate as others.24 Borrowing more but making less is connected to higher default rates. Research confirms that a Black graduate with a bachelor’s degree is more likely to default on his or her loans than a White student who dropped out of college with student debt—an astounding finding.
Latinx students borrow at a lower rate and borrow less when they do. This may result from a cultural aversion to debt.25 First, this is a problem because it is possible debt aversion hinders Latino students from enrolling in college, or from enrolling in four-year degree programs where their earnings potential will be greatest, making it difficult for those student to build wealth going forward. Secondly, research has shown that some students don’t borrow enough, making them less likely to graduate.26 If students who are more risk-averse don’t borrow enough and end up not graduating, it still leaves them with debt and no degree. They won’t see the wage gains from a college degree and they are more likely to default.
Students of color often attend schools with lower graduation rates, putting them at a greater disadvantage from the moment they enter higher education. One reason for these low graduation rates is that students of color disproportionately attend under-resourced schools, such as community colleges and Historically Black Colleges and Universities (HBCU). And worse, predatory for-profit institutions with dismal student outcomes often recruit students of color to attend them. Thirteen percent of Black students enroll in for-profit colleges, compared with four percent of White students.27
Low-Income Students
Low-income students face some of the struggles that students of color face, and of course some are students of color themselves. Low-income students are less likely to go to college and, as the data show, they borrow at much higher rates to attend college and borrowed more to do so. Low-income students often attend under-resourced community colleges or regional universities that cannot provide sufficient supports to students. On average, low-income students also graduate at a lower rate than their higher-income peers, and at some schools that disparity is massive.28 So these students risk being left with debt and no degree and without family resources to rely on in that scenario.
For-Profit Institutions
Graduation makes students much more likely to repay their debt successfully and the quality of the school a student attends is directly connected to the likelihood a student will do so. The for-profit higher education industry is one rife with problems. The graduation rate for first-year, full-time students—those most likely to graduate—at for-profit, four-year schools was about 40 percentage points lower than at public four-year schools. For-profit schools often charge students more, even in certificate programs, where completion rates tend to be very high as a result of very short instructional programs. In some cases, the costs to students for a for-profit certificate is higher than a comparable program in the public sector, and the payoff can be far lower.29 Beyond poor graduation rates, some for-profit schools have defrauded students by misrepresenting job placement rates; engaged in predatory recruitment practices designed to get students in the door without adequate time to consider their options; and/or operated with unstable finances, causing them to close the doors abruptly leaving students in the lurch. The rise of the for-profit higher education sector has contributed significantly to the rise in student debt and related financial hardship.
What Debt Protections Exist Now?
There are several public programs designed to protect students from having loan payments they cannot afford. In addition to the standard ten-year plan, Congress created options to spread out the length of repayment so that students would have lower payments, especially when they are starting their careers and their incomes may be lower.
Congress also created income-based or income-driven repayment plans, which currently enroll approximately 3.6 million Millennial borrowers. These plans lengthen the periods of repayment and limit payments to a percentage of students’ discretionary income—defined as 150 percent of the federal poverty line for their family size. If borrowers’ wages are not above that threshold, then the government deems their income is not sufficient to pay any amount and the borrower will have a “$0 payment” for that time period. This offers protection when incomes are low or fluctuate. Because payments are income-based, rather than based on the amount of debt to be repaid, balances that remain at the end of the payment period (20 or 25 years, depending on the program) will be forgiven.
Borrowers have other options for loan forgiveness depending on their type of work. For teachers, there is the Teacher Loan Forgiveness program. To attract teachers to work in low-income schools, this program allows the Department of Education to forgive a portion of their student loans. Teachers can receive forgiveness of up to $5,000 after working in those low-income schools for five years. They are eligible for up to $17,500 in forgiveness if they teach math, science, or special education.
Additionally, student borrowers may access the Public Service Loan Forgiveness program (PSLF). Because PSLF was created in 2007, Millennials are likely to be the first generation to take advantage of it. People who choose to work in the public sector often receive lower pay than if they worked in similar positions in the private sector. Congress, seeing the value to the public of having people work in government, public education, and non-profit organizations, created this program to alleviate the debt burden for those borrowers who want to work in public service. After 10 years of working in public service, while making payments under income-based repayment, borrowers are able to receive forgiveness for any remaining balance, tax-free.
Policy Recommendations
Despite these protection programs, many student borrowers struggle financially with repayment. There is a case for additional policy changes to alleviate the financial pain felt by Millennials as a result of their student debt burden. Policymakers should consider pursuing reforms to simplify payment, help non-completers finish their degrees, end the taxation of loan forgiveness, and fix the Public Service Loan Forgiveness Program, and provide more targeted forgiveness to certain groups of borrowers.
Simplify Repayment
Currently, there are eight different repayment plans, including the standard repayment plan, two plans that extend the repayment period, and another five income-based plans. While the plethora of options was meant to meet the differing needs of borrowers, having this many options creates confusion for those entering repayment. Currently, these programs are too difficult to access—especially for those facing hardship. Congress should reduce the number of payment options to future borrowers to a standard ten-year plan and a single income-based repayment plan. Congress should also ease paperwork burdens by automatically recalculating borrowers’ payments each year, instead of requiring annual applications, and automatically placing delinquent borrowers in income-based repayment. These steps will help ensure borrowers are up-to-date on payments by making them more affordable and place them on the path to eventual forgiveness, if needed.
Help Non-Completers Complete Their Degrees
Because non-completers are most likely to default on their loans, strategies should be devised and refined to help them through re-enrollment and repayment. When non-completers go on to finish their degree they are not only less likely to default on—and therefore repay—their loans, but they are more likely to reap the benefits of a higher salary contributing more in taxes and into the economy. The federal government should make sure these students have access to the needed aid and should eliminate their lifetime cap on Pell Grants.
End Taxation of Loan Forgiveness
Income-based repayment programs can be immediately improved by changing their tax treatment. Currently, if a borrower has their loan balance forgiven after the end of their income-based repayment period, the amount forgiven is deemed as taxable income. Since an outstanding balance reflects a chronically low income, this contradicts the goals of the program. As this is a relatively new program, borrowers are just now getting to the end of their loan terms and are receiving this forgiveness. Congress should implement this change as soon as possible to maximize its impact.
Fix the Public Service Loan Forgiveness Program
While the Public Service Loan Forgiveness program is generous (particularly for the highest-debt borrowers), it has had severe problems in implementation. Policymakers should reform PSLF to ensure borrowers are not mistakenly denied benefits they have rightfully earned. The Department of Education should work with the loan servicer responsible for these borrowers to increase outreach and identification of eligible borrowers by using data to proactively identify these public servants. Applying for forgiveness and certifying—or verifying—employment should be simplified and streamlined with an electronic system to process these documents. These efforts can ensure these borrowers are provided the forgiveness they were promised when the time comes.
Currently, PSLF has no limit on the amount of forgiveness for which borrowers can qualify. With expensive graduate degrees in fields like law and medicine, some worry that costs will lead to the elimination of the program. The Trump Administration and House Republicans have proposed to eliminate this program. To ensure its longevity, some—including the Obama Administration—have proposed limiting the amount eligible for forgiveness, either to a specific dollar amount or to undergraduate loans given the increased costs of forgiving graduate loans. Others have suggested providing more frequent forgiveness at periodic intervals over the ten years. This would allow borrowers to achieve some forgiveness even if they choose to work for shorter, but still meaningful, amounts of time.
Provide Targeted Forgiveness
Broad loan forgiveness disproportionately benefits borrowers with graduate degrees, particularly White borrowers in fields such as law and medicine where they earn higher salaries and people of color are underrepresented. Targeted loan forgiveness could eliminate the burden of those struggling most to repay their loans. Too often schools—particularly predatory for-profit schools—load students up with debt but don’t set them on a path toward higher incomes. A solution to address this is to provide relief for borrowers who attended these types of schools—and hold those schools accountable so they stop offering low-value, high-cost programs. If most graduates have unmanageable debt because their degree has failed to get them a good-paying job, then that school or program has failed to do its job and those students should be able to experience some relief.
Students who are delinquent on their loans should have cancellation as an option if it is clear their educational investment is not paying off. This could be targeted to those borrowers who have been forced to rely on social safety net programs like Medicaid, Supplemental Security Income (SSI), or Supplemental Nutrition Assistance Program (SNAP) for a determined number of consecutive years of repayment. If borrowers are living in poverty, the government is likely to never recoup this money, and the strains of debt collection activities may undermine other anti-poverty efforts.
Conclusion
Concerns regarding college costs and debt are legitimate, especially for a generation where many entered the workforce at a time when the economy was weak. However, it is important to understand that for most borrowers with a degree the debt is manageable and affordable. Many people, especially low-income people, rely on student debt to attend college and would not be able to do so without it. Millennials used student debt to become a more educated generation and set them up for the lifetime of benefits a college degree offers. A narrative overstressing the “crisis” of the cumulative loan debt or the rare borrower with six figure debt ignores that success and can have some negative consequences. It can even create anxiety about borrowing that could lead people to avoid college in the first place. There are certainly issues with student debt for specific groups of borrowers, and it is these groups that should garner the attention of policymakers.
Citations
- “Digest of Education Statistics: Table 303.70.” National Center for Education Statistics, U.S. Department of Education, 2019. source
- “Postbaccalaureate Enrollment.” National Center for Education Statistics, U.S. Department of Education, 2019. source
- “Trends in College Pricing: Figure 9, 2018.” The College Board. source
- “Trends in College Pricing: Figure 6, 2018.” The College Board. source
- Fishman, Rachel, Sophie Nguyen, and Alejandra Acosta. “Varying Degrees.” New America, 10 September 2019. source
- “15 Economic Facts About Millennials.” U.S. Council of Economic Advisors, October 2014. source">source
- “Digest of Education Statistics: Table 303.70.” National Center for Education Statistics, U.S. Department of Education, 2019. source
- “Digest of Education Statistics: Table 303.70.” National Center for Education Statistics, U.S. Department of Education, 2019. source
- “Postbaccalaureate Enrollment.” National Center for Education Statistics, U.S. Department of Education, 2019. source
- “Federal Student Loan Portfolio.” Federal Student Aid, U.S. Department of Education, 2019. source
- “National Postsecondary Student Aid Survey.” National Center for Education Statistics, U.S. Department of Education, 2019. source ; The data are from surveys fielded in academic years 2003-2004, 2007-2008, 2011-2012, and 2015-2016. Data are limited to the students who would fall into the appropriate age range for Millennials in each year. Debt was adjusted for inflation.
- Detting, Lisa, et. al. “Recent Trends in Wealth-Holding by Race and Ethnicity: Evidence from the Survey of Consumer Finances.” The Federal Reserve. 27 September 2017. source ; “Postbaccalaureate Enrollment.” National Center for Education Statistics, U.S. Department of Education, 2019. source
- “Latinx” covers both Hispanic non-White and Latino households.
- Boatman, Angela, Brent Evans, and Adela Soliz. “Understanding Loan Aversion in Education: Evidence from High School Seniors, Community College Students, and Adults.” 17 January 2017. source
- Huelsman, Mark. “The Debt Divide: The Racial and Class Bias Behind the “New Normal” of Student Borrowing.” Demos, 19 May 2015. source
- “Postbaccalaureate Enrollment.” National Center for Education Statistics, U.S. Department of Education, 2019. source
- Some borrowers may have received a Pell Grant in other years, but did not due to changed financial or family situations.
- Carnevale, Anthony P., Stephen J. Rose, and Ban Cheah. “The College Payoff: Education, Occupations, Lifetime Earnings.” The Georgetown University Center on Education and the Workforce, 5 August 2011. source
- “Federal Student Loan Portfolio.” Federal Student Aid, U.S. Department of Education, 2019. source
- “Official Cohort Default Rates for Schools.” Federal Student Aid, U.S. Department of Education, 2018. source
- Leonhardt, David and Sahil Chinoy. “The College Dropout Crisis.” The New York Times, 13 May 2019. source
- “Investing in Higher Education: Benefits, Challenges, and the State of Student Debt.” The Executive Office of the President, July 2016. source
- Webber, Douglas. “Is College Worth It? Going Beyond the Averages.” Third Way, 18 September 2018. source
- Scott-Clayton, Judith. “The Looming Student Loan Default Crisis is Worse Than We Thought.” The Brookings Institution, 10 January 2018. source
- Boatman, Angela, Brent Evans, and Adela Soliz. “Understanding Loan Aversion in Education: Evidence from High School Seniors, Community College Students, and Adults.” 17 January 2017. source
- Marx, Benjamin M., and Lesley J. Turner. “The Benefits of Borrowing.” Education Next, Vol. 19, No. 1. source
- “Digest of Education Statistics: Table 306.50.” National Center for Education Statistics, U.S. Department of Education, 2019. source
- Whistle, Wesley, and Tamara Hiler. “The Pell Divide: How Four-Year Institutions are Failing to Graduate Low- and Moderate-Income Students.” Third Way, 1 May 2018. source
- “Fact Sheet: Department of Education Announces Release of New Program-Level Gainful Employment Earnings Data.” U.S. Department of Education. source
Young Adults and Consumer Debt: The Quiet Crisis Next Time
Ida Rademacher and Genevieve Melford
The balance sheets of young adults in America today look different than they have in generations past. In particular, their overall net worth—defined most basically as assets minus liabilities—is generally lower, due to having accumulated both fewer assets and more debt. These overarching trends reflect the broader economic conditions that are impacting the financial lives of families across the country. The prevailing reality is that a growing share of the population lacks a level of income necessary to cover cost of living expenses, which in turn is keeping families from saving, investing, and building wealth for the future.
As the Federal Reserve Bank of New York recently reported, total non-mortgage debt amounted to $3.95 trillion in 2019, a 47% increase from the previous peak of $2.71 trillion in the fourth quarter of 2008,1 during the onset of the Great Recession. Defaults on these loan obligations are growing.2 Specifically, debt in collection now appears on one-third of credit reports.3 Just as the 2008 crisis reflected structural flaws in the regulation of the economy, including perverse mortgage underwriting incentives and lax enforcement, the rise of consumer debt today reflects systemic issues—a labor market where more people earn low and volatile incomes, rising costs for housing, healthcare, and education, and a fraying social safety net that shifts risk onto individuals. The Millennial wealth gap is one of the results. Compared to generations past, it has become increasingly difficult for today’s young adults to make their ends meet, let alone build wealth.
Eleven years ago, the entire world was staring into the financial abyss. Massive defaults in U.S. subprime mortgages had triggered a global financial crisis; banks, investment houses, and insurers everywhere fell like dominoes, and the economic pain inflicted on ordinary people was intense and widespread, too. Small wonder that just over a decade later there is the temptation just to be glad we avoided Armageddon and to close our eyes to the next crisis now growing: consumer debt.
That temptation should be resisted. Even if it appears less dramatic and doesn’t dominate the news, rising consumer debt has serious consequences. A quiet crisis is brewing. Sixteen percent of suicides occur in response to a financial problem. Financially-stressed people experience higher rates of physical illness and are more than twice as likely to suffer depression and anxiety.4 Not all over-indebted people experience catastrophic health outcomes, of course, but it does negatively impact a host of behaviors that benefit society writ large. Specifically, people with poor finances tend to postpone getting married and forming families,5 buying homes,6 starting businesses,7 and other things that make for healthy civic life and a robust economy. A country filled with stressed-out, socially-isolated people struggling under unmanageable debt is not the recipe for a thriving nation.
The Aspen Institute Financial Security Program (Aspen FSP) works to illuminate the country’s critical financial challenges and to make financial security for all Americans a national priority. Given the threat that consumer debt poses, we have devoted a round of our interdisciplinary EPIC (Expanding Prosperity Impact Collaborative) initiative to harnessing the knowledge of experts from various perspectives—nonprofit, academic, government, and industry—who are all working on this issue. EPIC’s assessment confirms that the sources of harmful consumer debt are systemic, and the consequences severe. But we have also been heartened to find examples of committed leadership and innovative solutions which we highlight in our recent report, Lifting the Weight: Solving the Consumer Debt Crisis for Families, Communities, and Future Generations.8
Consider student loans. Thanks to the rapidly rising cost of attending college and declining availability of educational grants, the average student loan debt for a member of the Class of 2017 exceeds $39,000. The aggregate sum of all current student loans now exceeds $1.5 trillion, which is $600 billion more than the entire credit card debt of the nation.9 A recent development is that employers have begun stepping in, offering student loan repayment as an employee benefit. Early adopters, such as the office supply chain Staples, are ensuring that student loan repayment benefits are available to their lower-paid workers most likely to need the help. Policymakers have begun responding too. In a recent brief, Student Loan Cancellation: Assessing Strategies to Boost Financial Security and Economic Growth, our team reviewed 6 recent legislative proposals introduced by Democrats and Republicans alike.10 Presidential candidate Senator Elizabeth Warren’s bold proposal to cancel up to $50,000 of every borrower’s debt has generated greater interest in addressing the issue.
Government fees and fines are another driver of onerous debt that is besieging families with lower incomes. Community organizers in Alabama, for example, surveyed residents who owed debt to a court system and found that 80 percent were forced to cut back on food and utilities to pay it off. Advocates nationwide have begun urging policymakers to base fines and fees on ability to pay, to prohibit jail time for unpaid court debts, and above all, to reduce state and municipal reliance on fines and fees for revenue. The San Francisco Treasurer’s Office’s Financial Justice Project is one of the leaders analyzing this issue and working on solutions.
When people fall behind—and more than 70 million adults in this country have debt in collections—the result is higher interest rates, lower income (due to garnishments), penalties, and other responses that make a bad situation worse. There is a growing imperative to identify effective solutions to the snowballing effect of rising consumer debt. One such innovation, LendStreet, pays off creditors directly and then allows repayment of a consolidated loan with manageable terms. Another, run by the collections agency TrueAccord, is boosting repayments by using artificial intelligence to tailor more effective communications to over-extended borrowers.
Our role at Aspen FSP is to lift up solutions like these and others in order to get more leaders to focus on the critical issue of consumer debt. We recognize that the root causes of this crisis—stagnating incomes and inadequate social safety nets—have been decades in the making and won’t be quickly solved. But all stakeholders have roles to play right now in marshaling a response to the emerging crisis of consumer debt, especially as it impacts young households. For instance, nonprofits can help families avoid taking on high-cost debt and pay off what they already owe. Employers can help workers automatically save part of their paychecks, offer student loan repayment benefits, and facilitate early access to earned wages when workers need it. Financial services providers can design early interventions so people who fall behind on debt payments can get back on track. Regulators can crack down on predatory lenders and harmful collection methods. The federal government can expand Pell grants for low-income students and deny federal assistance to institutions with a history of poor student outcomes.
The levels of consumer debt that are impacting young adults today are unsustainable and debilitating—both for the households afflicted and the country as a whole. However, there are promising responses to address this quiet crisis which can be pursued and are worthy of support. It is time to move with a greater sense of urgency. Already 11 percent of the $1.5 trillion in student loans— more than $1.3 trillion of which is guaranteed by the government—are in default. That is the biggest category of consumer debt, but it’s hardly the only one. We have seen what comes from ignoring a burgeoning crisis. Let’s learn from history instead of repeating it.
Citations
- Federal Reserve Bank of New York, Quarterly Report on Household Credit and Debt, Q1 2019, May 2019. source
- Federal Reserve Bank of New York, Household Debt and Credit. source See interactive graph of 90-day delinquency rates showing rising rates for credit card, auto, and student loans.
- United States Consumer Financial Protection Bureau, Consumer Credit Reports: A Study of Medical and Non-medical Collections, December 2014. source
- Elliot Richardson. “The Relationship between Personal Unsecured Debt and Mental and Physical Health: A Systematic Review and Meta-analysis.” Clinical Psychology Review. December 2013. source
- American Student Assistance, Life Delayed: The Impact of Student Debt on the Daily Lives of Young Americans, 2015, source
- Ringo Mezzo. “Can Student Loan Debt Explain Low Homeownership Rates for Young Adults?” Consumer and Community Context, Federal Reserve Bank of the United States, January 2019. source
- Cordell Ambrose. “The Impact of Student Loan Debt on Small Business Formation.” Working Paper No. 15-26, Federal Reserve Bank of Philadelphia, July 2015. source
- Aspen Institute Financial Security Program. “Lifting the Weight: Solving the Consumer Debt Crisis for Families, Communities, and Future Generations.” November 2018. source
- Federal Reserve Bank of New York, Quarterly Report on Household Credit and Debt, Q1 2019, May 2019. source
- Lucas McKay. “Student Loan Cancellation: Assessing Strategies to Boost Financial Security and Economic Growth.” April 2019. source The six legislative proposals are: The SIMPLE Act of 2017, introduced by Rep. Suzanne Bonamici and Sen. Ron Wyden; the Affordable Loans for Any Student Act of 2018, introduced by Sen. Jeff Merkley; the Parent PLUS Loan Improvement Act of 2018, introduced by Rep. Marcia Fudge; the PROSPER Act of 2017, introduced by Rep. Virginia Foxx; the Students Over Special Interests Act of 2018, introduced by Rep. Jared Polis, and Sen. Lamar Alexander’s 2019 Make College Worth It proposal.
Homeownership and Living Arrangements among Millennials: New Sources of Wealth Inequality and What to Do about It
Jung Choi
Homeownership in America has historically been both a reflection of current wealth and a predictor of future wealth. Becoming a homeowner as a young adult is often a foundational step in the process of future wealth accumulation (Goodman and Mayers 2018). Yet, compared to the prior generations, fewer Millennials are buying a place of their own.
Two significant shifts in housing arrangements have become apparent for Millennials who came of age after the Great Recession: a decline in the rate of homeownership and a rise in the share of those who stay with their parents. Relatedly, household formation, marriage, and child-rearing are down. The impacts of these trends on future wealth could be long-lasting, as many younger adults will have less time to build housing wealth before they reach their retirement age.
Not only are there intergenerational gaps, but there are substantial disparities in homeownership and living arrangement across race, ethnicity, and education among younger adults. In fact, these gaps of housing equity have become exacerbated since the Great Recession, as people of color (especially Black young adults) and the less educated were hit hardest and have experienced a slower recovery. This means that changes in homeownership and living arrangements among Millennials have become new sources of wealth inequality.
Multiple factors contribute to the low Millennial homeownership rate and their delay in forming independent households. These include demographic shifts and changes in socioeconomic characteristics of the generation of young adults. However, there has also been a rise in external barriers that have made accessing homeownership more difficult. Understanding these barriers can help inform the development of effective policy interventions. This chapter presents the data trends on homeownership and living arrangement among Millennials, explores what is driving these trends, and discusses potential long-term consequences. The chapter concludes with a range of policy options that could enhance the future well-being of Millennials and upcoming generations and promote greater equity in American society.
Young Adults’ Homeownership and Living Arrangement Trends
In order to understand the changing relationship of Millennials to homeownership and living arrangements, let’s take a closer look at the data.1 Figure 1 shows the homeownership rate of young adults between ages 25 and 34. The young adults’ homeownership rate peaked at 47 percent in 2005, but following the 2007 housing market crisis, the number dropped 10 percent to 37 percent by 2015. The homeownership rate of this group stood at 38 percent in 2017, ticking up slightly with the improvement in the macroeconomy. The net effect of this lower rate of Millennial homeownership is sizeable. If Millennials ages 25 to 34 had the same homeownership rate as their age cohort in 2000, there would be 1.3 million more young homeowner households than the country has today.2
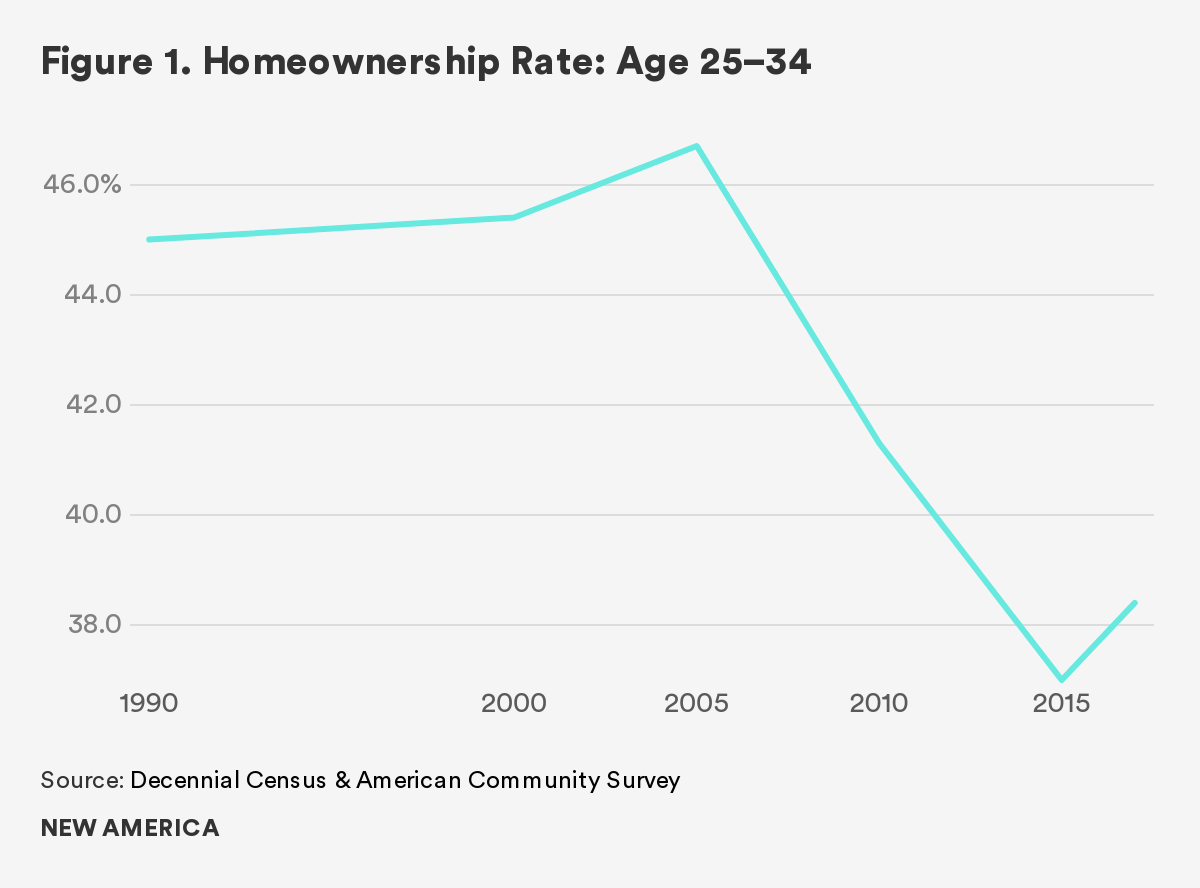
The homeownership rate captures only those who have already formed their independent households. Thus, the delay in household formation is not reflected in the homeownership rate, but it is actually an even larger factor in the generational housing disparities. Figure 1 shows that not only are Millennials delaying owning a home, but they also stay in their parents’ homes for a longer period. The share of young adults (ages 25–34) living with their parents has increased from 12 percent to 22 percent between 2000 and 2017, adding about 5.1 million more young adults living under their parents’ roofs. Unlike the homeownership rate, which has stabilized in the past few years, the share of 25- to 34-year-olds living with parents continued to go up. In general, this trend reflects a reality that Millennials are less likely to form independent households than the prior generation. If both homeownership and the rate of household formation (headship rate) in 2017 remained the same as in 2000, today there would be 2.4 million more Millennial individual homeowners ages 25 to 34.
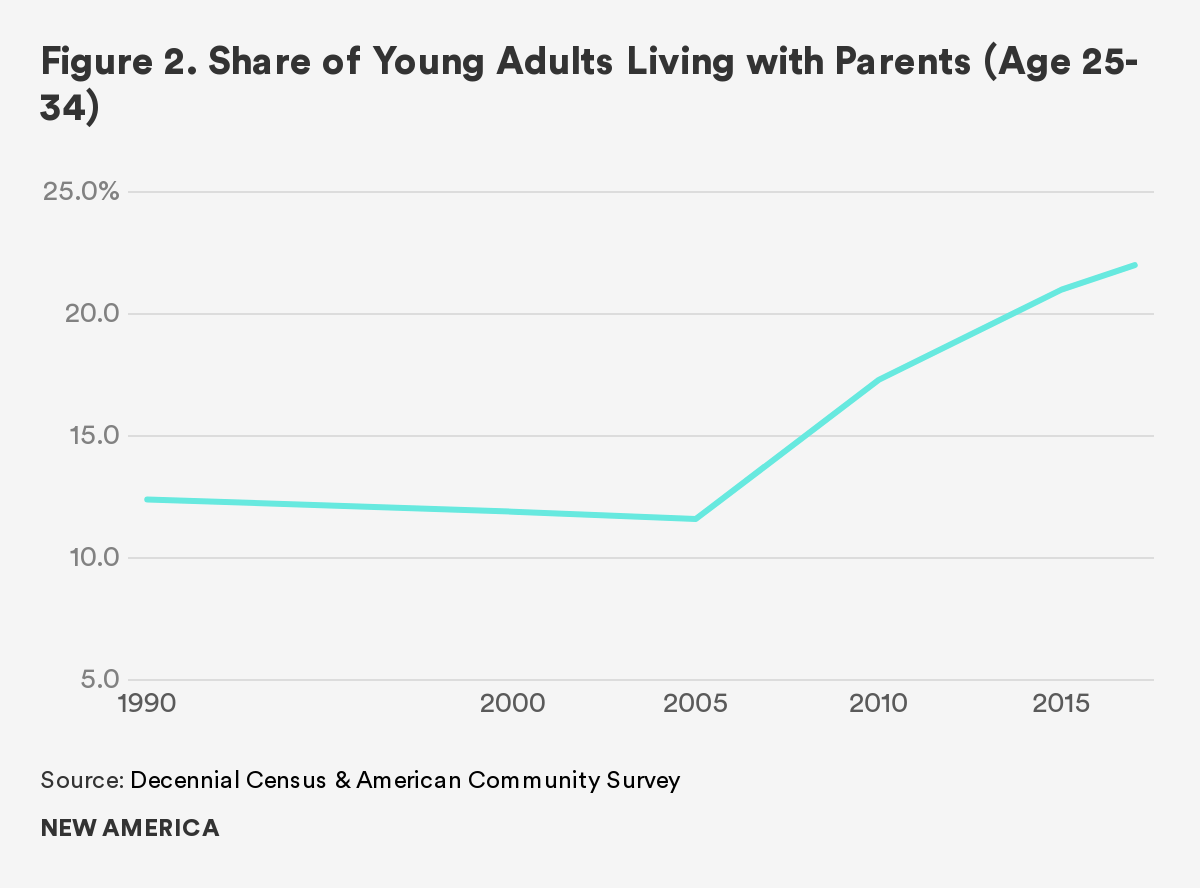
Another current housing trend of young adults is the persistent disparities in the homeownership gap by race and ethnicity and also by education. Figure 3 shows that the homeownership rate of young White households has always been higher than for people of color. While the homeownership rate has dropped for all racial and ethnic groups since 2005, from 2015 on, the rate has started to recover slightly for Whites, Asians, and Hispanics. However, the homeownership rate of young Black households continued to drop, further widening the racial homeownership gap. The Black–White homeownership gap in 2017 was 32 percent, about 6 percentage points higher than the gap in 2000. Furthermore, young Black households were the only group that did not experience an increase in homeownership during the housing boom between 2000 and 2005.
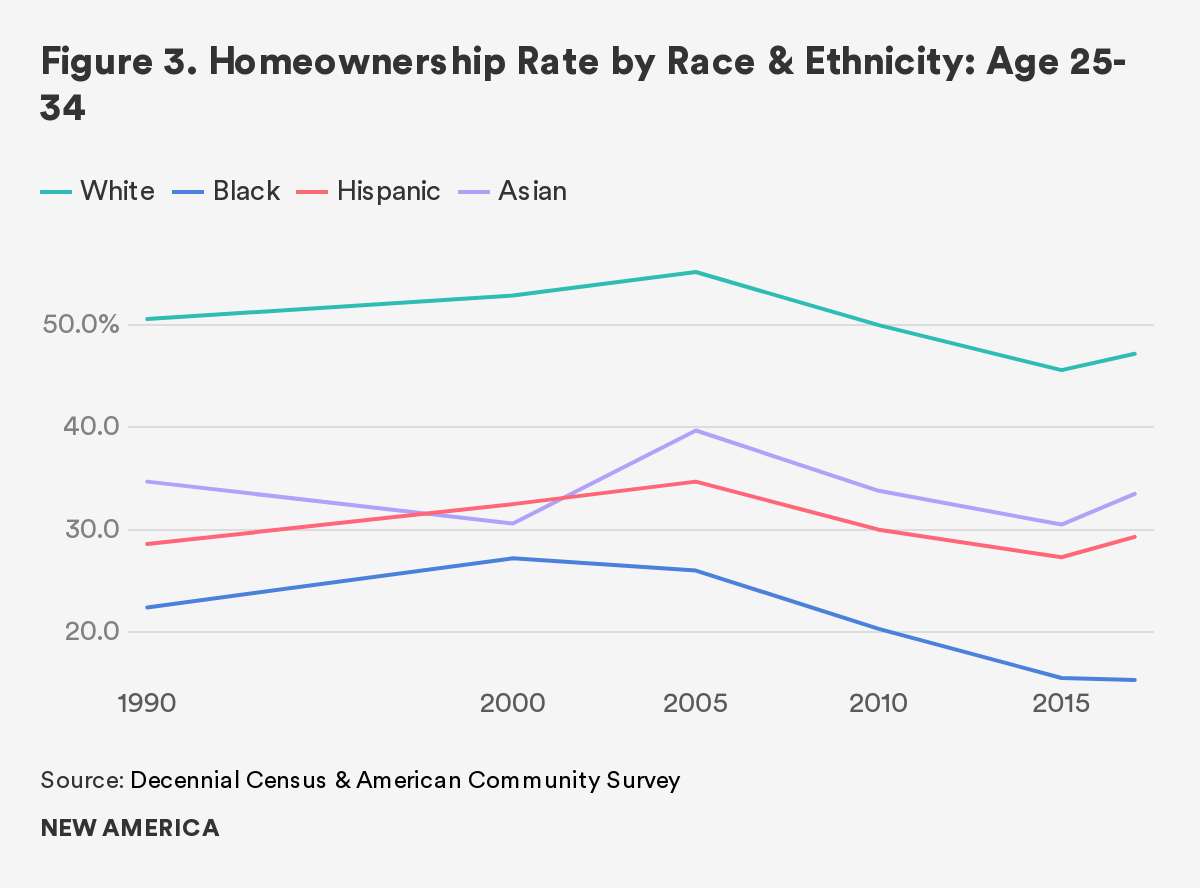
Black young adults are also most likely to live with their parents. Close to 29 percent of Black young adults ages 25–34 were living with their parents in 2017, almost 10 percentage points higher than the share of Whites who did so. Following the crisis, the share of young adults living with their parents increased for all race and ethnic groups, but the share increased most rapidly for Blacks and Hispanics.
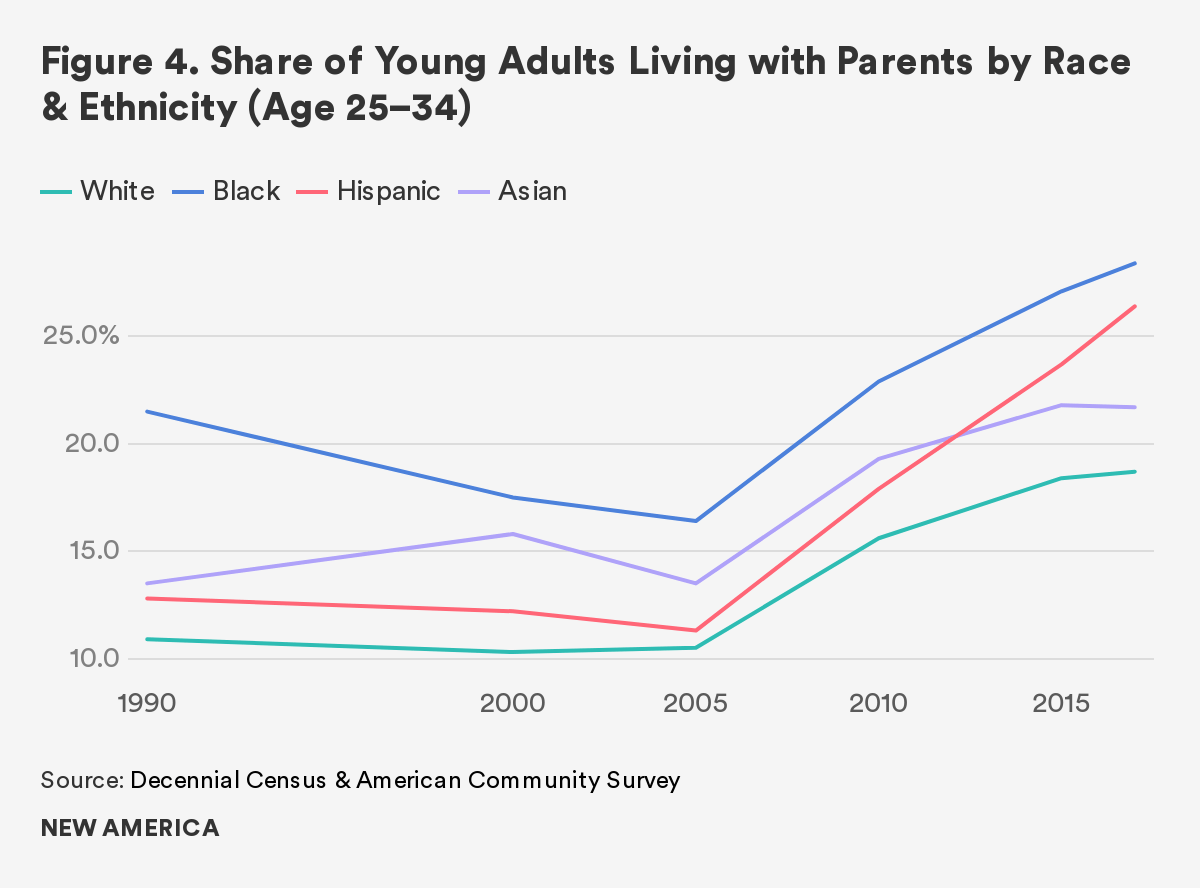
The homeownership gap across education groups also widened between 2000 and 2017. In 1990 and 2000, the homeownership rate of those with only a high school degree was similar to those with a bachelor’s degree. However, since 2000, the homeownership rate of young adults with high school or less education has constantly dropped, while the homeownership rate of those who received more education increased during the housing boom of 2000–06. Moreover, those with higher educational attainment have shown a slightly faster recovery in their rate of homeownership since 2015.
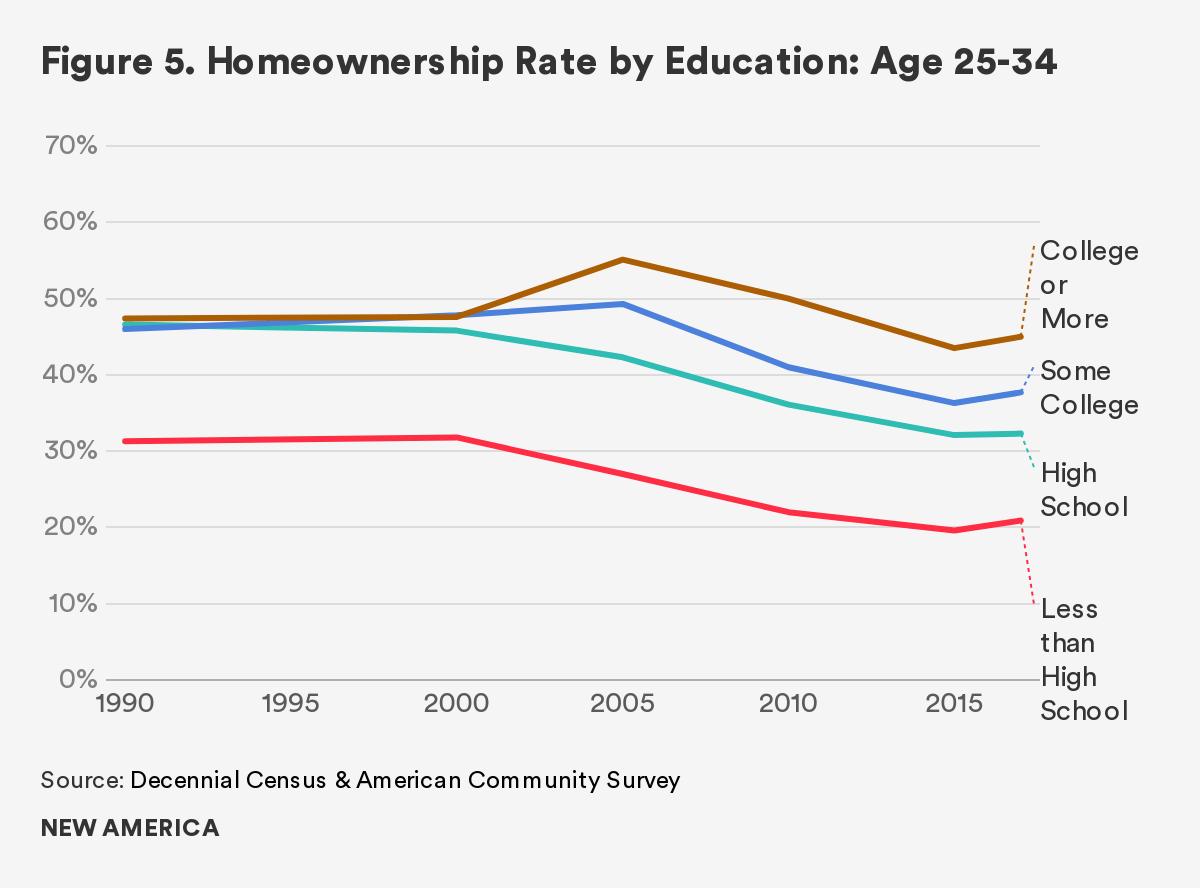
High school graduates were most likely and college graduates were least likely to live with their parents in 2017. Again, the share of young adults who lived with their parents increased for all education groups, but the rate of increase was higher for those with lower educational attainment.
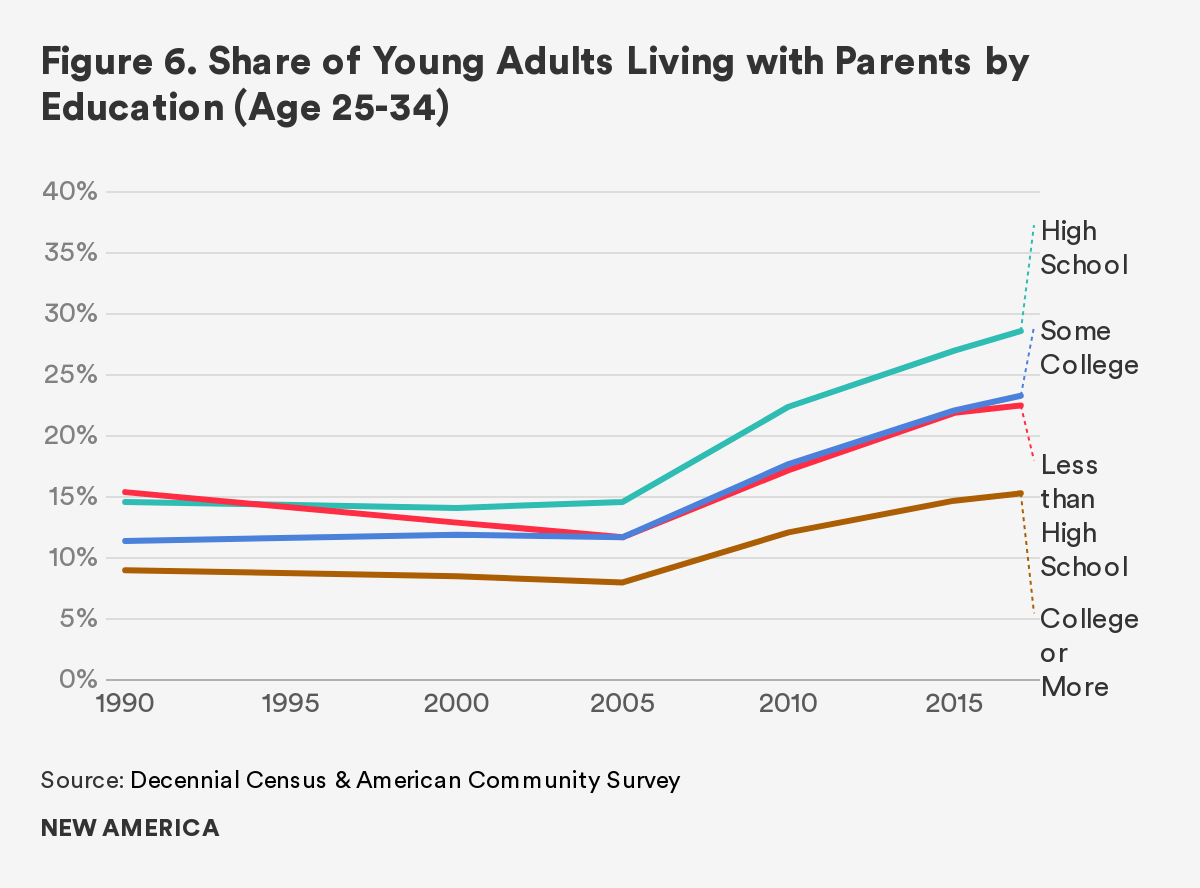
Why Is Millennial Homeownership So Low?
Millennials clearly show different patterns in homeownership and living arrangements. Before crafting a policy response, it is helpful to take a deeper dive into the factors that have driven this change.
Multiple reasons can explain why Millennials are less likely to be homeowners than generations earlier. Below, five potential factors are considered.
Shifts in Preferences
Some argue that Millennials have a lower desire to become homeowners. This could be due to their personal experiences with the housing market crisis. Even if they were too young to be homeowners during this time, many young adults watched their parents lose their homes. However, this most likely explains only a small proportion of the homeownership decline among Millennials.
Public opinion research actually finds that Millennials have a similar aspiration to be homeowners as did their parents’ generation. According to the 2018 Apartment List survey of about 6,400 Millennial renters, 89 percent stated that they would want to own a home sometime in their future (Salviati and Warnock, 2018). A recent study by the Federal Reserve Board also finds that Millennials do appear to have similar preferences toward housing consumption compared to prior generations (Kutz et al. 2018). Choi et al. (2018a) found that the attitude of Millennials toward homeownership has, in fact, become slightly more negative in recent years, but suggests that Millennials’ desire for homeownership is likely to recover as the economy continues to strengthen, home prices continue to rise, and the memory of falling home values and eroding assets fades in time.
Other related attitudinal shifts among Millennials include growing preferences for living in downtown areas, or in more expensive cities where affordable homes are less available. Studies, including Choi et al. (2018a), find that Millennials are more likely to move to cities with limited growth in housing supply (e.g. San Francisco, Los Angeles, and New York) and also are more likely to move to downtown areas where the prices of homes are higher. These choices may undermine Millennial home purchases. However, cities which have experienced rising prices are also where there are greater job opportunities, explaining why those are the places where Millennials might seek to live. The data indicate that the migration of Millennials to high-cost areas is particularly concentrated among those who received more education, and it doesn’t explain why the homeownership rate has dropped more among those with less education (Choi et al. 2018a).
Delaying Marriage
Millennials are more likely to delay marriage, a life event that is highly correlated with home buying and the decision to move out of parents’ homes. Only 40 percent of Millennials ages 25–34 were married in 2017, a substantial decrease from almost 60 percent in 1990. Those who never married increased by over 24 percentage points, from 29 percent to 53 percent.
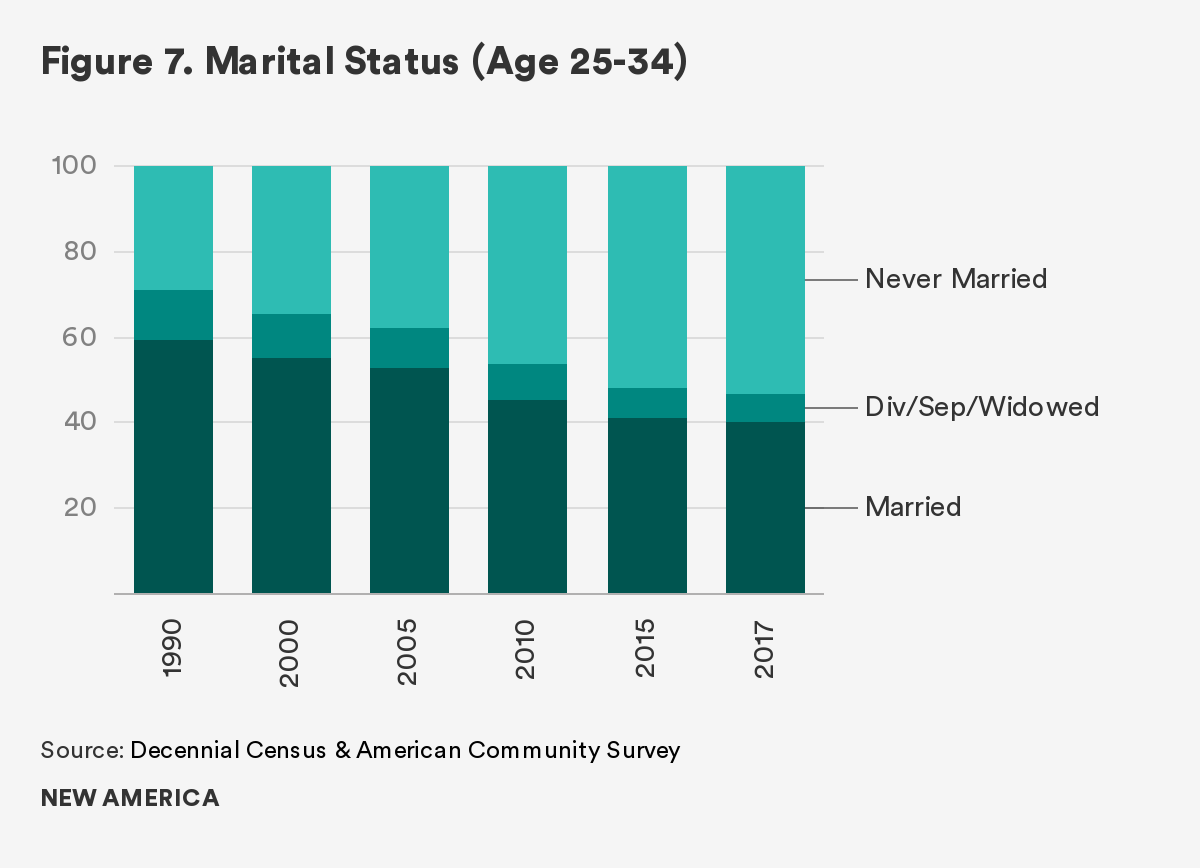
Figure 8 shows that those who are married or have experienced marriage are more likely to be homeowners than those who have stayed single. Additionally, young adults who have never married are most likely, and those who are currently married are least likely, to live with their parents. This indicates that changes in marital composition are associated with the drop in the Millennial homeownership rate as well as the increase in the share of young adults living with parents.
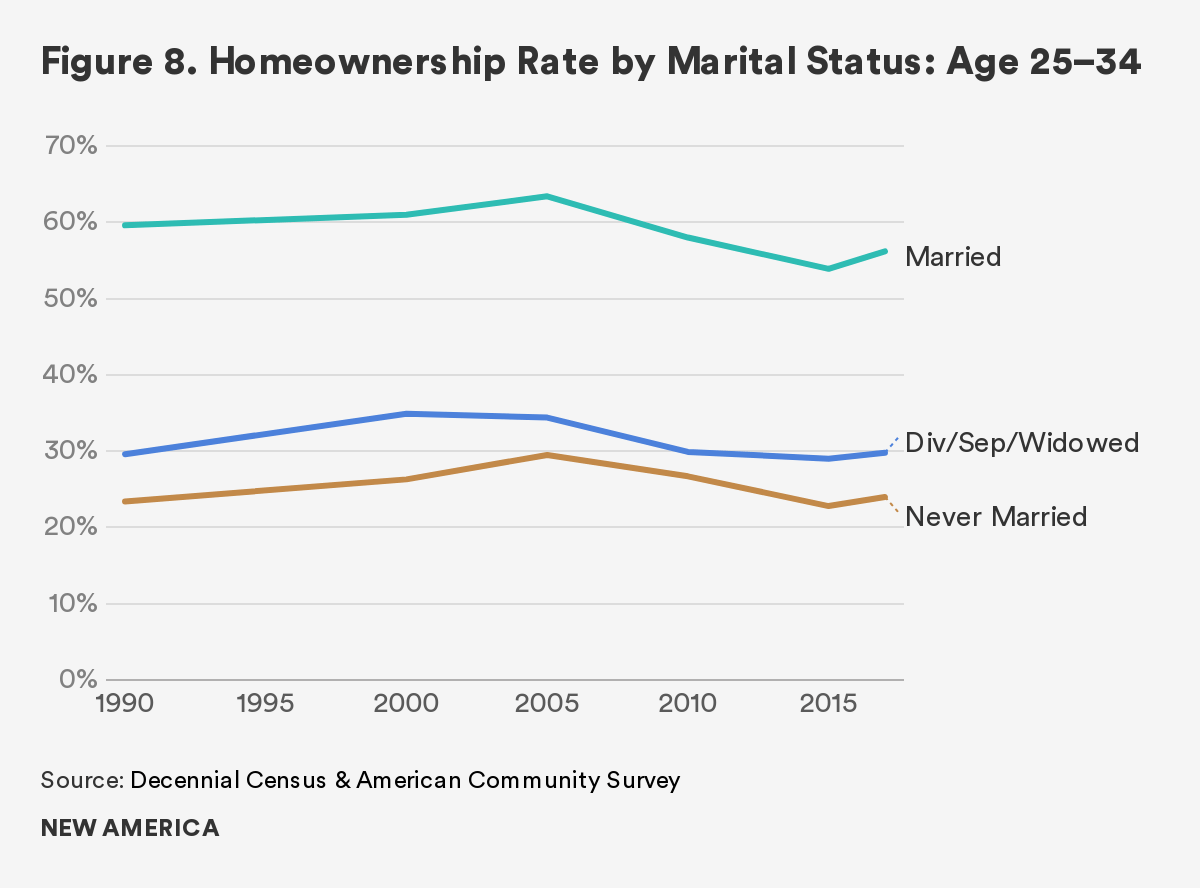
However, this alone does not provide a complete explanation, as married Millennials are also less likely to be homeowners and more likely to live with their parents than young adults in the prior generation (Figure 9). In fact, the Urban Institute (Choi et al. 2018a and Choi et al. 2019) finds that if the marital composition in 2017 had been the same as in 2000 while the homeownership rate and the share of young adults living with their parents stayed at the 2017 rate, the homeownership rate would increase by about 3 percentage points and the share of living with parents would increase about 5 percentage points. This narrows, but does not fully close, the gap between the prior and the current generations. It is likely there are common factors shaped by the larger economy, such as jobs, wages, and costs of living, that simultaneously affect young adults’ decision to delay both marriage and moving out of their parents’ homes.
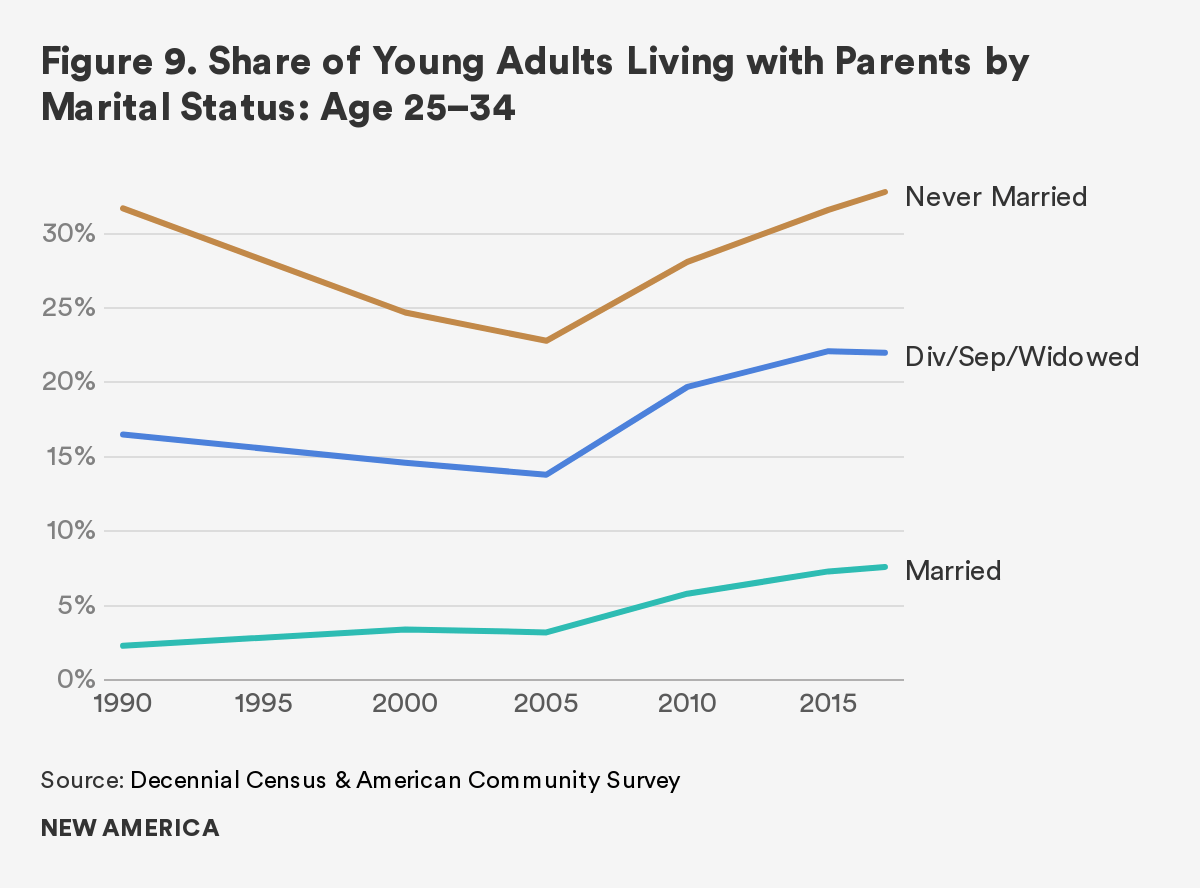
Lack of Housing Supply
Just at the time when Millennials reach the age when many of their parents bought their first home, there has been an increasing shortage in the supply of affordable homes on the market. While home prices vary by geography, the average home prices today are higher than during the peak of the housing boom in late 2006.
Because of increasing land and labor costs, new housing construction has not kept up with the growing demand. Specifically, the number of new housing starts in 2018 is lower than that of the 1960s, when the U.S. population was only about 55 percent of what it is today. The lack of supply is driving up home prices beyond the reach of many Millennials. This supply shortage is placing upward pressure on rents, which not only means a larger share of income has to be devoted to housing costs but also makes it more difficult to save for a down payment. Choi et al. (2018) find that a 10 percent increase in the rent-to-income ratio decreases young adults’ likelihood of owning a home by 0.7 percentage points, and a 10 percent increase in residual income increases the likelihood by 0.5 percentage points, after controlling for demographic and socioeconomic characteristics. Furthermore, as both land and building costs increase, a greater portion of construction occurs at the higher end of the market, leading to a greater price increase at the lower end of the market, which has a more limited supply. These factors create significant challenges for first-time home buyers, with limited wealth and incomes, to find an affordable home which they are able to purchase.
Tighter Credit
Soon after the housing market began to collapse, access to credit tightened. This meant that potential buyers had a harder time qualifying for mortgage loans. These higher lending standards have persisted. The median credit score for mortgages at origination was 732 in March 2019—higher than the median of 692 in 2000, a period of reasonable lending standards (Goodman et al. 2019). Credit not only affects homeownership but also affects the decision to move out of parents’ homes and start renting, as landlords prefer renters who can prove their financial stability. Younger adults are more likely to have lower credit scores—the 2016 median credit score for Millennials was 640, 662 for Generation X, and 728 for Baby Boomers (Choi et al. 2018a). Furthermore, as many young adults have thin or no credit files, it is harder for them to rent a house or get a mortgage.
Lower Income and High Student Debt
During the Great Recession, the unemployment rate shot up to nearly 10 percent and incomes dropped significantly. Many Millennials entered the job market when it was harder to find work. Between 2005 and 2010 the percentage of young adults earning less than $15,000 per annum (constant 2017 dollars) increased from 27 percent to 32 percent, while those earning more than $50,000 decreased from 26 percent to 23 percent. As finding a job become more difficult, many chose to stay longer in school, pursuing a college degree or entering graduate school. This increased the number of Millennials with college degrees, but it also increased their overall debt load. Specifically, the share of college graduates increased from 28 percent to 36 percent between 2000 and 2017 (Choi et al. 2019).
During this period, student debt has more than tripled. According to the Survey of Consumer Finance (SCF), the average student debt of young adults ages 25–34 increased from $4,346 in 2001 to $17,120 in 2016. Higher student debt has a negative impact on Millennials’ attaining homeownership (Bleemer et al. 2017; Choi et al., 2018) and has deterred young adults’ decision to move out of their parents’ homes.
According to a recent Fed study, there would be 400,000 more Millennial homeowners if student loan burden had not financially constrained them (Mezza et al. 2019). The paper finds that student debt explains about 20 percent of the decline in Millennial homeownership. In a recent survey (American Student Assistance and National Association of Realtors, 2017), 75 percent of Millennials with student debt said that their student debt impacted their homeownership, and 42 percent answered that it was delaying them from moving out of a family member’s home after college graduation. Among those who answered that student loan debt is delaying their homeownership, 85 percent said that the debt is making it difficult to save for a down payment, 72 percent said it makes them reluctant to add more debt, and 52 percent said that because of their high debt-to-income ratio, they could not qualify for a mortgage.
What Are the Long-Term Consequences?
Understanding the range of reasons why homeownership rates have declined among young adults raises the question of potential long-term consequences for the economic outlook of the Millennial generation. According to the Urban Institute, those who lived with their parents between ages 25 and 34 are less likely both to form independent households and to become homeowners in the subsequent 10 years than those who moved out of their parents’ houses earlier in life (Choi et al. 2019). This suggests that the decision to delay forming households and becoming homeowners can have an impact on building future wealth. Two specific consequences demand further attention. First, families will have fewer resources available to access after retirement, potentially weakening the economic stability of future generations. Second, because homeownership and wealth transfer from parents to children, the homeownership disparities will continue to pass on to the next generation, reinforcing wealth inequality.
Lower Wealth at Retirement
Buying a home at a younger age leads to greater housing wealth when households reach their retirement age. Using the Panel Study of Income Dynamics, Choi and Goodman (2019) calculated individuals’ housing wealth at ages 60 and 61 by the age at which they first bought a home. They found that the age of first home purchase had a significant relationship with future housing wealth. Those who bought their first homes between ages 25 and 34 had the largest housing wealth by their 60s. At age 60 or 61, their median home equity (in 2015 inflation-adjusted dollars) was close to $150,000, while for those who bought after age 45 and over, the median home equity was approximately $44,000, substantially lower (Figure 10).
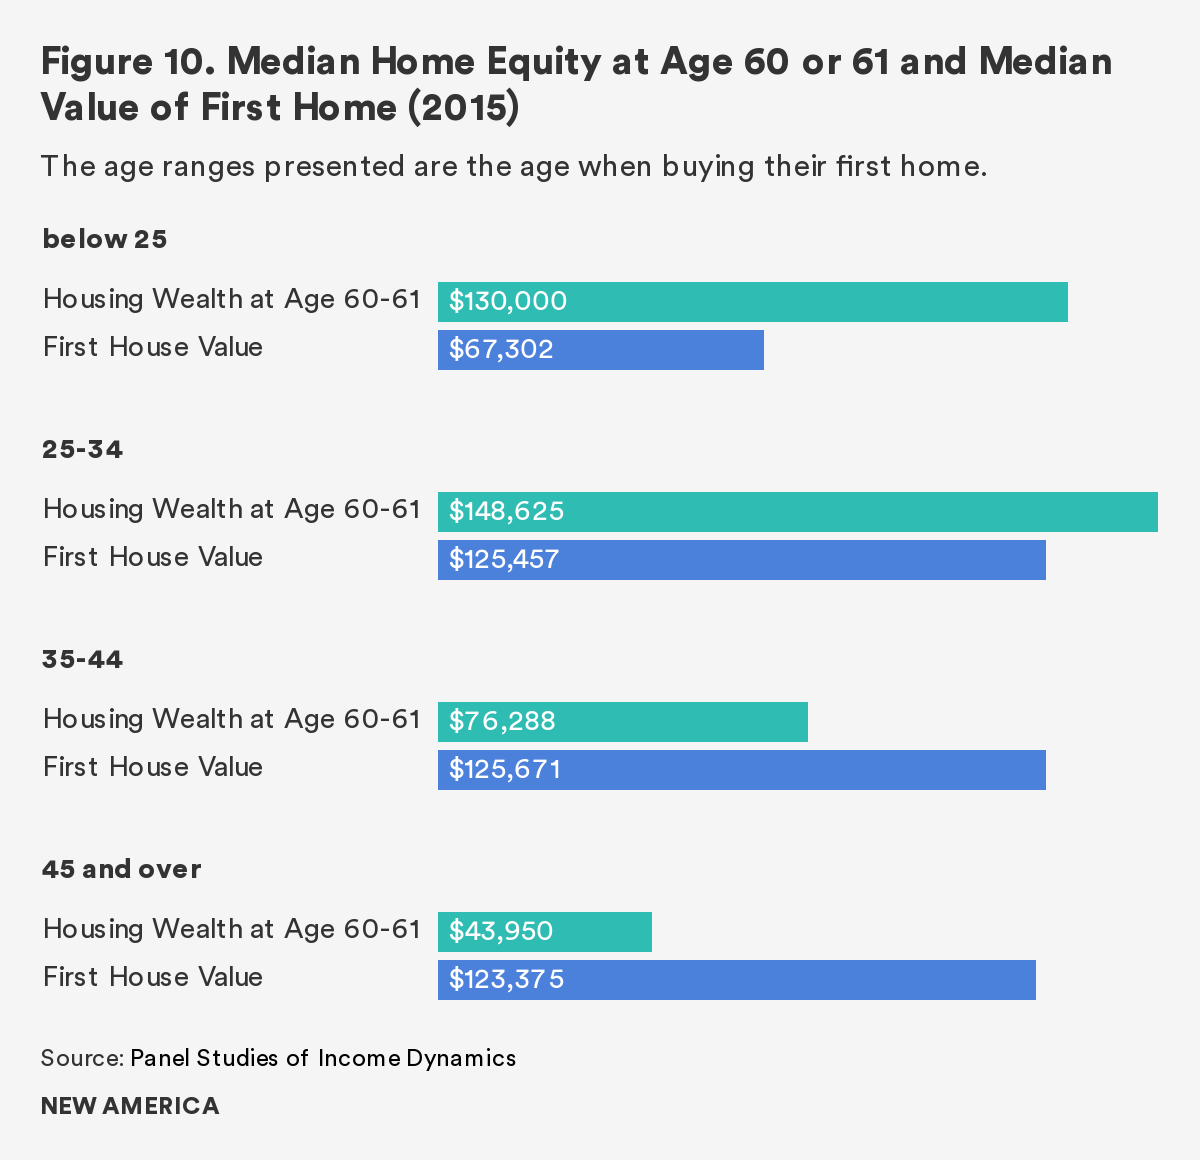
While those who bought homes before age 25 have slightly lower housing wealth3 than those who bought their houses between ages 25 and 34, these young home buyers have the greatest return for their initial investment. The ratio between the median home equity at age 60 or 61 and median price of the first home decreases with the first age of home buying—the ratio is highest for those who bought their first home before age 25 (1.93) and decreases with the age of buying a first home.
With the rise in income volatility (Dynan et al. 2012) and the increase in life expectancy, housing wealth may be a more important tool for Millennials to secure financial well-being later in life. Therefore, the real impact of Millennials’ delay in homeownership may become apparent only in the decades to come.
Intergenerational Wealth Inequality
Parental wealth and whether or not a parent is a homeowner are positively associated with a child’s likelihood of owning a home later in life. Growing up with a homeowner parent could help a young adult gain access to homeownership in many ways. For example, parents could provide young adults with the necessary information about the mortgage application process. Further, having acknowledged the benefits of homeownership from growing up with a homeowner parent, the young adults may have stronger motivation to obtain homeownership. Parental wealth can have a more direct impact on a young adult’s financial ability to own a home, especially in terms of down payment. Affluent parents can more easily cosign a loan when support is needed. Lee and coauthors (2018) find that parents’ financial transfers substantially increase a young adult’s likelihood of becoming a homeowner. Charles and Hurst (2002) find that differences in parents’ ability to offer down payment assistance to their children explain a significant proportion of the Black–White mortgage application gap among Millennials.
In line with prior studies, Choi et al. (2018b) find that the children of homeowners are 7 to 8 percentage points more likely to become homeowners than children of renters, all else equal. Furthermore, a 10 percent increase in parental wealth increases young adults’ likelihood of owning a home by 0.15 to 0.20 percentage points. The study finds that the difference in parental homeownership and wealth explains about 12 percent to 13 percent of the homeownership disparities between Black and White young adults. This suggests that if policies do not respond, the Millennial experience with homeownership will have long-term consequences and even exacerbate the existing racial wealth gap.
What Can We Do About It?
After bottoming out in 2016, Millennial homeownership rate rose slightly to 38.4 percent in 2017. Despite this rise, the rate is approximately 7–8 percentage points lower than the rate Gen-Xers and Baby Boomers had at the same age. The data confirm that Millennials are less likely to form independent households, and many live in their parents’ homes for a longer period. The share of Millennials living with their parents is about 10 percentage points higher than for earlier generations, and this share has increased consistently since 2005.
Demographics and lifestyle choices, including delayed marriage, have affected the housing choices of Millennials. However, it is likely that prevailing economic conditions and institutional barriers are also creating obstacles to a higher Millennial homeownership rate. Higher rents, mounting student loan debt, tighter credit, and a limited supply of affordable housing all have made it harder to form independent households and realize homeownership. Because the low homeownership rate can have a long-term effect on future wealth and exacerbate wealth inequality for the generations to come, several policy recommendations should be pursued to increase homeownership among the Millennial generation.
Enhance Financial Knowledge and Home Buying Awareness
Financial knowledge and homeownership are highly correlated. For example, Millennials who had correctly answered a greater number of financial literacy questions were more likely to be homeowners (Choi et al. 2018a). In response, some states, such as Alabama, Missouri, Tennessee, Utah, and Virginia, require high schools to include a financial literacy course in their educational curriculum.
While financial education as part of a high school curriculum is a long-term solution worth promoting, there is an immediate need to give Millennials information to increase their awareness about their home buying ability. While the majority of renters point out the lack of down payment as the most critical barrier to homeownership (Figure 10), many do not have correct information about the down payment requirement or the existence of assistance programs that can make acquiring a mortgage more affordable. For example, almost 40 percent of young renters think they need to put down more than 20 percent to buy a home, but the median down payment is actually 5–7 percent (Goodman et al. 2018). Also, with Federal Housing Administration (FHA) loans, borrowers’ down payments can be further reduced to well under 5 percent. Three-quarters of young adults are unaware of their option to take advantage of this public program (Fannie Mae, 2015). Additionally, many nonprofit organizations and state housing finance agencies provide down payment assistance directed at first-time home buyers. Over 75 percent of renters do not know about or are not very familiar with such programs.
To enhance Millennial homeownership, innovative approaches to raise home buying awareness and provide the requisite financial knowledge will be necessary. Since Millennials rely heavily on computers and mobile devices, providing accessible and engaging online games and training courses could be one possible approach.
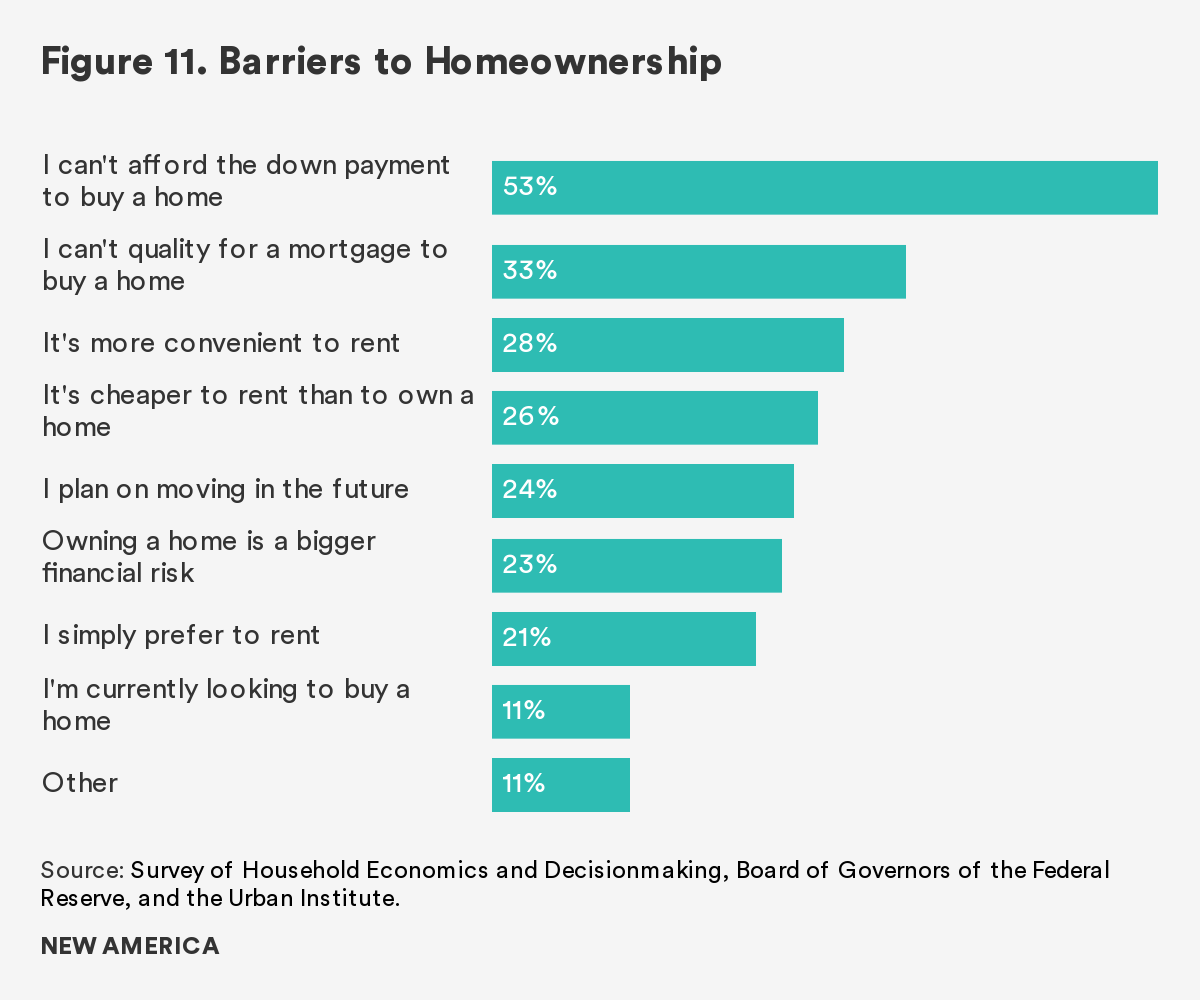
Use Technology to Simplify the Mortgage Process
Financial technology (FinTech) has the potential to streamline and increase the efficiency of the mortgage process. The current application process is extremely cumbersome, and lenders lack flexibility in working with borrowers. As a greater number of FinTech lenders enter the mortgage business, there are opportunities to identify more efficient mortgage origination and risk assessment systems, including using alternative data to evaluate a borrower’s creditworthiness. As the FinTech sector matures and offers services tailored to Millennials, a new channel to promote homeownership may be created.
Expand Credit Assessment Criteria
Mortgage applications underestimate many Millennials’ creditworthiness because they have not had time to build high credit scores. In fact, many do not even have FICO scores, the credit score used for mortgage approvals. If additional information, such as rental histories, cell phone and cable bills, and supplemental income, were included in mortgage underwriting, more Millennials would gain access to homeownership.
On-time rent payment is a good predictor of an on-time mortgage payment, as rental costs and mortgage payments are similar, in terms of amount and frequency of payment, for a comparable number of rooms (Zhu and Goodman 2018). Because most rental payments are captured in bank accounts, the information can be directly accessed from borrowers’ bank statements. Data on telecom, utility, and cable television payments could also be useful underwriting information.
In addition, Millennial income is often not fully captured during the mortgage application process. This is because current practice considers consistent income only for those who have worked in the same job or industry for two years. This doesn’t match the work experience of Millennials. For example, almost 40 percent of Millennials have a primary job with a W-2 but also earn additional income on the side (Choi et al., 2018a). Again, bank statements could help capture this supplemental income for young potential home buyers.
Ease Land-Use Restrictions to Promote Greater Supply
To increase the amount of affordable housing for Millennials to purchase, we need significant changes in land-use and zoning regulations. Since 1980, land-use and zoning cases have increased substantially and have increased land and construction costs (Ganong and Shoag 2017). As a result, developers are facing greater constraints to build, which have led to less construction and higher house prices.
Because zoning and land-use regulations are designed and implemented at the local level, executing a national-level policy will be challenging. States could provide financial incentives, e.g., reallocating housing subsidy dollars, to cities that reduce restrictions and regulation. Streamlining approval processes and allowing development by right are also possible solutions to promote greater housing supply and housing affordability. Acknowledging the problem, some localities have taken a bold approach to reform zoning and land-use regulations. For example, the city of Minneapolis recently eliminated all single-family zoning, allowing triplexes to be built anywhere in the city (Turner et al. 2019).
These four recommendations are not mutually exclusive and are not the only solutions that can help Millennials obtain homeownership or reduce homeownership disparities among young adults. Given the influence of the broader economy on housing outcomes, these recommendations need to be considered holistically in coordination with solutions in other sectors, including ways to improve the overall financial balance sheet of young adults. If earnings and savings fail to rise and debt loads remain high, future housing wealth will remain below what previous generations have experienced.
References
Dynan, Karen, Douglas Elmendorf, and Daniel Sichel. 2012. “The Evolution of Household Income Volatility.” Washington, DC: Brookings Institution.
Charles, Kerwin Kofi, and Erik Hurst. 2002. “The Transition to Home Ownership and the Black-White Wealth Gap.” Review of Economics and Statistics 84 (2): 281–97.
Choi, J. H., and Goodman, L. 2018. “Buy young, earn more: Buying a house before age 35 gives homeowners more bang for their buck.” Washington, DC: Urban Institute.
Choi, J. H., Zhu, J., and Goodman, L. 2018a. “The State of Millennial Homeownership.” Washington, DC: Urban Institute.
Choi, J. H., Zhu, J., and Goodman, L. 2018b. “Intergenerational Homeownership.” Washington, DC: Urban Institute.
Choi, J. H., Zhu, J., and Goodman, L. 2019. “Young Adults Living in Parents' Basements.” Washington, DC: Urban Institute.
Fannie Mae. 2014. “Fannie Mae National Housing Survey: What Younger Renters Want and the Financial Constraints They See.” Washington, DC: Fannie Mae.
Ganong, Peter, and Daniel W. Shoag. 2017. “Why Has Regional Income Convergence in the US Declined?” Journal of Urban Economics 102:76–90.
Goodman, Laurie, Alanna McCargo, Edward Golding, Bing Bai, Bhargavi Ganesh, and Sarah Strochak. 2018. “Barriers to Accessing Homeownership: Down Payment, Credit, and Affordability.” Washington, DC: Urban Institute.
Goodman, Laurie S., and Christopher Mayer. 2018. “Homeownership and the American Dream.” Journal of Economic Perspectives 32 (1): 31–58.
Kurz Christopher, Geng Li, and Daniel J. Vine. 2018. “Are Millennials Different?” Finance and Economics Discussion Series. Washington, DC: Federal Reserve Board, Divisions of Research & Statistics and Monetary Affairs.
Lee, Hyojung. 2018. “Are Millennials Coming to Town? The Determinants of Location Choice of Young Adults.” Urban Affairs Review 54 (5).
Mezza, Alvaro, Daniel R. Ringo, Shane M. Sherlund, and Kamila Sommer. 2017. “On the Effect of Student Loans on Access to Homeownership.” Washington, DC: Federal Reserve Board, Divisions of Research & Statistics and Monetary Affairs.
Salviati, Chris, and Rob Warnock. 2018. “2018 Millennial Homeownership Report: American Dream Delayed.” Apartment List.
Turner, Margery Austin, Solomon Greene, Corianne Payton Scally, Kathryn Reynolds, and Jung Choi. 2019. “What Would It Take to Ensure Quality, Affordable Housing for All in Communities of Opportunity?” Washington, DC: Urban Institute.
Zhu, J., & Goodman, L. 2018. “Rental Pay History Should be Used to Assess the Creditworthiness of Mortgage Borrowers.” Washington, DC: Urban Institute.
Citations
- Young adults living in group quarters, which includes college residence halls, residential treatment centers, skilled nursing facilities, group homes, military barracks, correctional facilities, and workers’ dormitories, are omitted from our analysis.
- Note that homeownership rate is calculated by dividing the number of owner-occupied households with the number of total households. The total number of households is the same as the total number of household heads. Millennials who do not form their independent households are not included in the homeownership calculation.
- Choi et al. (2019) find that the youngest buyers have lower incomes, are less educated, and therefore buy lower-priced homes, but are able to receive the greatest return compared to the initial size of investment.
Part 3: Implications for Social Policy
Part 3 includes:
- Public Policy Implications of the Millennial Wealth Gap by Liz Hipple
- Addressing the $1.5 Trillion in Federal Student Loan Debt by Ben Miller, Colleen Campbell, Brent J. Cohen, and Charlotte Hancock
- Policy Responses to the Millennial Wealth Gap: Repairing the Balance Sheet and Creating New Pathways to Progress by Reid Cramer
Public Policy Implications of the Millennial Wealth Gap
Liz Hipple
A broad array of social science research—presented in this volume and elsewhere—presents a clear but troubling picture of the economic state of the Millennial generation. Young adults in America today have not achieved the same financial milestones as recent past generations. Whether measured in terms of income, assets, or net worth, Millennials are behind. If they were likely to catch up, public policy could perhaps stay agnostic. But given the combination of an economy characterized by depressed wages and shrinking benefits with a rising student debt burden, it seems more likely that their window for economic mobility is in danger of prematurely closing and public policy should respond.
The Millennial wealth gap should garner the increased attention of policymakers for a number of reasons, but especially because it is happening alongside trends of declining intergenerational mobility and rising economic inequality. These developments are interrelated and together have long-term consequences that will not only exacerbate existing racial and economic disparities but also limit the human capital development of future generations, which in turn has negative implications for future economic growth.
Recently, popular press attention has focused on the challenges Millennials face in the economy and their evolving relationship to the traditional markers of adulthood.1 For instance, marriage, child rearing, and homeownership rates among 25- to 34-year-olds today lag behind those of the previous generation.2 These are not merely the preferred reordering of life milestones established by their parents and grandparents. Rather, these are visible symptoms of the decline in intergenerational mobility, driven by the lack of financial resources among today’s young adults. Since today’s disadvantages accumulate over time and are passed down to future generations, it is essential for young families with children to be able to access economic resources to invest in their children’s development. The presence or absence of money in a household has huge implications for children’s later-in-life outcomes.
In a recent report, “Are today’s inequalities limiting tomorrow’s opportunities?” my co-author, Elisabeth Jacobs, and I document the accumulating social science research that attests to the relationship between a family’s economic resources and a child’s subsequent outcomes. We further explore the role of parents’ economic resources in the development of children’s human capital, and how economic inequality is undermining not only the development of that potential, but also children’s ability to fully and effectively deploy that human potential, thereby depressing their future upward mobility.3 While the report presents a thorough analysis of research to date, our findings in each of these areas establish a strong foundation for a significant public policy response.
Intergenerational Mobility
It may be helpful to begin by reviewing recent findings about intergenerational mobility in America, as declining mobility is the backdrop against which the emerging generational wealth gap is playing out.
Intergenerational mobility is the relationship between a parent’s and a child’s economic position. It’s an important metric of economic well-being because it indicates whether economic outcomes reflect individual merit and hard work, or whether parental advantage (or disadvantage) dictates outcomes. It’s also a meaningful indicator of whether or not there’s been economic growth, and if that growth has been equitably distributed. If growth has been stagnant, it can tell us if any gains have accrued disproportionately to a small group. Unfortunately, recent and compelling research has found that mobility in the U.S. has been declining. While more than 90 percent of children born in 1940 grew up to earn more than their parents did at age 30, the same could be said at the same age for only about 50 percent of children born in 1984, according to economist Raj Chetty and his co-authors,4 as illustrated in Figure 1.
Figure 1. Intergenerational Mobility.
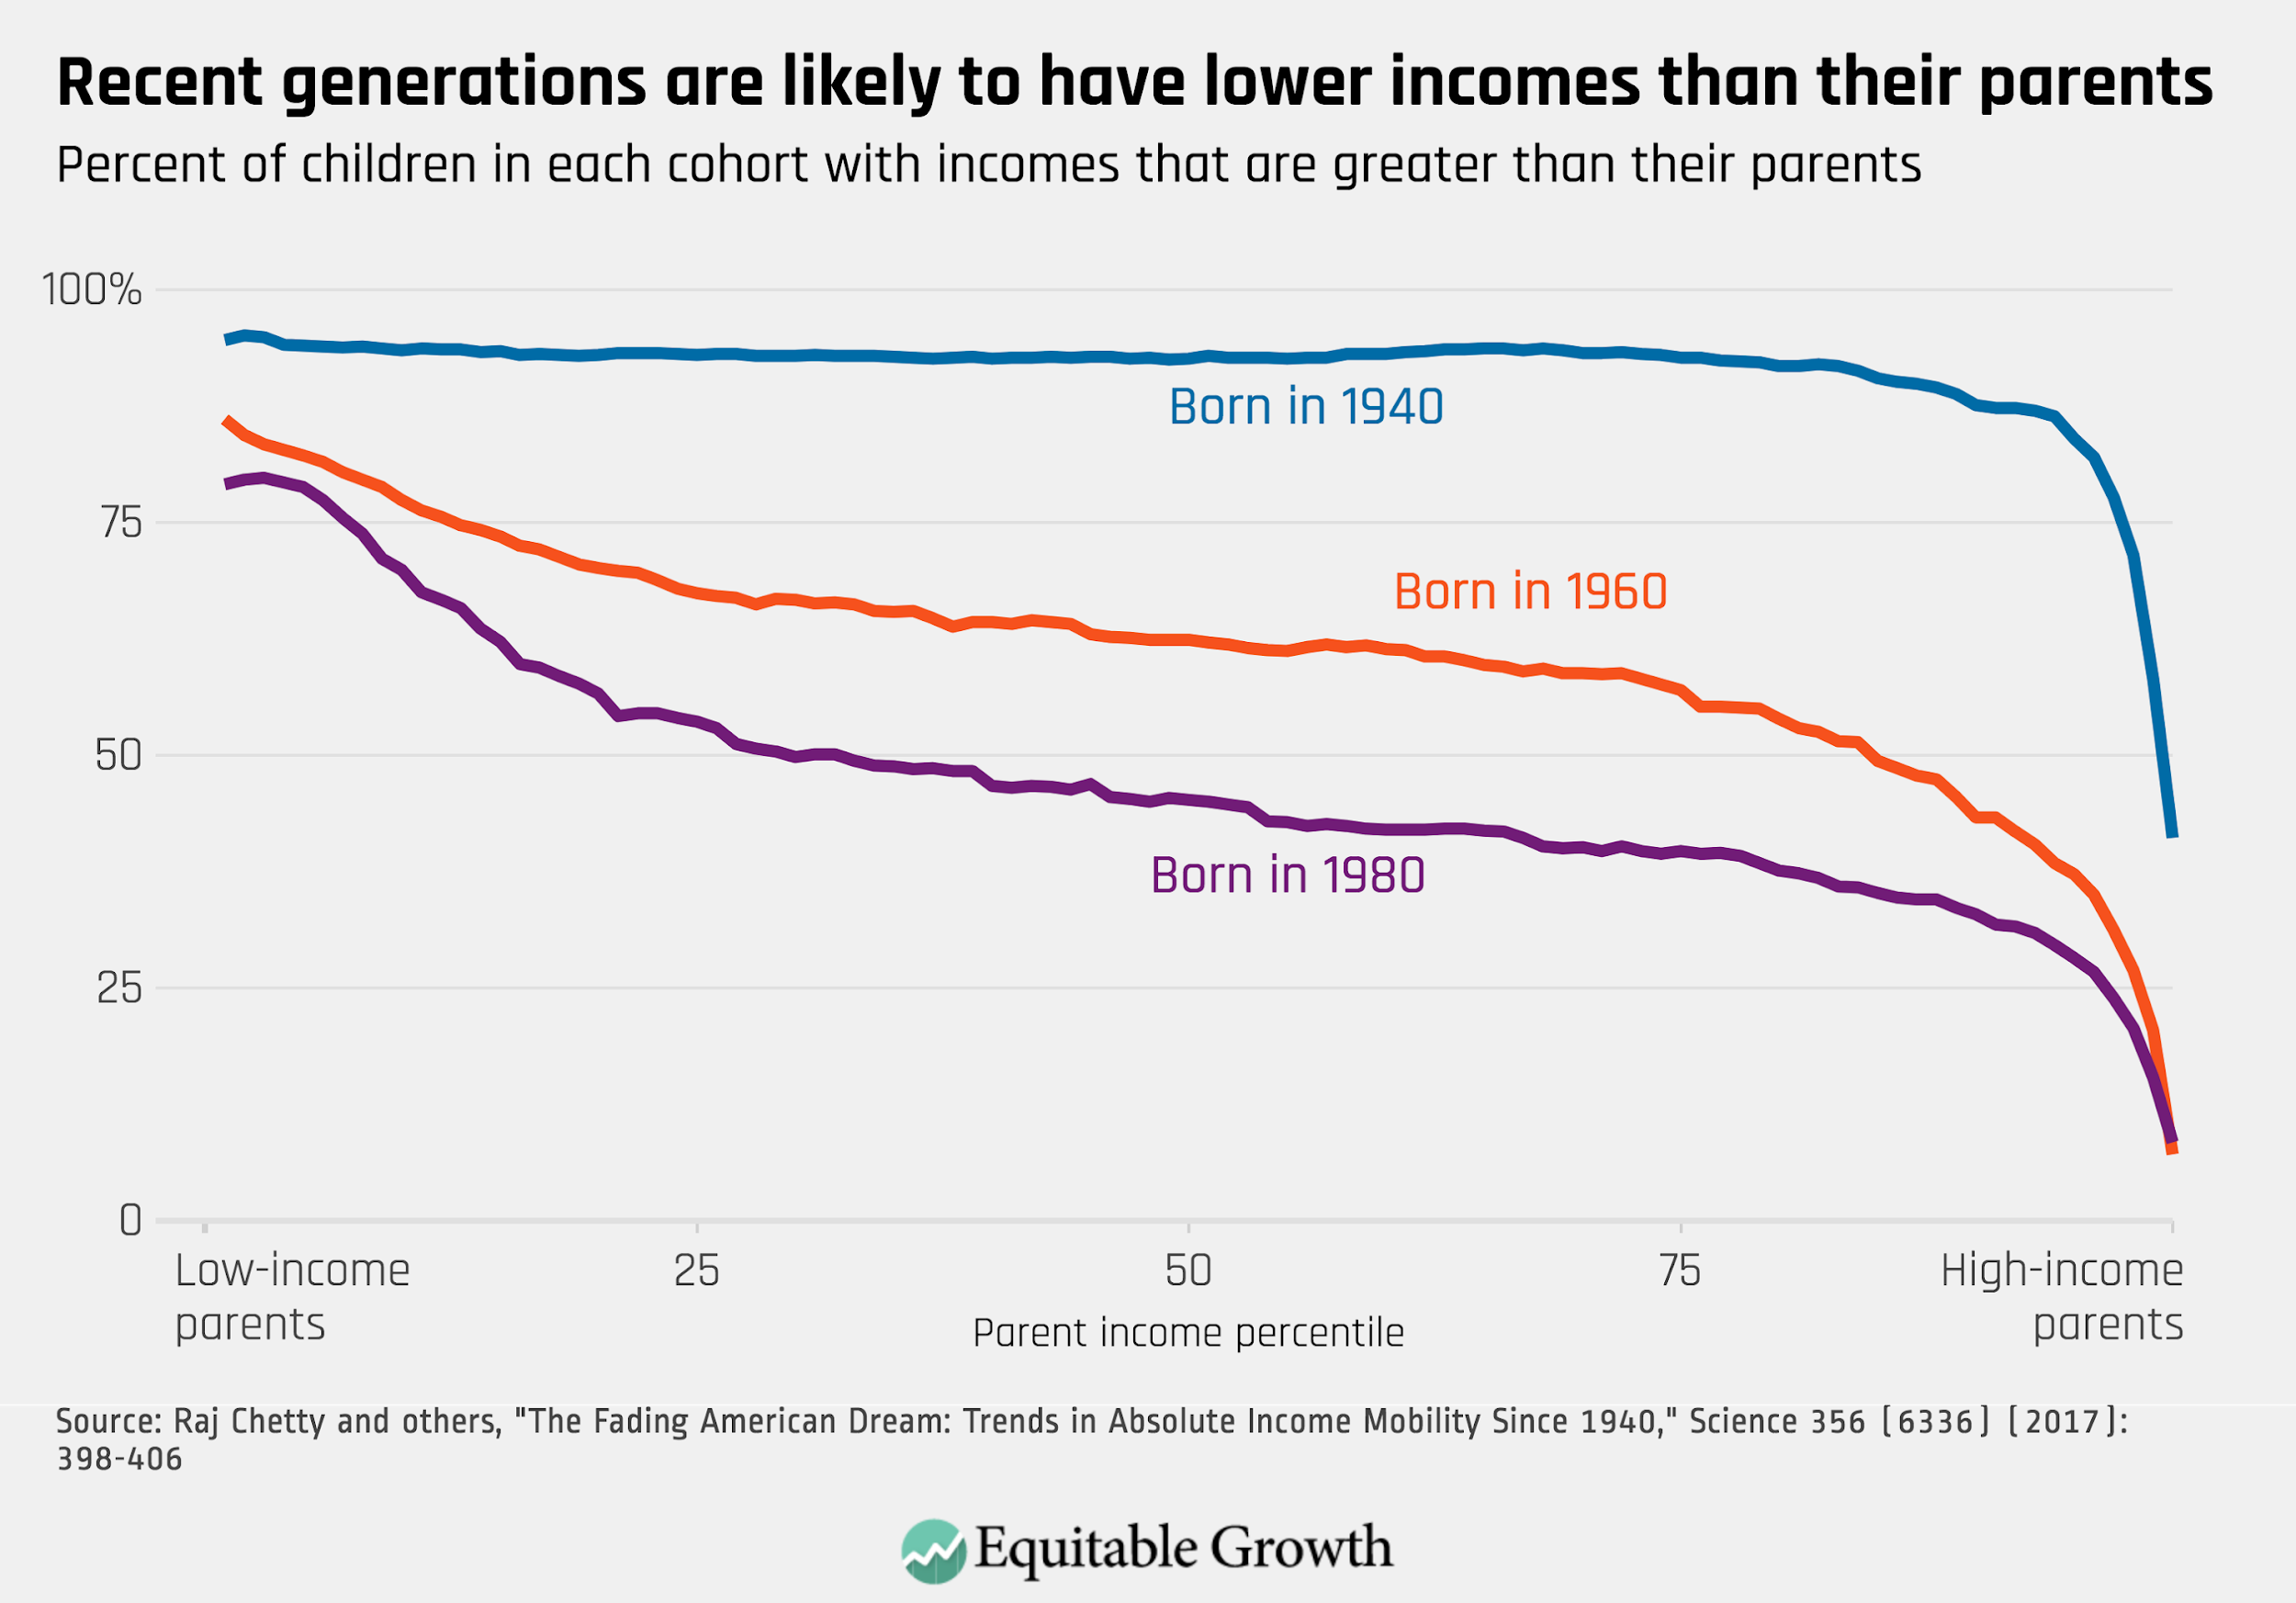
Furthermore, mobility differs significantly between different racial and ethnic groups in the United States, with black Americans in particular experiencing unusually high rates of downward mobility and low rates of upward mobility. For example, black children born into the bottom household income quintile (the lowest 20 percent ranked by income) have a 2.5 percent chance of going on to be in the top income quintile as adults, whereas white children of the same economic status have a 10.6 percent chance. And while white children born into the top income quintile are almost five times as likely to still be in the top income quintile as adults as they are to fall to the bottom, black children born to parents in the top income quintile are just as likely to fall to the very bottom as they are to stay at the top.5
Despite the prevalence of explanations for these differences that emphasize factors that supposedly represent individual choices or hard work—such as marriage patterns or educational attainment—Chetty and his co-authors find that differences in family characteristics, including wealth, explain very little of this gap in intergenerational mobility for black and white Americans. In other words, all else equal, these findings of mobility outcomes indicate that racial discrimination clearly plays a role in explaining why these differences persist.
In our full paper, Jacobs and I explore more of the facts and statistics on intergenerational mobility in the United States, including how it has changed over time and manifests in different places and geographies. For the purposes of this discussion, though, the key takeaways to keep in mind are that the decline in mobility from the 1940 to the 1980 cohort means that young adults today are entering adulthood with lower earnings than previous generations. Consequently, they have less to save from. Additionally, the opportunity to save and build wealth in America is distributed differentially depending on your race and ethnicity. This should be the context for any policy discussion of the Millennial wealth gap.
Economic Inequality and Wealth Gaps Limits the Development and the Deployment of Human Potential
A large body of research indicates that in the U.S. the extent of economic resources at a family’s disposal impacts their children’s economic outcomes later in life. To give just one example, research has found that even just $1,000 in additional income from the EITC increases a host of positive indicators, including higher reading and math scores; increased probability of high school graduation, college completion, and employment; and increased earnings.6 While this example uses income, rather than wealth, as the measured financial resource, it demonstrates the importance of financial resources today on outcomes tomorrow.
To understand the connection between parental economic resources and children’s adult outcomes—and how economic inequality could be intermediating that relationship—Jacobs and I developed a framework for making sense of the channels linking the two concepts. One of those channels is the development of human potential. On a fundamental level, every individual is born with a certain amount of human potential, but the opportunity to develop that potential to its fullest varies dramatically based on the circumstances of family, community, institutional factors, and myriad other structural constraints. These inequalities of opportunity are often compounded across multiple realms, with major lines of research demonstrating the links between inequality and access to health, parental investments of time and money in their children, and the quality of early childhood education, as well primary and secondary schooling—all of which are critical pathways for the development of the human potential necessary for upward mobility.
As families have fewer resources to invest in their children today, the consequences of the Millennial wealth gap will extend into the generations of tomorrow. This dynamic has already been apparent in the relationship between wealth, educational opportunities, and the realization of long-term human potential. A case in point is the unfortunate reality that in the United States, buying a home in a “good” school district is often the single biggest way a parent invests in their child’s human capital development. In this process, it is wealth, rather than income, that is the means through which the home is purchased, making it especially consequential in determining the future outcomes of the next generation.
This dynamic reflects how the Millennial wealth gap risks exacerbating existing economic and racial inequalities. If, as explained in the chapter by William Emmons, Ana Kent, and Lowell Ricketts, Millennials have lower than expected wealth by a certain age, then it will be more difficult to self-finance a first home purchase. Those who can tap down payment assistance from their parents are at a distinct advantage. Winning the birth lottery takes on a whole new significance, as only those lucky enough to be born into families with enough wealth to be able to pass it along can get their own start in the wealth accumulation process.
It also means that policies that have historically and systemically blocked black Americans from building wealth continue to have consequences that reverberate today for black Millennials. For example, federal redlining7 denied black Americans access to traditional mortgages and therefore forced them into contract buying,8 which did not build equity. This means that racist policies that prevented the purchase of a house by grandparents or parents 50 years ago continue to have an impact. Not only is there less wealth to transfer directly, there is less wealth to invest in their children’s human capital development, whether it is through supporting education or jump-starting wealth building through the purchase of a home. Indeed, while 34 percent of white adult children receive financial support from their parents for higher education and 12 percent for homeownership, the same is true for only 14 percent and 2 percent of black adult children, respectively.9 Discrimination in the past, reflected in the racial wealth gap, continues to reverberate today and into the future.
But even if there were true equality of opportunity to fully develop one’s human potential, the development of human potential is insufficient on its own if individuals are not able to fully deploy their talents. And family economic resources—particularly wealth—also play a vital role in young adults’ ability to fully deploy their potential. For example, in addition to the relevance of parental resources for attendance and completion of postsecondary education, wealth can shape how an individual is able to get the most out of a college education and make use of that investment. Family wealth may provide an insurance function, allowing those with greater access to the cushion of family assets (and the absence of debt) to take risks that ultimately pay off with greater rewards. As sociologists Fabian Pfeffer of the University of Michigan and Martin Hällsten of Stockholm University explain:
[C]hildren who are able to fall back on their parents’ wealth when, for example, they drop out of college or experience a prolonged school-to-work transition period, or have early episodes of unemployment, are more likely to opt for long-term human capital investments, such as college attendance, or choose particularly competitive or protracted career paths that they may be able to sustain even in the face of early set-backs.10
These findings show that wealth may shape the behavioral choices of the next generation, thereby shaping opportunity by providing some with a soft cushion for a slip down the economic ladder and others with no cushion at all. Indeed, economist Greg Kaplan finds that the ability to live with one’s parents allows young people to search longer for jobs that have better prospects for future earnings growth, increasing their chances of upward mobility and of successfully beginning to build wealth of their own.11
Another roadblock to Millennials’ ability to fully deploy their human potential is the structural changes in the labor market over the past 30 years, which have depressed wages and thereby delayed wealth building. For example, young adults who replicate their parents’ educational and occupational backgrounds and end up in the same type of work and in the same relative place in the economic distribution earn less in inflation-adjusted terms than their parents did a generation ago.12 There are a number of reasons for these changes, including the fissuring of the workplace and the decline in job ladders, which we consider in depth elsewhere.13 What is relevant here is that these structural changes, coupled with the fact that Millennials entered the labor market during the Great Recession, threaten to cause long-term and persistent negative effects for Millennials’ earning potential, which will further weaken their ability to build wealth down the road.14
Policy Implications
Policymakers need to take these structural changes into account—and acknowledge this history of discrimination—as they craft future public policies to promote wealth building. Traditionally, the pillars of wealth building in America have been grounded in being able to access education, skills, and training; secure steady employment; increase ownership of assets over time; and receive family gifts, transfers, and inheritances. We’ve seen how these pathways are not open to everyone, and how the current cohort of young adults is faring poorly. For Millennials, education and skills have increased, but steady employment has gotten more precarious, especially for those who graduated into the Great Recession, which limits the income with which to increase ownership of assets over time. This leaves the fourth pillar—the receipt of family transfers—to take on a larger and increasingly disproportionate role in future wealth accumulation.
It is a problem for our democracy and our economy if family wealth determines long-term child outcomes. If the cushion of family assets (and the absence of debt) allows young adults to disproportionately take risks that can ultimately pay off with greater rewards, then those without such assets are needlessly disadvantaged. This creates a feedback mechanism in which privilege begets privilege. To prevent such a scenario from gaining momentum, policymakers must work to level the playing field. In doing so, they should push beyond solutions that emphasize merely equalizing access to activities that support human capital development, such as education and skills attainment. As we have seen, the development of human potential is insufficient on its own to address the forces depressing economic mobility and opportunities for wealth accumulation. Rather, policymakers must grapple with ways to remove the roadblocks young adults face when they seek to deploy their potential in the economy.
A forward-looking policy agenda should be grounded in a recognition that the structure of the U.S. labor market has changed in ways that fundamentally thwart upward mobility. Wage stagnation, fissuring of the workplace, and a decline in job ladders depress workers’ earning power. Discrimination, particularly racial discrimination, persists in ways that run afoul of basic principles of equity, disempowering some workers and advantaging others. Growing inequalities in household balance sheets shape behavior and risk preferences, allowing those born into wealth to accumulate additional advantages over a lifetime while those who enter the labor market further down the economic ladder face limited pathways upward.
None of these dynamics are inherently natural. Many have the potential to be fundamentally reshaped by policy. Familial advantage—or disadvantage—can be passed along to children in multiple ways. While this might seem daunting to policymakers contemplating solutions, it also means that there are multiple angles from which to tackle the problem. There will be no silver bullet or quick fixes, but the emerging Millennial wealth gap is too large to ignore. Instead, there should be a concerted effort to develop and implement policies to ensure that access to opportunity is truly equitable. Our collective goal should be to ensure that all members of our society are able to fully deploy their potential. To do so requires that wealth is not passed along mechanically from generation to generation, but that our collective resources support an economy where the human capital, innovation, and dynamic economic growth are unleashed rather than left by the wayside.
Citations
- Roni Caryn Rabin, “Put a Ring on It? Millennial Couples Are in No Hurry,” The New York Times, May 29, 2018. source
- Andrew J. Cherlin, The Marriage-Go-Round: The State of Marriage and the Family in America Today (New York: Vintage, 2010); Andrew J. Cherlin, Elizabeth Talbert, and Suzumi Yasutake, “Changing Fertility Regimes and the Transition to Adulthood: Evidence from a Recent Cohort” (Baltimore, MD: Johns Hopkins University, 2014); Andrew J. Cherlin, Labor’s Love Lost: The Rise and Fall of the Working-Class Family in America (New York: Russell Sage Foundation, 2014); Jung Hyun Choi et al., “Millennial Homeownership” (Washington: Urban Institute, 2018).
- Elisabeth Jacobs and Liz Hipple, “Are Today’s Inequalities Limiting Tomorrow’s Opportunities?: A Review of the Social Sciences Literature on Economic Inequality and Intergenerational Mobility” (Washington, DC: Washington Center for Equitable Growth, October 2018). source
- Raj Chetty et al., “The Fading American Dream: Trends in Absolute Income Mobility since 1940,” Science 356(6336) (April 28, 2017): 398–406. source
- Raj Chetty et al., “Race and Economic Opportunity in the United States: An Intergenerational Perspective,” Working Paper (National Bureau of Economic Research, March 2018). source
- Jacob Bastian and Katherine Michelmore, “The Long-Term Impact of the Earned Income Tax Credit on Children’s Education and Employment Outcomes,” Journal of Labor Economics 36(14) (October 2018); Gordon B. Dahl and Lance Lochner, “The Impact of Family Income on Child Achievement: Evidence from the Earned Income Tax Credit,” American Economic Review 102(5) (August 2012): 1927–56.
- Richard Rothstein, The Color of Law: A Forgotten History of How Our Government Segregated America (Liveright, 2017).
- “The Plunder of Black Wealth in Chicago: New Findings on the Lasting Toll of Predatory Housing Contracts” (Samuel DuBois Cook Center on Social Equity at Duke University, May 2019), source
- Yunju Nam et al., “Bootstraps Are for Black Kids: Race, Wealth, and the Impact of Intergenerational Transfers on Adult Outcomes” (Oakland, CA: Insight Center for Community Economic Development, September 2015), source
- Fabian T. Pfeffer and Martin Hällsten, “Mobility Regimes and Parental Wealth: The United States, Germany, and Sweden in Comparison,” Working Paper, SOEP Papers on Multidisciplinary Panel Data Research (Berlin, Germany: Deutsches Institut für Wirtschaftsforschung (DIW), 2012).
- Greg Kaplan, “Moving Back Home: Insurance against Labor Market Risk,” Journal of Political Economy 120(3) (June 2012): 446–512, source
- Barry Bluestone and Bennett Harrison, The Great U-Turn: Corporate Restructuring and the Polarizing of America (Basic Books, 1990); Arne L. Kalleberg, Good Jobs, Bad Jobs: The Rise of Polarized and Precarious Employment Systems in the United States, 1970s to 2000s (New York, NY: Russell Sage Foundation, 2011).
- Elisabeth Jacobs and Liz Hipple, “Are Today’s Inequalities Limiting Tomorrow’s Opportunities?: A Review of the Social Sciences Literature on Economic Inequality and Intergenerational Mobility” (Washington, DC: Washington Center for Equitable Growth, October 2018).
- There’s copious economic research into the negative and persistent effect on earnings of those who enter the labor market during a recession. For some examples see: Jesse Rothstein, “The Lost Generation? Scarring after the Great Recession,” January 2019, source ; Philip Oreopoulos, Till von Wachter, and Andrew Heisz, “The Short- and Long-Term Career Effects of Graduating in a Recession,” American Economic Journal: Applied Economics 4, no. 1 (January 2012): 1–29, source; Giuseppe Moscarini and Fabien Postel-Vinay, “Did the Job Ladder Fail after the Great Recession?,” Journal of Labor Economics 34(S1) (Part 2) (January 2016): S55–93, source
Addressing the $1.5 Trillion in Federal Student Loan Debt
Ben Miller, Colleen Campbell, Brent J. Cohen, and Charlotte Hancock
About 43 million adult Americans—roughly one-sixth of the U.S. population older than age 18—currently carry a federal student loan. Collectively, they owe $1.5 trillion in federal student loan debt. Additionally, there is an estimated $119 billion in outstanding student loans from private sources that are not backed by the government.1 This debt burden fails disproportionately on the backs of young adults, as approximately one-third of people ages 25 to 34 hold a student loan.2 And while it is true that not every student borrower is in distress, student debt is an issue that both has a tangible effect on many borrowers’ lives and raises broader concerns for the overall economy. It affects us all.
Though Millennials are just as educated as Generation X—and hold just as much student loan debt—their work careers have been marred by the Great Recession.3 As the job market retracted, it became more difficult for Millennials to jump-start their economic futures.4 Consequently, Millennials have felt the crunch of student loan debt more acutely than other generations, and this has sparked interest in bold ideas to address the twin issues of college affordability and outstanding student debt.
As a policy response to rising tuition costs, the Center for American Progress has proposed Beyond Tuition, a plan that moves toward debt-free higher education.5 Under the plan, families pay no more than what they can reasonably afford out of pocket, with additional expenses covered by a combination of federal, state, and institutional dollars. Tackling affordability challenges for tomorrow’s students is an essential task for public policy to address, but it should be paired with new ideas to provide relief to current borrowers. A number of different approaches for addressing the high level of federal student loan debt should be considered.
Designing an effective policy response requires understanding the different ways outstanding student loan balances impact different types of borrowers, since stress points to repay vary depending on individual characteristics. For example, two-thirds of those who default on their student loans are borrowers who either did not finish college or earned only a certificate.6 At 45 percent, the average default rate for these individuals is three times higher than the rate of all other borrowers combined.7 While defaults are clearly impacted by whether or not a borrower completes a degree, the size of the outstanding balance appears to exert less influence, as reflected in the relatively low amount of debt owed by the typical defaulter, which is $9,625.8
By contrast, borrowers who completed a degree, especially at the graduate level, are less likely to default but may still face struggles related to repayment. For instance, the U.S. Department of Education projects that just 6 percent of the dollars lent to graduate students ultimately go into default, compared with 13 percent of funds lent to college juniors and seniors or a quarter of loans for students in their first or second year at a four-year institution.9 However, graduate borrowers face a different set of challenges related to having higher debt burdens. More than one-third of borrowers who owe $40,000 or more—an amount of debt that only graduate students or independent undergraduates can obtain in principal—are paying their loans back on a repayment plan that ties their monthly payments to their income, suggesting that their student loan debt otherwise represents too large a share of their income. If borrowers fail to stay on the plan or if their payments do not fully satisfy outstanding interest, they can accumulate large amounts of additional interest.
Broad breakdowns of borrowers by debt level and attainment status can also mask particular challenges related to equity. For instance, Black or African American students who earned a bachelor’s degree had a default rate nearly four times higher than their similarly situated White peers.10 Students who are veterans, parents, or first-generation college students, or have low incomes, are likely to face higher risk of default.11
Given this landscape, this chapter considers different options for addressing the $1.5 trillion in outstanding federal student loan debt. These solutions are meant to be independent of broader loan reforms, such as giving relief to borrowers whose schools took advantage of them. These options also presume keeping and preserving key existing benefits, such as Public Service Loan Forgiveness (PSLF).
Specifically, four options to tackle federal student loan debt are considered:
- Forgive all federal student loan debt.
- Forgive up to a set dollar amount for all borrowers.
- Reform repayment options to tackle excessive interest growth and provide quicker paths to forgiveness.
- Change repayment options to provide more timely forgiveness.
Understanding the potential implications of each of these policies can provide policymakers with a clearer sense of the different ways to address the nation’s $1.5 trillion in outstanding student debt
Policy Goals for Helping Current Borrowers
Rather than endorsing a specific approach here, our hope is that policymakers and the public can examine the trade-offs and merits of each proposal, especially by considering a range of policy goals, including equity, simplicity, extent of impact, and providing a meaningful level of relief.
Prioritize Equity
The worries and challenges facing student loan borrowers are not uniform. For some, a student loan represents a significant risk of delinquency and default. Such an outcome can be catastrophic—ruined credit; garnished wages and Social Security benefits; seized tax refunds; denial of occupational and driver’s licenses; and the inability to reenroll in college.12 For other borrowers, student debt constrains or delays their ability to access and sustain the most basic markers of the middle class, such as saving for retirement and purchasing a home, which can, in turn, increase wealth. Student loan debt may also deter family formation, as couples may be concerned about covering the additional expense of having a child.
Individual circumstances vary, and repayment hardship can be different even for borrowers who otherwise have the same levels of educational attainment and/or income. This can be due to other factors, such as the presence or absence of familial wealth or discrimination in housing or employment. It is crucial, therefore, that any policy aimed at current student loan borrowers include an equity lens to acknowledge and address these differences. The continued unaffordability of higher education has forced too many students into debt that a rational financing system would support only with grant aid. An equity lens should consider the following groups of borrowers and be used to assess how well a given proposal would serve them:
- Borrowers who do not complete college. About half of all individuals who default on their student loans never earned a college credential.13 These individuals typically owe relatively small balances, with about 64 percent owing less than $10,000 and 35 percent owing less than $5,000.14 While the exact reason these borrowers struggle is unknown, a likely explanation is that they did not receive a sufficient earnings boost to pay off their debt, meaning they have all of the expense and none of the reward of attending college.
- Black or African American borrowers. Research shows that the typical Black or African American borrower had made no progress paying down their loans within 12 years of entering college, and nearly half had defaulted. This inequity persists even among those who earned a bachelor’s degree, with Blacks and African Americans defaulting at a rate four times higher than their White peers.15
- Borrowers who have dependents. Student-parents make up 27 percent of all undergraduates who default on their federal loans.16 What’s worse, roughly two-thirds of student-parents who default are single parents, meaning that the negative repercussions of default have the potential to weigh more heavily on borrowers’ children.
- Pell Grant recipients. More than 80 percent of Pell Grant recipients come from families who earn $40,000 annually or less.17 Pell Grant recipients constitute an exceptionally high share of defaulted borrowers. Roughly 90 percent of individuals who default within 12 years of enrolling in college received a Pell Grant at some point.18 And Pell Grant recipients who earned a bachelor’s degree still have a default rate three times higher than that of students who never received a Pell Grant.19
There is significant overlap among these populations. For example, nearly 60 percent of Black or African American students also received a Pell Grant, as did almost half of Hispanic or Latinx students.20 Similarly, about 60 percent of students who are single parents received a Pell Grant, and about 30 percent of single-parent students are Black or African American—versus 15 percent of all students.21 The result is that a policy specifically aimed at one population—such as relief for Pell recipients—will also affect many but not all of the individuals in these other groups.
Ensure Simplicity
Too often, public policy may seem effective in the abstract but ineffective in reality if its implementation is too complex. Public Service Loan Forgiveness is a prime example. The basic idea of forgiving federal student loans for individuals who work a decade in a public service job is easy to communicate. But when overlaid with four gating criteria—qualifying loans, employment, repayment plans, and payments—the policy has led to borrower frustration and lost benefits.22
Therefore, a successful policy for current borrowers should be clear and simple, both in its message and in its execution. That means striving, wherever possible, for approaches—such as automatic enrollment or reenrollment—which ensure that government employees and contractors, not borrowers, shoulder the complexity of a policy’s implementation.
Aim for Broad Impact
Reaching as many people as possible can help build support for an idea. Striving for a broad impact interrelates with simplicity. For example, broader eligibility definitions that reach more people could result in less work to figure out who should be eligible for relief. Additionally, aiming for broader impact increases the chances of capturing the people who desperately need relief but whose situation may not be as clear from just a look at their income, educational attainment, or other easily measurable characteristics.
Provide Meaningful Relief
Student debt is not just an abstraction that lives on a spreadsheet. For borrowers in debt, a loan can feel like an unending, stressful obligation with no relief in sight. For this reason, an effective policy will provide a meaningful level of relief. It is important for borrowers to see and feel actual relief under any program solution for current student debt. In some cases, this might entail addressing potential unintended consequences. As an example, income-driven repayment (IDR) may solve unaffordable monthly payments by aligning borrowers’ payments with how much money they earn. However, because interest keeps accumulating, borrowers who make smaller payments on these plans may watch their balances grow—leaving them with the sense of digging a deeper hole, even if forgiveness is an option.
Four Policy Options to Assist Existing Student Loan Borrowers
Rather than recommending a specific proposed option, we offer a combination of both commonly proposed ideas and new ones generated by the staff at the Center for American Progress and Generation Progress.
These options are intended to be one-time solutions that could pair with a larger plan for ensuring affordability going forward, such as CAP’s Beyond Tuition. Combining a prospective affordability plan with this relief should cut down on the number of future loan borrowers and lessen the need for subsequent large-scale relief policies.
Option 1. Forgive All Federal Student Loan Debt
The federal government would forgive all outstanding federal student loans, and waive the taxation of any forgiven amounts.
Estimated cost: $1.5 trillion in cancellation plus an unknown amount of anticipated interest payments, both of which would be adjusted by whether the Education Department already expected them to be repaid. For example, a $10,000 loan that the agency did not expect to be repaid at all would not cost $10,000 in forgiven principal. There would also be costs associated with not taxing forgiven amounts, which also must be part of the policy.
Estimated effects: It would eliminate debt for all 43 million federal student loan borrowers.23
Does it address equity? Forgiving all debt would get rid of loans for all the populations identified in the equity goal described above. It will also end up providing relief to some individuals who are otherwise not struggling or constrained by their loans.
How simple is it from a borrower standpoint? This policy should be easy to implement for borrowers, since it should not require any opting in or paperwork.
How broad is its impact? This policy would help all 43 million federal student loan borrowers.
Will it feel like relief? Yes—borrowers will not have to make any payments, so they will feel the change.
Who are the greatest beneficiaries? From a dollar standpoint, the highest-balance borrowers have the most to gain from this proposal—especially those who also have higher salaries. They would experience the greatest relief in terms of reduction of monthly payments while also having the wages to otherwise pay back the debt. This is because undergraduate borrowing is capped in law at $31,000 or $57,500, depending on if they are a dependent or independent student, whereas there is no limit on borrowing for graduate school.24 Those who have higher incomes would also feel larger benefits by freeing up more of their earnings to put toward other purposes. Therefore, those with debt from graduate education, especially for high-paying professions such as doctors, lawyers, and business, would significantly benefit.
What is the biggest advantage? The policy is universal, and it could be implemented without the need of action on the part of borrowers as long as there are no tax implications for forgiveness.
What is the biggest challenge? This option carries the largest price tag by far. It also would result in forgiving a substantial amount of loan debt of individuals who have the means to repay their debt. This includes borrowers with graduate degrees and potentially high salaries.
How could this option be made more targeted? Limiting forgiveness to only undergraduate loans would help target the plan’s benefits, because there are many graduate students studying in fields linked to high incomes who have no undergraduate loan debt.25 The Education Department unfortunately does not provide a breakdown of the amount of outstanding undergraduate student loan debt; thus, it is not possible to know the cost of this policy revision.
Option 2. Forgive Up to a Set Dollar Amount for All Borrowers
The federal government forgives the lesser of a borrower’s student loan balance or a set dollar amount, such as $10,000, $25,000, $50,000, or some other amount. The proposal would include waiving any required taxes on the forgiven amounts. Doing so provides a universal benefit which ensures that loan debt will be completely wiped away for borrowers who have a balance below the specified level, while those with higher debts also get some relief.
Estimated cost: The total cost varies depending on the dollar level chosen. For example, forgiveness of up to $40,000 for all borrowers would result in canceling $901.2 billion, while forgiveness of up to $10,000 would cancel $370.5 billion. Both cases would also have additional costs in the form of expected future interest payments, but it is not possible to calculate this amount with current Education Department data. These amounts would be adjusted by the Education Department’s existing expectations around which loans would be repaid. Finally, there would be costs associated with not taxing forgiven amounts.
Estimated effects: Effects vary by dollar amount chosen. Forgiveness of up to $10,000 would eliminate all student loan debt for an estimated 16.3 million borrowers, or 36 percent of all borrowers, and reduce by half the balances for another 9.3 million, or 20 percent of all borrowers.26 Forgiveness of up to $40,000 would wipe out debt for 35 million borrowers—about 77 percent of borrowers. The number of borrowers who would have all their debt canceled under this plan might be a bit lower, depending on the dollar amount, because some individuals who currently appear to have low debt levels are in school and are thus likely to end up with higher loan balances as they continue their studies. Table 1 shows the estimated effects and costs across a range of maximum forgiveness amounts.
Table 1: Estimated amount of canceled debt and impact of different levels of federal student loan forgiveness
| Forgiveness Amount | Total canceled debt (USD) | Number of borrowers withfull debt elimination | Percentage of all borrowers with full debt elimination |
|---|---|---|---|
| $5,000 | 207 B | 8.7 M | 19% |
| $10,000 | 371 B | 16.3 M | 36% |
| $20,000 | 611 B | 25.6 M | 56% |
| $40,000 | 901 B | 35M | 77% |
| $60,000 | 1065 B | 39.1 M | 86% |
Note: Data are based on the status of the federal student loan portfolio in the first quarter of the 2019 federal fiscal year. These estimates include borrowers who are currently enrolled and thus might incur greater debt loads in the future. These figures do not include foregone future interest payments, costs associated with not taxing forgiven debt, or adjustments based on the U.S. Department of Education’s assumptions of how much student loan debt will be repaid.
Source: Office of Federal Student Aid, "Portfolio by Debt Size," 2019.
Does it address equity? Yes, though the exact equity implications will vary somewhat based on the level chosen. Table 2 breaks down the percentage of borrowers in a given racial/ethnic category based upon the cumulative amount of federal loans borrowed. Table 3 flips this analysis to show the distribution of debts within a given racial or ethnic category. Both tables are based on borrowers who entered higher education in the 2003–04 academic year and their cumulative federal loan amounts within 12 years. While this is the best picture of longitudinal student loan situations by race and ethnicity, the fact that these figures represent students who first enrolled prior to the Great Recession means it is possible that, were they available, newer numbers might show different results. In considering these tables, it is important to recognize that higher amounts of forgiveness would still provide benefits for everyone at the lower levels of debt as well. That means that increasing forgiveness by no means leaves those with lesser balances worse off.
Hispanic or Latinx borrowers, for example, will disproportionately benefit from a forgiveness policy that picks a smaller dollar amount, because this group makes up an outsize share of borrowers with $20,000 or less in student debt.27 These same individuals would still benefit from forgiveness at higher dollar amounts, but their concentration among lower-balance borrowers means the marginal benefits of forgiving greater dollar amounts are smaller.
The story is different for Black or African American borrowers. They make up a roughly proportional share of low-balance borrowers but a disproportionate share of those who took out between $40,000 and $100,000.28 That means the marginal effect on Black or African American borrowers will be greater for higher dollar amounts.
Looking at borrowers based on Pell Grant receipt tells a slightly different story. Individuals who have received a Pell Grant are proportionately represented among lower-balance borrowers and underrepresented among those with the highest balances. But they are most overrepresented among those who took out between $20,000 and $60,000.29
Table 2: Hispanic or Latino borrowers make up a disproportionate share of low-balance borrowers, while black or African American borrowers are overrepresented among those who borrowed between $40,000 and $100,000
| White | Black or African American | Hispanic or Latino | Asian | Other | |
|---|---|---|---|---|---|
| Share of all borrowers | 60% | 17% | 14% | 4% | 5% |
| < $10,000 | 56% | 18% | 18% | 3% | 5% |
| $10,001 to $20,000 | 65% | 13% | 13% | 4% | 5% |
| $20,001 to $40,000 | 62% | 17% | 12% | 4% | 5% |
| $40,001 to $60,000 | 57% | 22% | 11% | 3% | 6% |
| $60,001 to $80,000 | 61% | 22% | 8% | 4% | 4% |
| $80,001 to $100,000 | 58% | 26% | 6% | 5% | 5% |
| > $100,000 | 59% | 16% | 8% | 11% | 6% |
Note: The racial and ethnic breakdown of different ranges of cumulative federal student loan debt acquired by 2015 for borrowers who entered higher education in the 2003–2004 academic year.
Source: National Center for Education Statistics, “2003-04 Beginning Postsecondary Students Longitudinal Study, Second Follow-up (BPS:04/09),” Table gebmn0e.
Table 3 presents a different way of considering this issue by showing the distribution of debts within a given racial or ethnic category. For example, though Black or African American borrowers make up a disproportionate share of borrowers with balances between $40,000 and $100,000, 77 percent of these individuals had debt balances below this amount. This highlights the importance of considering not just the marginal effects of different forgiveness plans on equity, but also how many individuals within a given group might benefit at varying benefit levels.
Table 3: Cumulative amount of federal loans borrowed
| < $10,000 | $10,001– $20,000 | $20,001– $40,000 | $40,001– $60,000 | $60,001– $80,000 | $80,001– $100,000 | > $100,001 | |
|---|---|---|---|---|---|---|---|
| All Borrowers | 36% | 24% | 22% | 10% | 3% | 2% | 4% |
| White | 34% | 26% | 22% | 10% | 3% | 2% | 4% |
| Black or African American | 37% | 18% | 21% | 13% | 4% | 3% | 3% |
| Hispanic or Latino | 46% | 23% | 18% | 8% | 2% | 1% | 2% |
| Asian | 31% | 23% | 21% | 9% | 3% | 2% | 11% |
| Other | 34% | 23% | 22% | 12% | 2% | 2% | 4% |
Note: Nearly half of Hispanic or Latino borrowers took out $10,000 or less, while a majority of black or African American borrowers took out between $10,000 and $60,000 The percentage distribution of the cumulative federal student loan debt acquired by 2015 for borrowers of the same race or ethnicity who entered college in the 2003–2004 academic year.
Source: National Center for Education Statistics,”2003-04 Beginning Postsecondary Students Longitudinal Study, Second Follow-up (BPS:04/09),” Table gebmpce5.
Looking at the effects of cancellation only from a distributional standpoint can, however, miss other dimensions of equity that merit consideration. For example, borrowers at the same indebtedness level may be in quite different circumstances. Discrimination in housing and employment, a lack of familial wealth, or other conditions could mean that a borrower who otherwise might seem less in need of assistance would still benefit in a meaningful way that could spur wealth building and address generational asset gaps.
How simple is it from a borrower standpoint? This option is fairly simple and could be implemented administratively with no affirmative work required from borrowers as long as there are no tax consequences for forgiveness.
How broad is its impact? This policy would provide at least partial relief for all federal student loan borrowers.
Will it feel like relief? Yes, borrowers would see a reduction in their balances and payments, though that relief would be proportional to their outstanding balances.
Who are the greatest beneficiaries? At lower dollar amounts, the biggest beneficiaries are smaller-balance borrowers who are more likely to have all their debt wiped away. As the amount of forgiveness rises, those individuals will already have no balance and thus have no additional debt to forgive. This means that those who have the full dollar amount forgiven will increasingly be borrowers with higher balances.
What is the biggest advantage? This is a way to hit a target level of relief that could wipe away debt for those in the greatest distress, while providing a more universal benefit. There may also be benefits for the overall economy, allowing people to purchase homes, save for retirement, and attain the traditional middle-class staples that may be harder for borrowers with student loan debt to obtain.
What is the biggest challenge? Because the benefit is universal, it will end up providing partial relief to a large number of individuals who may not need assistance, unless other elements are added to the policy to target it as described below. Those receiving relief would include individuals with graduate loans working in the areas of finance, law, business, and medicine.
How could this option be more targeted? In addition to varying the dollar amount forgiven, there are a few ways to improve targeting and reduce costs, although these approaches would add some complexity to the overall plan and its administration. One way would be to apply the policy only to undergraduate loans. Another would be to tie the forgiveness amount to a borrower’s earnings so that higher-income individuals receive less forgiveness.
Option 3. Reform Repayment Options to Tackle Excessive Interest Growth and Provide Quicker Paths to Forgiveness.
Twelve years ago, Congress created the income-based repayment plan as its answer to unaffordable student loans.30 With the creation of additional plans, there is now a suite of income-driven repayment (IDR) options available to borrowers. The exact terms vary, but the basic idea is to connect monthly payments to how much money borrowers earn and provide forgiveness after some set period of time in repayment.
Though IDR plans are increasingly popular, there’s a sense among some policymakers that in their current form, they do not fully provide relief for borrowers. Part of this is due to the complex and clunky program structure. Borrowers must fill out paperwork to get on the plan and then reapply each year. Failure to do so can kick them off the plan, leading to capitalized interest, delayed forgiveness, and a larger balance.31
But IDR’s other major problem relates to accumulating interest. While borrowers can lower their monthly payments on IDR, even paying nothing each month if they are earning little to no income, interest continues to accrue. The result is that borrowers can feel like they are trapped with their loans and with a balance that keeps growing even as they make payments—the only way out being forgiveness that is potentially two decades down the line.
This option would make IDR more attractive by changing the terms so that borrowers no longer have any interest accumulating on their debt. Borrowers would make a monthly payment equal to 10 percent of their discretionary income, even if that would result in repayment taking longer than the 10-year standard repayment plan. Borrowers with no discretionary income would not have to make monthly payments, just as in the past. However, any interest not covered by that payment would be forgiven, ensuring that borrowers’ balances never increase. Undergraduate debts would be forgiven after 15 years, while graduate borrowers would have to wait five years longer—20 years.
Forgiving all interest would be an expansion of some benefits that currently exist. For instance, the federal government covers all unpaid interest on subsidized Stafford loans for the first three years of repayment on most IDR plans.32 And on the Revised Pay As You Earn plan, the federal government covers half of unpaid interest for the duration of repayment for all loan types. This includes interest on subsidized loans beyond the three-year period.33
Estimated cost: Unfortunately, there are not enough available data to get a sense of the overall cost of this proposal. Calculating the cost of this option would require at least knowing more information about the distribution of borrowers using IDR, in terms of their income and debts. Currently, the Education Department provides information only on the distribution of debt balances in IDR. Without better data, it is not possible to know what share of borrowers on IDR make payments below the rate at which interest accumulates and would benefit from a greater subsidy. Moreover, the costs of this change are affected by the amount of subsidized loans a borrower has, because those carry different interest accumulation rules. The net result is that there is no clean way to get an accurate cost estimate.
Estimated effects: There are currently about 7.7 million borrowers using an IDR plan to repay $456 billion.34 It is unfortunately not clear what share of these individuals would benefit from these suggested changes.
Does it address equity? Available data are insufficient to fully answer this question, because there is no information on the usage of IDR by the groups described in the equity goal section. However, the answer at least partly depends on what is done to make the plans more attractive for lower-balance borrowers. That group includes nearly half of Hispanic or Latinx borrowers as well as large numbers of individuals who have debt but did not finish college and are at significant risk of defaulting. Meanwhile, current IDR plans might be beneficial for Black or African American borrowers on paper, just by looking at their disproportionate representation on an analysis of debt levels. But that presumes that payments viewed as affordable through the formula are actually feasible.
The accompanying table illustrates the challenge of making IDR work for borrowers who have a low balance and a low income by showing their repayment plan options. Under the current options for these borrowers, the graduated plan combines the most initial monthly payment relief with the shortest repayment term. Of the four IDR plans, these borrowers are not eligible for one because of their debt and income levels; two plans offer a monthly payment amount that is just a dollar less than the standard plan; and one has the same initial monthly payment as the graduated plan but has them in repayment for almost 20 years.
Table 5: Low-income borrowers with small loan balances may not benefit from income-driven repayment plans
| Repayment Plan | First Monthly Payment | Last Monthly Payment | Amount Paid | Amount Forgiven | Months in Repayment |
|---|---|---|---|---|---|
| Standard | $53 | $53 | $6,364 | $0 | 120 |
| Graduated | $30 | $90 | $6,716 | $0 | 120 |
| Revised Pay As You Earn (REPAYE) | $52 | $100 | $6,028 | $0 | 82 |
| Pay As You Earn (PAYE)/Income-Based Repayment (IBR) for New Borrowers | $52 | $53 | $6,370 | $0 | 121 |
| IBR | Ineligible | Ineligible | Ineligible | Ineligible | Ineligible |
| Income Contingent Repayment (ICR) | $30 | $39 | $8,000 | $0 | 234 |
Note: These figures are based on repayment options for a borrower with a $5,000 undergraduate loan balance and a starting adjusted gross income of $25,000 per year, a 5 percent interest rate, and assume that income grows 5 percent every year.
Source: Office of Federal Student Aid, “Repayment Estimator,” 2019.
Even if the borrower had a lower income, and therefore a lower monthly IDR payment, the plans would not provide a great deal of relief (see Table 6). Instead of seeing a decreasing balance, the borrower will instead see it balloon, because they are not able to pay down interest as fast as it is accruing. Forgiving the interest on IDR plans will make the option more attractive, but the requirement of having to wait as long as 20 years to retire a debt that came from a semester or two of school is not going to be an easy sell. This solution still has technical and gatekeeping issues, as borrowers need to opt in to use IDR plans.
Table 6: Very low-income borrowers with small loan balances can receive forgiveness, but only after at least 20 years of repayment
| Repayment Plan | First Monthly Payment | Last Monthly Payment | Amount Paid | Amount Forgiven | Months in Repayment |
|---|---|---|---|---|---|
| Standard | $53 | $53 | $6,364 | $0 | 120 |
| Graduated | $30 | $90 | $6,716 | $0 | 120 |
| Revised Pay As You Earn (REPAYE) | $0 | $115 | $8,578 | $0 | 284 |
| Pay As You Earn (PAYE)/Income-Based Repayment (IBR) for New Borrowers | $0 | $53 | $4,014 | $6,061 | 240 |
| IBR | $0 | $53 | $7,975 | $3,424 | 300 |
| Income Contingent Repayment (ICR) | $26 | $32 | $8,492 | $854 | 300 |
Note: These figures are based on repayment options for a borrower with a $5,000 undergraduate loan balance and a starting adjusted gross income of $15,000 per year, a 5 percent interest rate, and assume that income grows 5 percent every year.
Source: Office of Federal Student Aid, “Repayment Estimator,” 2019.
How simple is it from a borrower standpoint? It would be very simple for borrowers who are on IDR. But the paperwork complications of applying for and staying on IDR plans remain a challenge that needs to be addressed.
How broad is the impact? About one-fourth of borrowers in repayment currently use an IDR plan; thus the effect will be somewhat limited unless changes result in increased usage of these plans.35 In particular, this option would need to boost usage among borrowers who owe $20,000 or less. Currently, less than 10 percent of borrowers with debt of $20,000 or less use an IDR plan, compared with 38 percent of those with debts of $60,000 or more.36 Though this slightly understates usage of IDR by low-balance borrowers because some of these individuals are still in school, the fact remains that there are more borrowers with debts greater than $100,000 on IDR than those who owe $10,000 or less.37
Will it feel like relief? Psychologically, yes—borrowers would still be making the same monthly payment, but they would not feel like they are digging themselves into a deeper hole. Borrowers encouraged to enroll in IDR as part of this change would likely see monthly payment relief.
Who are the greatest beneficiaries? The biggest winners are individuals who make payments through IDR but are not paying down their interest each month. Within that group, the amount of relief will be greater for those with larger debt balances, higher interest rates, or both.
What is the biggest advantage? This solution makes IDR a more viable and attractive long-term plan.
What is the biggest challenge? It may still not be enough to help borrowers with very low balances or who are likely to default, because they still need to navigate the paperwork challenges to sign up for IDR, or the timeline to pay down the debt will still be viewed as too long relative to the amount of time it took to incur the debt. It also presumes that 10 percent of discretionary income is affordable, or that 150 percent of the poverty level is a large enough income exemption.38
How could this idea be more targeted? Capping the maximum dollar amount of interest that can be forgiven each year would better target the benefits of the option, because it would provide less relief for borrowers with larger loan balances. Reducing forgiveness time frames for lower-balance borrowers or adding opportunities for interim forgiveness—such as $5,000 forgiven after five years on the plan—would especially help lower-balance borrowers and make IDR a more attractive option for them.
Option 4. Change Repayment Options to Provide More Timely Forgiveness.
Income-driven repayment plans guarantee that borrowers have an eventual way out of debt by forgiving any balances remaining after a set number of years. While this is a crucial benefit, taking as long as 20 years or 25 years, depending on the plan, to get forgiveness can make the promise feel abstract and like something that might not happen. This proposal would change forgiveness terms to provide interim principal relief for borrowers.
Estimated cost: Unfortunately, there are not enough available data to get a sense of the overall cost of this proposal. Calculating that cost would require at least knowing more about the distribution of borrowers using IDR in terms of their income and debts, as well as how long they have been on IDR.
Looking at the number of borrowers on all IDR plans might provide one way to ballpark the possible cost. For example, by the end of 2016, 5.6 million borrowers were on an IDR plan. If they were all still on those plans by the end of 2018, it would cost $11.2 billion to forgive $2,000 for each of them.39 If those who were on IDR at the end of 2018 stayed on, the cost of forgiving $2,000 for each of them at the end of 2020 would be $14.4 billion. This assumes that the two-year clock for forgiveness would only start going forward.
Estimated effects: For most borrowers on IDR, small forgiveness would be helpful but not transformative. However, there are about 1 million borrowers on these plans who owe $10,000 or less, meaning they would receive a substantial amount of forgiveness in percentage terms. The more likely effect is that interim forgiveness could make IDR more attractive for lower-balance borrowers who may be discouraged from using it today, because waiting up to 20 years for forgiveness on small amounts of debt may not seem worth it.
Does it address equity? There are not enough data to definitively answer this question. However, an interim relief system, if paired with other reforms to accumulating interest on IDR, would make this repayment option much more effective for lower-balance borrowers. This is particularly important for targeting help to individuals who did not finish college, or to Hispanic or Latinx borrowers. Low-balance borrowers currently do not have much incentive to use IDR, because waiting two decades to unload debt accumulated over a semester or a year does not seem like a good deal. Under this option, those low-balance borrowers could retire their debt much faster, while higher-balance borrowers would keep paying for longer. The data are less clear for other groups on whom policies should focus, such as Black or African American borrowers. However, these solutions overall increase the generosity of IDR in a way that should make this option better for anyone who has high levels of debt relative to their income. That, in turn, should help individuals whose earnings do not match the expected return on their debt, such as due to wage discrimination.
How simple is it from a borrower standpoint? There would be some work involved to ensure that borrowers apply for IDR and are making necessary payments. But the relief itself could be handled by the Education Department and student loan servicers.
How broad is the impact? Slightly more than one-quarter of borrowers in repayment currently use an IDR plan, so the effect will be somewhat limited unless interim principal forgiveness encourages increased usage of these plans.40 As discussed in the prior option, it would particularly need to boost usage among lower-balance borrowers.
Will it feel like relief? Yes—providing help at interim periods will show that forgiveness is not an abstract concept years in the future. It will also strengthen support for IDR.
Who are the greatest beneficiaries? Though this policy targets everyone, interim relief will help borrowers with lower balances get rid of their debt faster than those who owe more.
What is the biggest advantage? Interim relief employs a universal benefit to provide more targeted relief to those who owe the least.
What is the biggest challenge? Borrowers would still have to navigate IDR, which can be time consuming and confusing.
How could this idea be more targeted? The tiered relief could be limited to undergraduate loans only.
Conclusion
Student loans were initially implemented as a policy innovation to help middle- and upper-middle-income families finance part of the cost of college while lower-income individuals received robust grant aid. Unfortunately, a tool meant to help individuals secure a brighter future has morphed into one associated with years of financial struggle. It is imperative that this problem be fixed for future generations by implementing bold ideas that make it possible to access and succeed in higher education without the burden of excessive debt. Yet policy solutions must not neglect those already being crushed by student debt, the result of decades of declining state investment and rising tuition prices.
While tackling the existing $1.5 trillion in student debt is a major challenge, the good news is that there are multiple paths to relief. As our analysis shows, a range of options exists at various levels of cost and complexity that can take the sting out of student debt. Whatever policy is pursued, it should keep a sharp focus on equity and simplicity, as well as on the recognition that borrowers must feel that meaningful help is on the way.
Citations
- This borrower count potentially includes some individuals under age 18, but Education Department data report only the number of borrowers who are age 24 or younger. See MeasureOne, “The MeasureOne Private Student Loan Report” (San Francisco: 2018), available at source
- There are 15.2 million student loan borrowers ages 25 to 34, and there are 44.9 million adults in America in that same age range. U.S. Department of Education Office of Federal Student Aid, “Federal Student Loan Portfolio: Portfolio by Age,” available at source (last accessed June 2019); U.S. Census Bureau, “Educational Attainment in the United States: 2018,” available at source (last accessed June 2019).
- U.S. Census Bureau, “Table B15002: Sex by Age by Educational Attainment for the Population 18 Years and Over, 2013–2017 American Community Survey 5-Year Estimates” available at source (last accessed July 2019).
- Emily Sullivan (November 30, 2018). “Why Aren't Millennials Spending? They're Poorer Than Previous Generations, Fed Says,” available at source (last accessed July 2019).
- Center for American Progress Postsecondary Education Team, “Beyond Tuition” (Washington: Center for American Progress, 2018), available at source
- National Center for Education Statistics, “Datalab, Beginning Postsecondary Students 2004–2009,” Table kdbmmc5, available at source
- National Center for Education Statistics, “Datalab, Beginning Postsecondary Students 2004–2009,” Table kdbmnafb.
- National Center for Education Statistics, “Datalab, Beginning Postsecondary Students 2004–2009,” Table kdbmnn76.
- Office of Federal Student Aid, “Default Rates” (Washington: U.S. Department of Education, 2013), available at source
- Ben Miller, “New Federal Data Show a Student Loan Crisis for African American Borrowers,” Center for American Progress, October 19, 2017, available at source
- Colleen Campbell, “The Forgotten Faces of Student Loan Default,” Center for American Progress, October 16, 2018, available at source
- U.S. Department of Education Office of Federal Student Aid, “Understanding Delinquency and Default,” available at source (last accessed June 2019).
- National Center for Education Statistics, “Datalab, Beginning Postsecondary Students 2004–2009,” Table kdbmmc5.
- National Center for Education Statistics, “Datalab, Beginning Postsecondary Students 2004–2009,” Table kdbmamc10.
- Ben Miller, “New Federal Data Show a Student Loan Crisis for African American Borrowers.”
- Colleen Campbell, “The Student Loan Default Crisis for Borrowers with Children,” Center for American Progress, November 15, 2017, available at source
- U.S. Department of Education, “2016–2017 Federal Pell Grant Program End-of-Year Report: Table 70 Distribution of Recipients by Income Award Year 2016–2017,” available at source (last accessed May 2019).
- Ben Miller, “Who Are Student Loan Defaulters?” (Washington: Center for American Progress, 2017), available at source
- Ibid.; National Center for Education Statistics, “Datalab, Beginning Postsecondary Students 2004–2009,” Table kdbmam6.
- National Center for Education Statistics, “Datalab, 2015–16 National Postsecondary Student Aid Study,” Table dbebmp36, available at source (last accessed May 2019).
- National Center for Education Statistics, “Datalab, 2015–16 National Postsecondary Student Aid Study,” Table dbebmp78.
- U.S. Department of Education Office of Federal Student Aid, “Public Service Loan Forgiveness,” available at source (last accessed June 2019).
- U.S. Department of Education Office of Federal Student Aid, “Federal Student Loan Portfolio.”
- U.S. Department of Education Office of Federal Student Aid, “Subsidized and Unsubsidized Loans,” available at source (last accessed June 2019).
- National Center for Education Statistics, “Datalab, 2015–16 National Postsecondary Student Aid Study,” Table dbebmad8.
- Enterprise Data Warehouse, “Federal Student Loan Portfolio by Borrower Debt Size,” available at source (last accessed June 2019).
- National Center for Education Statistics, “Datalab, Beginning Postsecondary Students 2004–2009,” Table cebmn7e.
- National Center for Education Statistics, “Datalab, Beginning Postsecondary Students 2003–04,” Table cebmn7e, available at source (last accessed May 2019).
- National Center for Education Statistics, “Datalab, Beginning Postsecondary Students 2003–04,” Table gebmn17.
- The Institute for College Access and Success, “The College Cost Reduction and Access Act,” available at source (last accessed June 2019).
- Ben Miller and Maggie Thompson, “Annual Paperwork Should Not Stand in the Way of Affordable Student-Loan Payments,” Center for American Progress, August 31, 2016, available at source
- U.S. Department of Education Office of Federal Student Aid, “Income-Driven Plans Questions and Answers,” available at source (last accessed June 2019).
- Ibid.
- U.S. Department of Education Office of Federal Student Aid, "IDR Portfolio by Debt Size.”
- Ibid.; U.S. Department of Education Office of Federal Student Aid, “Portfolio by Debt Size.”
- Ibid.
- Ibid.
- For example, Sen. Jeff Merkley (D-OR) has proposed increasing the size of the discretionary income exemption from 150 percent to 250 percent of poverty. See Office of U.S. Senator Jeff Merkley, “Merkley, Senate Democrats Introduce Legislation to Ensure Affordable Student Loans for Every Borrower,” press release, October 11, 2018, available at source
- U.S. Department of Education Office of Federal Student Aid, “Federal Student Loan Portfolio: Direct Loan Portfolio by Repayment Plan,” available at source (last accessed June 2019).
- Authors’ analysis of U.S. Department of Education Office of Federal Student Aid, “Federal Student Loan Portfolio: Portfolio by Loan Status,” available at source (last accessed June 2019); U.S. Department of Education Office of Federal Student Aid, "Federal Student Loan Portfolio: IDR Portfolio by Debt Size.”
Policy Responses to the Millennial Wealth Gap: Repairing the Balance Sheet and Creating New Pathways to Progress
Reid Cramer
Contrary to predictions of success made when the Millennial generation first coalesced, the facts and analysis presented throughout this book illustrate a new generational storyline. Millennials are in a fundamentally different economic place than previous generations. Relatively flat but volatile incomes, low savings and asset holdings, and higher consumer and student debt have weakened their finances. The Millennial balance sheet is in poor shape.
Not only are they failing to match previous patterns of young adults, but Millennials have seen their fortunes significantly lag behind older households in the years following the Great Recession. Compared to their generational predecessors, they are on a lower trajectory of building assets for the future. Along with their failure to match the experiences of their parents and grandparents, their sense of economic progress is beginning to fade. Even though Millennials are in their prime work years, their window of peak earnings will not remain open indefinitely. Their dilemma can be stated succinctly: Can Millennials repair their balance sheet, or are they destined to become a “lost generation” that fails to accumulate expected levels of wealth?
As Millennials age into adulthood, they will increasingly need more economic resources to thrive. Instead, they are experiencing a mismatch between the money they have and what it costs to meet their social responsibilities of work and family. This applies at the household level, and also generationally. Yet the Millennial wealth gap is wide—and consequential. It merits a policy response proportionate to the challenge.
The goal of this chapter is to build on the analysis of research presented throughout this book to advance a forward-looking policy agenda capable of responding to the unfolding reality of the Millennial wealth gap. Policy assumptions and considerations are shared and disclosed in the first section, followed by a sketch of specific policy responses capable of addressing generational inequity. Time is of the essence and, in fact, key to the policy response. Specifically, it is useful to distinguish between policy interventions to help current Millennials recover financially and those intended to create new and viable pathways of progress for future generations.
Policy Assumptions and Considerations
Designing a policy response to the Millennial wealth gap should be grounded in a set of assumptions. For starters, a strong economy with growing incomes that track productivity is an essential foundation for shared prosperity. But it is hardly sufficient on its own. We need inclusive growth, which includes jobs with good wages, accompanied by employee benefits and wealth-building opportunities. Each family and household must be able to assemble and deploy an array of economic resources—in the form of savings and assets—that can serve as both a cushion to provide security and a springboard to launch mobility.
While there are many different paths to take to build wealth in America, historically, several pillars of opportunity have played primary roles. These include the process of accessing education and training, securing a steady and well-paying job, receiving support from family networks, and increasing ownership of savings and assets. In recent decades, these pillars have weakened. For some, they were never there at all. For others, the Great Recession destabilized their previously secure foundations.
Wealth in America has never been evenly distributed, though levels of inequality have varied significantly. The skewed distribution of wealth today has reached historic proportions and public policy should address the imbalance. A collective goal should be to ensure that everyone is given opportunities to build wealth, especially those who start life with less.
As society attempts to grapple with the present and future of the Millennial generation, it must bring any social policy ambitions in line with the reality of their unprecedented diversity. This means giving special attention to the role of race and ethnicity, which are persistently associated with large and clear disparities. This holds true for a range of economic indicators, such as levels of savings and debt, participation in the financial mainstream, homeownership status, and lifetime earnings.
While the racial wealth gap is a long-standing feature of American society, there is evidence that it extends beyond a historic phenomenon. Although family wealth history and access to higher education explain some of the divide, there are new and recent developments that are exacerbating wealth disparities among racial and ethnic groups. For example, discrimination in the housing finance market has led to unequal outcomes. Relatedly, the mass incarceration of African American males has had severe financial impacts. Indeed, there is a large body of evidence that the African American community remains economically vulnerable, and preyed upon. Other groups have serious claims that their assets have been systematically stripped, such as Native communities, and new immigrants who were exposed to predatory financial practices.
The reality of a persistent racial wealth gap, created by both the historic legacy of slavery and discrimination as well as new sources of inequality, deserves a commensurate policy response. Fairness and equity should be important considerations, as well as social and economic justice. Undoubtedly, figuring out how to use race and ethnicity to inform future policy will be a challenging terrain for the country to navigate. While not a substitute for reckoning with the past, there are advantages to an approach of progressive universalism, where everybody is included and covered by a basic set of provisions, but those with fewer resources and greater needs receive higher benefits.
Moreover, to be effective, policies should align with the changing behaviors and preferences of young adults in America today. There remain significant headwinds making the path to savings and asset building more difficult. In particular, many younger Americans don’t trust financial institutions, nor are they confident that savings necessarily lead to wealth over the long term. The risks of wealth creation, to many of them, may exceed the rewards. While some risks associated with losing one’s income are shared, though Social Security, unemployment insurance, and welfare programs, the individual overwhelmingly assumes the risks of losing one’s wealth. Policymakers should address this imbalance.
The following description of policy responses reflects a broad and far-reaching agenda. That’s the nature of wealth. There are inter-related issues of age, race, and education. Not everything that is pertinent can be addressed here, including the importance of a quality early and K-12 education, a strong social safety net, a fiscally sound and generous Social Security program, consumer protections in the financial services marketplace, childcare, affordable and accessible health insurance, and wages in line with the cost of living. That’s a long list, but it still leaves room for identifying a set of strategy objectives in distinct policy areas that should garner more attention.
Even while focusing on the lack of wealth held by those in the middle and on the lower rungs of the economic ladder, there is an undeniable reality that the largest amounts of wealth are concentrated at the top. Policymakers may, then, want to consider the role that tax and redistribution policies may play in broadening capital ownership. When they do, they should acknowledge that the current cohort of older households is the wealthiest in U.S. and human history, while younger families are feeling financially squeezed, and increasingly unlikely to realize their parent’s version of the American Dream.
But the dream is not “fixed,” as generational scholar Neil Howe has observed; rather it is renewed and reimagined in every generation. When Howe helped coin the term “Millennial” to refer to the generation coming of age in the new century, his focus was on the behaviors and characteristics that made this cohort distinct from their parents (Howe and Strauss 2000). It is these attributes, along with lived experience, that will provide the impetus to revise and re-balance the terms of the prevailing social contract, which currently heavily favors older and wealthier Americans. Our collective challenge is to make a generational “adjustment” and re-orient existing policies so the rising generations are given the chance to achieve their own aspirations.
8 Policy Responses to Address the Millennial Wealth Gap
When thinking strategically about responding to the Millennial wealth gap, it is useful to distinguish between policies that can assist the current generation and those that can create more favorable conditions for future generations. Accordingly, a bifurcated policy agenda is presented, organized by strategic goals, that aims to help Millennials get back on track financially and create new pathways to wealth for the next generation of young adults.
Repairing the Millennial Balance Sheet
To improve the finances of the Millennial generation, policy reforms should address key components of the balance sheet: savings and assets as well as debts and liabilities. Policies should help people get started on a multi-tiered savings and asset-building continuum. This begins with small savings that can be immediately accessed, extends to larger pools of “intermediate” savings that can be used to acquire productive and durable assets, and simultaneously facilitates contributions to longer-term retirement plans.
Repairing the Millennial Balance Sheet
| Promote Savings to Build Up Cash Reserves |
|---|
| Reduce the Debt Overhang |
| Facilitate Deposits to Retirement Plans |
| Increase the Supply of Affordable Rental Housing While Promoting Paths to Sustainable Homeownership |
1. Promote Savings to Build Up Cash Reserves.
A broad range of research shows that liquid savings contributes to both economic stability and upward mobility. Without access to money to handle unexpected events, contingencies, and emergencies, people may be forced to depend on short-term loans with high interest rates, which can create a debt trap that is financially debilitating. Even small amounts can make a difference for financial health, mental health, and child outcomes. Cash reserves are especially important to Millennial workers, who are increasingly managing volatile incomes in the “gig” economy. Yet recent survey data reveal that 58% of American adults don’t have over $1,000 in a savings account and 32% don’t have any liquid savings (Huddleston 2019). Without accessible savings, people are particularly vulnerable economically.
A fundamental element for a wealth gap policy response should be the promotion of savings to build up cash reserves. Doing so depends on being able to access responsible financial services and supportive institutions. Yet the FDIC reports that over 25% of households don’t own a bank account or obtain financial products and services outside the banking system (FDIC 2017). Everyone should be able to easily open and operate a low-cost bank account. Several features are fundamental, including the ability to conduct everyday financial transactions, build up savings over time, and pay bills and transfer money electronically.
Beyond accounts, new incentives will be required to promote savings among people with lower incomes, especially in an environment of low interest rates. The following ideas can be designed and implemented to encourage and incentivize deposits:
- Remove the tax on interest from savings accounts, up to a set amount annually, such as for the first $500.
- Offer a savers bonus or match on deposits into a savings account, up to a set amount, annually, which can be facilitated through tax filing and direct deposit (Cramer 2010).
- Encourage the creation of new products to renew the promise of U.S. savings bonds. Previously, savings bonds were available to the small saver, offered protections on deposits, and had few reporting requirements. The savings bond should either be reinvented to bring it back to its roots, or a new retail product should be created as an alternative.
Additionally, there are a number of platforms and system processes that can be leveraged to support small savings. These include the tax filing system, mobile apps and online banking, employer payroll systems, and financial advice and coaching. Through each of these, there are opportunities to establish a set of default arrangements that channel people into savings. For instance, as an employee benefit, workers can be connected to an AutoSave system of flexible accounts and have deposits made automatically as payroll deductions (Cramer 2006).
2. Reduce the Debt Overhang.
Rather than wealth, Millennials are accumulating debt. The typical Millennial has higher debt relative to both their income and assets than any other generation at the same age. But their debt profile is distinct. Previously, starting families and forming households was associated with buying homes and taking out a mortgage. For Millennials, mortgage debt has been replaced by student loans and other forms of consumer debt, including car loans, credit card balances, and miscellaneous fees and fines. These types of debt cannot be leveraged and used to finance the purchase of other assets that can appreciate in value.
Student loan debt has increased from $500B in 2005 to over $1.5 trillion today. This rise reflects the reality of more people enrolled, but also rising tuitions, which have dramatically outpaced inflation. As a result, Millennials have taken out 300 percent more debt than their parents, but, unfortunately, it hasn’t always led to a degree. Among college graduates with a bachelor’s degree, student loans average almost $30,000, triple the figure for the same group in 1993, though median balances are about half that and manageable for most borrowers (Emmons, Kent, and Ricketts 2018). While there are advantages to investing in human capital development, student loans cannot be leveraged directly to boost wealth on the balance sheet.
There should be a large-scale policy response to address the student loan debt overhang, which may include a widespread cancelling of student loan debt. This approach is used in the financial markets, often after financial crises. Students should get the same consideration from their lenders, which in this case is the federal government, representing all of us. A more targeted approach would focus on those distressed borrowers most likely to default. There are tradeoffs between simplicity and targeting that may have to be assessed. Options, highlighted in other chapters of this book, include:
- Cancel student debt up to a certain amount per borrower.
- Sharpen efforts for income-based repayment.
- Fix the implementation of public service forgiveness plans.
- Employers should be encouraged and incentivized to offer student loan repayment as an employee benefit.
- End taxation of loan amounts that are forgiven.
Beyond student loans, there are other sources of debt that can be addressed through public policy, especially for debt that is in collections. Government fees and fines at all levels of government are a place to start. The San Francisco Treasurer has created an Office of Financial Justice, which has identified a number of approaches that should be pursued. Specifically, fines and fees should be based on an ability to pay; jail time should be prohibited for unpaid court debts, and state and municipalities should reduce their reliance on fees and fines for revenue.
3. Facilitate Deposits to Retirement Plans.
Longer-term demographic, fiscal, and wealth trends suggest that Millennials will experience unique and significant challenges in achieving retirement security. Given the scale of the potential wealth shortfall, policymakers should begin to consider measures to strengthen public safety net programs, such as Social Security, Medicare, Medicaid, and long-term care, and pursue additional efforts to ensure all Americans can increase their long-term retirement savings.
Although public policy has created a system of tax-advantaged retirement accounts like 401ks and IRAs, half of the workforce does not participate in these saving plans (Weller 2016). Even those that do may be under saving for their needs and in danger of failing to meet their own expectations. Public policy can do more to expand access to long-term saving plans and ensure everyone participates. Specific reforms include:
- Increasing the incentives to save in targeted retirement accounts by matching deposits into tax-advantaged accounts and savings plans.
- Requiring employers who offer plans to automatically enroll their workers and give them a choice to opt out.
- Ensuring that people who don’t work for employers administering retirement plans have equal access to a public option retirement savings plan.
Federal proposals have called for creating a Universal 401K program (Calabrese 2007). Even without federal action, states have moved to create these systems. California and Illinois are calling their systems “Secure Choice” and other states are pursuing similar plans. In both a public and private system, it is essential for policy to establish a set of default arrangements that get people on a reasonable course for retirement savings given their age and income. These include provisions to automatically escalate contributions as an individual’s income rises.
4. Increase the Supply of Affordable Rental Housing While Promoting Paths to Sustainable Homeownership.
In many parts of the country, affordable housing and homeownership are both out of the reach of Millennials. The homeownership rate for the under-35 households fell from 43 percent in 2005 to a historic low of 31 percent in 2015 (Joint Center of Housing Studies 2016). Young adults today are half as likely to own a home as they were in 1975. But rents are up. The number of households spending over half their income on rent has grown by more than 50 percent over the last 15 years (The Pew Charitable Trusts 2014). The lack of affordable housing greatly impacts the household balance sheet because it takes up a greater share of income, leaving little left over to cover other living expenses or save in cash reserves.
Not only is housing among the highest household expenses, but it is closely tied to long-term wealth outcomes. In fact, it is uncommon for renters to accumulate even average amounts of wealth. The latest figures from the Federal Reserve show that the typical renter had a net worth of $5,200, while the typical homeowner had a net worth of $231,400. This makes housing tenure among the most significant variable explaining long-term wealth outcomes. The wealth disparities among renters and homeowners should prompt policymakers to pursue measures to increase the supply of affordable rental housing while promoting sustainable homeownership for those ready to buy.
For renters, policy should be used to:
- Increase subsidies to multifamily, nonprofit housing providers to increase the supply of affordable rental housing;
- Expand federal rental housing assistance and increase the supply of housing vouchers to enable people to afford units in the private market; and
- Promote alternative housing arrangements that move beyond a simple rent-own binary, such as shared-equity housing, cooperatives, and options other than private, single-family homes.
Even with these initiatives, homeownership will remain a central means of building wealth. This is because it offers an opportunity to build equity from paying down a mortgage as well as a vehicle that can be leveraged to strategically raise other assets. In some, but not all markets, prices appreciate too. Recent declines in homeownership and household formation are a significant source of potential wealth loss. Accordingly, policies to support responsible homeownership should be pursued and include:
- Oversight of mortgage market to ensure the provision of appropriate products with reasonable terms, fair borrower risk assessments, and good income underwriting;
- Increasing access to home buying information and related financial knowledge, especially targeted to historically discriminated groups; and
- Incentives and support systems to help people to save for down payments.
Although many people prefer homeownership because it is associated with having roots in a community, it also involves real risks and must be approached with caution. Conceptually, homeownership should be treated as a “capstone” financial event, not a starting one. In the future, building a diversified balance sheet—with low levels of consumer debt and high levels of liquid savings—should precede and help sustain responsible homeownership.
New Pathways to Progress for the Next Generation
Creating new pathways to economic success for the next generation will undoubtedly be paved with investments in education. To promote generational equity and tilt the social contract to those earlier in life, policymakers should significantly expand investments in early, primary, and secondary education. Not only will this promote the development of human capital and enable social engagement, it will also serve as a foundation for future wealth.
Beyond education, policymakers can initiate several reform efforts to help the rising generations. Specifically, they can invest in their asset development; ensure that post-secondary college and training is accessible and affordable; create new, longer-term wealth-building opportunities; and support people as they strive to balance their family caregiving and work responsibilities.
New Pathways to Progress for the Next Generation
| Invest in the Next Generation’s Asset Development |
|---|
| Address the Rising Cost of College and Reduce Reliance on Student Loans |
| Promote New Sources and Opportunities to Grow Incomes and Build Wealth |
| Support Family Caregiving |
5. Invest in the Next Generation’s Asset Development
Young people need to accumulate resources they can tap strategically to take advantage of key opportunities over a life’s course. Public policy can assist by creating a public savings infrastructure to invest in the next generation’s asset development.
This infrastructure will be most effective if it includes everyone, is created as early in life as possible, features incentives to contribute, and remains with that person throughout life. For instance, beginning when children are born, they can be connected to a savings plan system and receive an initial seed deposit, ideally with a higher amount for those from lower-wealth families. The accounts can receive contributions from a variety of sources, such as family, employers, or government, so the accounts can grow over time. Accumulated resources can subsequently be leveraged for many social purposes, including post-secondary education, home purchase, business capitalization, and retirement security.
While a universal system of children’s savings accounts can provide a widely accessible and life-long foundation for savings and asset development, there are a number of different models that are being tested at various levels of government (Butrica 2015). Early account-based savings and asset development programs include:
- State-based 529 college savings plans, with progressive matching features. These existing tax-advantaged accounts offer a means to save for post-secondary education and training, but are largely used by wealthier families. A number of states have augmented their programs by providing an initial investment to anyone who opens an account and targeted matches for families with lower incomes (Boshara et al., 2009).
- Municipalities have begun to experiment with providing college savings accounts to their primary school students, including efforts in California led by Oakland Promise and San Francisco’s Kindergarten to College.
- Proposals at the federal level to create an account-based system that includes every child and targeted incentives to facilitate deposits have received bipartisan support in the past and continue to attract attention (Wallace-Wells 2018).
6. Address the Rising Cost of College and Reduce Reliance on Student Loans.
As the share of manufacturing and industrial jobs declined in the later half of the 20th century, the relationship between education and income changed. Those with college degrees saw their incomes rise relative to those with only high school diplomas. Concurrently, the educational landscape has dramatically changed. Today there are more institutions, more degree programs offered, much higher tuitions, and greater availability of student loans. Two trends have diminished the wealth returns, or “premiums,” on investments in college: rising costs and increased reliance on student loans.
Policy reforms should focus on ensuring that higher education is accessible, affordable, and not a financially risky proposition. A broad agenda should be pursued that includes the following components:
- Increase tuition subsidies available for lower-income students. The Pell grant has a track record of success but the amounts available have not kept pace with costs. The maximum grant level should be increased and rise with inflation. Eligibility criteria should also be expanded so more students can avoid relying on loans to attend college.
- Require greater transparency by educational institutions. Schools need to disclose and report on student outcomes that reflect on the quality of the educational experience they are offering. Disclosures should include the debt levels and income earnings of graduates.
- Ensure colleges and universities prevent excessive student debt. Along with rising tuition, there are underperforming institutions, which are relying on students assuming debt but not assuming accountability for their subsequent economic outcomes. Colleges should have some accountability or financial stake in a student’s economic success. Their nonprofit status should be contingent on minimizing unmanageable student debt loads relative to future earnings.
- Regulate for-profit educational institutions that rely on federal student loans. These underperforming institutions often look more like scams. The federal government can deny federal assistance to institutions with a history of poor student outcomes.
- Support more cost-effective alternatives to four-year degree programs, including community college, apprenticeships, and other meaningful certificate programs. The role of employers in providing training for their employees is largely overlooked. Employers should be expected to assume some of the responsibilities for the training that can power the workforce.
7. Promote New Sources and Opportunities to Grow Incomes and Build Wealth.
A rapidly growing number of workers can no longer command enough earned income to build sufficient savings and wealth. When this historic link between work and wealth is broken, policymakers and others must consider new ways to generate income and ownership from private, corporate, and public assets. There should be widely available alternatives to the leveraging potential of homeownership. As a matter of equity, those that don’t own homes should still have opportunities to build wealth; and homeowners need protection from the risk of drawing down their housing equity. The issue is what new “things” can be leveraged.
Here is a list of novel ideas policymakers should consider:
- Having an ownership stake in “common” assets, such as the air we breathe or the electromagnetic spectrum we rely upon for phone, internet, TV and public safety. For example, the state of Alaska has established a permanent fund managed by a state-owned corporation that pays out a dividend each year to its residents based on revenue raised in part by leasing public lands.
- Development of a “data dividend,” where individuals are paid for sharing their personal data. Since private firms are increasingly generating value from personal data, there are opportunities to charge a fee for fair use that could be collected and distributed through a public system.
- Encouragement for more widespread adoption of employee stock ownership and profit-sharing plans. While these ownership structures have a long track record, they might be energized by the recent benefit corporation (B Corps) movement, which adds social benefit objectives to traditional goals of profit maximization and shareholder value.
While each of these ideas has precedents that can be studied and assessed, more work is required to develop these ideas before implementation. Still, if implemented at scale, they reflect the promise of generating new wealth that can be widely shared.
8. Support Family Caregiving.
As economic pressure on households increase, it becomes harder to meet familial responsibilities to care for young children and other family members. Reducing the financial stress and burden of caregiving can support the formation of independent households and decisions to have children. The goal should be to support families with policies that get more money into households during the times when it is harder to work given other responsibilities. Three specific ideas that can accomplish this have recently received increased attention.
The first proposal is to offer paid family leave. While this benefit has gained traction in the private sector, it is usually limited to caring for newborns. It should be expanded upon to cover caring for spouses, siblings, and aging parents and grandparents. In the last three years, several states and the District of Columbia have adopted a paid leave program, while other jurisdictions have expanded the federal unpaid leave law. This is not enough. Federal policy must support a meaningful and widely available paid leave program.
The second policy idea is to build on the current system of delivering income support to working families with children and low incomes. The existing Earned Income Tax Credit does this already and it can be expanded in terms of its size and scope, especially for families with children. Several states and municipalities are already offering a tax credit to augment the federal policy.
The third idea is to create a universal family care system, funded through a single social insurance fund (Poo and Veghte 2019). Recognizing the need for a social safety net that responds to the complex realities of people’s lives, it would begin with early childcare and education, include paid family leave and medical leave, and offer long-term services and supports for the elderly. To help people with their caregiving responsibilities, there needs to be a mechanism to get money into the system over time. The social insurance framework would hinge on a universal structure where workers and employers contribute to a program across the life course so that people can draw upon it in times of need. It is an ambitious approach to address one of the most glaring gaps in our current social policy system.
References
Boshara, Ray, Margaret Clancy, David Newville, and Michael Sherraden. “The Basics of Progressive 529s.” St. Louis, MO: Washington University, Center for Social Development, and New America Foundation. 2009.
Butrica, Barbara. “A Review of Children’s Savings Accounts.” Urban Institute. 2015.
Calabrese, Michael. “A Universal 401(k) Plan.” Washington, DC: New America Foundation. 2007.
Cramer, Reid. “AutoSave: A Proposal to Reverse America’s Savings Decline and Make Savings Accounts Flexible and Inclusive.” New America. 2006.
Cramer, Reid. “The Saver’s Bonus: A Policy Proposal.” New America. 2010.
Emmons, William R, Ana H. Kent, and Lowell R. Ricketts. “The Demographics of Wealth: How Education, Race and Birth Year Shape Financial Outcomes.” Center for Household Financial Stability, Federal Reserve Bank of St. Louis. 2018.
FDIC. National Survey of Unbanked and Underbanked Households. 2017.
Howe, Neil and William Strauss. Millennials Rising: The Next Great Generation. New York: Vintage Publishers. 2000.
Huddleston, Cameron. “ 58% of Americans have Less than $1,000 in Savings.” GoBankRates.com. May 24, 2019.
Joint Center on Housing. “Demographic Change and the Remodeling Outlook.” 2016.
Pew Charitable Trusts. “American Families Face a Growing Rent Burden.” 2018.
Poo, Ai-jen and Benjamin Veghte. “The Big, Feminist Policy Idea America’s Families Have Been Waiting For: How Universal Family Care could help people throughout their lives.” New York Times. June 23, 2019.
Wallace-Wells, Benjamin. “Baby Bonds Proposal Could Transform the Reparations Debate. The New Yorker. December 6, 2018.
Weller, Christian. Retirement on the Rocks: Why Americans Can’t Get Ahead and How New Savings Policies Can Help, NY: Palgrave MacMillan. 2016.
More About the Authors

Yiling Zhang
Reid Cramer

Wesley Whistle
Project Director, Higher Education
Trina Shanks
Fenaba R. Addo
Colleen Campbell
Jung Choi
Brent J. Cohen
Cathy Cohen
William R. Emmons
Matthew Fowler
Thea Garon
Charlotte Hancock
Liz Hipple
Julie Hodgson
Anna H. Kent
Signe-Mary McKernan
Vladimir Enrique Medenica
Genevieve Melford

Ben Miller
Former Higher Education Research Director, Education Policy Program
Ida Rademacher
Caroline Ratcliffe