
Jordan Abbott
Senior Data Scientist, Education Funding Equity initiative
Public education, housing, and community welfare are closely connected. Housing policy and markets determine who can live in a neighborhood and attend its local public schools. Community factors including health, income, and employment affect the students learning in local classrooms, as well as the cost of local housing. Property values influence what tax revenue is available for schools. School quality affects the housing market in a neighborhood. Despite these connections, however, those focused on education policy rarely consult information about housing policy, or vice versa. Local socioeconomic indicators are important to both housing and education, but it can be hard to bring them into policy conversations.
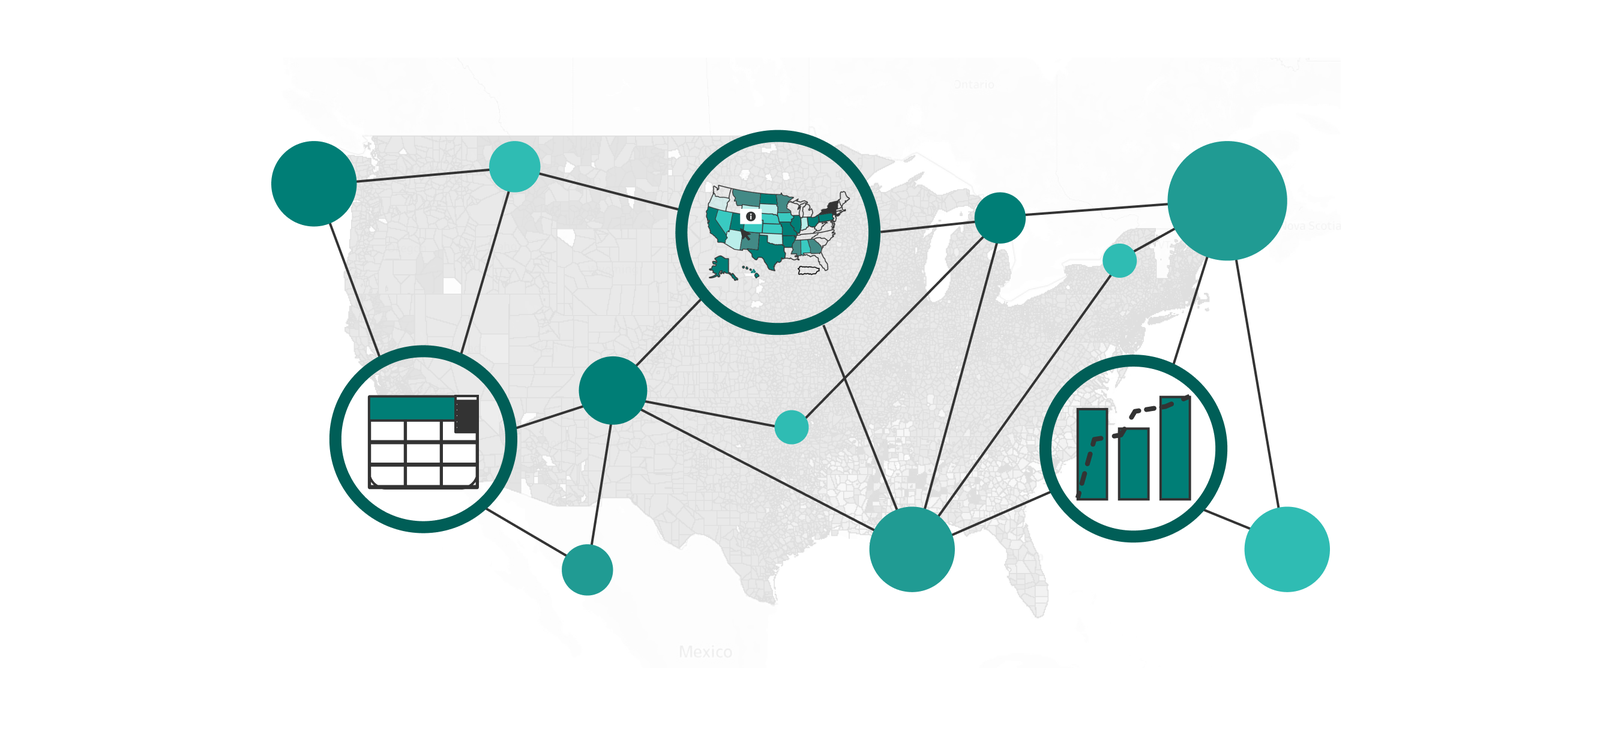
The Education, Community, and Housing Open (ECHO) Data Dashboard is meant to make that not only possible, but easy. It includes a wide range of national data related to education, housing, and community demographics and welfare. These data—available in map, table, and chart formats—are intended to inform and help shape the discussion and construction of social policy in states and communities, with no need for specialized analytical skills.
We hope this tool will help policymakers, advocates, journalists, and others to break down silos, build coalitions across issue areas, and more easily and effectively tackle complex and vital problems in their states and communities.
Featuring a range of national data related to education, housing, and community demographics and welfare, all data are presented at four geographic levels—school districts, state legislative districts, counties, and census tracts.
Each of the five scenarios below describes a hypothetical use case for one of the dashboard’s main intended audiences, showing how using the dashboard can strengthen the work and advance the goals of the group.
A public education advocacy group is pushing for an increase in state education funding. The ECHO Data Dashboard allows it to:
Housing Advocates
A housing advocacy group is behind a proposed state program that would subsidize the construction of affordable housing near public transit stops. Thus far, the campaign has focused on legislators who are already aligned with the group’s priorities on housing and transportation issues, but the advocates would like to reach new partners. Using the ECHO Data Dashboard, they:
Journalists
A reporter is writing an article about proposed school closures within the city. She’ll be going to a school board meeting to cover arguments for and against the proposal, but first, she would like to draft the other elements of the story, especially how neighborhood factors might interact with the closures to affect different communities in the city. Using the ECHO Data Dashboard, she:
Policymakers
Senior members of the education committee have become concerned about high rates of student absenteeism in the state’s public schools. They have heard from superintendents that absenteeism is often caused by health factors in the community, particularly chronic conditions like asthma. Committee staff put together a proposal for a bill that would provide grant funding for school-based asthma clinics, additional school health personnel, heating, ventilation, and air conditioning, or HVAC, modernization to improve school air quality. Using the ECHO Data Dashboard, committee staff members:
Public Interest Litigators
A public-interest law firm is representing a group of families in a lawsuit arguing that their children’s school districts, which serve high-need populations, are underfunded by the state. The lawyers use the ECHO Data Dashboard to find community welfare data for the school districts that provides evidence for their greater costs, like the following:
This document lists all the variables included in the dashboard and their definitions. It also describes all data sources and data cleaning methods.
Senior Data Scientist, Education Funding Equity initiative

Project Director, Education Funding Equity Initiative