Table of Contents
- Executive Summary
- Introduction: Past, Present, and COVID
- Methodology and Definitions
- Housing Loss and Poor Data
- Housing Loss in the United States: Our National Rankings and Maps
- Housing Loss in Forsyth County, North Carolina
- Housing Loss in Maricopa County, Arizona
- Housing Loss in Marion County, Indiana
- Policy Recommendations
- Conclusion
Housing Loss in Maricopa County, Arizona
“We are so short on inventory that you either move in with somebody, you move back home, or you're homeless” – Community Development Corporation Employee1
Introduction
For several years now, Maricopa County, Arizona has ranked as the fastest-growing county in the U.S., adding over 80,000 new residents in 2019 alone. This influx comes as many already living in the region face increasing levels of housing instability, further exacerbating the crisis.
How is this rapid growth bound up with housing, a fundamental human right that for so many across the United States is under threat? In the desert metropolis of Maricopa County, Arizona we worked for a year to find out.
Researchers from New America’s Future of Property Rights program teamed up with Arizona State University’s Knowledge Exchange for Resilience Center to analyze five years of Maricopa County eviction and mortgage foreclosure data. We also interviewed government officials, housing advocates, real estate developers, journalists, lawyers, service providers, and community members to gain an in-depth understanding of local issues related to housing loss. We wanted to know how often residents lose their homes—whether through eviction, mortgage foreclosure, or another mechanism; who is most at risk of losing their home; where within the county this loss is most acute; why people are losing their homes; and what happened after they did. These interviews culminated in an accounting of how individuals are losing their home, who is most at risk, and what happens after they are displaced.
However, in the midst of completing this research, the world changed. As the COVID-19 pandemic swept across the United States, it rapidly became clear that we would release this report at a time when millions of Americans are without jobs and at risk of losing their housing. This report became more than a way to show historic housing loss, but a tool city leaders could use to better predict where the hardest-hit neighborhoods of their city may be.
It is clear that the root causes of housing loss are only being exacerbated by the COVID-19 crisis in Maricopa County. And as many have predicted, the wave is coming: on October 31 the state eviction moratorium will expire, and without any further intervention, evictions will resume. On September 1 the Centers for Disease Control (CDC) announced a nationwide ban on evictions until the end of the year. However rent will still be due on January 1, and thus far the government has not offered rent forgiveness and only limited relief.
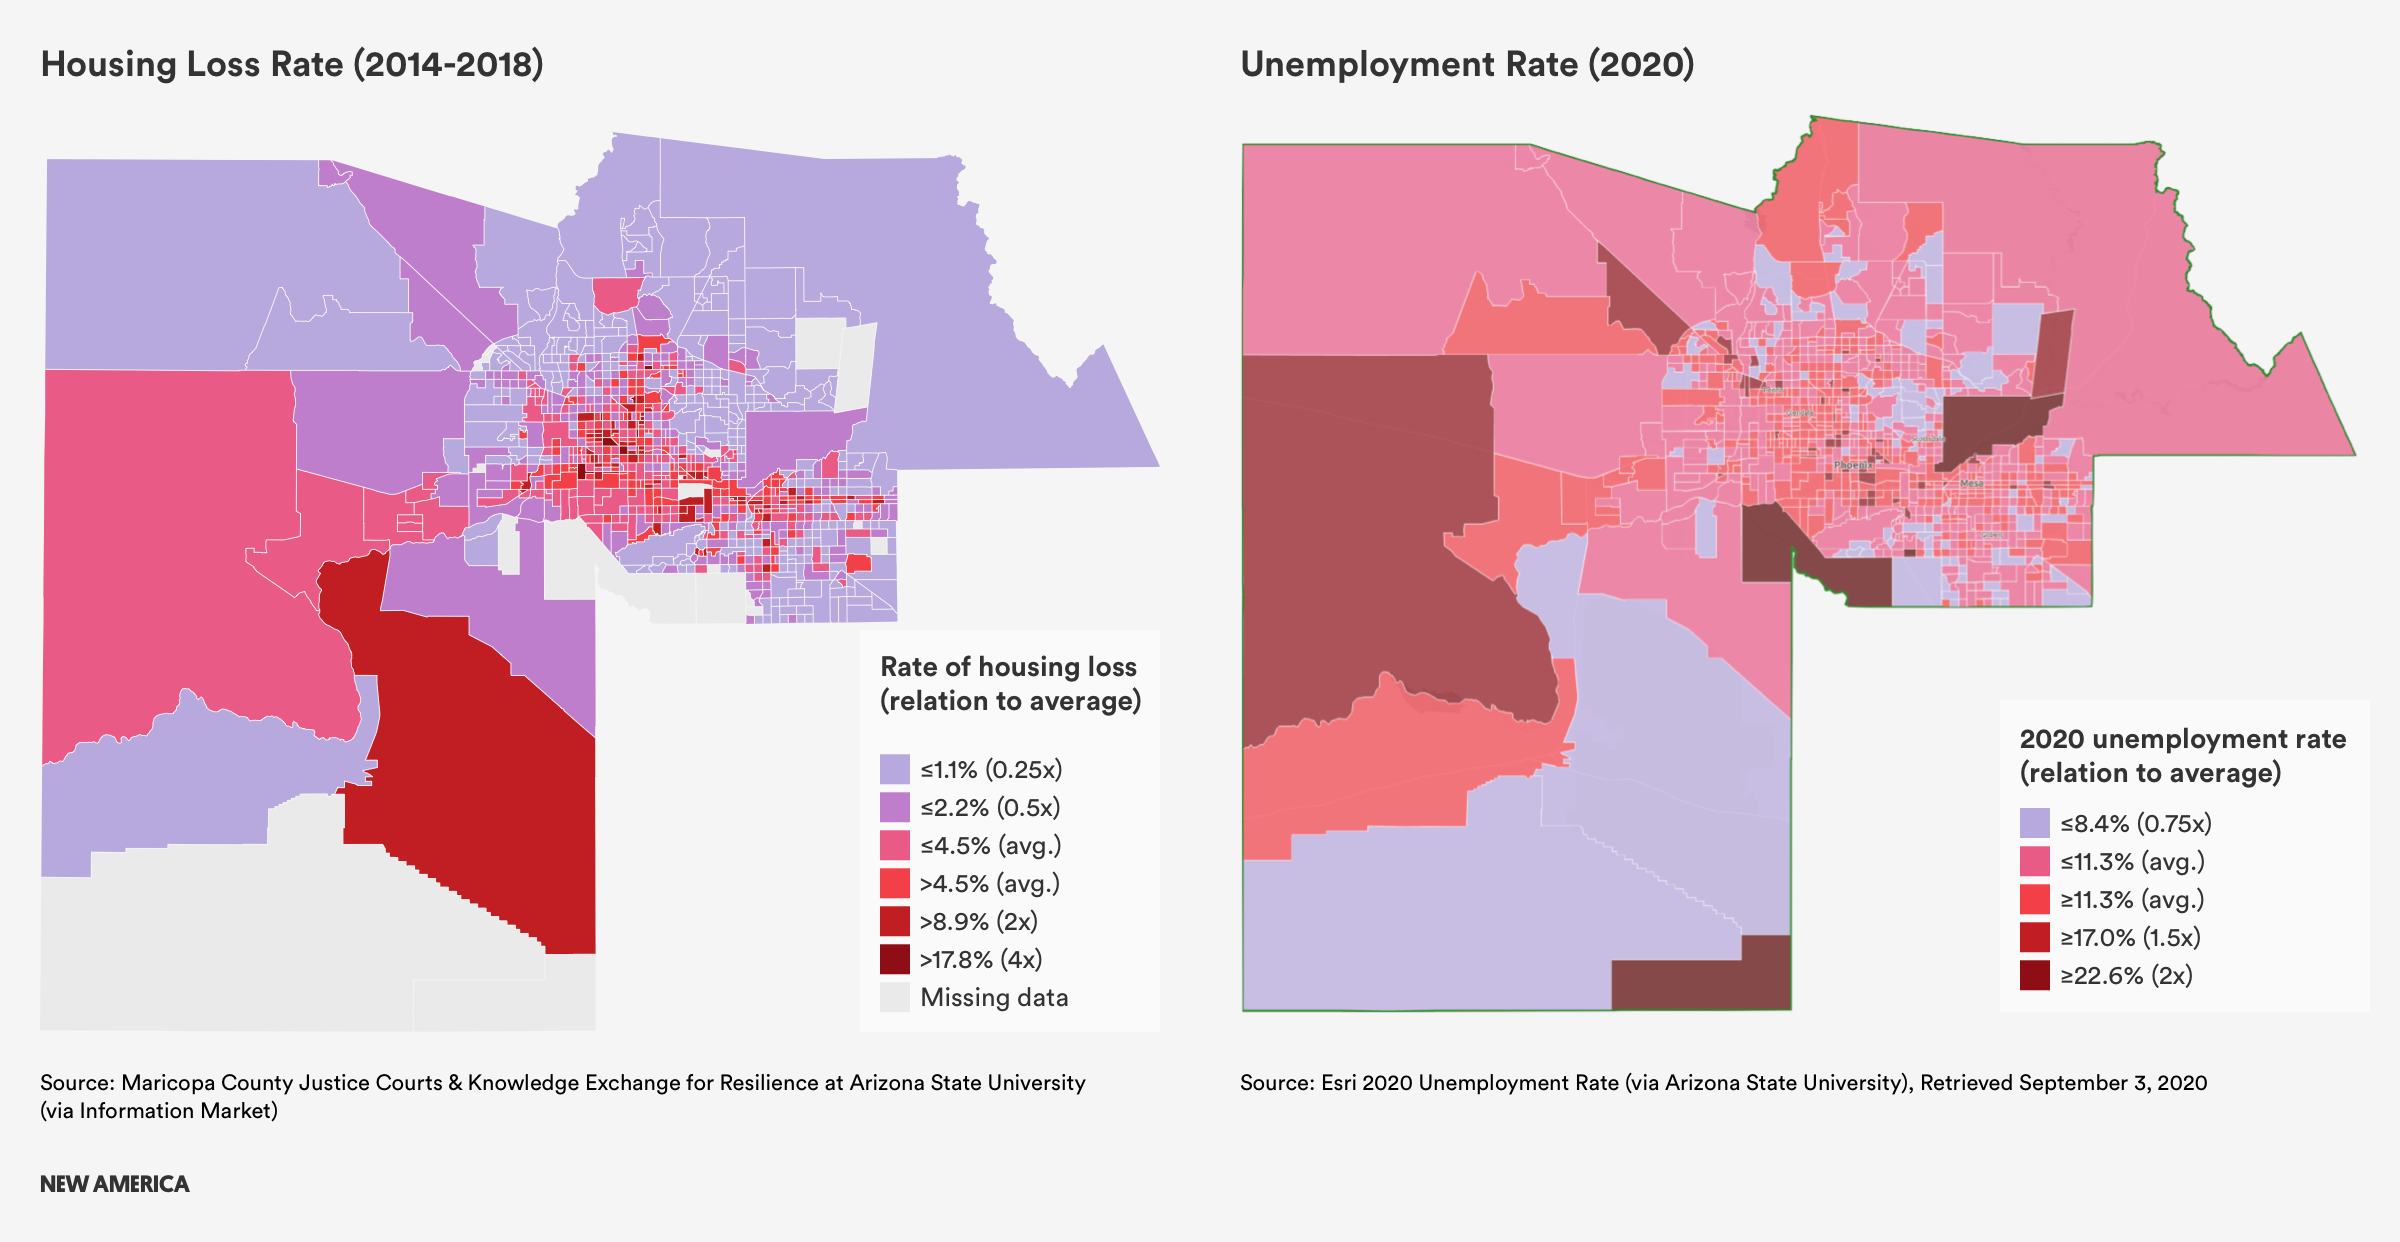
For several months the U.S. Census Bureau has been conducting a weekly Household Pulse Survey focused on tracking the fallout from the pandemic. In the Phoenix/Mesa/Glendale metro area, the Pulse Survey conducted between July 16 and July 24 found that 27 percent of households were housing insecure, meaning that they either missed their rent or mortgage payments last month or believe they will not be able to pay this month, and 52 percent of households reported that at least one person in their household has lost employment income. Further, the Bureau of Labor Statistics reported in June that Maricopa County had an unemployment rate of 9.7 percent, more than double the rate in June of 2019. Taken together, it is clear that this economic snapshot does not bode well for already struggling households in Maricopa County.
The Maricopa Association of Government has mapped which zip-codes have been hit by job loss as a result of the pandemic. Zip codes with high job loss often overlap with tracts of high housing loss, particularly in Buckeye; between downtown Phoenix and Glendale; and South Phoenix, Guadalupe, and Tempe near Sky Harbor International Airport. The hardest-hit zip codes east of the airport had between 7,000 and 10,000 unemployment claims between March 14 and July 30, and also had 2014-2018 eviction rates as high as 14 percent, and housing loss rates more than double the county average.
The pandemic may have shone a light on housing loss in Maricopa County, but as this report shows, the crisis has been there all along.
Background and Context
Four and a half million people, or 60 percent of Arizonans, live in Maricopa County, the fourth most populous county in the United States. The county’s recent population growth is an echo of the past, and aligned with the “boom and bust” cycles of the historic American Southwest. Between 1900 and 1940, the region saw significant Latinx immigration as cotton farming, the Mexican Revolution, and World War I drove migrants north. According to a local expert, over the next few decades, cities throughout Maricopa County saw their population boom, creating a bustling metropolitan region in the middle of the Sonoran Desert, as unionized factories moved away from the Northeast and Midwest to states with fewer labor laws, like Arizona.
The rapid growth of the region, however, has been characterized by discrimination. Black, Indigenous, and Latinx residents faced racial discrimination in housing, education, and employment throughout the twentieth century. Redlining also prevented Black and Latinx families from purchasing homes in many areas throughout the county. In Phoenix, redlining restricted these families from acquiring property in the north side of town, keeping communities of color segregated to the south of Van Buren Avenue.
These same neighborhoods were located in an area of Phoenix that was eventually filled with environmental and toxic hazards, including industrial waste facilities, factories, freeways that broke up neighborhoods, and airport noise pollution. For decades residents have fought against the siting of toxic hazards in South Phoenix, grappled with the uneven impacts of the 2008 recession, and are now worried about the potential for the expansion of the light rail to drive gentrification and widespread displacement of long-existing local business and residents.
South Phoenix is not the only area of the city undergoing transformation. As Maricopa County’s economy has diversified after the Great Recession, knowledge workers have flooded into the growing secondary education, finance, and technology sectors. These sectors now make up three-fifths of the regional economy, which is home to U-HAUL, Best Western, the electronic giant Avnet, as well as a regional headquarters for Chase Bank. Universities also maintain a large and growing presence in the county, most notably Arizona State University, and also the University of Arizona, Northern Arizona University, for-profit University of Phoenix, and for-profit Grand Canyon University.
This economic growth must be contextualized alongside continuing socioeconomic challenges. A large wealth gap and income disparity continue to worsen, with many people either working for minimum wage in the service sector, or in high-income knowledge-based sectors. Those working minimum wage jobs may then struggle to not only afford housing, but also the unique costs of living in the desert. With summer temperatures reaching well into the triple digits, the costs of cooling can be astronomical, and are a barrier for many families remaining stably housed throughout the year. As summer becomes hotter as a result of climate change, the need for A/C will only become more acute, and the danger of going without it will increase.
Development in the county is sprawling, and most residents own cars. Various stakeholders noted economic and racial/ethnic disparities between the lower-income West Valley and the higher-income East Valley. For those who cannot afford a car, lack of public transportation poses a significant barrier to employment and mobility.
These challenges contribute to complex drivers of housing insecurity throughout Maricopa County. Various key informants described residents as individualistic, entrepreneurial, and optimistic, but lacking a true sense of community. Indeed, Maricopa County has long contained a large transient population: seasonal workers from Mexico; snowbirds; college students; and young, out-of-state workers who stay for a short time.
Arizona is increasingly a “purple” state, partly due to changing demographics. Major cities such as Phoenix are largely Democratic, while smaller communities are Republican. Nonetheless, the Arizona State Legislature is usually controlled by the Republican Party, and does not prioritize publicly funding social services, affordable housing, or education. Similar to dynamics in both Indiana and North Carolina, the state legislature is known to pass preemption laws that prohibit more liberal housing policies at the county and municipal levels. Developers, landlords, and their lobbyists are a powerful political group in the state.
How, Where, and When Are People Losing Their Homes?
According to our analysis, Maricopa County experienced a housing loss rate (accounting for both evictions and foreclosures) of 4.5 percent between 2014 and 2018. During this five year period, the county had 317,036 eviction filings, which resulted in over 218,000 evictions. Over 17,500 households also lost their homes as a result of mortgage foreclosure during our study period, resulting in a foreclosure rate of 2.9 percent. When broken down, this amounts to the displacement of over 47,000 households each year.
Further, while not included in our housing loss index, insights provided by our key informant interviews highlighted that there is also some housing loss occurring as a result of the redevelopment of mobile home parks. Our correlation analysis revealed a weak, but positive, association between the share of residents living in mobile homes and both eviction and foreclosure rates. The complex ownership tenure of mobile home residents, who may own their house, but rent the land, or rent both their house and the land, creates difficulty in interpreting this data.
Eviction: The overall eviction rate for Maricopa County is 6.2 percent, although rates for several census tracts range between 20 and 30 percent. According to ACS data, renters represent 40 percent of all households, and evictions account for over nine-tenths of all housing loss.
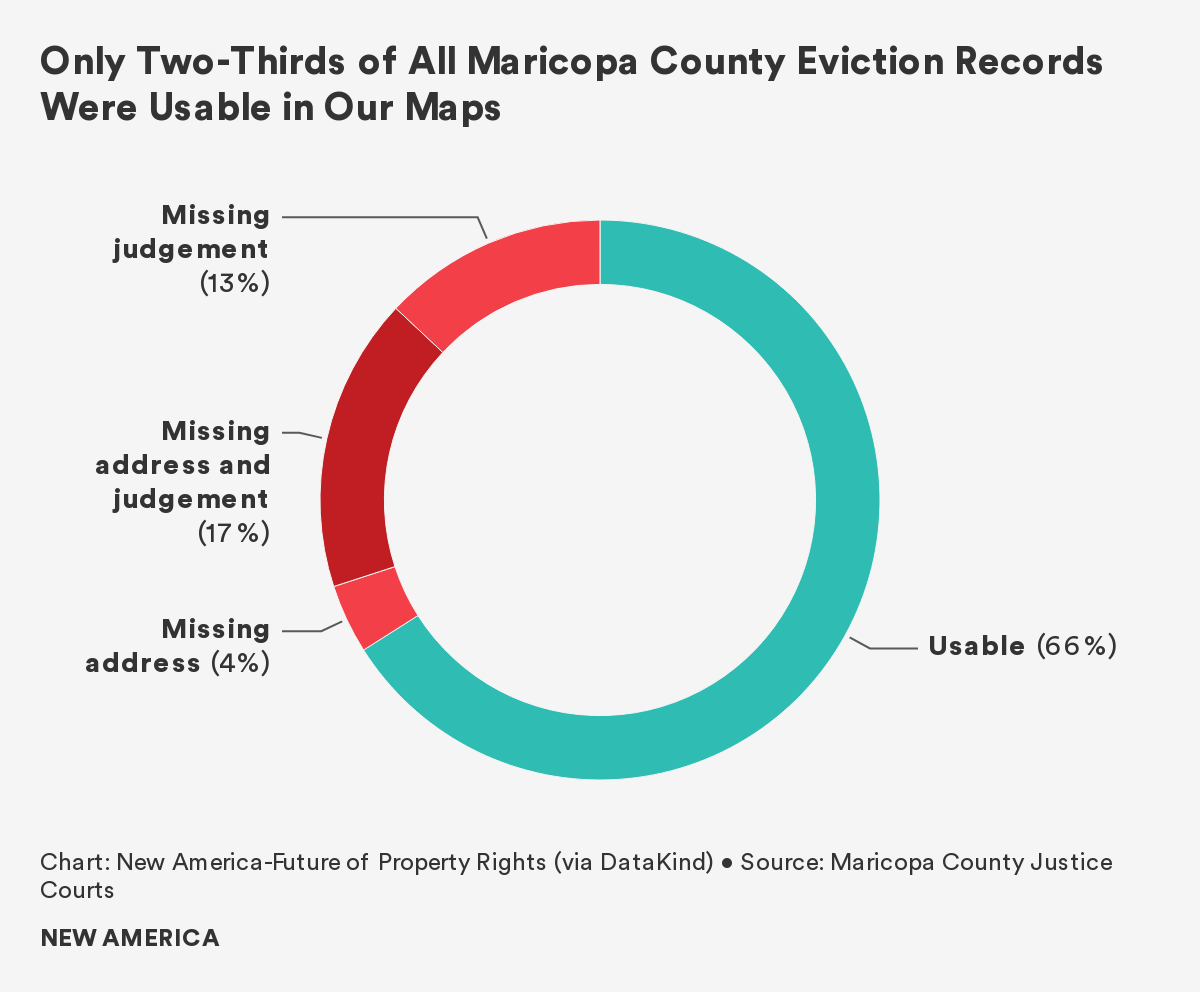
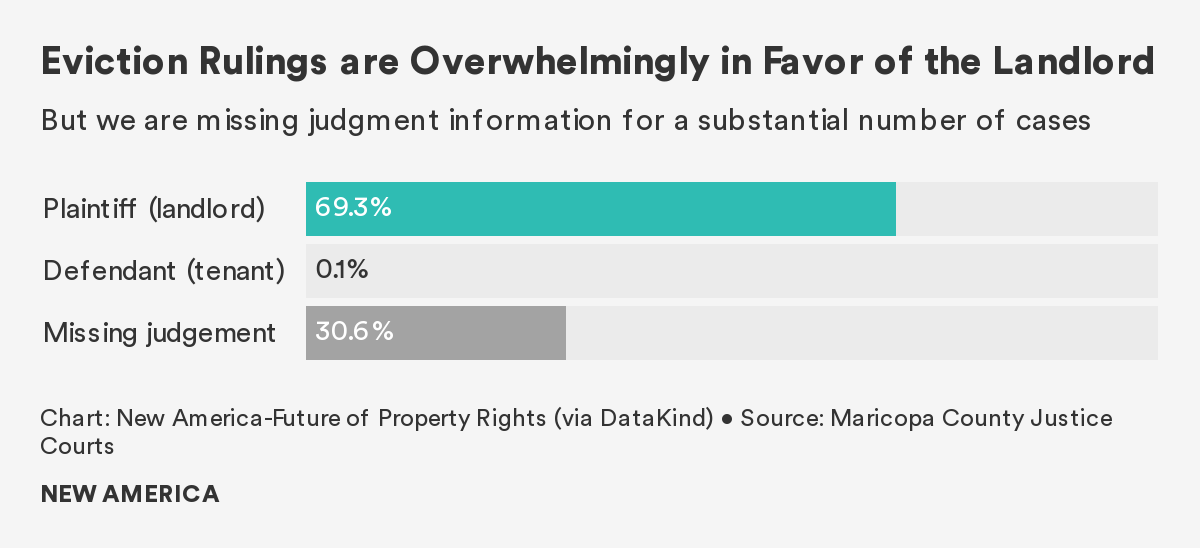
It should be noted at the outset that significant gaps in the county’s eviction dataset led to incomplete analysis. One in three eviction records between 2014 and 2018 are missing court case judgment information, so we could not determine if the tenant was ultimately evicted. These records are not included in our eviction rate calculation. And 21 percent of records were missing an address, so while these records were included in our topline eviction rate calculations, we could not geocode these records and they are not included in our census tract-level heat maps.
Local experts indicated that the most common reason for eviction in Maricopa County is nonpayment of rent. Yet tenants in Arizona can also be evicted for violating a lease agreement and failure to maintain the premises. One major violation of lease agreements that impacts low-income renters in Phoenix is the failure to pay for utilities. During the summer months, temperatures rise to well above 100 degrees, and the cost of keeping housing units cool can be enormous. The average cost to cool a home in Phoenix during the summer is $477, the most expensive rate in the country. For a family already spending more than 30 percent of their income on rent, this extra cost adds a layer of economic vulnerability that can lead to housing loss.
Further, because Arizona does not have “just cause” eviction laws, landlords can refuse to renew a lease without cause. Despite the protections that do exist, including laws outlining the specific grounds that allow landlords to file for eviction, evictions still contribute significantly to housing loss in Maricopa County.
Tenants who are evicted may struggle to find new housing, as some landlords will not accept tenants who have a recent history of eviction on their record, or who have low credit scores. This may force tenants to find substandard housing, for lack of alternative housing options.
Many tracts with the highest rates of eviction are located in the cities of Glendale, Phoenix, Tempe, Mesa, and Apache Junction.
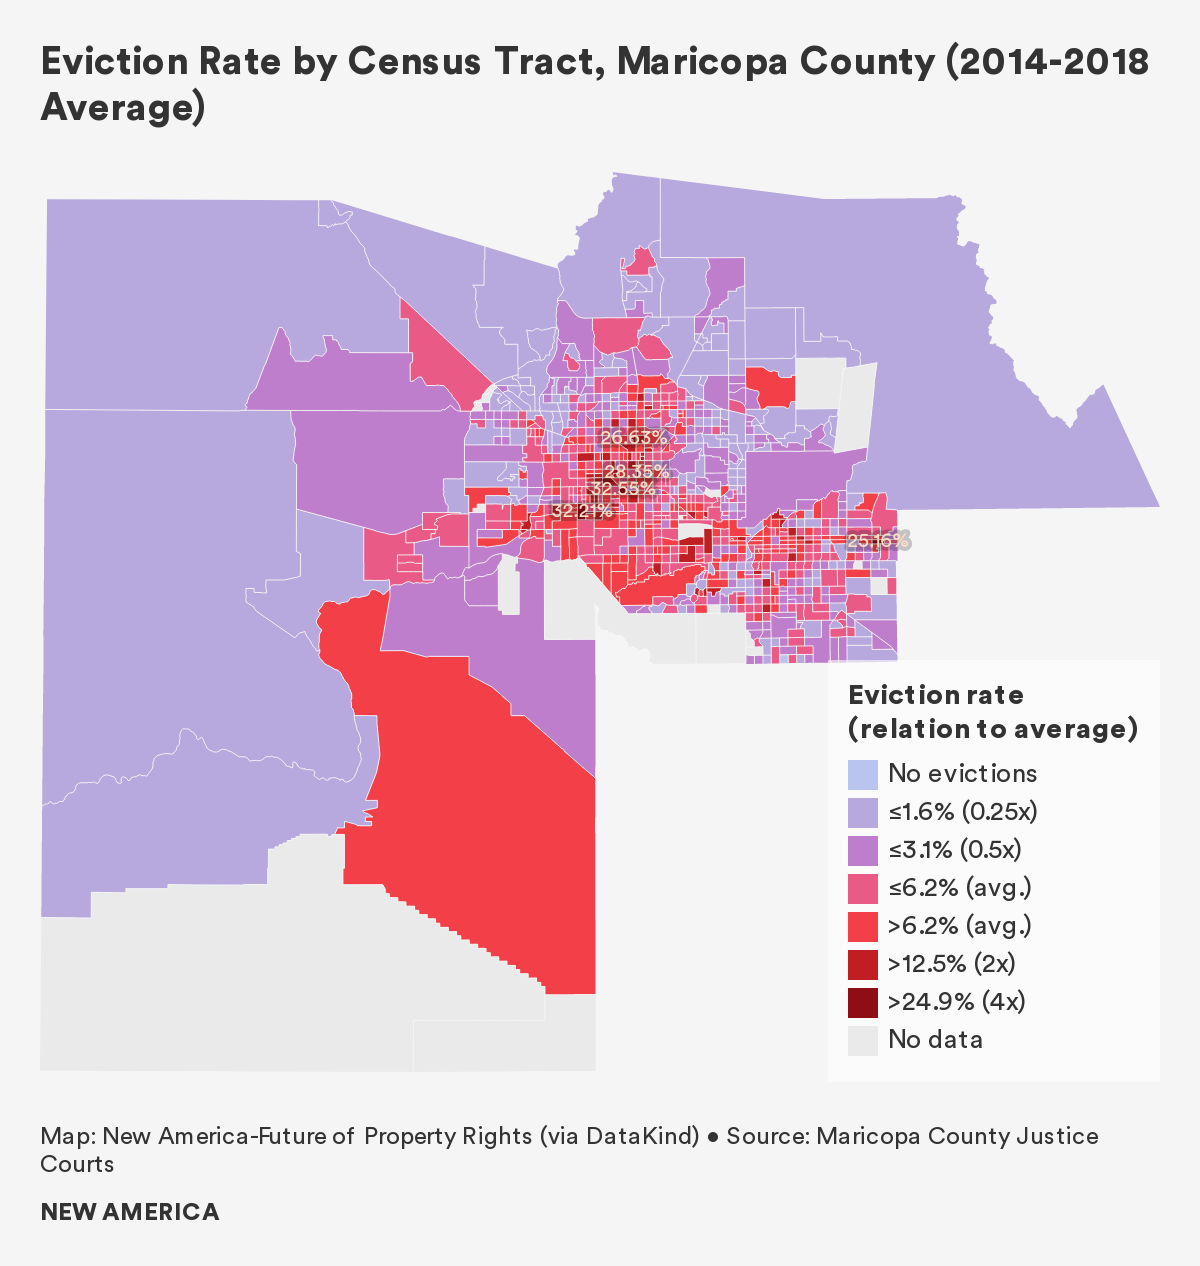
The census tract with the highest eviction rate is located between downtown Phoenix and the City of Glendale, in the Maryvale neighborhood of West Phoenix. This tract, in which over 85 percent of housing units are renter occupied, expressed an eviction rate over 32 percent between 2014 and 2018. According to ACS five-year data (2012–2016), over 30 percent of residents in this tract live below the poverty line, 68 percent of households are Latinx, and 13 percent are Black. Both of these populations are overrepresented in this tract, as throughout the county 30 percent of residents identify as Latinx and just over 5 percent identify as Black or African American. The University of Minnesota’s displacement mapping project found that there was an increase of over 300 vacant units in the tract between 2000 and 2016, despite the fact that over 13 percent of all housing units are overcrowded. This may be explained by the high cost of housing compared to the income of residents, as over 30 percent of all households are severely rent burdened.
The tract with the second highest eviction rate in Maricopa County lies in the Westridge Park neighborhood of Phoenix, and also reports an eviction rate over 32 percent. According to ACS data, over 60 percent of households in the tract are rent-burdened, and over 14 percent of housing units are designated as overcrowded. Demographic data also shows that 30 percent of residents living in the tract were not born in the United States, 46 percent live below the poverty line, and over 60 percent are Latinx.
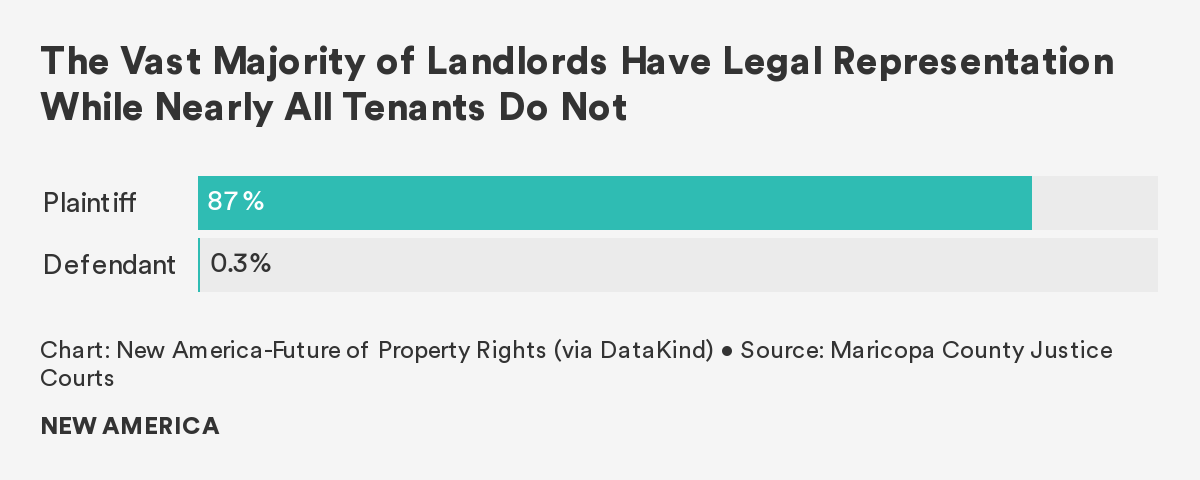
Our research also found that most tenants in Maricopa County lack access to legal counsel in small claims court, which translates into stark disparities in eviction case judgments. Based on available data from the Maricopa County Justice Courts, 87 percent of landlords have legal representation, compared to just 0.3 percent of tenants, resulting in 99 percent of cases with judgment information being decided in favor of landlords.
Mobile Home Park Redevelopment
The topic of displacement from mobile home parks in Maricopa County came up during several conversations with key informants. Mobile homes remain a popular, if often last-resort, housing type for over 70,000 households in Maricopa County due to their low monthly average cost of $700. In recent years, however, there have been many reports of investors purchasing parks for redevelopment. According to the Arizona Republic, investors have spent more than half of a billion dollars buying up mobile home parks in the region since 2017.
Mobile homes account for a significant percentage of some communities’ housing stock. In Mesa, 10 percent of all houses are manufactured, putting many residents at risk if their lots are redeveloped. In June 2020, Washington, D.C.-based investor group Carlyle paid over $230 million to purchase four of the older parks in Mesa, removing over 1,000 housing lots from the market.
In nearby Tempe, 42 families were displaced in 2018 when their park was sold to a developer. While residents were offered $7,500 as a relocation payment, it was not enough for some families and they were forced to abandon their homes.
Mortgage Foreclosure: The Valley of the Sun was the hardest-hit metro area during the Great Recession. Homes in Phoenix dropped 56 percent in value before foreclosures swept across the city. While some current renters may be able to purchase homes, post-2008 recession anxiety keeps many from entering or reentering the homeownership market. An expert working for a local housing nonprofit shared that he thought previous homeowners who lost their houses during the recession were terrified of owning homes again. Clearly, the impact of mortgage foreclosure can be long-term, with lasting psychological effects accompanying physical displacement.
Mortgage foreclosure rates in Maricopa County ranged from 0 percent to 7 percent between 2014 and 2018, with an average foreclosure rate of 2.8 percent. The majority of tracts indicated average foreclosure rates between 0 and 1 percent, although tracts toward the southeast and southwest portions of the county, as well as those closer to the city center of Phoenix saw rates between 4 percent and 7 percent.
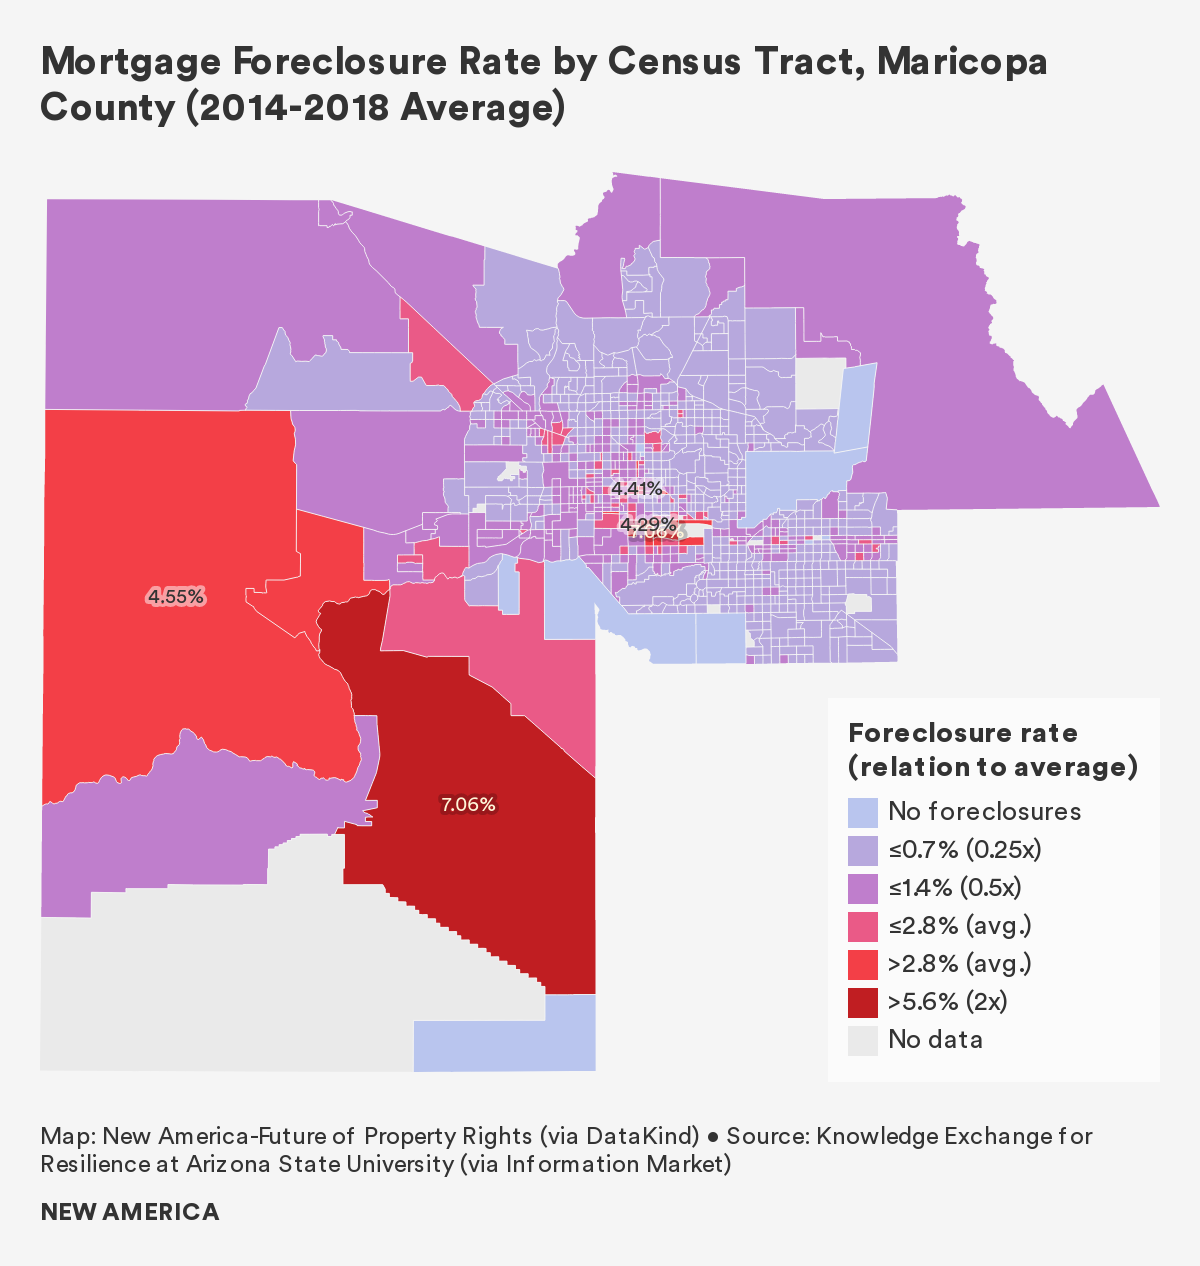
A localized hotspot of foreclosures exists to the north, south, and west of Sky Harbor International Airport, with tracts displaying rates between 3 and 7 percent. The University of Minnesota displacement mapping project found a significant net change of low-income residents in this area of the county. The tract directly south of the airport shows a 14 percent loss of low-income households between 2000 and 2016, in addition to a 4.1 percent foreclosure rate, which is almost one and a half times the county average. Another tract, directly north of the airport, expressed a foreclosure rate of above 3 percent, and saw the number of rental units increase by 344.
These tracts tend to have high percentages of non-white residents: The tracts with the highest rates of mortgage foreclosure were each comprised of over 50 percent Latinx residents.
Parts of Phoenix with the highest foreclosure rates coincide with previously redlined neighborhoods, providing evidence of the long-term impacts of the race-based planning decisions that Black and Latinx community members have lived with for generations.
There are also several large tracts in southwest unincorporated Maricopa County and in the City of Buckeye that have foreclosure rates between 4 and 7 percent. Unlike the tracts in urban Maricopa County, the population of this rural part of the county tends to be whiter and hold proportionate percentages of Latinx residents. According to census data, of the three high loss tracts in southwest Maricopa County, only tract 506.04 has a higher percentage of Latinx residents than the county average. However, almost 40 percent of residents in the tract, which has one of the county’s highest foreclosure rates at 7 percent, earn less than $14,000 per year.
Our Housing Loss Index in Maricopa County:2 In order to measure housing loss that includes both evictions and foreclosures, we first calculated each census tract’s housing loss rate. The housing loss rate combines the total number of evictions and the total number of mortgage foreclosures in a given census tract, and then normalizes that sum by the total number of renters and the total number of homeowners with a mortgage within the census tract.

We then converted the housing loss rate into a housing loss index by comparing a given census tract’s housing loss rate to the county average. A census tract with a housing loss index of 1 experiences a housing loss rate equal to the county average, while an index of 3 indicates that the tract experiences a housing loss rate that is three times the county average.
Maricopa County has a housing loss rate of 4.5 percent. Tracts with the highest housing loss rates tend to be located in urban center of the county, through the cities of Phoenix, Tempe, and Mesa, all the way to Apache Junction. Yet one tract to the southwest of Phoenix, which includes the North and South Maricopa Mountains Wilderness areas, as well as the Sonoran Desert National Monument, possesses a housing loss rate of 2.7 percent. This tract has an eviction rate of 12 percent, and a foreclosure rate of 7 percent.
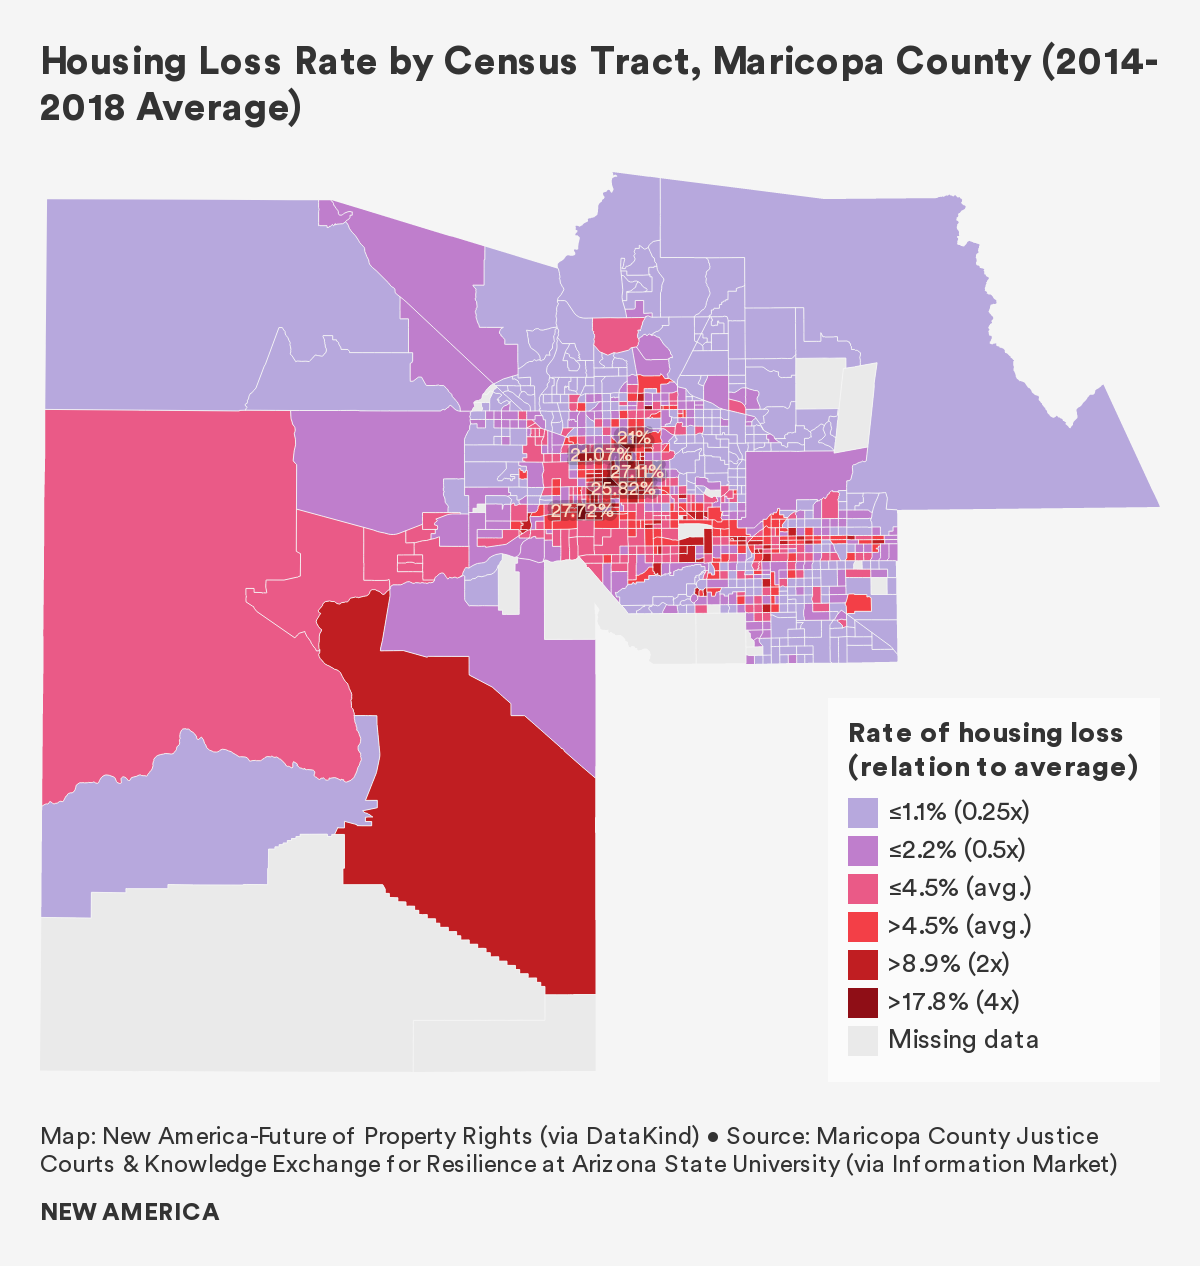
The census tract with the highest housing loss rate, 6.2 times the county average, is located in the Westridge Park neighborhood of South Phoenix. Tract 1125.09 is 65 percent Latinx, more than double the county average, and 44 percent of residents live below the poverty line.
The tracts with the second and third highest rate of housing loss are located in the Alhambra neighborhood of Phoenix. Tract 1068.01 has a housing loss rate tat is 6.1 times the county average and is home to a population with a median household income of just over $23,000, resulting in 43 percent of households living in poverty. The third highest loss tract, 9200, has a housing loss rate of 5.8 times the Maricopa County average, and is bisected by Grand Avenue and neighbors the for-profit Grand Canyon University (GCU). Local experts indicated that GCU was causing localized gentrification, however, more research is needed around the issue. According to ACS data both tracts have high percentages of non-white residents, low rates of homeownership, and substantial numbers of residents suffering from rent-burden.
While foreclosures rates are less than 3 percent in all three highest-loss tracts, eviction rates of over 28 percent push them to the top of our index.
Who is Losing Their Home?
“… When a child gets sick at school, and parents are single, they have to oftentimes go home, which means leaving work so they are very vulnerable to losing their job.” – Local Nonprofit Organization Employee3
Census tracts with predominantly Black or Latinx households had higher rates of eviction, foreclosure, and combined housing loss than census tracts with predominantly white households.4 However, citizenship status appears to be more strongly correlated with high housing loss—and in particular evictions—than race. Language barriers, predatory rental practices, and a reluctance to engage with the government could all be contributing to this dynamic. Additionally, interviews across all of our case study locations suggest that undocumented tenants are often informally evicted, with little recourse.

We found higher rates of housing loss—and in particular foreclosures—in census tracts where residents lacked health insurance. Many low-paying jobs do not provide health insurance, and this finding suggests that these at-risk households cannot pay for housing and medical treatment following an unexpected emergency. This finding is all the more salient in the context of the COVID-19 crisis.
Census tracts with a larger share of single-parent households had higher rates of eviction.5 A lack of two incomes, the high costs of childcare, and difficulties in maintaining steady employment amid other responsibilities may contribute to this relationship.
Tracts with more households that commute to work on public transit had higher rates of eviction. Based on interviews, dependence on unreliable public transportation can lead to repeated tardiness or absence from work, job loss, and a subsequent inability to pay rent.
Finally, as monthly housing costs and incomes rise, housing loss rates—and in particular foreclosure rates—fall. This finding is unsurprising, as wealthier households can rent or buy more expensive homes and usually do not struggle to pay monthly housing costs. This may also be attributed to the ability of wealthier households to build adequate savings and invest in wealth building that is not tied to property ownership.
Why are People Losing Their Homes?
“They don't have the means by which to save any money for a rainy day or if an emergency arises. And then the rents are going up as well.” – Local Nonprofit Organization Employee6
While interviewees mentioned several factors contributing to housing insecurity, the three factors discussed most frequently were lack of livable wages, an affordable housing shortage, and limitations from fixed incomes. Other insecurity factors include out-of-town real estate investors, vacation and short-term rentals that put pressure on housing stock, and the availability and conditions of seasonal and farm worker housing.
Low Wages: During key informant interviews, a lack of livable wages was the most frequently-cited factor contributing to housing insecurity. Wage growth in the county between 2018 and 2019 has been strong at 3.8 percent, yet the minimum wage in Arizona is currently $12 per hour, well below the estimated need for many households with children. The average cost of a two-bedroom apartment in the county is above $1,000, roughly double what minimum wage workers could afford.
The types of new jobs added to the economy in recent years do not adequately support low- and semi-skilled workers. While the recent increases in high-skilled technology, healthcare, and higher education jobs are reviving the local economy, they leave many long-term Phoenix residents behind. Middle-income jobs in the construction industry have decreased by 45 percent since 2010, and many service sector jobs never returned after the Great Recession.
According to the Arizona Department of Housing, in the city of Phoenix, workers must earn over $20 per hour to comfortably afford the cost of living. Those who work in retail, as teachers, or in food service do not earn a wage high enough to afford housing.
Households earning a minimum wage may also be unable to save money for emergencies, creating a precarious situation in which they are, according to a local interviewee, “a flat tire away from being homeless.”
Affordable Housing Shortage: The state of Arizona has a 153,331 unit shortage of affordable housing for extremely low-income households. During the last ten years, home prices throughout the county have increased by 83 percent. This, combined with low wages, results in 45 percent of Phoenix Metro Area renters being rent-burdened.
At the same time that housing costs in Maricopa County are rapidly increasing, Arizona has prevented local governments from adopting rent control measures that might help support lower-income households, setting the stage for landlords to drastically increase rents for tenants.
In some census tracts, particularly south of Sky Harbor International Airport, between 2011 and 2017, rental housing costs have increased by 20 percent, while median incomes have decreased by over 20 percent. Notably, this is the same area of South Phoenix that was redlined during the 1930s, showing the consequences of systemic racism for Black and Lantix communities. We found that in this area, eviction rates are between 10 and 20 percent, and foreclosure rates range between 3 and 7 percent, some of the highest in the county.
Despite the clear need for more affordable housing, the state does not allow any level of government to adopt inclusionary zoning programs. These types of policies could require market-rate builders to fund or construct affordable housing, but, as a result of state preemption, cities are limited in the tools they have at their disposal for creating permanent affordable housing.
Further the large number of migrant farm workers in Maricopa County poses a unique challenge for officials. Farm workers on the H-2A Visa program are often dependent on their employer for housing. If a farm worker loses their job, they are likely to lose their housing, regardless of whether the housing was fit for habitability in the first place. With little money, and precarious legal standing, farm workers may face homelessness, overcrowding, or displacement to their country of origin.
Wall Street, Tourism, and the Maricopa County Real Estate Market
Outside actors have significantly shaped the real estate market in Maricopa County, sometimes for the worse. Several stakeholder groups were mentioned across interviews, all contributing directly or indirectly to the affordable housing crunch and displacement. These stakeholders include out-of-state investors, the short-term rental industry, and snowbirds, or part-time residents:
- Out-of-State Investors: A report from real estate firm Redfin found that over 30 percent of all prospective homebuyers in the Phoenix metropolitan area were from other U.S. regions, with the largest share from California. Further, in 2019, 14 percent of all home sales in the Phoenix metro area were attributed to real estate investors.
According to local experts, these real estate investors often flip properties into unaffordable high-end rentals. Current tenants are often displaced through large increases in rent, or non-renewal of lease agreements. Other interviewees discussed single-family home investments purchased through real estate investment trusts. According to our interviewees, large Wall Street investors are more likely to evict their tenants, as they are far removed from the Phoenix area and are unlikely to develop any relationship or rapport with their renters.
Sales of foreclosed homes and tax liens also present a lucrative opportunity for real estate investors. A 2017 Arizona Republic article found that between 2010 and 2016, 74 percent of tax lien sales were purchased by out-of-state investors, who then proceeded to foreclose on hundreds of families across the valley. Some of these investors included large banks like JPMorgan Chase and Bank of America, consolidating the number of unique investors purchasing tax liens from over 500 in 2010 to 200 in 2016.
- The Short-Term Rental Industry: In 2017, 44 million tourists visited the greater Phoenix area, spending $7.8 billion. These visitors require lodging, and often turn to short-term rental options such as Airbnb or VRBO. Across Maricopa County, there are more than 12,000 active short-term vacation rentals, with high concentrations in Phoenix, Tempe, Scottsdale, and Mesa. Eighty-two percent of these rentals are for an entire home, rather than a single room, indicating that many properties are unavailable for long-term lease agreements. In total, over 730,000 visitors stayed in Maricopa County Airbnbs in 2019, roughly 200,000 more visitors than the next most visited county in Arizona.
While these rentals are taking away from the needed housing stock throughout the county, local governments are unable to limit their use. In 2016, Governor Doug Ducey signed Senate Bill 1350, which prohibits any attempt of municipalities to restrict short-term rentals.
- Snowbirds: Similar to the short-term rental industry, snowbirds, or part-time residents in the county, occupy a significant amount of the current housing stock, impacting housing availability. According to the Maricopa Association of Governments, there are almost 100,000 vacation homes in the Phoenix MSA. And according to the National Association of Homes Builders, Maricopa County is the top county in the United States for second homes, with over 20,000 of these seasonal homes owned by Canadians alone.
Fixed Income: Maricopa County has long been a destination for retirees, with the master-planned community of Sun City often seen as catalyzing a revolution of retirement communities across the United States. Opening in 1960, Sun City now has a population of over 30,000, and its sister community Sun City West houses over 16,000.
Of the more than 1 million retirees in Maricopa County, many are at risk for housing insecurity as they age. It’s estimated that 23 percent of seniors in the county earn less than $25,000, with 12 percent earning less than $15,000.
For low-income seniors who are dependent on social security or other fixed-income sources, a small increase in rent can result in displacement. One local resident recalled that a 74-year-old community member’s rent increased by $50 per month, an unaffordable amount for her $1,000 per month fixed-income, and was forced to leave her apartment. According to local advocates, first-time senior homelessness in their organization has gone up 96 percent in the last 5 years.
In South Phoenix and South Scottsdale/Tempe, participants in a 2017 needs assessment reported suffering from loneliness in addition to housing insecurity. Social service staff participants identified a lack of coordinated care for at-risk seniors as a contributing factor for increasing numbers of homelessness.
It is also important to note that seniors are not the only households living on a fixed-income: Those receiving social security disability insurance (SSDI) or supplemental security income (SSI) are also vulnerable to housing loss as rents rise.
What Happens After People Lose Their Homes
“They are moving in with friends, they're moving in with family and they're ending up on the street.” – Local Nonprofit Organization Employee7
The most frequently cited effects of displacement were strains on the system, mental health impacts, and education instability. This shows the far reaching consequences of housing loss on the broader Maricopa County community.
Strains on System: Housing insecurity does not occur in a vacuum—it places a strain on schools, courts, hospitals, law enforcement, and health providers.
Some residents who lack access to stable housing may establish themselves in informal encampments in public spaces, such as city parks. Some interviewees discussed the costs that municipalities put into cleaning up parks through the forcible relocation of housing encampments. Some see this funding allocation as an attempt to clean up a problem, rather than finding solutions.
Between 2019 and 2020, the number of those experiencing homelessness in Phoenix rose by 18 percent, prompting the city to direct over $20 million in funding as a response. Other cities in the county have also allocated funding towards homelessness responses, and have adopted best practices for responding to the homelessness crisis.
Aside from the physical and psychological impacts on displaced residents, cities bear a real cost for managing large populations of unhoused individuals. Healthcare costs are an acute concern, particularly in the summer months, when unhoused populations face increased risk for heat stroke, dehydration, and infections.
Catastrophic events that require EMT, police, or fire department services can be a strain on public funds, and these health events are often preventable with the proper systems in place. Not providing housing to those in need has created a situation in which unsheltered community members are at increased risk for medical emergencies, putting a strain on the system.
Mental Health Impacts of Housing Loss: The process of housing loss also contributes to real mental health consequences for those displaced. Families forced to move to a different community lose not only their home but their support network. Several individuals that work in housing nonprofits discuss bouts of depression afflicting people they serve. Depression, stress, and anxiety stemming from housing insecurity may also impact professional endeavors and personal relationships, resulting in a cyclical inability to find and maintain stable housing.
Children and Education: Children of displaced parents must often switch schools. These switches, particularly when they occur multiple times a year, are proven to impact educational attainment.
A 2011 policy brief found that while 90 percent of students in the Phoenix metropolitan area remain in the same school from year to year, there are clusters of higher mobility rates in areas of South and Central Phoenix, indicating that students in these areas of the city face higher levels of school instability.
These same areas of the county show higher rates of evictions in our analysis, setting the stage for potential future research into the relationship between housing loss and educational stability in Maricopa County.
Children have also been shown to have poorer health outcomes after experiencing housing loss, including lower body weights and issues with mental health. As one local expert described, “I think trauma is major. I think it's overlooked… if you're a child and you don't know where your next meal is going to come from, you're not getting healthcare, if you don't know where you're going to sleep at night, if you don't know where you're going to go to school, if you don't know if you have a backpack or not, if you've got pencils, all of that impacts the development of your brain.”
Policy Recommendations
Policy solutions represented the most robust and diverse spectrum of answers from our key informant interviews in Maricopa County. These answers varied from very specific changes, such as revisions to Senate Bill 1350 (i.e., state preemption on local governments limiting short-term vacation rentals), to broad recommendations, such as increased creativity in developing housing solutions.
Certain policy solutions were voiced across all three of our case study locations; we included these commonly proposed solutions in our policy recommendations section, as we believe them to be broadly applicable across the country. These recommendations include, but are not limited to: improving housing loss data; expanding the social safety net and increasing wages; expanding affordable housing options through voucher programs, trust funds and tax credit programs; and increasing parity between landlords and tenants, for example by improving tenants' legal rights.
Below are three additional policy recommendations that were unique to our Maricopa County case study.
Protect Mobile Home Residents: Residents who live in mobile home park communities have few protections. Currently, Arizona law requires compensation for moving expenses of $7,500 for a single-wide home and $12,500 for a double-wide home. Alternatively, households can choose to abandon their homes and receive compensation equal to one-fourth of the predicted moving expenses on their home.
According to interviews, this compensation does not adequately reflect the real costs of moving, and many residents are forced to abandon their homes. As such, the state should work to provide increased compensation for residents who are displaced as a result of mobile home park redevelopment. Relocation compensation should be based on independent expert estimation of relocation expenses associated with each particular instance of park redevelopment, as is done in Sunnyvale, California. Further, if households wish to abandon their houses, they should be given the full appraised value of their homes.
Alternatively, the State of Arizona and Maricopa County should investigate ways to support resident-owned communities that would permanently provide affordable housing options to those who reside in mobile home parks. Across the United States there are currently over 1,000 resident-owned mobile home park communities, providing long term security and agency to owners.
Better Regulate Short-Term Vacation Rentals: Arizona law prohibits any municipality from adopting policies that would regulate or limit the use of short-term vacation rentals like Airbnb or VRBO, unless for public health or safety. For counties like Maricopa, that house a significant number of short-term vacation rentals, this state preemption prevents local policy from being implemented. State leaders in Arizona should reconsider its preemption of local policy regulating short-term vacation rentals.
Streamline and Improve Data Availability: Maricopa County should work to track real-time housing loss data that can be used by local agencies, researchers, and nonprofits to support residents at risk of housing loss. This data can then be used for better integration and interoperability of support systems. A better coordinated system would prevent those at risk of losing their home from experiencing homelessness and its spiraling impacts.
Conclusion
We began this research in 2019 to examine housing loss across the United States, and at a localized scale in Maricopa County. We could have never predicted that we would release our report in the midst of an unprecedented crisis, with tens of millions of Americans at risk for eviction and foreclosure as a result of the economic fallout of a global pandemic.
We have seen firsthand in the last few months how policy measures can help keep people in their homes. These policies, including nationwide moratorium on evictions, foreclosures, and utility shut-offs, deferments on mortgages, rapid expansion of federal housing voucher programs, and direct rent relief through local public housing authorities, have helped to prevent a wave of housing loss that we believe is coming as programs begin to expire.
However, these policies must be targeted to communities most in need, and so we need to know who those communities are, and where they live. While the economic shocks resulting from the pandemic are unique, we do believe that past housing loss provides an indication of future housing loss, even in these unprecedented times. As such, we hope this granular examination of where exactly evictions and foreclosures are most acute, and which communities are traditionally most impacted, will help municipal leaders and advocates direct outreach and resources in this time of crisis.
The COVID-19 pandemic may have elevated the urgency of eviction and foreclosure, but housing loss is a scourge even in times of relative calm. We must develop long-term policies to combat this systemic ill.
We also acknowledge that, in Maricopa County, the work is not done. More research is needed to better understand where displaced households are moving to, how tracts that overlap with Native American Reservations experience housing loss, how rural residents are losing their houses, and whether race or ethnicity is indeed a predictor of housing loss in the county.
Citations
- From an interview with the authors.
- In order to generate an indicator of housing loss based on the total number of evictions and mortgage foreclosures, we created two new variables: housing loss rate and housing loss index. The housing loss rate reports the total number of evictions and mortgage foreclosures as a proportion of the total number of renters and homeowners with a mortgage in a given geography (here, census tract). The housing loss index reports the housing loss rate by census tract as a proportion of the mean (average) housing loss rate across the entire county. As a benchmark for interpretation, a housing loss index of 1 indicates that the census tract under consideration has a housing loss rate equal to that of the county average, while an index of 3 indicates that the census tract has a housing loss rate that is three times the county average.
- From an interview with the authors.
- While our research did show a relationship between housing loss and race, more research is needed to determine if race is truly a predictive variable for housing loss in Maricopa County, and to examine race while controlling for possible covariates, such as income. This research is currently being conducted by the Knowledge Exchange for Resilience (KER) at Arizona State University.
- This finding is supported by national research which shows higher rates of eviction among families with children and single-parent households.
- From an interview with the authors.
- From an interview with the authors.