
Table of Contents
- Executive Summary
- Introduction: Past, Present, and COVID
- Methodology and Definitions
- Housing Loss and Poor Data
- Housing Loss in the United States: Our National Rankings and Maps
- Housing Loss in Forsyth County, North Carolina
- Housing Loss in Maricopa County, Arizona
- Housing Loss in Marion County, Indiana
- Policy Recommendations
- Conclusion
Housing Loss and Poor Data
“You can’t manage what you can’t measure.” – The New Republic
Our project began ambitiously and, as we found out, naively. We had set out to build a comprehensive, nationwide map of total home and land loss throughout the United States. We wanted to display everything from evictions and mortgage foreclosure to more obscure forms of loss like civil asset forfeiture, takings via eminent domain, partition sales of heirs property, and the privatization of public land.
Last summer, we gathered a dozen of the nation’s foremost property rights experts to brainstorm on how to execute this grandiose plan. The experts were extremely polite and helpful, but their occasional looks of befuddlement betrayed their skepticism about the scope of our effort. As we learned over the previous year, they were right.
The dirty secret of the housing space is that a significant amount of the data needed to comprehensively illustrate property loss is either inaccessible, of poor quality, or simply does not exist.
Over the last 12 months, our project scope narrowed to focus on mechanisms of loss that are best represented in spreadsheets and databases: evictions, mortgage foreclosures, and, to a lesser extent, tax foreclosures. Yet efforts to obtain even this data and prepare it for mapping and analysis took several months, as we encountered myriad issues. Datasets were missing entire years or sets of census tracts. Critical information, such as addresses and court case verdicts, was not recorded. Court-provided eviction datasets did not capture informal evictions, and many are plagued by well-known issues related to quality control. Finally, there was a striking absence of standardization across datasets, exacerbated by often bewildering idiosyncrasies.
Yet within other areas of the U.S. housing space, such as affordable housing and homelessness, public policy and funding allocation is increasingly data-driven. The Department of Housing and Urban Development (HUD), for example, utilizes its voucher management system to fund, monitor, and manage the use of housing choice vouchers by public housing agencies. Homeless service providers are also required by federal mandate to collect and share information on homeless populations with HUD, which helps to steer funding for Continuums of Care across the country.
The real estate sector is also heavily data-driven. Companies such as Zillow, CoreLogic, ATTOM, and Black Knight comprise a lucrative industry focused on collecting granular real estate data, bundling it, and selling it to brokerages, rental sites, insurance companies, and even government agencies. Other firms provide landlords and property management groups with information on households’ rental histories, or investors with aggregated tax sale lists.
And yet, data on an essential component of the housing space—housing loss—is often difficult to obtain, cost-prohibitive, of poor quality, or non-existent, even after the mortgage foreclosure and eviction crises resulting from the Great Recession. The federal government did create the National Mortgage Database in 2010, in order to track delinquent mortgage payments and foreclosures, but according to the New Republic, the database only includes 5 percent of all mortgage holders nationwide. Despite calls for an eviction database, such as in Senator Michael Bennett (D-CO)’s 2019 Eviction Crisis Act, no such tool has materialized.
Publicly available, high quality data is critical for crafting effective housing policy, and we would be remiss not to mention the tremendous efforts of organizations such as the Eviction Lab, Loveland, City Life/Vida Urbana, the Anti-Eviction Mapping Project, Tenants Together, JustFix NYC, and countless others that provide open data on evictions, tax foreclosures, and other types of housing loss. Various city and county GIS offices around the country provide invaluable geospatial tools, too. During trips to South Bend, Indiana and Winston-Salem, North Carolina, for instance, we met civil servants more than ready to assist in our search for data. But issues related to accessibility, data quality, and data coverage persist at many levels of government, making it nearly impossible for anyone to carry out a comprehensive analysis of housing loss in the United States.
Why It Matters
“If you don’t know how many people are being evicted in America, then who’s to say it’s a serious problem?” – Researcher, Eviction Lab1
The limits that poor data create for decision-making around housing policy cannot be understated, especially within the context of increased housing insecurity amid the pandemic. Municipal leaders simply cannot make smart decisions about housing solutions if they do not know the scale of the problem, where housing loss is most acute, and who is most impacted. One high-ranking city official told us that he had rental assistance funds to distribute, but had no idea where within his city eviction rates were highest, and was in the dark about how to direct the money.
Not only that: In the absence of data, it is easy for politicians, the media, and advocates to shape narratives based on anecdotal or incomplete information. For example, last year the tremendous efforts of ProPublica and the Atlantic, among others, shone a spotlight on Black land loss as a result of heirs property. But, experts say that heirs property is not only a problem for the Black community: it impacts colonias in Texas, white communities in Appalachia, and Native lands. However, without good data on heirs property, media attention has shaped this issue as solely a Black problem.
The Road to a National Dataset
The ability to create a national database for housing loss is stymied by a number of factors. The data may be too difficult to generate, or data storage is so decentralized that aggregation at scale would be extremely resource-intensive and time-consuming. Local policies, differences in institutional capacity, and a lack of standardization across jurisdictions countrywide further compound the problem.
Many of the most vulnerable forms of housing and land tenure are informal, existing outside of the legal system by definition. It is likely that hundreds of thousands of Americans—perhaps even millions—own property informally, without any title or deed. For instance, roughly half a million people live in Texas’ colonias, makeshift houses extralegally built on subdivided plots of land near the Rio Grande and elsewhere. Heirs property, or land passed down from generation to generation without a will, is estimated to comprise more than one-third of Black-owned land in the southern United States. Outside of a few pioneering, albeit limited, geographic studies, nobody is able to provide an actual figure regarding informal property ownership, a crucial datapoint for research and policy. Without any way to prove a negative, the data remains out of reach.
But even more mainstream forms of housing loss are marred by coverage gaps.
Most notably, tax foreclosure, which most often occurs due to the long-term non-payment of property taxes, is omitted from our national-level analysis. No entity publicly publishes or even sells nationwide tax foreclosure data, according to multiple academic experts and industry leaders.
This lack of data does not imply that tax foreclosure is an insignificant issue. In fact, we were motivated to look at tax foreclosures after seeing that Detroit, Michigan experienced 143,958 tax foreclosures between 2002 and 2016, based on research by Loveland Technologies. Aside from disproportionately impacting poor, usually minority, households, these tax foreclosures led to vacancy, blight, and the deterioration of entire neighborhoods. But when we attempted to replicate Loveland’s research nationwide we found that the only data available was on tax sales, far upstream from actual tax foreclosures. So, while we had an idea of how many properties entered the tax foreclosure process, we had no idea how many people actually lost their homes. Industry experts told us that the “conversion rate” from tax sale to tax foreclosure hovers around 0.5 percent to 5 percent nationally, but our Indianapolis dataset suggests otherwise. The conversion rate in Marion County is approximately 25 percent.
The decentralized governance structure of mortgage foreclosure data similarly frustrated our efforts to collect a national dataset and led to our decision to purchase data from ATTOM Data Solutions. Private firms such as ATTOM possess the resources, networks, and experience to collect mortgage foreclosure data at scale. These companies provide a valuable service, and their products are not cheap, unsurprisingly. Access to the data is cost-prohibitive to many stakeholders, resulting in unequal power dynamics and information asymmetries.
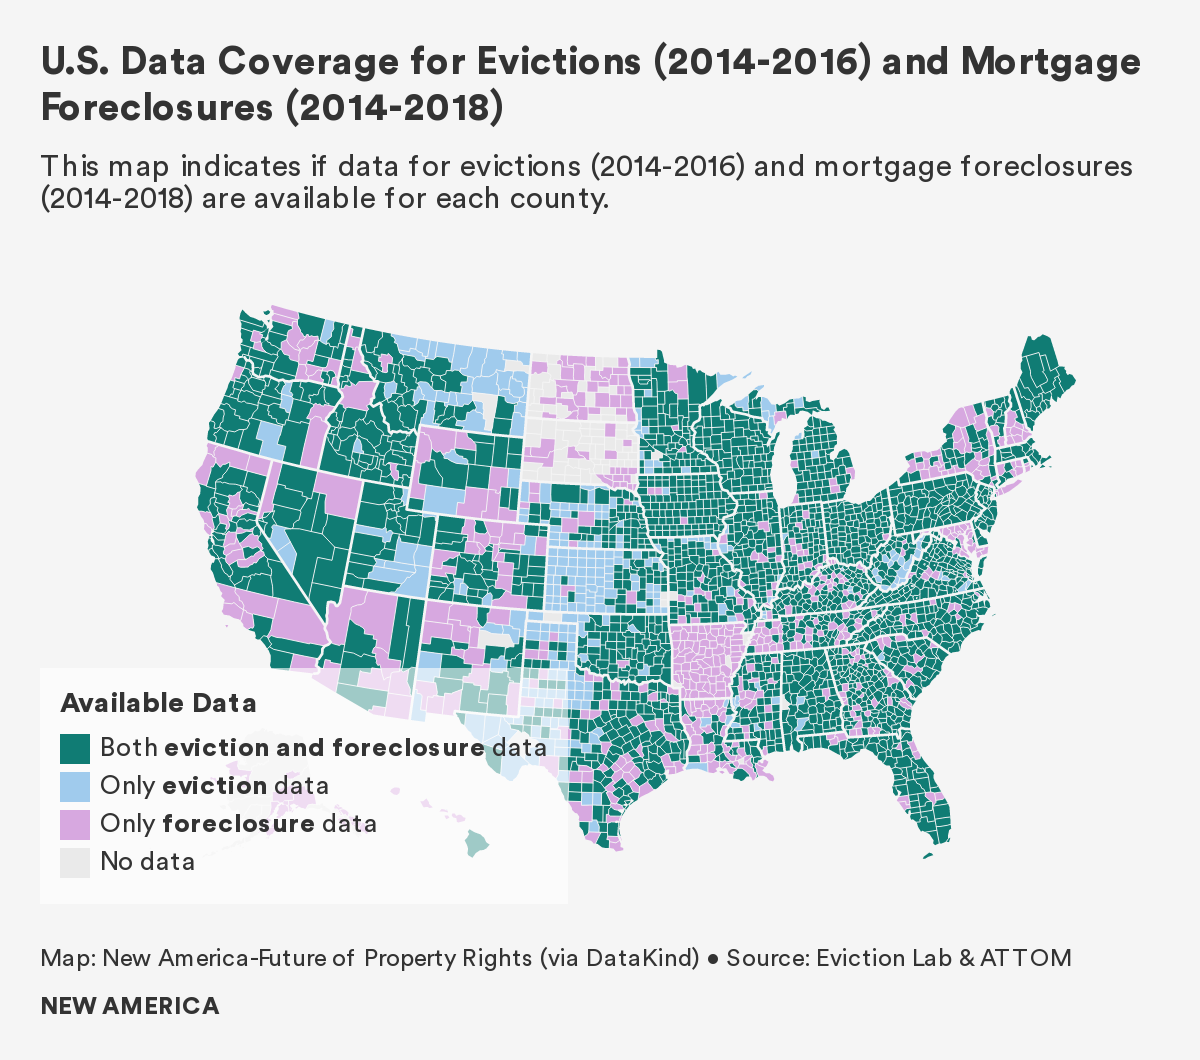
The geographic coverage of ATTOM’s nationwide dataset is extensive. Yet gaps clearly exist in the middle of the United States, and in a few other sparsely populated areas, such as the Upper Peninsula of Michigan, northern Alaska, and southeast Utah. In total, mortgage foreclosure data is not reported in 409 U.S. counties and county equivalents, or 13 percent of the country. Because ATTOM is a commercial actor, its decisions around data collection are driven by profit: In some counties an overall lack of real estate transactions means that data collection is not worth ATTOM’s efforts.
The eviction dataset created by Eviction Lab, by far the most comprehensive aggregation of eviction data in the United States, also contains noticeable gaps in coverage. The initiative’s methodology report outlines various difficulties encountered during the data collection process. County-level data from Alaska, Arkansas, and North and South Dakota is omitted from the dataset, for example, because local governments reported eviction data too inconsistently between 2000 and 2016. Other state policies and local idiosyncrasies created additional barriers to data collection: the extremely decentralized court structure in Upstate New York, sealed eviction files in California, inconsistent court records in New Jersey, and a widespread inability to access data in rural counties throughout the American South, to name a few.
Quantitative analysis of available data also does not provide a full idea of the scope of evictions, because of the prevalence of "informal evictions," which occur outside of the formal legal process. A landlord might remove a unit’s door or change locks to force a tenant out. Other times, a hike in rent or the mere threat of an eviction filing is enough to convince tenants to pack their bags and move. Research by Matthew Desmond, author of Evicted and principal investigator at the Eviction Lab, suggests that in Milwaukee two informal evictions happen for everyone one formal eviction. We are uncertain if rates are similar in other communities, but if the occurrence of informal evictions are anything close to what Desmond found in Milwaukee, then we are severely undercounting the problem.
On the Ground: Binders Full of Foreclosures
“This is on hold. I have multiple other things going on…” – County clerk, in response to request for data2
The United States contains 3,143 counties and county-equivalents, each with its own laws, government offices, and court systems. Individual counties and municipalities collect, maintain, and share data on housing loss through many different methods. Within jurisdictions, various government offices can hold overlapping and fractured land administration mandates. A lack of coordination between these units, along with disparities in institutional capacity, often results in unstandardized data with varying levels of reliability.
No two counties are the same, and it can be difficult to ascertain what data is available, where it is stored, and who can share it. Aside from a quick visit to the Eviction Lab or Loveland website, locating open data on housing loss requires a significant allocation of resources and time.
Our own data search led us across the country, with varying degrees of success. Occasionally, we connected with the right civil servant or government office, someone with intimate knowledge of the available data, its storage location, and how to access it. A short conversation with MapForsyth, the local geographic information office in Winston-Salem, North Carolina, for example, resulted in access to neatly organized Excel spreadsheets on evictions, mortgage foreclosures, and tax foreclosures. The clean and granular data more or less matched project needs, and maps were generated with relative ease as a result.
The data search was entirely unsuccessful at other times. We greeted a sheriff’s office clerk in a mid-sized Midwestern city one morning, inquiring about mortgage foreclosure data, and were unenthusiastically handed a stack of binders. Short on time, we were unable to sort through the many pages and extract any information. Back in Washington, D.C., we asked if the office could scan the documents. The clerk replied that our request was not a priority, and soon became unresponsive to our emails.
In a major Sun Belt city, we spent half a day trekking from government office to government office, asking about tax foreclosure data. No office possessed any readily available data, and after an additional six months of emails and phone calls, we were told that the relevant information did not exist in a mappable format.
Data was inaccessible or nonexistent even if the problem of home loss was widely acknowledged. Housing advocates, researchers, service providers, and decision-makers in Indianapolis repeatedly mentioned that mortgage foreclosures were a still significant issue in Marion County, a full decade after the Great Recession. But no one was able to provide the data—not the mayor’s office, the courts, the Chamber of Commerce, nor the research universities. After exhausting all options, we paid ATTOM thousands of dollars for relevant data.
Quirky Data and No Verdicts
“That could be because the clerk did not enter that…” – Communications Officer, Arizona, explaining data gaps3
Locating and obtaining the necessary datasets for this project was only half the battle. Because housing data is not standardized to a national, or even state, level, each dataset came with its own quirks and caveats.
For example, the eviction data provided by MapForsyth contained successive, repeat addresses. But these were not entry mistakes. Rather, this repetition signified that multiple tenants were evicted from the same address, perhaps a multi-family rental building. Our contact at MapForsyth thankfully shared this peculiarity with us, otherwise we might have de-duplicated the data, leading to an undercount of 2014-2018 evictions by 7,078.
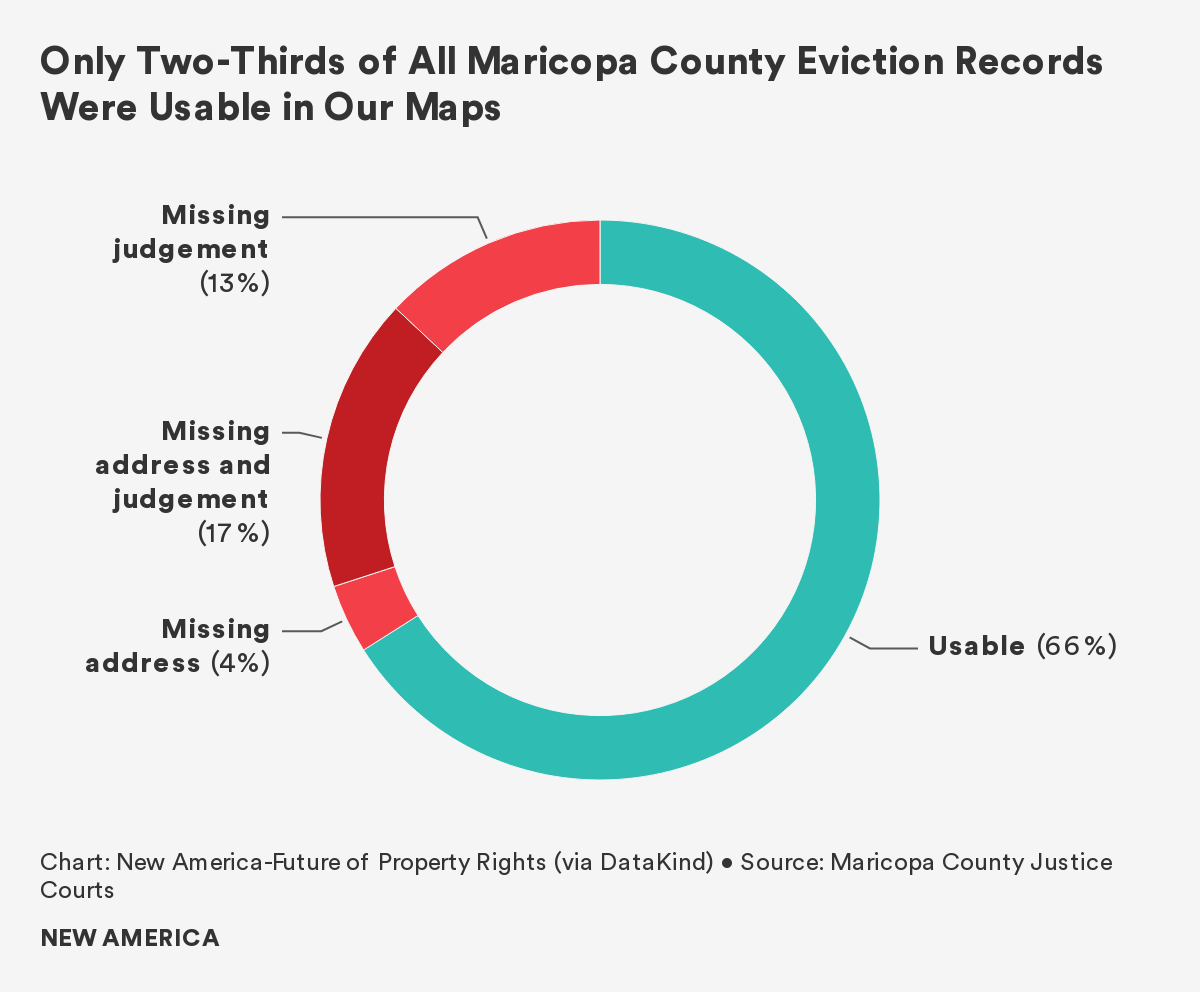
Other datasets were significantly incomplete. Approximately 30 percent of 2014-2018 eviction filings in Maricopa County, Arizona, or over 97,000 cases, lack judgment information. The reasons vary: the case was dismissed; pre-trial mediation between the landlord and tenant worked; both parties won something; or the clerk simply failed to enter the information. With so many possible outcomes, we were unable to discern whether an eviction occured in each of these cases, and these filings were omitted from our data visualizations. As a result, this report’s maps under-represent evictions in Maricopa County.
We wrestled with whether producing an incomplete map was worse than producing no map at all, and in the end decided that visualizing two-thirds of evictions with appropriate disclaimers was better than not visualizing any evictions. Other researchers have come to the opposite conclusion: Eviction Lab, for example, excludes Phoenix from its map and rankings because they determined the data was too poor to be trustworthy, even though by our count the city has some of the highest eviction rates in the country.
Geocoding, or assigning latitude and longitude to each instance of housing loss, was another significant issue. In order to map county-level data for the entire country, we had to ensure that geocoded data were adjusted to a standard appropriate coordinate reference system (as in the case of Forsyth County), and in cases where the datasets we acquired needed to be geocoded (as in the case of evictions in Maricopa County), we had to navigate unstandardized collection of address data. It required significant time to translate this data into a mappable format.
Worse, some datasets were missing GIS information. Almost a quarter of 2014-2018 eviction filings in Maricopa County, or roughly 66,500 cases, lacked granular geocodes. We were able to incorporate these filings into our overall eviction rate for the county, but were forced to exclude the evictions from our maps. So while the absence of geocoding in a housing loss dataset does not preclude all analysis, it hinders the ability for researchers, housing advocates, and policymakers to know who are losing their homes, and where. This and similar issues contribute to imperfect policy development, as funding, resources, and outreach could be misdirected into the wrong communities and neighborhoods.
Power Dynamics and Policy Implications
“Some don’t want heirs property to be identified. Investors can use that information to do unscrupulous things” – Government researcher4
Licensed data on housing loss, such as privately-bundled mortgage foreclosure data, is usually expensive. Local nonprofits, community-based organizations, and even some cash-strapped municipal government offices may lack the funds to purchase these datasets.
This lack of open data creates significantly unequal power dynamics in the U.S. housing space, and leads to inadequate policy solutions at various levels of government. In some cases, it leads to exploitation of the very communities who are experiencing property loss, as better informed opportunists swoop in to take advantage of communities with precarious property rights.
Wall Street’s exclusive access to information on mortgage foreclosures following the Great Recession, for instance, fundamentally altered the U.S. housing space. Private equity, hedge funds, and other investors purchased hundreds of thousands of single-family homes in foreclosure, totaling over $60 billion in value. Many times, firms such as the Blackstone Group bought these properties at discounts of 30 to 50 percent. According to the New York Times, 95 percent of distressed mortgages managed by Freddie Mac and Fannie Mae were auctioned off to Wall Street.
By contrast, the lack of a government database on mortgage foreclosures resulting from the 2007 to 2009 economic downturn contributed, in part, to the insufficient response from policymakers to better protect vulnerable homeowners.
After the mortgage foreclosure crisis, entire neighborhoods were purchased and converted into rental properties; the United States added less than 1 million owner-occupied homes between 2007 and 2017, but 6.5 million in renter-occupied homes. The information asymmetry between government and Wall Street irrevocably changed cityscapes and put communities at risk.
The rental market provides another example of powerful information asymmetries. Many landlords subscribe to online services that flag individuals with prior evictions, or even eviction filings, and frequently deny rental applications based on this data. And yet community-based organizations, created to help these very same renters find stable housing, cannot access this information.
Conclusion: A Critical Policy Recommendation
The report text that follows surfaces dozens of findings and puts forward multiple policy recommendations. And yet, if the reader were to take away only a single recommendation from this report, it would be this: That there is an urgent need for all levels of government—federal, state, and local—to work together to improve the quality and availability of housing loss data. It is impossible to solve a problem that is poorly understood, and with the lack of records available we simply do not fully grasp the issue of housing loss in the United States. Our report and similar efforts shine some light on particular components of this problem, in particular places. But these studies are far from comprehensive. Only after open, accurate, and up-to-date data is available on who is losing their homes, where, when, and how, we will be able to protect at-risk families from the terrible consequences of displacement.
Citations
- From an interview with the authors.
- From a conversation with the authors.
- From a conversation with the authors.
- From an interview with the authors.