Table of Contents
- Executive Summary
- Introduction: Past, Present, and COVID
- Methodology and Definitions
- Housing Loss and Poor Data
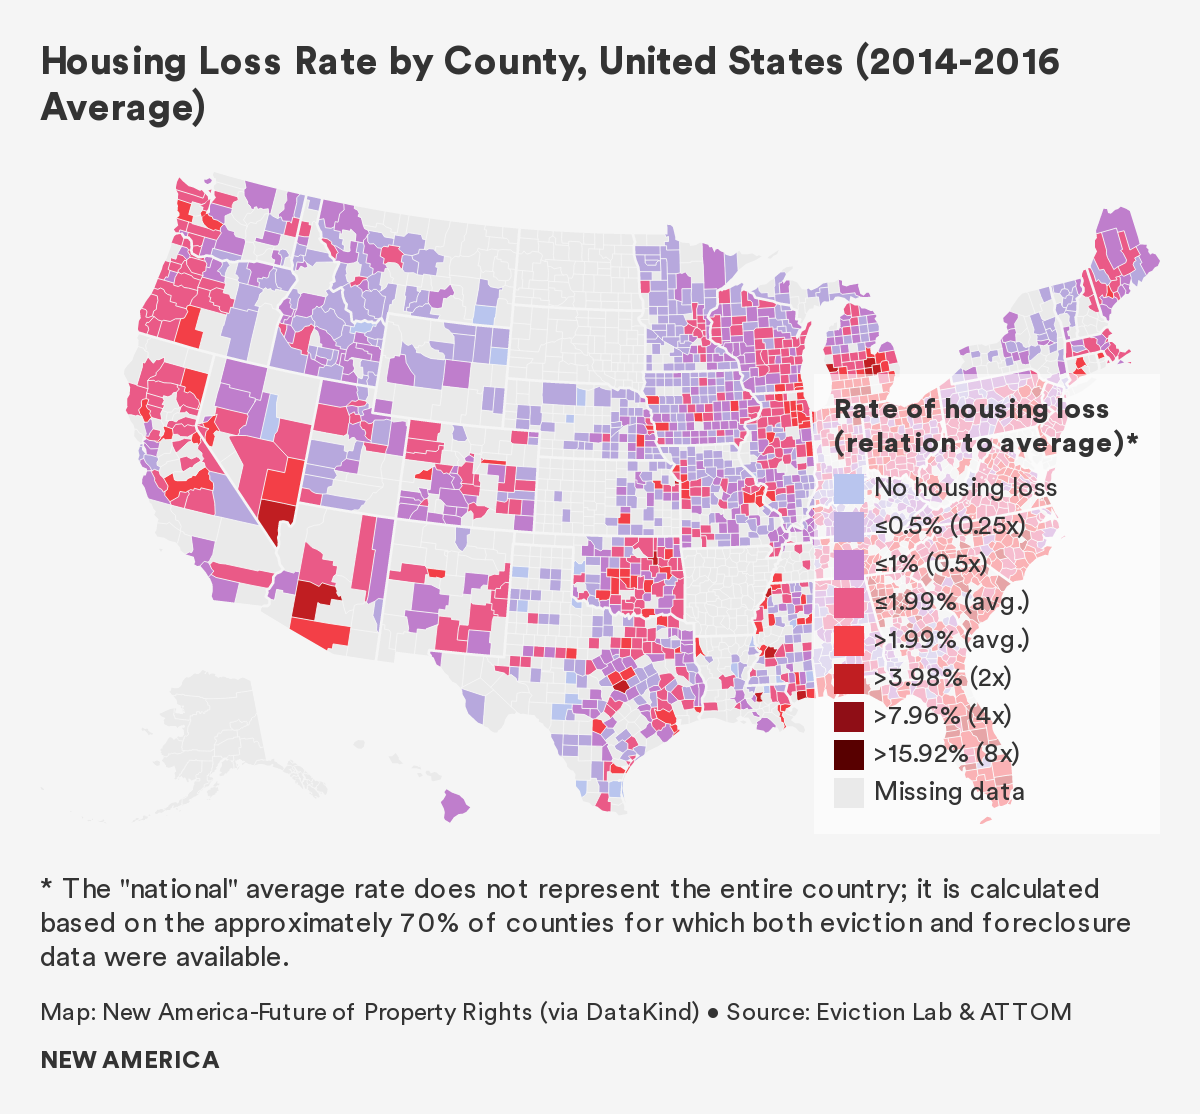
- Housing Loss in the United States: Our National Rankings and Maps
- Housing Loss in Forsyth County, North Carolina
- Housing Loss in Maricopa County, Arizona
- Housing Loss in Marion County, Indiana
- Policy Recommendations
- Conclusion
Executive Summary
Each year, nearly 5 million Americans lose their homes through eviction and foreclosure. These forced displacements are intensely traumatic financially, physically, and emotionally. Children have to switch schools, parents lose their jobs, families’ possessions end up on the sidewalk, and suicide rates spike. Research links housing loss to a litany of adverse impacts, from financial ruin and increased obesity for adults, to educational attainment gaps and chronic homelessness for children.
And yet, as our nation braces for a tsunami of housing loss as the result of the economic fallout of the COVID-19 pandemic, we know very little about these life-changing events. Where is forced displacement most acute? Why does housing loss occur? Who is most at risk? And what happens to people after they lose their homes?
Displaced in America attempts to answer these questions and in doing so help municipal leaders better understand where the pandemic might exacerbate already established patterns of housing loss.
New America and its partners visualized the scale and breadth of displacement across the United States through a National Housing Loss Index, which ranks U.S. counties based on their combined eviction and foreclosure rates. We also examined census tract-level displacement across three case study locations: Forsyth County, North Carolina (Winston-Salem); Marion County, Indiana (Indianapolis); and Maricopa County, Arizona (Phoenix, Tempe, Mesa).
We found that the United States has an acute housing loss problem. The pandemic has exacerbated the effects of stagnant wages, the lack of affordable housing, insufficient federal housing assistance, and discriminatory policies that contribute to housing loss. And while emergency measures like eviction and foreclosure moratoriums will prevent many from losing housing in the near term, they will not address the systemic policies and economic factors that lead people to lose their homes.
Evictions and foreclosures persistently affect the same areas and communities. While shock events like the 2008 foreclosure crisis and the COVID-19 pandemic add to the volume of housing loss, these surges often follow familiar patterns: the people and places most vulnerable to housing loss during steady-state periods are often the ones who experience it most acutely in times of crisis. By identifying and examining which places have traditionally experienced the most acute housing loss, we can predict where future housing loss will occur and who will be impacted, and direct resources to prevent the harm before it proliferates.
What Does Housing Loss Look Like in the United States?
Between 2014 and 2016, the national average housing loss rate was 2 percent, meaning that each year, two out of every 100 households who either rent or have a mortgage experienced an eviction or mortgage foreclosure. Housing loss was most acute in Arizona, Nevada, and Florida, where rates of housing loss were greater than 3.8 percent, almost twice the national average. As of June 2020, each of these states also had unemployment rates at or above 10 percent. Given that non-payment of bills is the most common cause of housing loss, and given their pre-existing housing vulnerability, we expect these states to be disproportionately impacted by the COVID-19 housing crisis.
Based on our examination of data from 2014 to 2016, we found:
- The national average eviction rate was 2.6 percent. More than 900,000 renter households were evicted from their homes each year.
- South Carolina experienced the highest eviction rate of any state (6.2 percent) with an average of 26,430 evictions per year. Other states with high eviction rates include Arizona, Virginia, and Delaware.
- Evictions spike in the summer months. Eviction rates across the country are on average 40 percent higher in July and August than at their low point in March. In some cities, like Dallas, Texas and Richmond, Virginia, eviction rates double from spring to summer.
- Between 2014 and 2018, approximately 670,000 households, or 1.5 percent of homeowners with a mortgage, lost their homes to foreclosure each year. Overall, mortgage foreclosure rates fell during these five years, but remain more than twice the foreclosure rates prior to the 2008 housing crisis.
- Florida experienced the highest foreclosure rate nationally, at 3.7 percent. Nearly 105,000 Floridian households lost their home through foreclosure during the study period. Nevada, Arizona, Georgia, and Tennessee also saw high rates of mortgage foreclosure, all over 2.2 percent.
Who is Most at Risk?
Counties with predominantly non-white households see higher rates of evictions and overall housing loss than those with predominantly white households. This finding was consistent across the national and case study analyses, though we observed important nuances across geographies. As the percentage of rent-burdened households in a county increases, so do rates of eviction and foreclosure. Across the United States, more than 20 million households spend more than 30 percent of their income on rent, of which 10 million spend 50 percent or more of their income on rent.
Across all three case studies, census tracts where residents lacked health insurance, and census tracts in which more residents took public transit to work, had higher rates of housing loss.
Counties with high proportions of households living in mobile homes have higher rates of foreclosure. We do not know whether this is because owners of mobile homes are uniquely vulnerable to foreclosure, or because foreclosed-upon homeowners are likely to move into mobile homes; the relationship between housing loss and mobile homes is an emerging area of study deserving of further research.
We also found higher mortgage foreclosure rates in counties with high numbers of vacant properties and single-parent households.
Why do People Lose Their Homes?
Low wages and rising housing costs: In all three case study counties, increases in housing costs have outpaced income growth. The resulting disparity between income and housing costs places increasing strain on households to keep up with rent and mortgage payments.
Affordable housing shortage: No state in the United States has a sufficient supply of low-income rental housing, meaning there are not enough units available for rent at rates that households living below the poverty line can afford. Across the country, there are only 36 affordable homes available for every 100 extremely low-income households.
Insufficient tenant rights: Tenants almost never have a right to counsel in eviction court. In many cities and states, landlords are not required to provide a reason for the eviction of tenants, and in some states tenants are unable to withhold rent for substandard living conditions.
What are the Consequences of Displacement?
Displacement destabilizes households and neighborhoods: children might be displaced from schools when their family is forced out of their home, families may become homeless or may move to areas of concentrated poverty with poorer access to resources, jobs, and public transit. Displacement can also have impacts on neighborhoods that contribute to neighborhood neglect and blight: for example, a 2017 report found that each foreclosed, vacant home can lead to losses of $170,000 for its community, measured in crime, blight, and decreased property value.
Policy Recommendations
- Improve housing loss data by creating public eviction, mortgage foreclosure, and tax foreclosure databases.
- Increase wages to keep pace with rising housing costs and expand socioeconomic benefits to reduce other household expenditures on healthcare, childcare, and transit.
- Expand affordable housing options through voucher programs, trust funds, and tax credit programs, and by supporting projects that rehabilitate blighted communities.
- Increase parity between landlords and tenants by expanding tenants’ legal rights, providing tenant representation in eviction court, and expanding tenant education.
- Reconsider state preemption laws that limit local housing solutions such as inclusionary zoning, minimum wage laws, or increased regulation of short-term rentals like AirBnb.
Findings from Forsyth County, North Carolina
To view the interactive data visualization, visit https://tinyurl.com/FPRForsythHomeLoss
Forsyth County residents experienced housing loss at a rate of 2.6 percent between 2014 and 2018. Based on our examination of data from this five-year period:
- 12,276 households were evicted in Forsyth County, a 4.4 percent eviction rate.
- 2,902 households were foreclosed upon in Forsyth County, a foreclosure rate of 1 percent. Between 2014 and 2018, the foreclosure rate decreased by approximately 64 percent.
- Evictions spike in summer months. August had the highest average number evictions (256), a 60 percent increase over April, which had the lowest average number of evictions (160).
- When evictions go to court, tenants lose. Evictions in Forsyth County often exceed 3,000 per year, but only 200 cases or so receive pro-bono legal representation, according to a local journalist.
- Census tracts with the highest rates of housing loss are primarily located in East Winston. Each year 9.6 percent of residents in these tracts lose their homes. A few of these tracts lie directly to the east of U.S. Route 52, while others lie between Smith-Reynolds Airport, the Wake Forest University athletic stadiums, and the local fairground.
- Census tracts with larger minority populations as well as tracts with more households living below the poverty lines generally see higher eviction rates. The highest eviction rates, in some places as high as 13 percent, are concentrated to the east of downtown Winston-Salem, in East Winston.
- About half of Forsyth County census tracts have foreclosure rates of less than 1 percent, however foreclosure rates jump to 3-7 percent in East Winston and the southeastern region of Winston-Salem.
- Forsyth County has 1,524 heirs properties, the fifth highest number in North Carolina. Heirs property is passed down through generations outside of the formal probate process and often lacks “clear title.” Disproportionately present in Black communities, this form of property ownership exposes owners to significant vulnerability.
Findings from Maricopa County, Arizona
To view the interactive data visualization, visit https://tinyurl.com/FPRMaricopaHomeLoss
Maricopa County residents experienced housing loss at a rate of 4.5 percent between 2014 and 2018. Based on our examination of data from this five year period:
- 218,00 households were evicted in Maricopa County, a 6.2 percent eviction rate. This is despite the fact that one-third of eviction court records were incomplete and not included in our calculations. As a result we believe the county’s true eviction rate is significantly higher.
- 17,541 households were foreclosed upon in Maricopa County, a foreclosure rate of 2.8 percent.
- Evictions spike in the summer months. July had the highest average number evictions (4,253), a 52 percent increase over March, which had the lowest average number of evictions (2,809).
- When evictions go to court, tenants lose. 87 percent of landlords and only 0.3 percent of tenants had legal representation in court. Of cases with judgment information available, landlords win 99 percent of the time.
- Mobile home park redevelopments are a significant source of housing instability. 70,000 households in Maricopa County live in mobile homes, and can be forced to move when investors purchase mobile home parks for redevelopment. Investors have spent more than half a billion dollars buying up mobile home parks in the region since 2017.
- The highest eviction rates are concentrated near the center of Phoenix, notably the neighborhoods of Maryvale and Westridge Park. In these tracts, one in three renter households get evicted every year.
- Most Maricopa County census tracts have average foreclosure rates of less than 1 percent, however foreclosure rates jump to 5-7 percent in the southeast and southwest portions of the county, as well as those closer to the Phoenix city center. Neighborhoods near Sky Harbor Airport have foreclosure rates of 7 percent.
Findings from Marion County, Indiana
To view the interactive data visualization, visit https://tinyurl.com/FPRMarionHomeLoss
Marion County residents experienced acute housing loss at a rate of 4.9 percent between 2014 and 2018. Based on our examination of data from this five-year period:
- 57,960 households were evicted in Marion County, a 6.8 percent eviction rate.
- 18,765 households were foreclosed upon in Marion County, a foreclosure rate of 2.7 percent. Mortgage foreclosure accounted for 24 percent of all housing loss in Indianapolis during this five year period.
- Evictions spike in summer months. August had the highest average number evictions (1,220), a 54 percent increase over March, which had the lowest average number of evictions (791).
- Wayne and Center Townships exhibit the most acute housing loss, with many tracts in these areas reporting housing loss rates between 14 and 17 percent.
- The census tract with the highest rate of loss in Marion County is located in Wayne Township, and sits in both Indianapolis and the independent enclave of Speedway. In this tract, the housing loss rate is 18 percent, 3.6 times the county average.
- The worst tract for evictions lies just outside Speedway—more than one-third of renters (34 percent) are evicted there every year. Perhaps unexpectedly, the tract is relatively wealthy, with a median household income 20 percent above the county median.
- Generally, census tracts with above-average eviction rates are on the periphery of downtown Indianapolis. These tracts are home to more Black households, the demographic group with the second-strongest association with evictions, behind Latinx households.
- The census tract with the highest foreclosure rate in the county—10.6 percent—sits in the northeast township of Lawrence.
- Tax foreclosures occurred in a “ring” around downtown Indianapolis. The ring of tax foreclosures aligns with previously redlined areas of the city, and our data shows that census tracts with more non-white households experienced higher rates of tax foreclosure.