Displaced in America – Executive Summary
Table of Contents
- Executive Summary
- Introduction: Past, Present, and COVID
- Methodology and Definitions
- Housing Loss and Poor Data
- Housing Loss in the United States: Our National Rankings and Maps
- Housing Loss in Forsyth County, North Carolina
- Housing Loss in Maricopa County, Arizona
- Housing Loss in Marion County, Indiana
- Policy Recommendations
- Conclusion
Abstract
Each year, nearly 5 million Americans lose their homes through eviction and foreclosure. These forced displacements are intensely traumatic financially, physically, and emotionally. Children have to switch schools, parents lose their jobs, families’ possessions end up on the sidewalk, and suicide rates spike.
Yet, as our nation braces for a tsunami of housing loss as a result of the COVID-19 economic fallout, we know very little about these life-changing events. Where is forced displacement most acute? Why does housing loss occur? Who is most at risk? And what happens to people after they lose their homes?
This report, Displaced in America, visualizes housing loss at the county level nationwide, and includes a new metric on forced displacement: a National Housing Loss Index, which ranks U.S. counties based on their combined eviction and foreclosure rates. Also included are census tract-level quantitative and qualitative findings for the three case study locations of Forsyth County, North Carolina; Maricopa County, Arizona; and Marion County, Indiana.
We know that housing loss—both evictions and foreclosures—persistently affects the same communities, and that the people and places most vulnerable to housing loss to begin with are often the ones who experience it most acutely in times of crisis. By identifying and examining which places have traditionally experienced the most acute housing loss, we can predict where future housing loss will occur as a result of the COVID-19 crisis and who will be impacted, and direct resources to prevent the harm before it proliferates.
Acknowledgments
Contributing Authors
Abbey Chambers, Alexandria Drake, Jack Portman, Alex Cattermole, Roderick Setzer, Michael Dowd, Dona Stewart
Technical Reviewers
Sherri Lawson Clark, Molly Martin, Lora Phillips, Craig Richardson, Scott Schang, Patricia Solis, Andy Beck, Emily Benfer, Stephanie Brewer, Natalie Chyi, Leah Humphrey, Dan Kornelis, Breanca Merritt, Amy Nelson, Sylvia Oberle, Dan Rose, Joan Serviss, and Pambana Uishi
Acknowledgements
This report results from a year’s worth of meetings, phone calls, email exchanges, research, and collaboration. We received feedback, advice, and assistance from countless individuals.
In particular, we would like to thank the following individuals for helping us to initially brainstorm this project, and for providing us with feedback throughout the research process: Joshua Akers, Dan Alban, Andrew Aurand, Brian Blacker, Paul Bradley, Maya Brennan, Mychal Cohen, Nick Downer, Noah Durst, Tim Fella, Brandon Frazier, Judy Fox, Jorge Gonzalez, Solomon Greene, Jim Kelly, Thomas Mitchell, Elizabeth Nash, Jerry Paffendorf, Anthony Piaskowy, Tony Pickett, Enrique Silva, Katherine Smyth, Esther Sullivan, Joshua Walden, Heather Way, Jake Wegmann, and Brad Westover.
In Indianapolis, we would like to thank our New America colleague Molly Martin, an absolutely invaluable partner, for introducing us to the city and its many stakeholders. Deputy Mayor Jeff Bennett, Amy Nelson, Hailey Butchart, Chase Haller, and Breanca Merritt were also critical to our research. We would like to thank Jacob Sipe, Tim Evans, Larry Williams, Michael Chapuran, and Gina Davis for their time and insights, as well. Drew Carlson was extremely helpful in sharing tax foreclosure data for Marion County, and so was Matt Nowlin in providing data on COVID-related unemployment.
In Winston-Salem, we would like to thank Scott Schang, Craig Richardson, and Sherri Lawson Clark for their collaboration, and for connecting us to the area’s housing space. We would also like to thank the CSEM team for their advice and insights: Alvin Atkinson, John Railey, Zach Blizard, and Benjamin Lewis. Dan Kornelis, Dan Rose, and Sylvia Oberle were a huge help to our research, and thank you as well to Marla Newman, Kevin Cheshire, Tina Adkins, Chelsea Franzese, Emily McCord, Eddie Garcia, Bethany Chafin, Sharon Thomas, Michael Suggs, and Garret Bolden for their contributions to our initial research. Jason Clodfelter was instrumental in providing data on evictions, mortgage foreclosures, and tax foreclosures for Forsyth County.
In Phoenix, we would like to thank our former New America colleague Megan Garcia for showing us around the Valley of the Sun, and for facilitating introductions. A big thank you to Patricia Solis, Lora Phillips, and Crystal Alvarez from the Knowledge Exchange for Resilience at Arizona State University for their partnership and support of our work. Stephanie Brewer, Silvia Urrutia, Terry Benelli, Melissa Kovacs, Erica Quintana, Jon Riggins, Lee Anne Wade, Cosmin Tomuta, Whitney Silence, Joanna Sagar, Jackie Taylor, Laura Skotnicki, and Ty Rosensteel all contributed to our initial research in Arizona. Scott Davis was immensely helpful in providing local eviction data. Last, thank you to Mayor Corey Woods and Vice Mayor Lauren Kuby of the City of Tempe, Arizona, for championing our work.
We would also like to thank the Eviction Lab at Princeton University for sharing critical data on evictions and for providing feedback on our work, particularly Peter Hepburn, Alieza Durana, Lavar Edmonds, and Anne Kat Alexander. Thank you, too, to Cassandra Johnson Gaither from the U.S. Department of Agriculture for sharing findings on heirs property in North Carolina.
This project would not have been possible without our partnership with DataKind. Aman Ahuja was critical during the early phases of this project, asking tough questions and helping us think through any and all challenges. Thank you to the DataCorps volunteer team, Diana Lam, Alice Feng, Dominic White, Anurag Gandhi, and Shreya Vaidyanathan, for their superhuman work on the report's housing loss data and data visualizations. And thank you to Caitlin Augustin and Mallory Sheff for their continued support.
Nor would this work have been possible without funding from Omidyar Network/PlaceFund and technical support from The Rockefeller Foundation. In particular, we would like to thank Amy Regas and Peter Rabley from Omidyar Network/PlaceFund, as well as Hunter Goldman and Evan Tachovsky from The Rockefeller Foundation, for their support.
Last, but certainly not least, we would like to thank all of our former and current colleagues at New America that assisted with this report: Chris Mellon, Andrew Hagopian, Natalie Chyi, Malcom Glenn, Alison Yost, Maria Elkin, Joanne Zalatoris, Naomi Morduch Toubman, Joe Wilkes, Brittany VanPutten, Rina Li, Samantha Webster, Brigid Schulte, and Fuzz Hogan.
Executive Summary
Each year, nearly 5 million Americans lose their homes through eviction and foreclosure. These forced displacements are intensely traumatic financially, physically, and emotionally. Children have to switch schools, parents lose their jobs, families’ possessions end up on the sidewalk, and suicide rates spike. Research links housing loss to a litany of adverse impacts, from financial ruin and increased obesity for adults, to educational attainment gaps and chronic homelessness for children.
And yet, as our nation braces for a tsunami of housing loss as the result of the economic fallout of the COVID-19 pandemic, we know very little about these life-changing events. Where is forced displacement most acute? Why does housing loss occur? Who is most at risk? And what happens to people after they lose their homes?
Displaced in America attempts to answer these questions and in doing so help municipal leaders better understand where the pandemic might exacerbate already established patterns of housing loss.
New America and its partners visualized the scale and breadth of displacement across the United States through a National Housing Loss Index, which ranks U.S. counties based on their combined eviction and foreclosure rates. We also examined census tract-level displacement across three case study locations: Forsyth County, North Carolina (Winston-Salem); Marion County, Indiana (Indianapolis); and Maricopa County, Arizona (Phoenix, Tempe, Mesa).
We found that the United States has an acute housing loss problem. The pandemic has exacerbated the effects of stagnant wages, the lack of affordable housing, insufficient federal housing assistance, and discriminatory policies that contribute to housing loss. And while emergency measures like eviction and foreclosure moratoriums will prevent many from losing housing in the near term, they will not address the systemic policies and economic factors that lead people to lose their homes.
Evictions and foreclosures persistently affect the same areas and communities. While shock events like the 2008 foreclosure crisis and the COVID-19 pandemic add to the volume of housing loss, these surges often follow familiar patterns: the people and places most vulnerable to housing loss during steady-state periods are often the ones who experience it most acutely in times of crisis. By identifying and examining which places have traditionally experienced the most acute housing loss, we can predict where future housing loss will occur and who will be impacted, and direct resources to prevent the harm before it proliferates.
What Does Housing Loss Look Like in the United States?
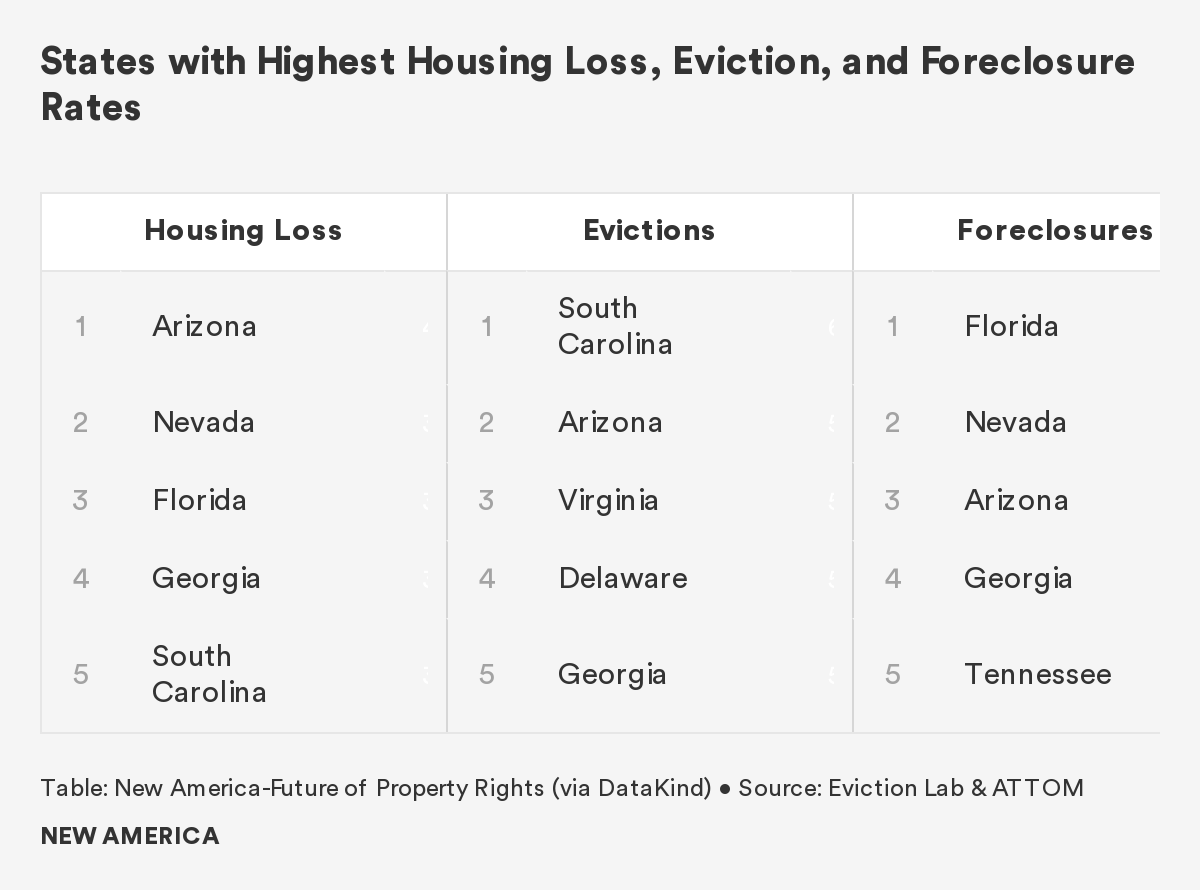
Between 2014 and 2016, the national average housing loss rate was 2 percent, meaning that each year, two out of every 100 households who either rent or have a mortgage experienced an eviction or mortgage foreclosure. Housing loss was most acute in Arizona, Nevada, and Florida, where rates of housing loss were greater than 3.8 percent, almost twice the national average. As of June 2020, each of these states also had unemployment rates at or above 10 percent. Given that non-payment of bills is the most common cause of housing loss, and given their pre-existing housing vulnerability, we expect these states to be disproportionately impacted by the COVID-19 housing crisis.
Based on our examination of data from 2014 to 2016, we found:
- The national average eviction rate was 2.6 percent. More than 900,000 renter households were evicted from their homes each year.
- South Carolina experienced the highest eviction rate of any state (6.2 percent) with an average of 26,430 evictions per year. Other states with high eviction rates include Arizona, Virginia, and Delaware.
- Evictions spike in the summer months. Eviction rates across the country are on average 40 percent higher in July and August than at their low point in March. In some cities, like Dallas, Texas and Richmond, Virginia, eviction rates double from spring to summer.
- Between 2014 and 2018, approximately 670,000 households, or 1.5 percent of homeowners with a mortgage, lost their homes to foreclosure each year. Overall, mortgage foreclosure rates fell during these five years, but remain more than twice the foreclosure rates prior to the 2008 housing crisis.
- Florida experienced the highest foreclosure rate nationally, at 3.7 percent. Nearly 105,000 Floridian households lost their home through foreclosure during the study period. Nevada, Arizona, Georgia, and Tennessee also saw high rates of mortgage foreclosure, all over 2.2 percent.
Who is Most at Risk?
Counties with predominantly non-white households see higher rates of evictions and overall housing loss than those with predominantly white households. This finding was consistent across the national and case study analyses, though we observed important nuances across geographies. As the percentage of rent-burdened households in a county increases, so do rates of eviction and foreclosure. Across the United States, more than 20 million households spend more than 30 percent of their income on rent, of which 10 million spend 50 percent or more of their income on rent.
Across all three case studies, census tracts where residents lacked health insurance, and census tracts in which more residents took public transit to work, had higher rates of housing loss.
Counties with high proportions of households living in mobile homes have higher rates of foreclosure. We do not know whether this is because owners of mobile homes are uniquely vulnerable to foreclosure, or because foreclosed-upon homeowners are likely to move into mobile homes; the relationship between housing loss and mobile homes is an emerging area of study deserving of further research.
We also found higher mortgage foreclosure rates in counties with high numbers of vacant properties and single-parent households.
Why do People Lose Their Homes?
Low wages and rising housing costs: In all three case study counties, increases in housing costs have outpaced income growth. The resulting disparity between income and housing costs places increasing strain on households to keep up with rent and mortgage payments.
Affordable housing shortage: No state in the United States has a sufficient supply of low-income rental housing, meaning there are not enough units available for rent at rates that households living below the poverty line can afford. Across the country, there are only 36 affordable homes available for every 100 extremely low-income households.
Insufficient tenant rights: Tenants almost never have a right to counsel in eviction court. In many cities and states, landlords are not required to provide a reason for the eviction of tenants, and in some states tenants are unable to withhold rent for substandard living conditions.
What are the Consequences of Displacement?
Displacement destabilizes households and neighborhoods: children might be displaced from schools when their family is forced out of their home, families may become homeless or may move to areas of concentrated poverty with poorer access to resources, jobs, and public transit. Displacement can also have impacts on neighborhoods that contribute to neighborhood neglect and blight: for example, a 2017 report found that each foreclosed, vacant home can lead to losses of $170,000 for its community, measured in crime, blight, and decreased property value.
Policy Recommendations
- Improve housing loss data by creating public eviction, mortgage foreclosure, and tax foreclosure databases.
- Increase wages to keep pace with rising housing costs and expand socioeconomic benefits to reduce other household expenditures on healthcare, childcare, and transit.
- Expand affordable housing options through voucher programs, trust funds, and tax credit programs, and by supporting projects that rehabilitate blighted communities.
- Increase parity between landlords and tenants by expanding tenants’ legal rights, providing tenant representation in eviction court, and expanding tenant education.
- Reconsider state preemption laws that limit local housing solutions such as inclusionary zoning, minimum wage laws, or increased regulation of short-term rentals like AirBnb.
Findings from Forsyth County, North Carolina
To view the interactive data visualization, visit https://tinyurl.com/FPRForsythHomeLoss
Forsyth County residents experienced housing loss at a rate of 2.6 percent between 2014 and 2018. Based on our examination of data from this five-year period:
- 12,276 households were evicted in Forsyth County, a 4.4 percent eviction rate.
- 2,902 households were foreclosed upon in Forsyth County, a foreclosure rate of 1 percent. Between 2014 and 2018, the foreclosure rate decreased by approximately 64 percent.
- Evictions spike in summer months. August had the highest average number evictions (256), a 60 percent increase over April, which had the lowest average number of evictions (160).
- When evictions go to court, tenants lose. Evictions in Forsyth County often exceed 3,000 per year, but only 200 cases or so receive pro-bono legal representation, according to a local journalist.
- Census tracts with the highest rates of housing loss are primarily located in East Winston. Each year 9.6 percent of residents in these tracts lose their homes. A few of these tracts lie directly to the east of U.S. Route 52, while others lie between Smith-Reynolds Airport, the Wake Forest University athletic stadiums, and the local fairground.
- Census tracts with larger minority populations as well as tracts with more households living below the poverty lines generally see higher eviction rates. The highest eviction rates, in some places as high as 13 percent, are concentrated to the east of downtown Winston-Salem, in East Winston.
- About half of Forsyth County census tracts have foreclosure rates of less than 1 percent, however foreclosure rates jump to 3-7 percent in East Winston and the southeastern region of Winston-Salem.
- Forsyth County has 1,524 heirs properties, the fifth highest number in North Carolina. Heirs property is passed down through generations outside of the formal probate process and often lacks “clear title.” Disproportionately present in Black communities, this form of property ownership exposes owners to significant vulnerability.
Findings from Maricopa County, Arizona
To view the interactive data visualization, visit https://tinyurl.com/FPRMaricopaHomeLoss
Maricopa County residents experienced housing loss at a rate of 4.5 percent between 2014 and 2018. Based on our examination of data from this five year period:
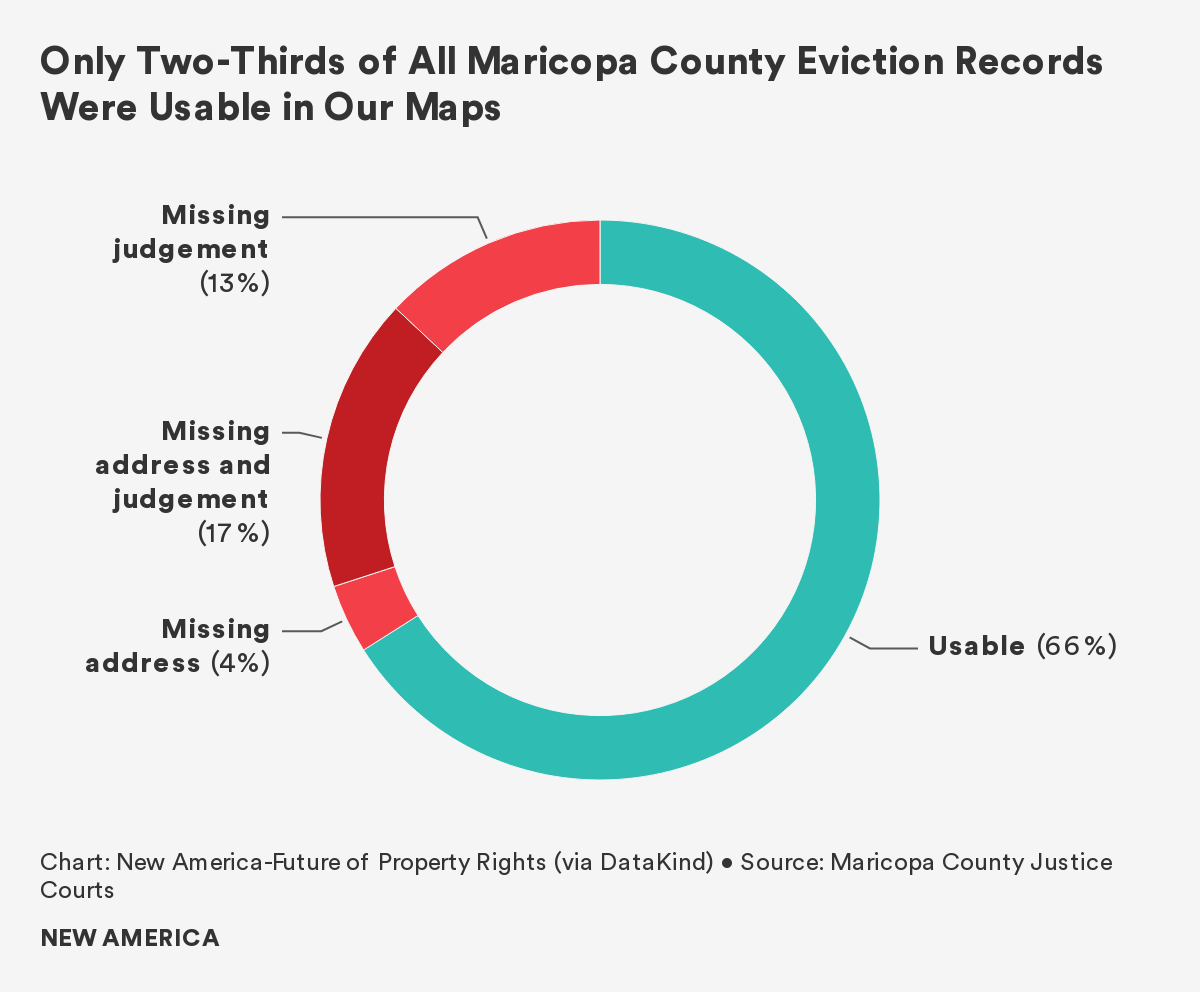
- 218,00 households were evicted in Maricopa County, a 6.2 percent eviction rate. This is despite the fact that one-third of eviction court records were incomplete and not included in our calculations. As a result we believe the county’s true eviction rate is significantly higher.
- 17,541 households were foreclosed upon in Maricopa County, a foreclosure rate of 2.8 percent.
- Evictions spike in the summer months. July had the highest average number evictions (4,253), a 52 percent increase over March, which had the lowest average number of evictions (2,809).
- When evictions go to court, tenants lose. 87 percent of landlords and only 0.3 percent of tenants had legal representation in court. Of cases with judgment information available, landlords win 99 percent of the time.
- Mobile home park redevelopments are a significant source of housing instability. 70,000 households in Maricopa County live in mobile homes, and can be forced to move when investors purchase mobile home parks for redevelopment. Investors have spent more than half a billion dollars buying up mobile home parks in the region since 2017.
- The highest eviction rates are concentrated near the center of Phoenix, notably the neighborhoods of Maryvale and Westridge Park. In these tracts, one in three renter households get evicted every year.
- Most Maricopa County census tracts have average foreclosure rates of less than 1 percent, however foreclosure rates jump to 5-7 percent in the southeast and southwest portions of the county, as well as those closer to the Phoenix city center. Neighborhoods near Sky Harbor Airport have foreclosure rates of 7 percent.
Findings from Marion County, Indiana
To view the interactive data visualization, visit https://tinyurl.com/FPRMarionHomeLoss
Marion County residents experienced acute housing loss at a rate of 4.9 percent between 2014 and 2018. Based on our examination of data from this five-year period:
- 57,960 households were evicted in Marion County, a 6.8 percent eviction rate.
- 18,765 households were foreclosed upon in Marion County, a foreclosure rate of 2.7 percent. Mortgage foreclosure accounted for 24 percent of all housing loss in Indianapolis during this five year period.
- Evictions spike in summer months. August had the highest average number evictions (1,220), a 54 percent increase over March, which had the lowest average number of evictions (791).
- Wayne and Center Townships exhibit the most acute housing loss, with many tracts in these areas reporting housing loss rates between 14 and 17 percent.
- The census tract with the highest rate of loss in Marion County is located in Wayne Township, and sits in both Indianapolis and the independent enclave of Speedway. In this tract, the housing loss rate is 18 percent, 3.6 times the county average.
- The worst tract for evictions lies just outside Speedway—more than one-third of renters (34 percent) are evicted there every year. Perhaps unexpectedly, the tract is relatively wealthy, with a median household income 20 percent above the county median.
- Generally, census tracts with above-average eviction rates are on the periphery of downtown Indianapolis. These tracts are home to more Black households, the demographic group with the second-strongest association with evictions, behind Latinx households.
- The census tract with the highest foreclosure rate in the county—10.6 percent—sits in the northeast township of Lawrence.
- Tax foreclosures occurred in a “ring” around downtown Indianapolis. The ring of tax foreclosures aligns with previously redlined areas of the city, and our data shows that census tracts with more non-white households experienced higher rates of tax foreclosure.
Introduction: Past, Present, and COVID
When we embarked on this project more than a year ago, we could have never predicted its salience today. As the COVID-19 pandemic swept across the United States, it rapidly became clear that we would release this report at a time when millions of Americans are without jobs and at risk of losing their housing. This report became more than a way to document historic housing loss, but a tool municipal leaders could use to better understand pandemic-related housing loss in their own communities.
Every year, almost 5 million Americans lose their homes through eviction and foreclosure. But this year, as a result of the COVID-19 crisis and the severe economic downturn it spurred, we anticipate that number to be magnitudes greater. An Aspen Institute report released in August predicts that 30 to 40 million people are at risk of being evicted by the end of 2020, to say nothing of foreclosures.
As we write, more than a quarter of Americans and 43 percent of renting families have reported that they cannot pay their rent or mortgage. This, combined with 51 percent of U.S. households reporting that at least one person in their household has lost employment income due to COVID-19, does not bode well for the millions of already struggling households. In 2019, the Global Property Rights Index found that 13 percent of Americans were housing insecure. Looking at the U.S. Census Bureau’s Housing Pulse Survey, we know that housing insecurity has roughly doubled this year—a staggering increase.
In many cities, although evictions continue to occur, the tsunami of housing loss has not yet begun. But soaring unemployment figures, coupled with quickly depleted rental assistance programs, sharp increases in food pantry requests, and tenants taking on financial risk to pay the rent, tell us it’s coming. On September 1 the Centers for Disease Control (CDC) announced a ban on evictions for nonpayment of rent in order to prevent the spread of COVID-19. The order is effective through December, and serves to delay housing loss through the end of this year, but there is no support for tenants to pay back rent, and no mention of what happens on January 1.
Forced displacements are intensely traumatic—financially, physically, and emotionally. Children have to switch schools, parents lose their jobs, families’ possessions end up on the sidewalk, and depression, anxiety, and suicide rates spike.
Yet even as our nation braces for a flood of housing loss, we know very little about these life-changing events. What is the actual rate of displacement? Where is displacement most acute? Who is most at risk? And why do people lose their homes?
Over the past year, the Future of Property Rights program and our research partners have attempted to answer these questions by visualizing the scale and breadth of housing instability and displacement across the United States, and telling the stories of communities impacted by these losses. We developed a National Housing Loss Index, which ranks U.S. counties based on their combined eviction and foreclosure rates between 2014 and 2016. In addition to analyzing county-level displacement across the United States, we examined census tract-level housing loss between 2014 and 2018 across three case study locations: Forsyth County, North Carolina (Winston-Salem); Marion County, Indiana (Indianapolis); and Maricopa County, Arizona (Phoenix, Tempe, Mesa).
We found that the United States has an acute housing loss problem. The pandemic has exacerbated the effects of stagnant wages, the lack of affordable housing, insufficient federal housing assistance, and discriminatory policies that contribute to housing loss. And while emergency measures like eviction and foreclosure moratoriums will prevent many from losing housing in the near term, they will not address the systemic policies and economic factors that lead people to lose their homes.
The pandemic may have shone a light on the rot in American housing, but that rot was there all along.
So how does studying past housing loss help us combat the current crisis?
First, we know that housing loss—both evictions and foreclosures—persistently affect the same areas, and the same communities. While shock events like the 2008 financial crisis and the current COVID-19 pandemic add to the volume of housing loss, these surges often follow familiar patterns: The people and places most vulnerable to housing loss to begin with are often the ones who experience it most acutely in times of crisis. By identifying and examining which places have traditionally experienced the most acute housing loss, we can predict where future housing loss will occur and who will be impacted, and direct resources to prevent the harm before it proliferates.
Second, knowing past housing loss at the local level gives us a baseline from which to assess the magnitude of the current problem, and to understand which areas are being disproportionately impacted. At a national level, we already have pre-pandemic data about housing insecurity. In 2019 the Global Property Rights Index, in partnership with the Gallup World Poll, found that 13 percent of Americans are housing insecure. Through the U.S. Census Bureau’s Housing Pulse Survey, we know that number has roughly doubled this year—a staggering increase. But we have no such comparison at the local level.
Third, examining the drivers of past housing loss gives us the opportunity to develop a long-term plan to redress housing precarity. Our data reveals that even before 2020, the United States’s flawed housing system disadvantaged significant parts of the population. Without intervention, the current crisis will dramatically exacerbate these pre-existing conditions. While today’s emergency certainly demands a rapid response of moratoria paired with significant cash infusions, these solutions are stopgap measures and will not address the root causes of housing instability. Rather, they provide the opportunity to pause housing displacement, so that we may finally implement more lasting solutions that make quality housing more affordable and accessible, and ensure that all Americans are afforded the fundamental human right to adequate housing.
Methodology and Definitions
Methodology
About two-thirds of Americans, or 76 million households, own their homes while the remaining one-third, or 43 million households, rent.1 Of owner-occupied housing units, 62 percent, or 46 million, have a mortgage. This report examines housing loss due to eviction and foreclosure, and presents findings from mixed methods research on housing instability and loss in the United States.
In addition to a brief section on our national-level findings, we focus on case studies on three U.S. counties: Forsyth County, North Carolina; Maricopa County, Arizona; and Marion County, Indiana. The purpose of these case studies is to evaluate housing insecurity and loss at a more granular level of analysis, in different geographies and social contexts.
We analyzed and visualized the available geospatial data on evictions, mortgage foreclosures, and tax foreclosures nationally and in each case study location. To supplement these quantitative findings, we utilized American Community Survey (ACS) data from the U.S. Census Bureau and tested for statistical relationships between housing loss and a number of socioeconomic variables. For each case study location, we further conducted key informant interviews (KIIs) to better understand the causes of home loss, as well as the consequences of displacement. These KIIs, along with desk research, helped to provide geographic, demographic, economic, social, political, and historical context to our housing-related findings.
Housing Loss Rate and Housing Loss Index
Limitations of Prior Studies: Prior studies on housing loss tend to examine different mechanisms of loss in silos. Eviction, mortgage foreclosure, and tax foreclosure are analyzed separately, rather than as components of the same, broader problem: housing instability and loss. The processes of eviction and foreclosure may be different, yet the underlying causes are often the same, and each result in displacement and trauma—financially, physically, and emotionally. In most U.S. cities, a worker on minimum wage will be unable to make housing payments—either rent or a mortgage. The impact on a child who switches schools three times a year due to housing instability is likely similar whether home loss occurs via eviction or foreclosure. And residents of a blighted neighborhood likely do not care if their block of empty homes is a result of foreclosures or chronic evictions.
Our Scoring Metrics: For the reasons above, we decided to develop a single “score” of housing loss in the United States, capturing the overall magnitude of both eviction and mortgage foreclosure.
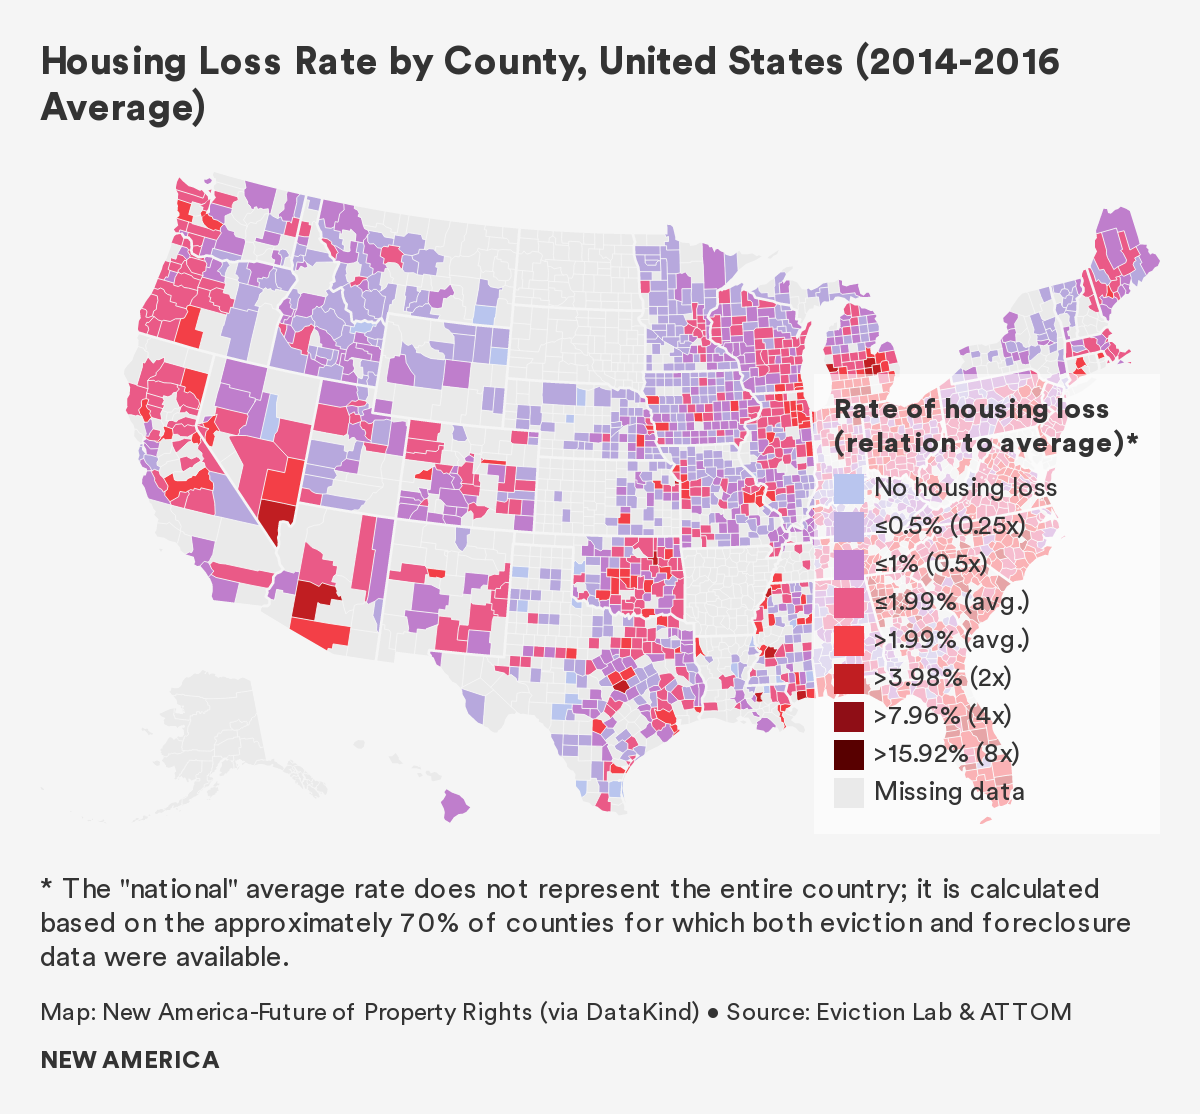
In order to generate an indicator of housing loss that is based on the total number of evictions and the total number of mortgage foreclosures, we created two new measures: a housing loss rate and a housing loss index. These two scores were calculated for the counties for which both eviction and mortgage foreclosure data are available for 2014 to 2016. At the national level, this data is available for 2,221 counties, out of the 3,143 counties in the United States.2 The national housing loss index compares rates of housing loss in each county against the national average. In each of the case studies, the housing loss index compares the housing loss rate in each census tract against the county average.
Housing Loss Rate: The housing loss rate captures loss by combining the total number of evictions and the total number of mortgage foreclosures for a given geography, and then normalizing that sum by the total number of renters and the total number of homeowners with a mortgage within the given geography. As a result, this rate shows the scale of housing loss within a given geography in relation to the number of households who could potentially experience such a loss.

The unit of analysis at the national level is the county, and the unit of analysis in each case study is the census tract.3
We note, however, that the rate does not capture any trends related to housing loss, or whether loss has increased or decreased over the study period, nor does it inherently express which mechanism of loss—eviction or foreclosure—has the greater impact on overall housing loss. A "housing loss dashboard" included below separately reports the proportion of housing loss accounted for by eviction and foreclosure to provide insight into the predominant mechanism of instability in each county or county-equivalent.
Housing Loss Index: The housing loss index compares the housing loss rate against an average: the national average of all counties for which data was available, in the case of our national research, and the county average in our case studies.

As a benchmark for interpretation, at the national level, a county with a housing loss index score of 1 experiences a housing loss rate equal to the average of all other counties in the United States for which we have data. An index of 3 indicates that the county under consideration experiences a housing loss rate that is three times the national average. A housing loss index of less than 1 implies that the county under consideration is doing “better” on average (i.e., experiencing less housing loss) than all other counties in the country.
Case Study Selection Criteria
Early research involved the exploration of various U.S. counties for inclusion in case studies. We selected our locations based on a number of requirements:
- An early assessment of the prevalence of housing loss and instability.
- The availability of granular and mappable data for evictions and mortgage foreclosure, as well as tax foreclosure, to a lesser extent.
- The availability of a university partner and/or a New America Local office, in order to conduct key informant interviews “on site,” and to leverage existing networks in order to engage with local stakeholders.
- Regional variation, in order to account for differences in economics, politics, demographics, and histories.
Qualitative Methodology
After we selected our case study locations, we finalized research partnerships with: New America Indianapolis and the Institute for American Thought at Indiana University-Purdue University Indianapolis, in Marion County, Indiana; the Environmental Law and Policy Clinic at the Wake Forest University School of Law, the Department of Anthropology at Wake Forest University, and the Center for the Study of Economic Mobility at Winston-Salem State University in Forsyth County, North Carolina; and the Knowledge Exchange for Resilience at Arizona State University in Maricopa County, Arizona
From November 2019 to June 2020, graduate and undergraduate students from these institutions conducted key informant interviews (KIIs) with a wide variety of stakeholders, including government officials, housing advocates, real estate developers, journalists, lawyers, service providers, and community members to gain an in-depth understanding of local issues related to housing loss. Questions were developed collaboratively, and focused on how often residents lost their homes—and whether through eviction, mortgage foreclosure, or another mechanism; who was most at-risk of losing their home; where within the relevant county this loss was most acute; why people were losing their homes; and what happened after they did. In total, researchers conducted 31 interviews in Marion County, Indiana; 15 in Maricopa County, Arizona; and 20 in Forsyth County, North Carolina.
The researchers provided us with recordings and transcripts of the KIIs, a written summary of each interview, and a summary of findings.
Quantitative Methodology
Together with our data science and visualization partner, DataKind, we located, cleaned, standardized, and visualized the data on evictions, mortgage foreclosures, and, in certain cases, tax foreclosures. In our analysis, we tested for any statistical relationships between housing loss and a number of socioeconomic variables via correlation analysis.
Our nationwide index is limited to eviction and mortgage foreclosure data from 2014 to 2016. We were unable to include tax foreclosure due to the lack of accessible data for most U.S. counties. However, we have included tax foreclosure in our case studies for Marion County, Indiana and Forsyth County, North Carolina, as we were able to obtain the relevant data.
Project Data Sources
| National | Forsyth County, North Carolina | Maricopa County, Arizona | Marion County, Indiana | |
|---|---|---|---|---|
| Unit of Analysis | County | Parcel | Parcel | Parcel |
| Unit of Visualization{{4}} | County | Census Tract | Census Tract | Census Tract |
| Eviction | Eviction Lab at Princeton University | Forsyth County Geographic Information Systems (GIS) Office (MapForsyth) | Maricopa County Justice Courts | Eviction Lab at Princeton University |
| Mortgage Foreclosure | ATTOM Data Solutions | Forsyth County GIS Office (MapForsyth) | Information Market / Arizona State University | ATTOM Data Solutions |
| Tax Foreclosure | N/A | Forsyth County GIS Office (MapForsyth) | N/A | Marion County Auditor’s Office |
National data on evictions was supplied by the Eviction Lab at Princeton University,4 and data on mortgage foreclosures was provided by ATTOM Data Solutions.5 Using this data, DataKind generated nationwide, county-level maps depicting rates of eviction, mortgage foreclosure, and housing loss rate, as well as a map indicating overall data coverage for U.S. counties. Using the national data, we also analyzed the correlation between select five-year (2012–2016) ACS census estimates and the eviction rate, mortgage foreclosure rate, and the housing loss rate at the county level.
For our three case studies: we supplemented data from Eviction Lab and ATTOM with data acquired from local agencies, as described in the table above. In each case study location, we complemented the data with key informant interviews to better understand the context behind the data. We also analyzed the correlation between select five-year (2012-2016) ACS census estimates and the eviction rate, mortgage foreclosure rate, and the housing loss rate at the census tract-level.
Definitions
Eviction
Definition: An eviction occurs when a landlord forcibly expels a tenant from their rental property, resulting in the renter’s involuntary move from their home. Landlords may evict a tenant for “just causes,” such as the renter’s failure to pay rent, taking on boarders, damaging property, causing disturbances, or breaking the law. But in many American cities, landlords can evict renters even if they pay rent on time and follow their lease agreement. Based on our estimates, on average 2.6 percent of all renter households were evicted each year between 2014 and 2016. Yet the scale of the issue varies by state, and even within states.
Legal Process: Typically, an eviction court record is generated after a landlord files an eviction notice with the local court and serves a tenant with a notice to appear in court. At the hearing, the judge may rule that the eviction is justified and order the tenant to leave by a particular date, or the judge may dismiss the eviction. Almost all formal evictions in the United States take place in civil court, where renters lack the right to an attorney. As a result, most renters do not appear in eviction court and receive a default eviction judgment. Because eviction data, including the data used here, is gathered primarily from court documents, the numbers reflect these “formal evictions” conducted through the court system.
But evictions can occur informally, or outside of the legal system entirely, such as when a landlord imposes a rent hike, gives verbal notice to vacate, or performs an illegal lockout. In some places, experts estimate that these “informal evictions” account for half or more of all evictions. However, informal evictions often elude tracking, limiting attempts to fully account for housing loss.
As such, while the eviction data reported below provides some insights into the breadth of eviction in U.S. states, it does not capture the significant scope or impacts of informal processes that forcibly displace tenants.
A Note About the Eviction Measure We Focus On: Some studies suggest that anywhere between 60 to 80 percent of all eviction filings eventually result in the removal of a tenant from their home, regardless of the court case outcome.6 Yet we sought to be absolutely certain that our data, as well as the resulting analysis, represented actual evictions. While we admit that our eviction-related findings are most likely an undercount, the numbers still paint a bleak picture in many localities across the country. The decision to focus on recorded instances of eviction fits within our general belief that formulation of housing policy must be increasingly data-driven if decision-makers are to sufficiently direct outreach, funding, and resources to the most distressed communities.
It is important to note, however, that an eviction filing can have deleterious impacts itself—even if a case does not lead to a formal eviction judgment. In many jurisdictions, an eviction filing enters the public record and becomes part of an individual’s rental history, unless the eviction is formally dismissed in court.7 As a result, an eviction filing often appears on background check results as a red flag, and may dissuade potential landlords from renting to these individuals.8
Mortgage Foreclosure
Definition: A mortgage foreclosure occurs when a person who has taken out a mortgage to pay for a house, known as a borrower, loses their rights to that property. Usually, if a borrower fails to make multiple mortgage payments in a timely manner, the foreclosure process begins. The lender—most often a bank—applies to a court for authority to sell the property. Money received from the resulting sale is applied to debts on the property, including payments to the lender.9 Based on our estimates, 1.5 percent of all homeowners with mortgages were foreclosed upon between 2014 and 2018. Yet the scale of the issue varies by state, and even within states.
Legal Process: In states with a judicial foreclosure process, proceedings typically take place before a judge, who determines whether the homeowner is in default, assigns property ownership to the mortgage lender, and determines a date upon which the property will be sold. These proceedings usually last between six and 18 months. Once the foreclosure is completed, the individual or family living in the house—usually the homeowner, but sometimes a renter—must vacate, and the property is put up for sale at public auction. In the case that there is no highest bidder or no bids are made at the minimum asking price, the title remains with the mortgage lender.
In states with a non-judicial foreclosure process, a mortgage lender can immediately send a “notice of foreclosure” or “notice of default” to a borrower in default, as well as to the recorder of deeds. In these states, the lender can set the date of the property’s sale, while the homeowner can sue to stop the foreclosure process.10
In the event of foreclosure of a rental property, tenants are subject to immediate eviction upon transfer of title.
A Note about the Mortgage Foreclosure Measures We Focus On: To be sure that we only counted instances where a homeowner defaulted on their mortgage payments and lost their house in a foreclosure, we avoided any “pre-foreclosure” datasets, which record any homeowners in default. This is because many of these houses may be foreclosed upon but never actually sold. We chose instead to analyze mortgage foreclosure sales exclusively. For the purposes of this report, a “mortgage foreclosure sale” includes foreclosure sales, short sales, and REO sales—three common types of real estate transactions resulting from payment default and foreclosure processes.
Tax Foreclosure
Definition: Tax foreclosures occur when a local government sells a homeowner’s property after the homeowner falls exceedingly behind on their property taxes. All U.S. states have laws that permit the placing of a lien on the property for the amount of property taxes past due. If the taxes remain unpaid after a certain period of time, municipalities auction the lien or the property to private purchasers and investors. Prior to tax foreclosure, most owners have a right to redeem their property by paying the tax sale purchaser the purchase price, plus interest, penalties, and other costs. A failure to redeem leads to tax foreclosure.
Many argue that tax foreclosure laws serve an important purpose in ensuring that local governments recover tax revenue needed to provide essential services. However, these laws often produce profits for tax sale purchasers at much higher rates than ordinary investments. Most banks, for example, provide interest on savings accounts at less than 1 percent, while many states permit tax sale purchasers to recover interest at rates of 18 percent or more. Such excessive penalties can make it near impossible for homeowners to stave off tax foreclosure.
Citations
- U.S. Census Bureau ACS 1-year estimates, 2018 source
- Data were collected at the county or county-equivalent level. In the United states, a “county-equivalent” is an area that is not within the geographic boundaries of any county but is defined as equivalent to a county by the U.S. Census Bureau for statistical purposes. For example, in Maryland, Missouri, Nevada and Virginia, one or more cities are independent from any counties and are considered county-equivalents.
- The ‘national’ housing loss rate described here and used as the denominator for the national Housing Loss Index does not represent the entire United States, but rather is calculated based on the 2,221 counties in our dataset for which both eviction and foreclosure data were available. This represents about ⅔ of the entire United States, and excludes 922 counties.
- The DataCorps team utilized their count of evictions and calculated rates based on the number of renter households provided by ACS 2012-2016 data. The renter households may differ slightly from the numbers used by Eviction Lab which used a proprietary source of this data (ESRI), which accounts for any (typically small) variation between rates and averages reported by DataKind and Eviction Lab. In addition, eviction data for Maricopa County was provided by Maricopa County Justice Courts as it was not available from Eviction Lab.
- There was considerable variation in the amount of foreclosure data available among the counties for which data was available. For the five years between 2014 and 2018, some counties had data for all 60 months, while other counties had data for less than 20 percent of this period. Unfortunately, it is not clear from the ATTOM dataset if the absence of recorded foreclosure sales for a county in a given month reflects a genuine absence of sales, or is merely missing data.
- For example, see Collinson & Reed, The Effects of Evictions on Low-Income Households, 2018; Shelton, Mapping dispossession: Eviction, foreclosure and the multiple geographies of housing instability in Lexington, Kentucky, Geoforum, 2018; and Immergluck, D., Ernsthausen, J., Earl, S., & Powell, A. (2020). Evictions, large owners, and serial filings: findings from Atlanta. Housing Studies, 35(5), 903-924.
- Raymond et al. Cityscape
- source
- Wisconsin Homeownership Preservation Education, Understanding Default and Foreclosure, Madison, Wisconsin: University of Wisconsin-Extension, Winter 2010, source
- Urban 2009 report
Housing Loss and Poor Data
“You can’t manage what you can’t measure.” – The New Republic
Our project began ambitiously and, as we found out, naively. We had set out to build a comprehensive, nationwide map of total home and land loss throughout the United States. We wanted to display everything from evictions and mortgage foreclosure to more obscure forms of loss like civil asset forfeiture, takings via eminent domain, partition sales of heirs property, and the privatization of public land.
Last summer, we gathered a dozen of the nation’s foremost property rights experts to brainstorm on how to execute this grandiose plan. The experts were extremely polite and helpful, but their occasional looks of befuddlement betrayed their skepticism about the scope of our effort. As we learned over the previous year, they were right.
The dirty secret of the housing space is that a significant amount of the data needed to comprehensively illustrate property loss is either inaccessible, of poor quality, or simply does not exist.
Over the last 12 months, our project scope narrowed to focus on mechanisms of loss that are best represented in spreadsheets and databases: evictions, mortgage foreclosures, and, to a lesser extent, tax foreclosures. Yet efforts to obtain even this data and prepare it for mapping and analysis took several months, as we encountered myriad issues. Datasets were missing entire years or sets of census tracts. Critical information, such as addresses and court case verdicts, was not recorded. Court-provided eviction datasets did not capture informal evictions, and many are plagued by well-known issues related to quality control. Finally, there was a striking absence of standardization across datasets, exacerbated by often bewildering idiosyncrasies.
Yet within other areas of the U.S. housing space, such as affordable housing and homelessness, public policy and funding allocation is increasingly data-driven. The Department of Housing and Urban Development (HUD), for example, utilizes its voucher management system to fund, monitor, and manage the use of housing choice vouchers by public housing agencies. Homeless service providers are also required by federal mandate to collect and share information on homeless populations with HUD, which helps to steer funding for Continuums of Care across the country.
The real estate sector is also heavily data-driven. Companies such as Zillow, CoreLogic, ATTOM, and Black Knight comprise a lucrative industry focused on collecting granular real estate data, bundling it, and selling it to brokerages, rental sites, insurance companies, and even government agencies. Other firms provide landlords and property management groups with information on households’ rental histories, or investors with aggregated tax sale lists.
And yet, data on an essential component of the housing space—housing loss—is often difficult to obtain, cost-prohibitive, of poor quality, or non-existent, even after the mortgage foreclosure and eviction crises resulting from the Great Recession. The federal government did create the National Mortgage Database in 2010, in order to track delinquent mortgage payments and foreclosures, but according to the New Republic, the database only includes 5 percent of all mortgage holders nationwide. Despite calls for an eviction database, such as in Senator Michael Bennett (D-CO)’s 2019 Eviction Crisis Act, no such tool has materialized.
Publicly available, high quality data is critical for crafting effective housing policy, and we would be remiss not to mention the tremendous efforts of organizations such as the Eviction Lab, Loveland, City Life/Vida Urbana, the Anti-Eviction Mapping Project, Tenants Together, JustFix NYC, and countless others that provide open data on evictions, tax foreclosures, and other types of housing loss. Various city and county GIS offices around the country provide invaluable geospatial tools, too. During trips to South Bend, Indiana and Winston-Salem, North Carolina, for instance, we met civil servants more than ready to assist in our search for data. But issues related to accessibility, data quality, and data coverage persist at many levels of government, making it nearly impossible for anyone to carry out a comprehensive analysis of housing loss in the United States.
Why It Matters
“If you don’t know how many people are being evicted in America, then who’s to say it’s a serious problem?” – Researcher, Eviction Lab1
The limits that poor data create for decision-making around housing policy cannot be understated, especially within the context of increased housing insecurity amid the pandemic. Municipal leaders simply cannot make smart decisions about housing solutions if they do not know the scale of the problem, where housing loss is most acute, and who is most impacted. One high-ranking city official told us that he had rental assistance funds to distribute, but had no idea where within his city eviction rates were highest, and was in the dark about how to direct the money.
Not only that: In the absence of data, it is easy for politicians, the media, and advocates to shape narratives based on anecdotal or incomplete information. For example, last year the tremendous efforts of ProPublica and the Atlantic, among others, shone a spotlight on Black land loss as a result of heirs property. But, experts say that heirs property is not only a problem for the Black community: it impacts colonias in Texas, white communities in Appalachia, and Native lands. However, without good data on heirs property, media attention has shaped this issue as solely a Black problem.
The Road to a National Dataset
The ability to create a national database for housing loss is stymied by a number of factors. The data may be too difficult to generate, or data storage is so decentralized that aggregation at scale would be extremely resource-intensive and time-consuming. Local policies, differences in institutional capacity, and a lack of standardization across jurisdictions countrywide further compound the problem.
Many of the most vulnerable forms of housing and land tenure are informal, existing outside of the legal system by definition. It is likely that hundreds of thousands of Americans—perhaps even millions—own property informally, without any title or deed. For instance, roughly half a million people live in Texas’ colonias, makeshift houses extralegally built on subdivided plots of land near the Rio Grande and elsewhere. Heirs property, or land passed down from generation to generation without a will, is estimated to comprise more than one-third of Black-owned land in the southern United States. Outside of a few pioneering, albeit limited, geographic studies, nobody is able to provide an actual figure regarding informal property ownership, a crucial datapoint for research and policy. Without any way to prove a negative, the data remains out of reach.
But even more mainstream forms of housing loss are marred by coverage gaps.
Most notably, tax foreclosure, which most often occurs due to the long-term non-payment of property taxes, is omitted from our national-level analysis. No entity publicly publishes or even sells nationwide tax foreclosure data, according to multiple academic experts and industry leaders.
This lack of data does not imply that tax foreclosure is an insignificant issue. In fact, we were motivated to look at tax foreclosures after seeing that Detroit, Michigan experienced 143,958 tax foreclosures between 2002 and 2016, based on research by Loveland Technologies. Aside from disproportionately impacting poor, usually minority, households, these tax foreclosures led to vacancy, blight, and the deterioration of entire neighborhoods. But when we attempted to replicate Loveland’s research nationwide we found that the only data available was on tax sales, far upstream from actual tax foreclosures. So, while we had an idea of how many properties entered the tax foreclosure process, we had no idea how many people actually lost their homes. Industry experts told us that the “conversion rate” from tax sale to tax foreclosure hovers around 0.5 percent to 5 percent nationally, but our Indianapolis dataset suggests otherwise. The conversion rate in Marion County is approximately 25 percent.
The decentralized governance structure of mortgage foreclosure data similarly frustrated our efforts to collect a national dataset and led to our decision to purchase data from ATTOM Data Solutions. Private firms such as ATTOM possess the resources, networks, and experience to collect mortgage foreclosure data at scale. These companies provide a valuable service, and their products are not cheap, unsurprisingly. Access to the data is cost-prohibitive to many stakeholders, resulting in unequal power dynamics and information asymmetries.
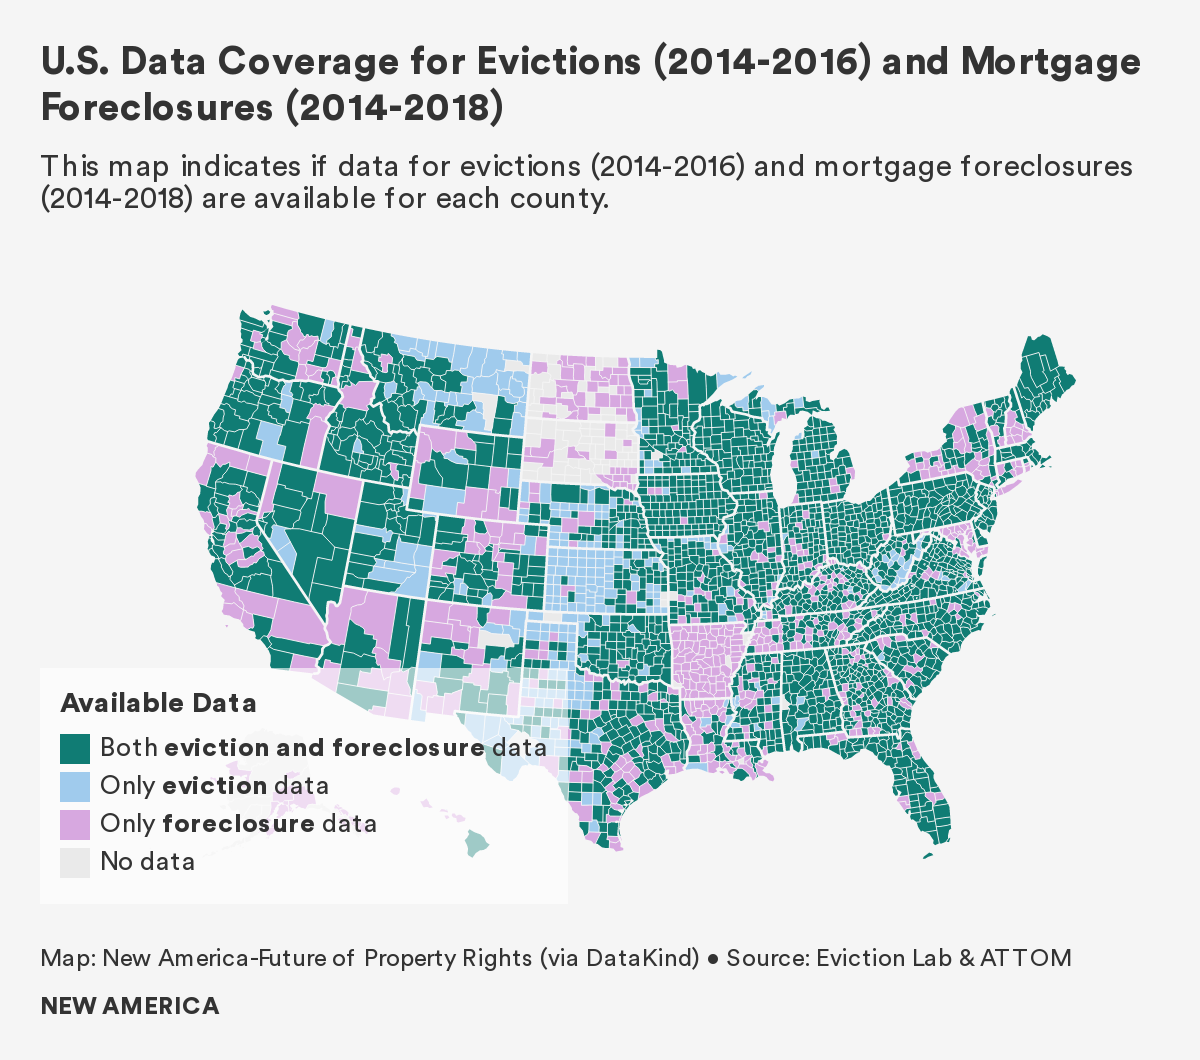
The geographic coverage of ATTOM’s nationwide dataset is extensive. Yet gaps clearly exist in the middle of the United States, and in a few other sparsely populated areas, such as the Upper Peninsula of Michigan, northern Alaska, and southeast Utah. In total, mortgage foreclosure data is not reported in 409 U.S. counties and county equivalents, or 13 percent of the country. Because ATTOM is a commercial actor, its decisions around data collection are driven by profit: In some counties an overall lack of real estate transactions means that data collection is not worth ATTOM’s efforts.
The eviction dataset created by Eviction Lab, by far the most comprehensive aggregation of eviction data in the United States, also contains noticeable gaps in coverage. The initiative’s methodology report outlines various difficulties encountered during the data collection process. County-level data from Alaska, Arkansas, and North and South Dakota is omitted from the dataset, for example, because local governments reported eviction data too inconsistently between 2000 and 2016. Other state policies and local idiosyncrasies created additional barriers to data collection: the extremely decentralized court structure in Upstate New York, sealed eviction files in California, inconsistent court records in New Jersey, and a widespread inability to access data in rural counties throughout the American South, to name a few.
Quantitative analysis of available data also does not provide a full idea of the scope of evictions, because of the prevalence of "informal evictions," which occur outside of the formal legal process. A landlord might remove a unit’s door or change locks to force a tenant out. Other times, a hike in rent or the mere threat of an eviction filing is enough to convince tenants to pack their bags and move. Research by Matthew Desmond, author of Evicted and principal investigator at the Eviction Lab, suggests that in Milwaukee two informal evictions happen for everyone one formal eviction. We are uncertain if rates are similar in other communities, but if the occurrence of informal evictions are anything close to what Desmond found in Milwaukee, then we are severely undercounting the problem.
On the Ground: Binders Full of Foreclosures
“This is on hold. I have multiple other things going on…” – County clerk, in response to request for data2
The United States contains 3,143 counties and county-equivalents, each with its own laws, government offices, and court systems. Individual counties and municipalities collect, maintain, and share data on housing loss through many different methods. Within jurisdictions, various government offices can hold overlapping and fractured land administration mandates. A lack of coordination between these units, along with disparities in institutional capacity, often results in unstandardized data with varying levels of reliability.
No two counties are the same, and it can be difficult to ascertain what data is available, where it is stored, and who can share it. Aside from a quick visit to the Eviction Lab or Loveland website, locating open data on housing loss requires a significant allocation of resources and time.
Our own data search led us across the country, with varying degrees of success. Occasionally, we connected with the right civil servant or government office, someone with intimate knowledge of the available data, its storage location, and how to access it. A short conversation with MapForsyth, the local geographic information office in Winston-Salem, North Carolina, for example, resulted in access to neatly organized Excel spreadsheets on evictions, mortgage foreclosures, and tax foreclosures. The clean and granular data more or less matched project needs, and maps were generated with relative ease as a result.
The data search was entirely unsuccessful at other times. We greeted a sheriff’s office clerk in a mid-sized Midwestern city one morning, inquiring about mortgage foreclosure data, and were unenthusiastically handed a stack of binders. Short on time, we were unable to sort through the many pages and extract any information. Back in Washington, D.C., we asked if the office could scan the documents. The clerk replied that our request was not a priority, and soon became unresponsive to our emails.
In a major Sun Belt city, we spent half a day trekking from government office to government office, asking about tax foreclosure data. No office possessed any readily available data, and after an additional six months of emails and phone calls, we were told that the relevant information did not exist in a mappable format.
Data was inaccessible or nonexistent even if the problem of home loss was widely acknowledged. Housing advocates, researchers, service providers, and decision-makers in Indianapolis repeatedly mentioned that mortgage foreclosures were a still significant issue in Marion County, a full decade after the Great Recession. But no one was able to provide the data—not the mayor’s office, the courts, the Chamber of Commerce, nor the research universities. After exhausting all options, we paid ATTOM thousands of dollars for relevant data.
Quirky Data and No Verdicts
“That could be because the clerk did not enter that…” – Communications Officer, Arizona, explaining data gaps3
Locating and obtaining the necessary datasets for this project was only half the battle. Because housing data is not standardized to a national, or even state, level, each dataset came with its own quirks and caveats.
For example, the eviction data provided by MapForsyth contained successive, repeat addresses. But these were not entry mistakes. Rather, this repetition signified that multiple tenants were evicted from the same address, perhaps a multi-family rental building. Our contact at MapForsyth thankfully shared this peculiarity with us, otherwise we might have de-duplicated the data, leading to an undercount of 2014-2018 evictions by 7,078.
Other datasets were significantly incomplete. Approximately 30 percent of 2014-2018 eviction filings in Maricopa County, Arizona, or over 97,000 cases, lack judgment information. The reasons vary: the case was dismissed; pre-trial mediation between the landlord and tenant worked; both parties won something; or the clerk simply failed to enter the information. With so many possible outcomes, we were unable to discern whether an eviction occured in each of these cases, and these filings were omitted from our data visualizations. As a result, this report’s maps under-represent evictions in Maricopa County.
We wrestled with whether producing an incomplete map was worse than producing no map at all, and in the end decided that visualizing two-thirds of evictions with appropriate disclaimers was better than not visualizing any evictions. Other researchers have come to the opposite conclusion: Eviction Lab, for example, excludes Phoenix from its map and rankings because they determined the data was too poor to be trustworthy, even though by our count the city has some of the highest eviction rates in the country.
Geocoding, or assigning latitude and longitude to each instance of housing loss, was another significant issue. In order to map county-level data for the entire country, we had to ensure that geocoded data were adjusted to a standard appropriate coordinate reference system (as in the case of Forsyth County), and in cases where the datasets we acquired needed to be geocoded (as in the case of evictions in Maricopa County), we had to navigate unstandardized collection of address data. It required significant time to translate this data into a mappable format.
Worse, some datasets were missing GIS information. Almost a quarter of 2014-2018 eviction filings in Maricopa County, or roughly 66,500 cases, lacked granular geocodes. We were able to incorporate these filings into our overall eviction rate for the county, but were forced to exclude the evictions from our maps. So while the absence of geocoding in a housing loss dataset does not preclude all analysis, it hinders the ability for researchers, housing advocates, and policymakers to know who are losing their homes, and where. This and similar issues contribute to imperfect policy development, as funding, resources, and outreach could be misdirected into the wrong communities and neighborhoods.
Power Dynamics and Policy Implications
“Some don’t want heirs property to be identified. Investors can use that information to do unscrupulous things” – Government researcher4
Licensed data on housing loss, such as privately-bundled mortgage foreclosure data, is usually expensive. Local nonprofits, community-based organizations, and even some cash-strapped municipal government offices may lack the funds to purchase these datasets.
This lack of open data creates significantly unequal power dynamics in the U.S. housing space, and leads to inadequate policy solutions at various levels of government. In some cases, it leads to exploitation of the very communities who are experiencing property loss, as better informed opportunists swoop in to take advantage of communities with precarious property rights.
Wall Street’s exclusive access to information on mortgage foreclosures following the Great Recession, for instance, fundamentally altered the U.S. housing space. Private equity, hedge funds, and other investors purchased hundreds of thousands of single-family homes in foreclosure, totaling over $60 billion in value. Many times, firms such as the Blackstone Group bought these properties at discounts of 30 to 50 percent. According to the New York Times, 95 percent of distressed mortgages managed by Freddie Mac and Fannie Mae were auctioned off to Wall Street.
By contrast, the lack of a government database on mortgage foreclosures resulting from the 2007 to 2009 economic downturn contributed, in part, to the insufficient response from policymakers to better protect vulnerable homeowners.
After the mortgage foreclosure crisis, entire neighborhoods were purchased and converted into rental properties; the United States added less than 1 million owner-occupied homes between 2007 and 2017, but 6.5 million in renter-occupied homes. The information asymmetry between government and Wall Street irrevocably changed cityscapes and put communities at risk.
The rental market provides another example of powerful information asymmetries. Many landlords subscribe to online services that flag individuals with prior evictions, or even eviction filings, and frequently deny rental applications based on this data. And yet community-based organizations, created to help these very same renters find stable housing, cannot access this information.
Conclusion: A Critical Policy Recommendation
The report text that follows surfaces dozens of findings and puts forward multiple policy recommendations. And yet, if the reader were to take away only a single recommendation from this report, it would be this: That there is an urgent need for all levels of government—federal, state, and local—to work together to improve the quality and availability of housing loss data. It is impossible to solve a problem that is poorly understood, and with the lack of records available we simply do not fully grasp the issue of housing loss in the United States. Our report and similar efforts shine some light on particular components of this problem, in particular places. But these studies are far from comprehensive. Only after open, accurate, and up-to-date data is available on who is losing their homes, where, when, and how, we will be able to protect at-risk families from the terrible consequences of displacement.
Citations
- From an interview with the authors.
- From a conversation with the authors.
- From a conversation with the authors.
- From an interview with the authors.
Housing Loss in the United States: Our National Rankings and Maps
We estimate that nearly 5 million Americans are forcibly displaced from their homes every year due to eviction, mortgage and tax foreclosure, and other mechanisms of loss. This year, as a result of the COVID-19 crisis, we anticipate that number will be magnitudes greater. As we write, more than a quarter of Americans have reported that they cannot pay their rent or mortgage. On September 1 the Centers for Disease Control (CDC) announced a nationwide ban on evictions until the end of the year. However, rent will still be due on January 1, and thus far the government has not offered rent forgiveness and only limited relief.
We also know that affordability was the major driver of housing instability, even before the COVID-19 crisis. Housing is the largest expenditure for most American households, and is becoming increasingly unaffordable. The growth of housing costs has outpaced income growth over the last sixty years, contributing, in part, to an ongoing affordable housing crisis. Between 1960 and 2016, the median monthly rent across the United States increased by 61 percent while median income among renters increased by only 5 percent. Among homeowners, the median home value increased 112 percent while the median homeowner income increased by 50 percent.1 These disparities result in greater housing cost burdens for both renters and homeowners, and put both groups more at-risk for missing rent or mortgage payments, which very often lead to home loss through eviction or mortgage foreclosure. In some instances, these two processes are interrelated, such as when a renter is evicted because their landlord is experiencing a foreclosure.2
But beyond that, we know very little about where housing loss is most acute, and who is most at risk. As mentioned in the previous section, U.S. housing loss data is poor and incomplete, leading decision-makers to underestimate housing loss across the country and leaving them in the dark as to how to remedy the issue. Likewise, this report certainly under-represents the actual scale of home loss across the country. We were not able, for example, to capture partition sales that force Black families off their land, or the abandonment of Puerto Rican homes destroyed by Hurricane Maria, nor were we able to analyze tax foreclosures, informal evictions, takings via eminent domain or other forms of housing loss.
Instead, we chose to focus on two common forms of housing loss for which data does exist, albeit imperfectly—eviction and mortgage foreclosure. Although these two modes of loss are distinct in the timescales in which they occur and the category of tenure they impact, both forms of displacement bring about deleterious effects on the communities and neighborhoods in which they take place. In some cases, mortgage foreclosures on renter-occupied properties lead directly to the eviction of tenants; in other cases, foreclosures occur independently of eviction but high rates of both forms of displacement are found to be geographically concentrated. Our focus on these two mechanisms aims to characterize housing loss holistically and to identify regions at risk of experiencing the negative downstream impacts of housing instability, which are shared regardless of the particular mode of displacement.3
How Are People Losing Their Homes?
Housing Loss Index4
In order to measure housing loss that includes both evictions and mortgage foreclosures, we first calculated each county’s housing loss rate. The housing loss rate combines the total number of evictions and the total number of mortgage foreclosures for a given geography, and then normalizes that sum by the total number of renters and the total number of homeowners with a mortgage within the given geography.
We then converted the housing loss rate into a housing loss index by comparing a given county’s housing loss rate to the national average, across all counties for which we have data. A county with a housing loss index of 1 experiences a housing loss rate equal to the national average, while an index of 3 indicates that the county experiences a housing loss rate that is three times the national average.
Based on these calculations, we found that the national average housing loss rate was 2 percent between 2014 and 2016.
On a state-wide level, housing loss between 2014 and 2016 was most severe in Arizona, Nevada, and Florida. All three of these states saw rates of housing loss of more than 3.8 percent, almost twice the national average. As of June 2020, each of these states had unemployment rates at or above 10 percent. Given that non-payment of bills is by far the most common cause of housing loss, and given their pre-existing housing vulnerability, we expect these states to be disproportionately impacted by the pandemic-era housing crisis.
Conversely, the states reporting the highest unemployment rates as of June 2020—Massachusetts, New Jersey, and New York—have historically had below-average levels of housing loss.5
On a county and county-equivalent level, Petersburg City, just south of Richmond, Virginia, had the highest overall housing loss rate in the country. The housing loss rate in this independent city is roughly 12 percent, six times the national average. Eviction accounts for 96 percent of all housing loss in Petersburg City, affecting approximately one in eight renters, and drives the high overall housing loss rate. Foreclosure rates in Petersburg City are also slightly above the national average.
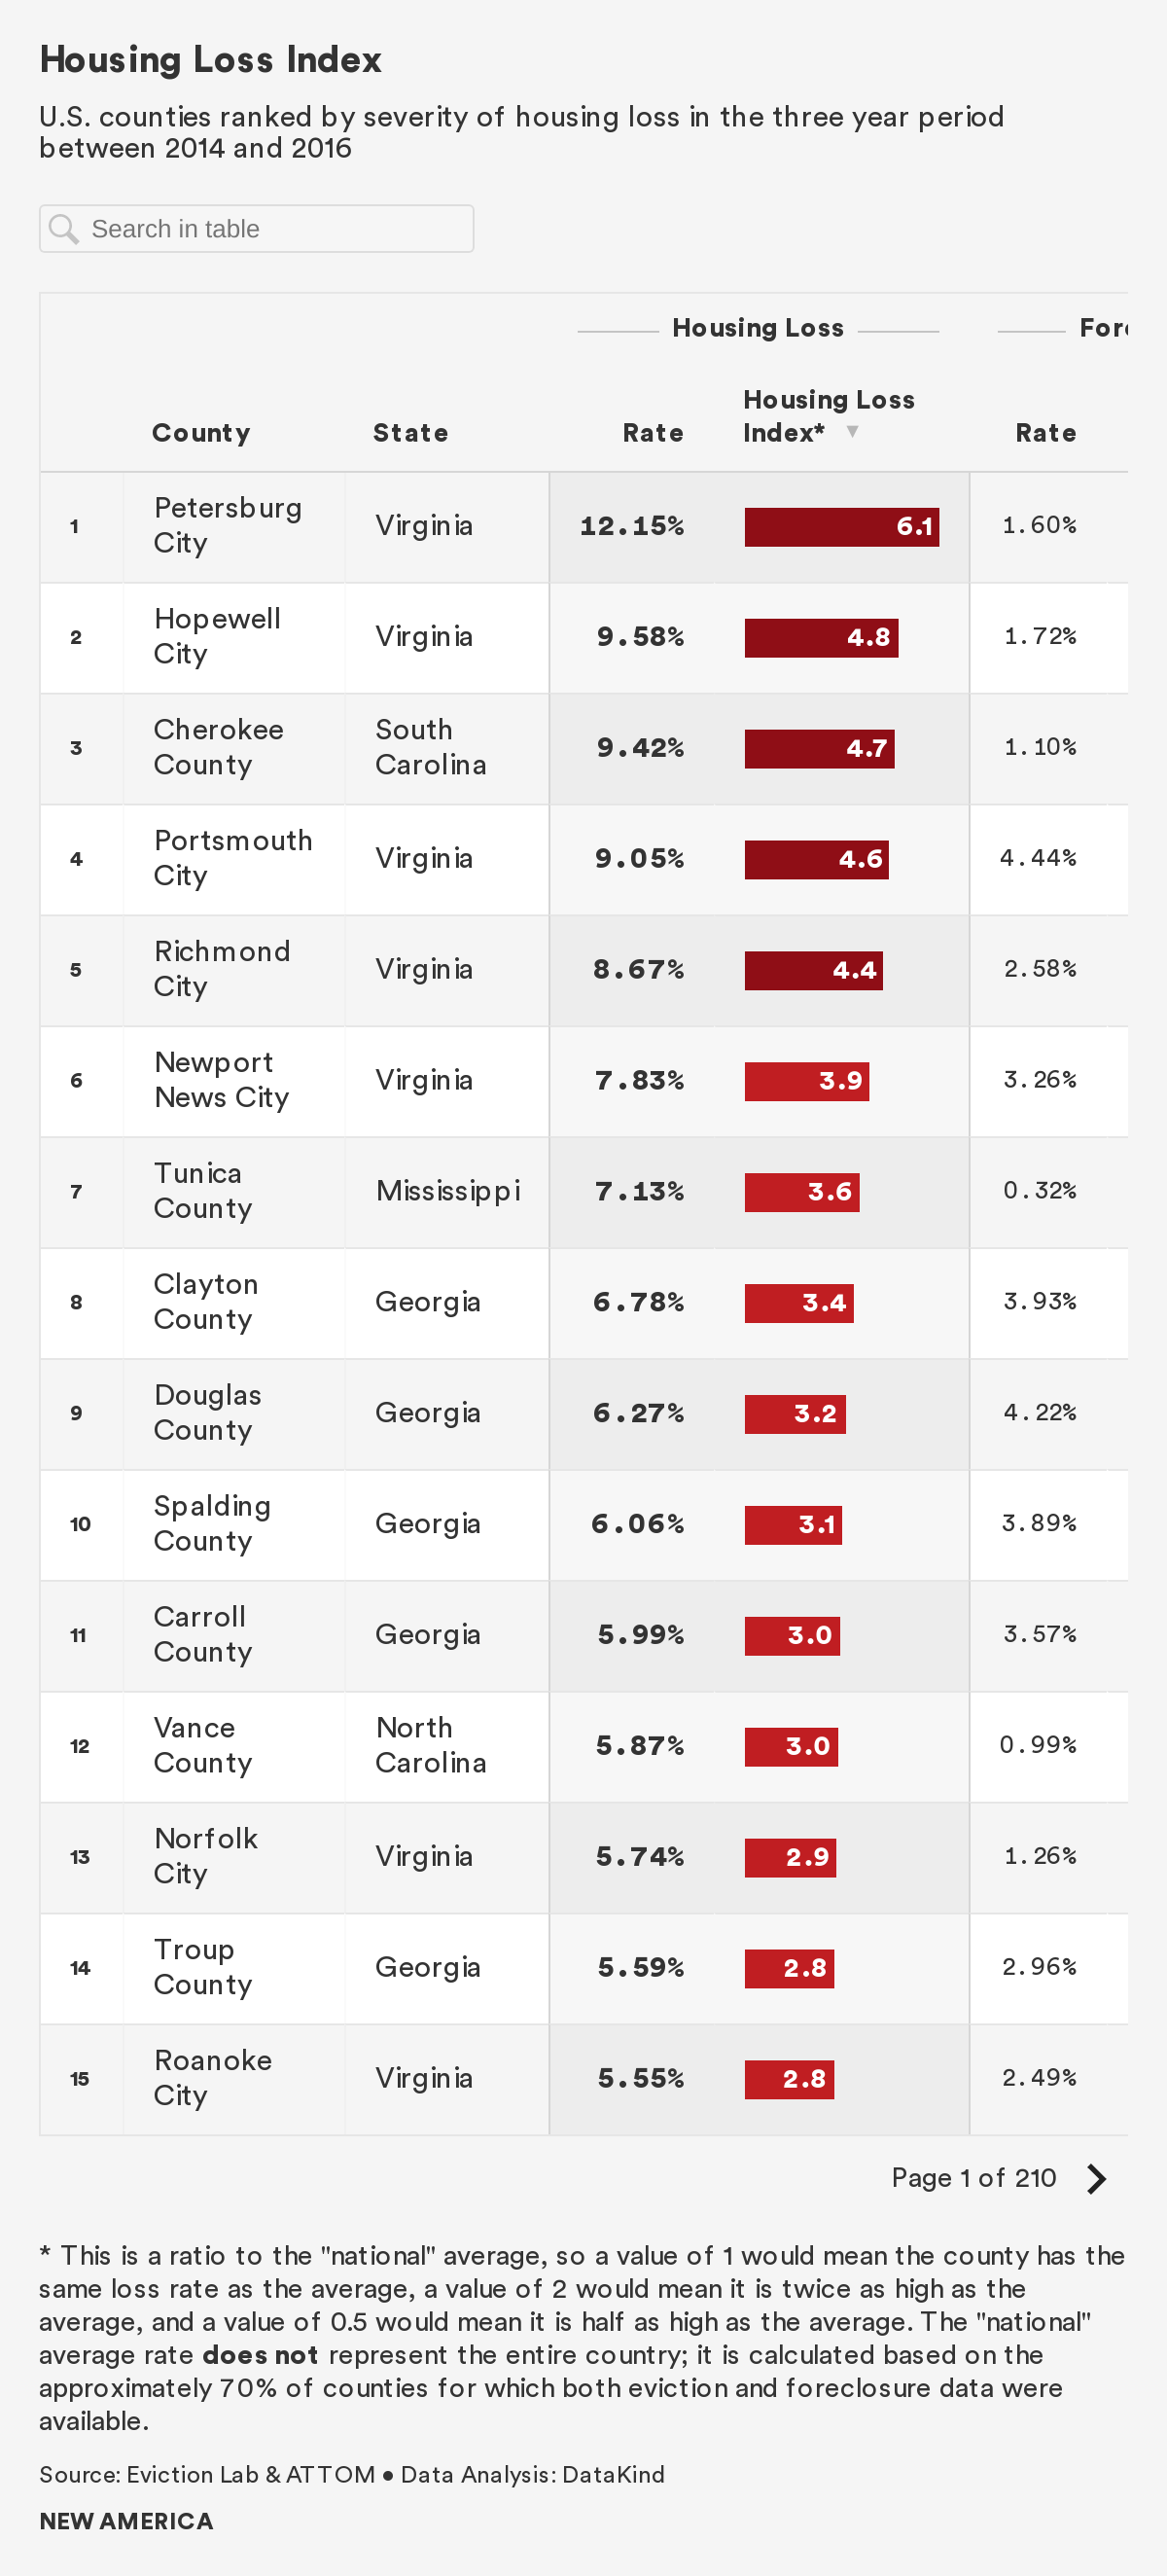
Of the counties or county-equivalents with the twenty highest housing loss rates, eight are located in Virginia, eight are located in Georgia, and the remaining four are located in Mississippi, North Carolina, Florida, and South Carolina, respectively. These 20 counties have rates of housing loss ranging from 4.4 to 12.2 percent—between two and six times the national average.
Eviction Findings: The national average eviction rate was 2.6 percent between 2014 and 2016. Based on available data, we know that approximately 900,000 renter households were evicted from their homes each year. However, data is unavailable for some counties and states, with North and South Dakota, Arkansas, and Alaska notably absent, as indicated on the map below.6
States with the highest rates of eviction are generally located in the Southeastern region of the United States, while those with the lowest rates of eviction are located in the Midwestern and Northwestern parts of the country. Though our findings suggest a geographic pattern, due to incomplete data we cannot determine whether these patterns are coincidental or due to common underlying mechanisms that relate to policy or demographics.
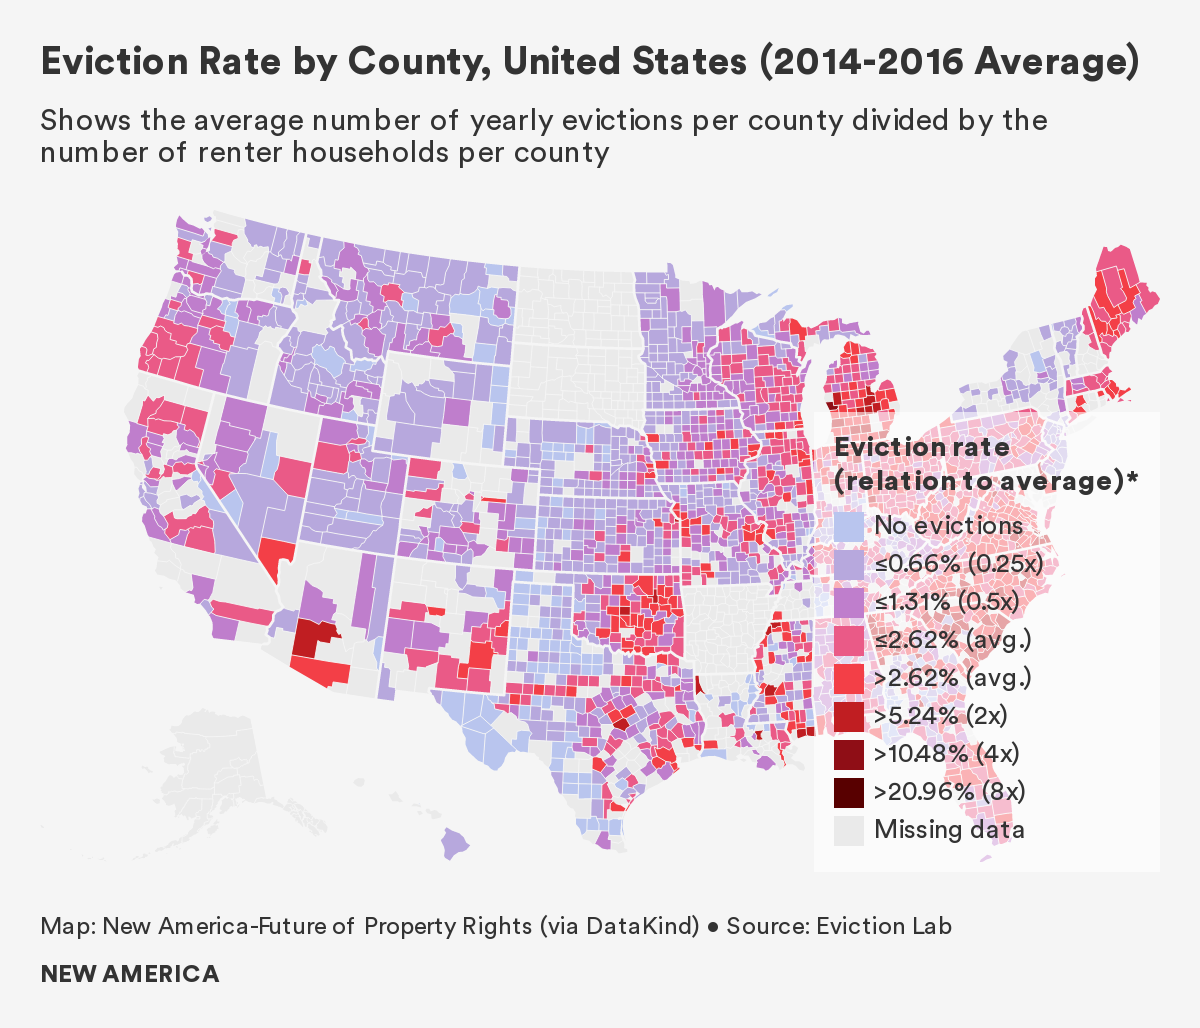
South Carolina experienced the highest eviction rate of any state between 2014 and 2016, at a rate of 6.2 percent and with an average of 26,430 evictions per year.7 Twenty of South Carolina’s 46 counties see rates of evictions greater than 5 percent, about twice the national average. Other states with high eviction rates include Arizona, Virginia, and Delaware.
By contrast, Minnesota had the lowest rate of eviction during the same period, at 0.8 percent and with an average of 4,802 evictions per year. Other states with low eviction rates include Montana, Utah, and Oregon. Given the prevalence of missing eviction data, it should be noted that our findings are limited to those states and counties for which data are available; as a result, states with large amounts of missing data such as North and South Dakota, are not represented in our analysis.
Cherokee County, a small county in northern South Carolina, had the highest eviction rate in the country: 17.9 percent, or nearly seven times the national average. Gaffney, the county seat, is known as the Peach Capital of South Carolina and also has the dubious honor of being the hometown of Frank Underwood, the fictional main character of the drama House of Cards. Evictions in Cherokee County account for 94.1 percent of all housing loss in the county, though renters comprise only a third of the population. Cherokee County had an 11 percent unemployment rate as of June 2020, portenting an even greater eviction rate in the coming months.
Perhaps most striking, six independent cities in Southern Virginia express eviction rates that rank in the top 10 nationally. Experts at the local RVA Eviction Lab point to several factors—including low court fees for filing evictions, and a lack of policies that protect renters—as driving the region’s high eviction rates.
Several counties in Georgia, Michigan, and Mississippi, respectively, also had acute eviction rates.
U.S. Counties With Highest Average Eviction Rates (2014-2016)
| Rank | County | State | Percent Renters | Eviction Rate |
|---|---|---|---|---|
| 1 | Cherokee County | South Carolina | 30% | 17.88% |
| 2 | Petersburg City | Virginia | 59% | 16.82% |
| 3 | Hopewell City | Virginia | 50% | 14.64% |
| 4 | Portsmouth City | Virginia | 46% | 13.01% |
| 5 | Richmond City | Virginia | 59% | 11.69% |
| 6 | Muskegon County | Michigan | 26% | 11.27% |
| 7 | Newport News City | Virginia | 51% | 10.99% |
| 8 | Hampton City | Virginia | 44% | 9.84% |
| 9 | Vance County | North Carolina | 40% | 9.80% |
| 10 | Houston County | Georgia | 35% | 9.71% |
| 11 | Anderson County | South Carolina | 29% | 9.49% |
| 12 | Berkeley County | West Virginia | 27% | 9.45% |
| 13 | Tunica County | Mississippi | 61% | 9.20% |
| 14 | Calhoun County | Michigan | 30% | 9.15% |
| 15 | Douglas County | Georgia | 34% | 9.09% |
| 16 | Clayton County | Georgia | 49% | 8.98% |
| 17 | Carroll County | Georgia | 36% | 8.87% |
| 18 | Clinton County | Michigan | 20% | 8.74% |
| 19 | Hinds County | Mississippi | 41% | 8.71% |
| 20 | Rockdale County | Georgia | 32% | 8.64% |
Evictions in each of these counties or county-equivalents is undoubtedly influenced by unique demographic, economic, political, geographic, and historical factors. Further research is required to determine the underlying causes that are driving high eviction rates in these locations.
A Spotlight on Summer Eviction
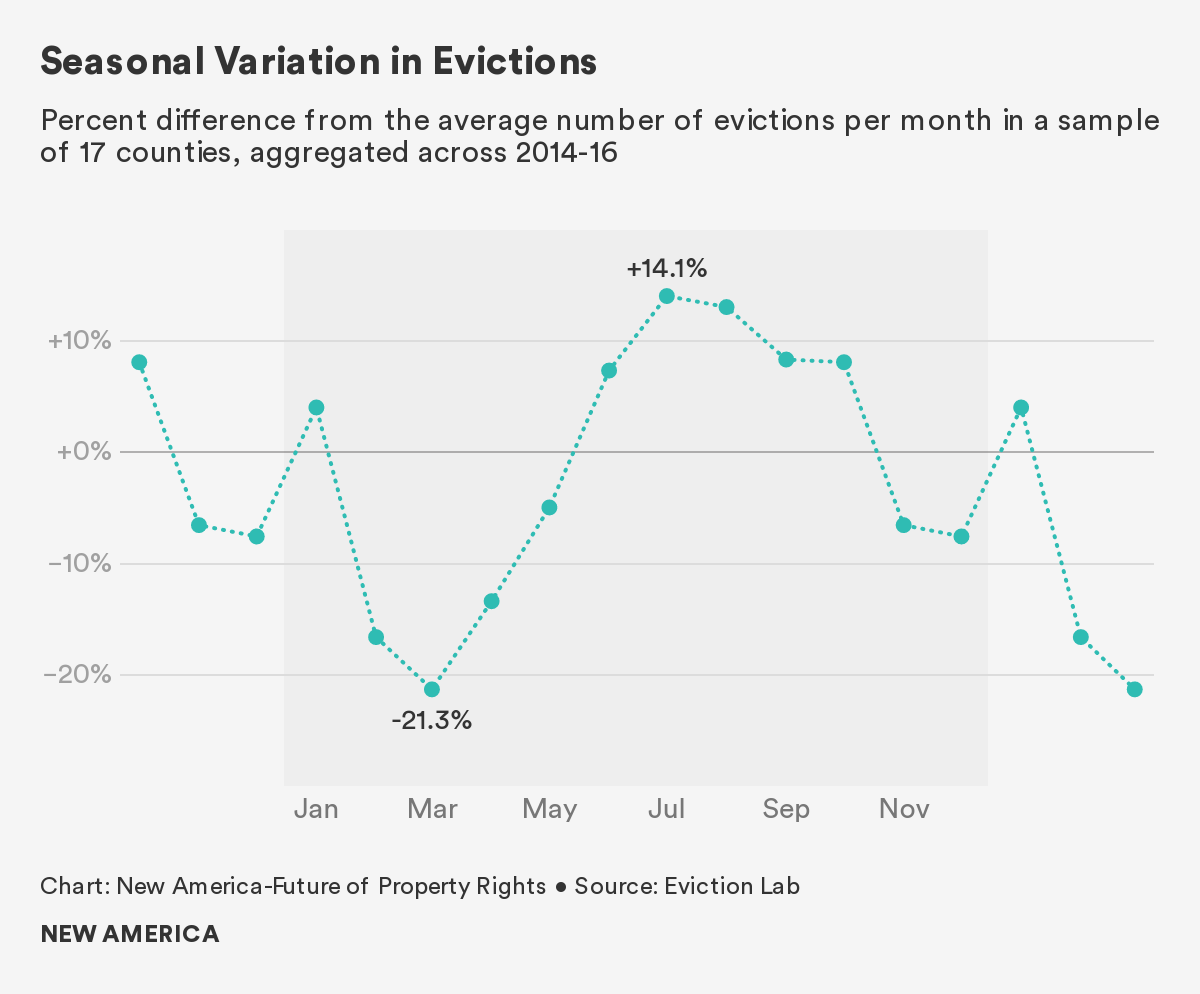
An analysis of more than 300,000 evictions over a three-year period across 17 counties conducted by New America and Eviction Lab shows that evictions spike in summer. The increase is not subtle: Eviction rates across the country are on average 40 percent higher in July and August than at their low point in March. In some cities, like Dallas and Richmond, eviction rates double from spring to summer.
Little is known about why evictions spike in summer, though researchers have some guesses.
The most obvious culprit is the high cost of summer utility bills: Nationwide, electric bills average $143 in July, compared to $90 in April. But that does not explain why even cold weather states, which do not see significant differences in summer utility costs, still experience summer eviction spikes.
This finding points to another factor that does not discriminate between Arizona and Alaska: Children are out of school during the summer. Care experts and frontline workers say the cost of summer care leaves some parents unable to make rent, and ultimately results in evictions. Indeed, a 2018 study found that nearly half of American parents say it is somewhat or very hard to afford summer care or camp for their children.
Mortgage Foreclosure: While national eviction data is available only for the three-year period from 2014 to 2016 (and therefore our housing loss index is limited to this time frame), our foreclosure data covers the five year period from 2014 to 2018. Based on our dataset, the average national mortgage foreclosure rate between 2014 and 2018 was 1.5 percent, resulting in approximately 670,000 households losing their homes to foreclosure each year.8 In multiple counties, foreclosure rates were above 5 percent. Overall, rates of mortgage foreclosure declined during these five years, but still remain high compared to rates before the housing crisis of the mid-2000s (the national foreclosure rate was 0.6 percent in 2006 and 1.8 percent at the height of the housing crisis in 2008).
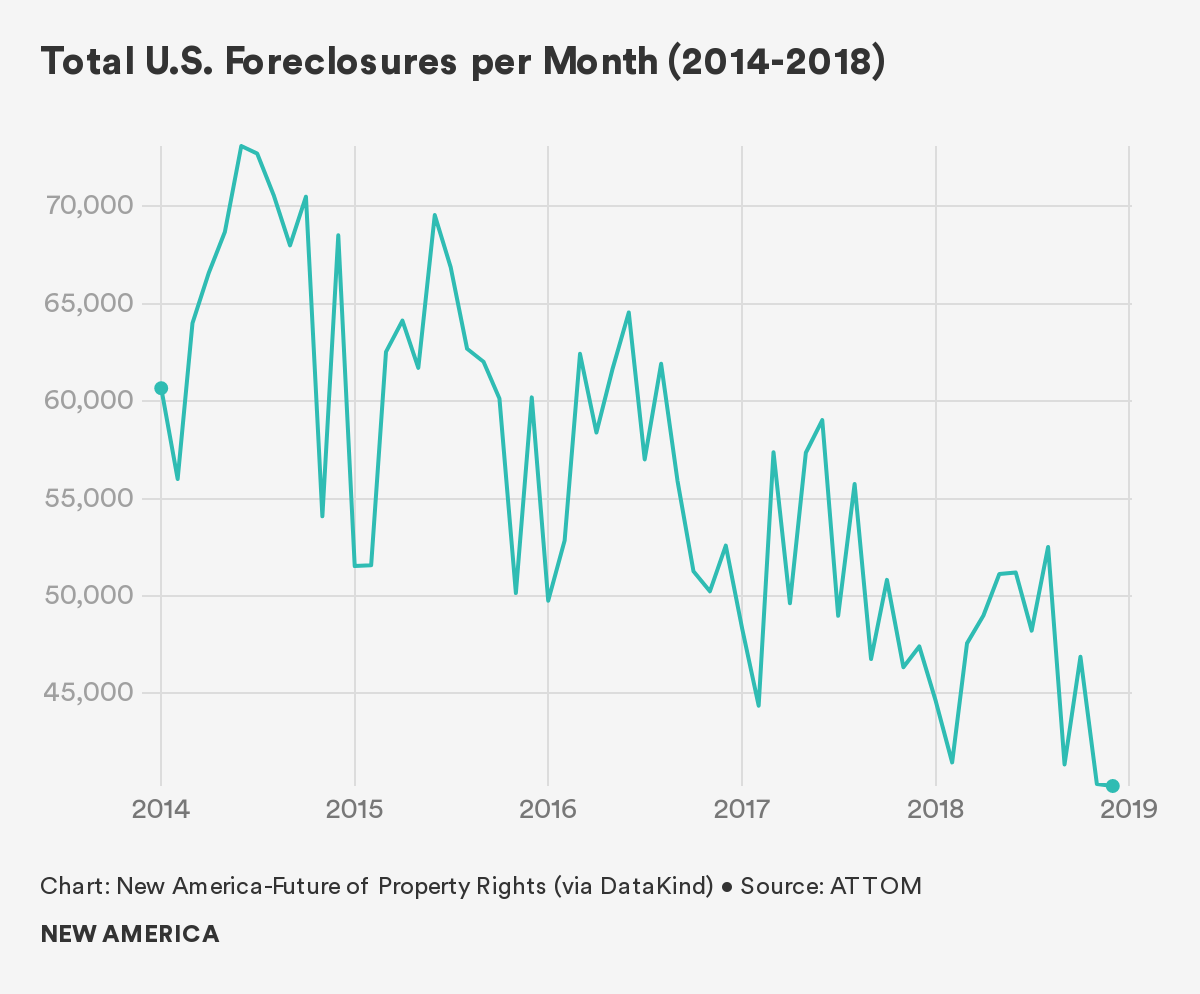
The state of Florida experienced the highest foreclosure rate nationally, at 3.7 percent. Nearly 105,000 Floridian households per year lost their home through foreclosure during the study period. Nevada, Arizona, Georgia, and Tennessee also displayed high rates of mortgage foreclosure, all over 2.2 percent.
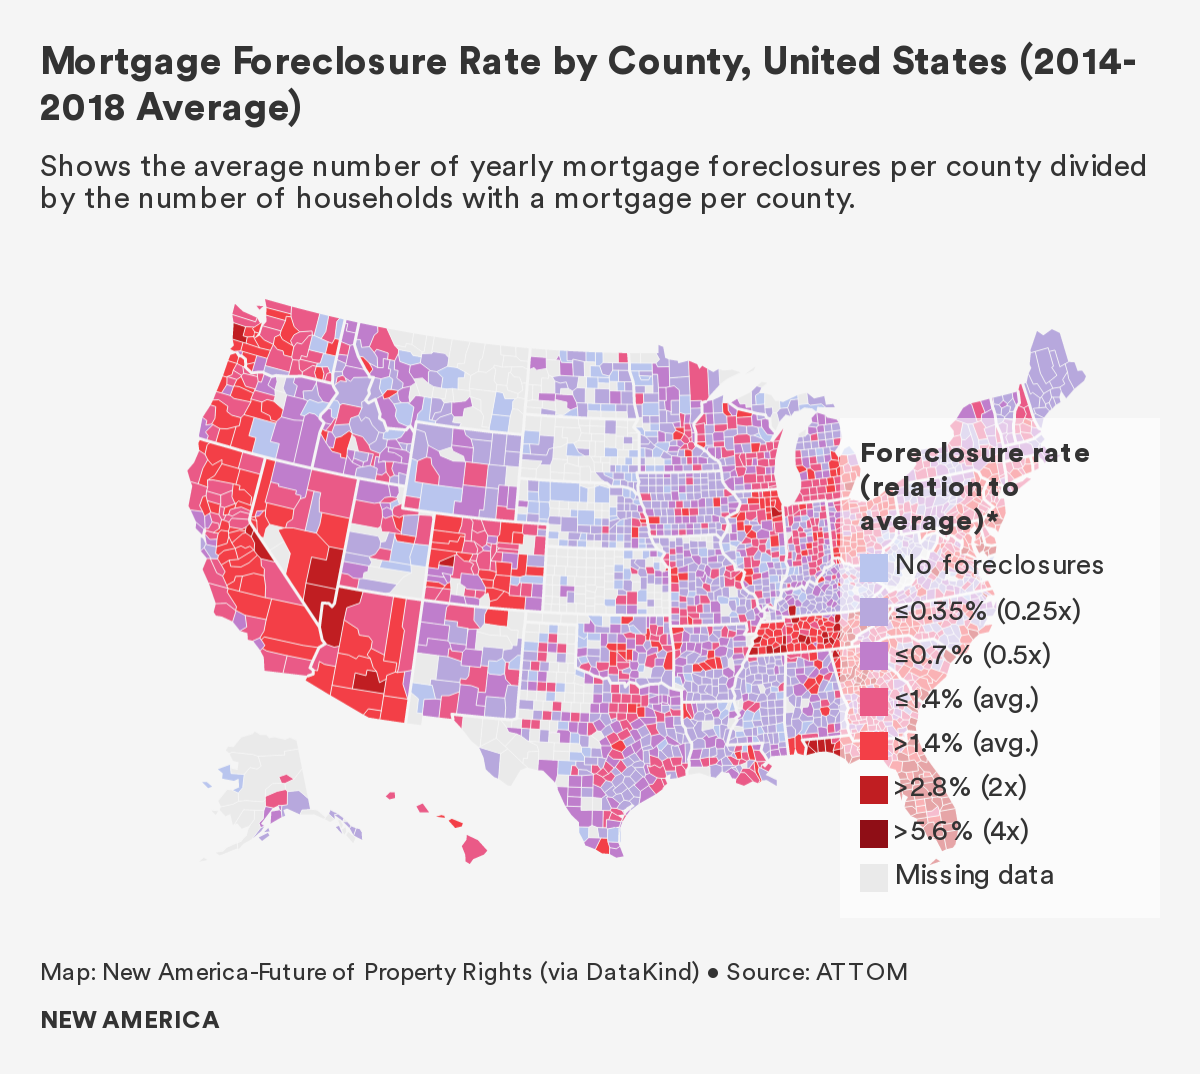
By contrast, Maine had the lowest average mortgage foreclosure rate nationally, at 0.1 percent or an average of 248 foreclosures per year between 2014 and 2018. Other states with low rates of mortgage foreclosure include West Virginia, Vermont, and Massachusetts, with rates less than 0.4 percent.9
The county with the highest foreclosure rate in the country is Avery County, North Carolina. This tiny county nestled in the Appalachian Mountains displayed an average foreclosure rate of 5.6 percent between 2014 and 2018. This finding is surprising because between 2014 and 2016, Avery County’s foreclosure rates were not in the top 20, but the county catapulted to the top spot after posting a foreclosure rate of over 8 percent in 2018.
Aside from Avery County, foreclosures are heavily clustered in Florida; eight Sunshine State counties rank in the top 20, all with rates over 4.2 percent. Several counties in Maryland, Virginia, and Georgia, respectively, are also included near the top of the rankings for average mortgage foreclosure rates.
Interestingly, a snapshot of top foreclosure rates between 2014 and 2016 is much more homogenous. In the three-year period from 2014 to 2016, the 13 counties with the nation’s highest foreclosure rates were all in Florida. In 2017 and 2018 foreclosure rates dropped significantly in several Florida counties, making room for other counties to rise to the top of the rankings.
Counties with the Highest Rates of Mortgage Foreclosure: 3-Year Average vs. 5-Year Average
| County | State | Average 3-Year Foreclosure Rate (2014-2016) | County | State | Average 5-Year Foreclosure Rate (2014-2018) | |
|---|---|---|---|---|---|---|
| Osceola County | Florida | 6.38% | Avery County | North Carolina | 5.60% | |
| Walton County | Florida | 6.38% | Walton County | Florida | 5.59% | |
| Gulf County | Florida | 6.35% | Osceola County | Florida | 5.24% | |
| St. Lucie County | Florida | 6.10% | Baltimore City | Maryland | 5.23% | |
| Pasco County | Florida | 6.07% | Gulf County | Florida | 4.87% | |
| Flagler County | Florida | 6.01% | Worcester County | Maryland | 4.86% | |
| Charlotte County | Florida | 5.87% | Sevier County | Tennessee | 4.86% | |
| Indian River County | Florida | 5.60% | Pasco County | Florida | 4.86% | |
| Volusia County | Florida | 5.46% | St. Lucie County | Florida | 4.78% | |
| Franklin County | Florida | 5.35% | Henry County | Georgia | 4.56% |
Mortgage foreclosure in each of these counties or county-equivalents is undoubtedly influenced by unique demographic, economic, political, geographic, and historical factors. Further research is required to determine the underlying causes that are driving high mortgage foreclosure rates in these locations.
Who is At Risk of Losing Their Homes?
Generally, correlation analysis at the county level is less useful than at the census tract level because counties are so large and heterogenous. Therefore, the findings below are quite broad and limited. Our census tract-level findings on who is at risk of displacement in each of our case study locations are more convincing and provide an avenue for further research and scaling.
Broadly, however, we found that geographies with predominantly non-white households see higher rates of evictions and overall housing loss than those with predominantly white households. Areas with more Black households, in particular, show higher rates of eviction than areas with predominantly Latinx households and white households.
We also observed a positive relationship between the percentage of non-white households and foreclosures, but the relationship was less pronounced than for evictions. In order to better understand the relationship between housing loss, income, and race, future analyses might control for co-variates—such as income—in order to inform inferences about disparate impacts of eviction and foreclosure across minority groups.
We found that as the percentage of rent-burdened households in a county increased, so did rates of housing loss. Across the United States, more than 20 million households spend more than 30 percent of their income on rent, of which 10 million spend 50 percent or more of their income on rent. These findings align with prior studies that found higher rates of housing loss among low- and moderate-income minority racial and ethnic groups.10 Interestingly, we also found a positive relationship between higher median rents and higher housing loss rates (and in particular foreclosures); this tells us that counties with expensive housing stock experience higher loss rates, regardless of residents’ incomes.
Of all the demographic, socioeconomic, and housing variables analyzed, we found mortgage foreclosure to be the most strongly associated with the proportion of households living in mobile homes in a county. We do not know whether this is because mobile homeowners are uniquely vulnerable to foreclosure, or because foreclosed upon homeowners are likely to move into mobile homes; the relationship between housing loss and mobile homes is an emerging area of study deserving of further research.11 Finally, we found mortgage foreclosure to be positively associated with the number of vacant properties in a county, and single-parent households.
Conclusion
Our national-level analysis prioritized breadth over depth. As a result, it was not within the scope of our project to delve into the causes and effects of evictions and mortgage foreclosures at the national scale. Also out of scope of our analysis was a focus on the presence of and variation in housing-related policies across localities (e.g., eviction filing fees or “just cause” eviction laws). Future research might focus on how rates of housing loss vary in localities with stronger versus weaker protective policies.
Our findings align with prior and more locally-focused studies investigating correlates of eviction and foreclosure, and aim to move forward research on housing loss at the national scale. Our findings also reveal what we believe to be housing loss "hot spots," providing some guidance for prioritizing resources and attention. These findings are particularly pertinent in the context of the COVID-19 crisis, and "hot spots" may also be logical areas to conduct additional in-depth research to identify causes and consequences of high rates of housing loss.
Given the general patterns of rates of eviction, mortgage foreclosure, and housing loss generally, future research might seek to understand what underlying causes contribute to differences in housing loss across U.S. states and counties.
Citations
- Harvard Joint Center for Housing Studies. State of the Nation’s Housing, 2018. Report. P. 5. source ; ACS 5-year estimates, 2012-2016
- Urban Institute. 2009. source
- Fullilove, M. T., & Wallace, R. (2011). Serial Forced Displacement in American Cities, 1916–2010. Journal ofUrban Health , 88 (3), 381-389; Rogers (2019). The Connections Between Evictions and Foreclosures in Richmond. RVA Eviction Lab. source
- For an in-depth description of how we created the Housing Loss Index and how to interpret it, please see Section 2: Definitions & Methodology. Note: the National Housing Loss Index was generated for the three year period between 2014-2016 due to the overlap in data coverage for both evictions and foreclosure. When discussing housing loss through mortgage foreclosure, specifically, we report figures from the five-year period between 2014-2018 because mortgage foreclosure data were available for this time span from ATTOM Data Solutions.
- We have not found research that assesses the comparative impact of historical housing vulnerability and current economic shocks on real-time housing loss. In other words, we don’t know whether historical housing loss rates or current income loss rates are a better predictor of current housing loss rates; this research may lay the groundwork for such a comparison.
- We were also only able to measure formal evictions conducted through the courts. In some places it is estimated that half of all evictions are informal, leaving no administrative record; again, this means our data are necessarily incomplete and an understatement of the problem.
- In its methodology report, Eviction Lab identifies a number of states for which the available data was insufficient to yield trustworthy eviction rates. In the report and on its website, Eviction Lab indicates where the calculated eviction rates likely under-represent the prevalence of evictions, and where these rates likely over-represent this prevalence. For the purpose of our report, we exclude those states identified as having data quality issues that impact the accuracy of the reported eviction rates. For example, though Eviction Lab data shows a high average eviction rate for New Hampshire from 2014-2016, we excluded New Hampshire from the results because of the data quality issues identified and highlighted by Eviction Lab (see Eviction Lab’s methodology report for more details).
- This rate was calculated based on the counties for which we had foreclosure data, between 2014 and 2018.
- States with a substantial number of counties for which mortgage foreclosure data were not available, for example South Dakota, were excluded from our discussion of states with highest- and lowest-rates of foreclosure.
- Allen, R. (2011). Who experiences foreclosures? The characteristics of households experiencing a foreclosure in Minneapolis, Minnesota. Housing Studies, 26(6), 845-866; Desmond, M. (2012). Eviction and the reproduction of urban poverty. American journal of sociology, 118(1), 88-133; Raymond, E. L., Duckworth, R., Miller, B., Lucas, M., & Pokharel, S. (2016). Corporate landlords, institutional investors, and displacement: Eviction rates in single family rentals. FRB Atlanta Community and Economic Development Discussion Paper, (2016-4). source ; Gold, A. E. (2016). No home for justice: How eviction perpetuates health inequity among low-income and minority tenants. Geo. J. on Poverty L. & Pol'y, 24, 59.
- Phillips, L. A., P. Solís, C. Wang, K. Varfalameyeva, and J. L. Burnett. Forthcoming. Hot for Convergence Research: A Community Engaged Approach to Heat Resilience in Mobile Homes. Under Review at Geographical Review.
Housing Loss in Forsyth County, North Carolina
“We were known for our manufacturing…” – County Official1
Introduction
In recent years, Forsyth County, North Carolina has made national news for its low rates of economic mobility and high rates of poverty concentration. A 2015 Harvard University study found that Forsyth County has the third worst economic mobility in the United States, and a 2014 Brookings study found that Winston-Salem, the county seat, has the second fastest rate in the growth of poverty concentration in the country.
How are these economic mobility roadblocks bound up with housing, a fundamental human right that for so many across the United States is under threat? To answer that question, researchers from New America’s Future of Property Rights program teamed up with Wake Forest University and Winston-Salem State University to analyze five years of Forsyth County eviction, mortgage foreclosure, and tax foreclosure data. We also interviewed government officials, housing advocates, real estate developers, journalists, lawyers, service providers, and community members in order to gain an in-depth understanding of local issues related to housing loss. We wanted to know how often residents lose their homes—whether through eviction, mortgage foreclosure, or another mechanism; who is most at risk of losing their home; where within the county this loss is most acute; why people are losing their homes; and what happened after they did. These diverse interviews evoked an array of common themes steeped in a history of deindustrialization, racial segregation, low wages, and gentrification.
However, in the midst of completing this research, the world changed. As the COVID-19 pandemic swept across America, it rapidly became clear that we would release this report at a time when millions of Americans are without jobs and at risk of losing their housing. This report became more than a way to show historic housing loss, but a tool city leaders could use to better predict where the hardest-hit neighborhoods of their city may be.
The root causes of housing loss are only being exacerbated by the COVID-19 crisis in Forsyth County. As many have predicted, the wave is coming: on July 1st evictions resumed in Forsyth County for those who do not live in subsidized affordable housing, and the Coronavirus Aid, Relief, and Economic Security (CARES) Act eviction moratorium for federal public housing, housing choice vouchers, FHA-insured multifamily properties, and multifamily-assisted properties expired on July 25. On September 1 the Centers for Disease Control (CDC) announced a nationwide ban on evictions until the end of the year. However rent will still be due on January 1, and thus far the government has not offered rent forgiveness and only limited relief.
For several months the U.S. Census Bureau has been conducting a weekly Household Pulse Survey focused on tracking the fallout from the pandemic. In North Carolina, the Pulse Survey conducted between July 16th and the 24th found that 23 percent of households across the state were housing insecure, meaning that they either missed their rent or mortgage payments last month or believe they will not be able to pay this month, and that 45 percent of households reported that at least one person in their household has lost employment income. Further, the Bureau of Labor Statistics reported in June that the county had an unemployment rate of 8.2 percent, double the rate in June 2019. Taken together, it is clear that this economic snapshot does not bode well for already struggling households in Forsyth County.
The pandemic may have shone a light on the scope of potential housing loss in Forsyth County, but as this report shows, the crisis has been there all along.
Background and Context
Located in the central Piedmont region of North Carolina, Forsyth County holds a population of around 350,000, making it the fourth-most populous county in the state. Winston-Salem, a city of roughly a quarter-million, is both its county seat and largest city. Along with the nearby cities of Greensboro and High Point, Winston-Salem is part of the Triad, a significant metropolitan area regionally.
The county’s socioeconomic history is critical for contextualizing recent trends in housing loss. Winston-Salem was historically home to major manufacturers including Reynolds Tobacco, Hanesbrand, and Western Electric. Throughout the mid-twentieth century, thousands of middle-class workers depended on good-paying union jobs throughout the county, though most unions were ultimately driven of town. Still, workers at these factories could earn middle-income salaries without college degrees well after unions were disbanded.
As a result of federal trade policies and the general transformation of regional economies, many factories have disappeared in recent decades, resulting in a 39 percent decrease in manufacturing jobs between 1990 and 2010.
Racial discrimination throughout the twentieth century played a key role in shaping the housing landscape of Forsyth County. Before successfully fighting for unionization with the Local 22 (FTA), Black workers were often forced to work the harshest jobs for little pay, including toiling on the factory floor for 54 cents an hour. Union and political activism after World War II radically reshaped the county as Black workers demanded and won their right to better conditions, higher pay, and safe participation in local and federal elections. Despite this, Black households were excluded from many Winston-Salem neighborhoods: a local ordinance mandated segregation in housing until it was struck down by a 1940 North Carolina Supreme Court ruling. Even then, the redlining of non-white neighborhoods, as well as the theft of informal family land, or heirs property, prevented Black households from building intergenerational wealth via property ownership.
Black neighborhoods near downtown Winston-Salem, including Happy Hill, were razed in the 1950s in order to construct government buildings and U.S. Route 52, part of nationwide urban renewal projects. Today, Route 52 is an informal dividing line between white and non-white communities in the city. Most census tracts west of the highway are predominantly white, and some contain less than 10 percent non-white residents. Conversely, tracts east of U.S. 52 are home to predominantly Black and Latinx households, with some tracts occupied by less than 3 percent white residents.
Other communities throughout Forsyth County, that make up the suburbs of Winston-Salem, tend to be demographically wealthier and whiter than neighborhoods east of Route 52 or further away from downtown Winston-Salem. In these areas, there are higher rates of homeownership, lower poverty levels, and, according to our housing loss index, lower rates of home loss.
As a result of these and other factors, portions of Forsyth County suffer from concentrated poverty and low economic opportunity. But Forsyth County policymakers have recently taken steps to increase economic growth. Local officials pride themselves in successfully fostering a community of small businesses and entrepreneurs. Hospitals, universities, and the nonprofit sector, already dominant employers in the economy, also continue to grow. While this economic transformation is attracting highly-skilled outsiders to the area, poor communities in East Winston and elsewhere continue to struggle with the transition to a post-industrial economy.
How, Where, and When Are People Losing Their Homes?
“Low-income individuals rent, and often bounce between properties…” – Executive Office, Local Nonprofit2
According to our national housing loss index, Forsyth County, North Carolina experienced a housing loss rate (accounting for both evictions and foreclosures) of 2.6 percent between 2014 and 2018.
Evictions: Roughly 38 percent of households in Forsyth County rent their homes, yet evictions accounted for approximately 80 percent of all housing loss in the county from 2014 to 2018. The overall eviction rate for renter households was 4.4 percent during the study period.
A tenant can be evicted in North Carolina for nonpayment of rent, overstaying a lease, violating a lease agreement, or criminal activity. Based on key informant interviews, many low-income tenants in Forsyth County are evicted for non-payment of rent. These households are most often vulnerable to eviction as a result of a major life event, such as the loss of income or a job, or a medical emergency.
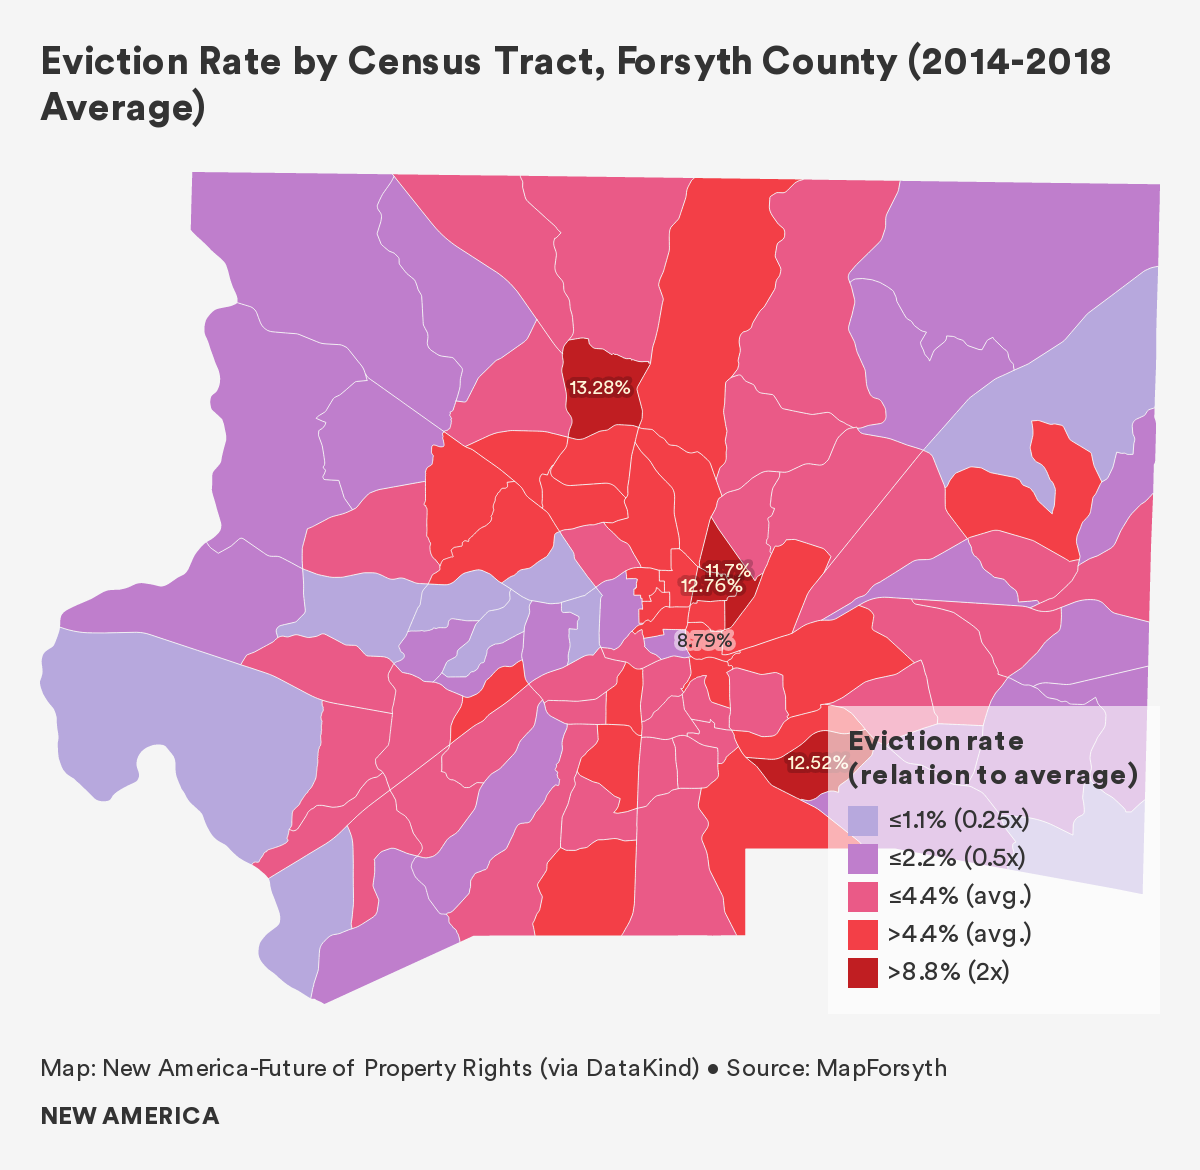
The eviction rate in Forsyth County is generally higher in census tracts with larger minority populations, as well as in tracts with more households living below the poverty line. Geographically, high loss tracts are concentrated to the east of downtown Winston-Salem, in East Winston. Based on analysis of data provided by MapForsyth, four census tracts all experienced eviction rates over 10 percent, the highest rates locally.
Census tract 28.06, which is located north of downtown and is bisected by Route 52, has the highest eviction rate of over 13 percent. According to ACS data (2012–2016) a majority of residents in this tract are non-white, as 40 percent of households are Black and over 14 percent are Latinx. Two-thirds of all residents in this tract are renters, of which 40 percent spend more than 30 percent of their income on rent.
Two other tracts with high eviction rates are located to the northeast of downtown Winston-Salem, close to Smith Reynolds Airport. According to ACS data (2012–2016) census tract 5, which has an eviction rate of over 12 percent, has a non-white population of over 90 percent. More than two-thirds of all residents earn less than $25,000 per year, and more than 40 percent utilize SNAP benefits for food costs. Directly adjacent to tract 5 is tract 16.02, which has an eviction rate of over 11 percent. The tract has a non-white population of over 80 percent, one-third of residents earn less than $10,000 per year, and over half utilize SNAP benefits. More than 70 percent of households in both tracts rent their homes, of which over half are rent-burdened.
The fourth census tract, tract 34.03, has an eviction rate of over 12 percent, and is located to the southeast of downtown. The tract reports a median household income of $34,898, and 37.7 percent of residents live below the poverty line. Most striking, half of tract residents are Latinx, and half of that group was born outside of the United States.
The geography of loss is unsurprising, as East Winston neighborhoods have long suffered from a legacy of disinvestment and racist public policies. Located beyond U.S. Route 52, the area is predominantly Black and Latinx. While a small entrepreneurial community is active in the area, the majority of residents suffer from lack of access to well-paying jobs, high-performing schools, public transportation, and grocery stores.
Due to a history of intentional segregation, the concentration of Black households to the east of the highway is no accident. As a result of this historic inequity, shared an executive officer at a local nonprofit, a small group of investors owns a large amount of substandard rental properties, with low-income renters often bouncing between complexes.
Worse, manufacturing expansion and environmental injustice such as poor air quality have negatively impacted minority households for generations.
Power differentials that have their roots in historic inequities also exist in small claims court, where eviction cases are heard. Many interviewees emphasized that the lack of legal representation for tenants in eviction proceedings results in rulings that overwhelmingly favor landlords. Evictions in Forsyth County often exceed 3,000 per year, but only 200 cases or so receive pro-bono legal representation, according to a local journalist.
A Spotlight on Summer Evictions
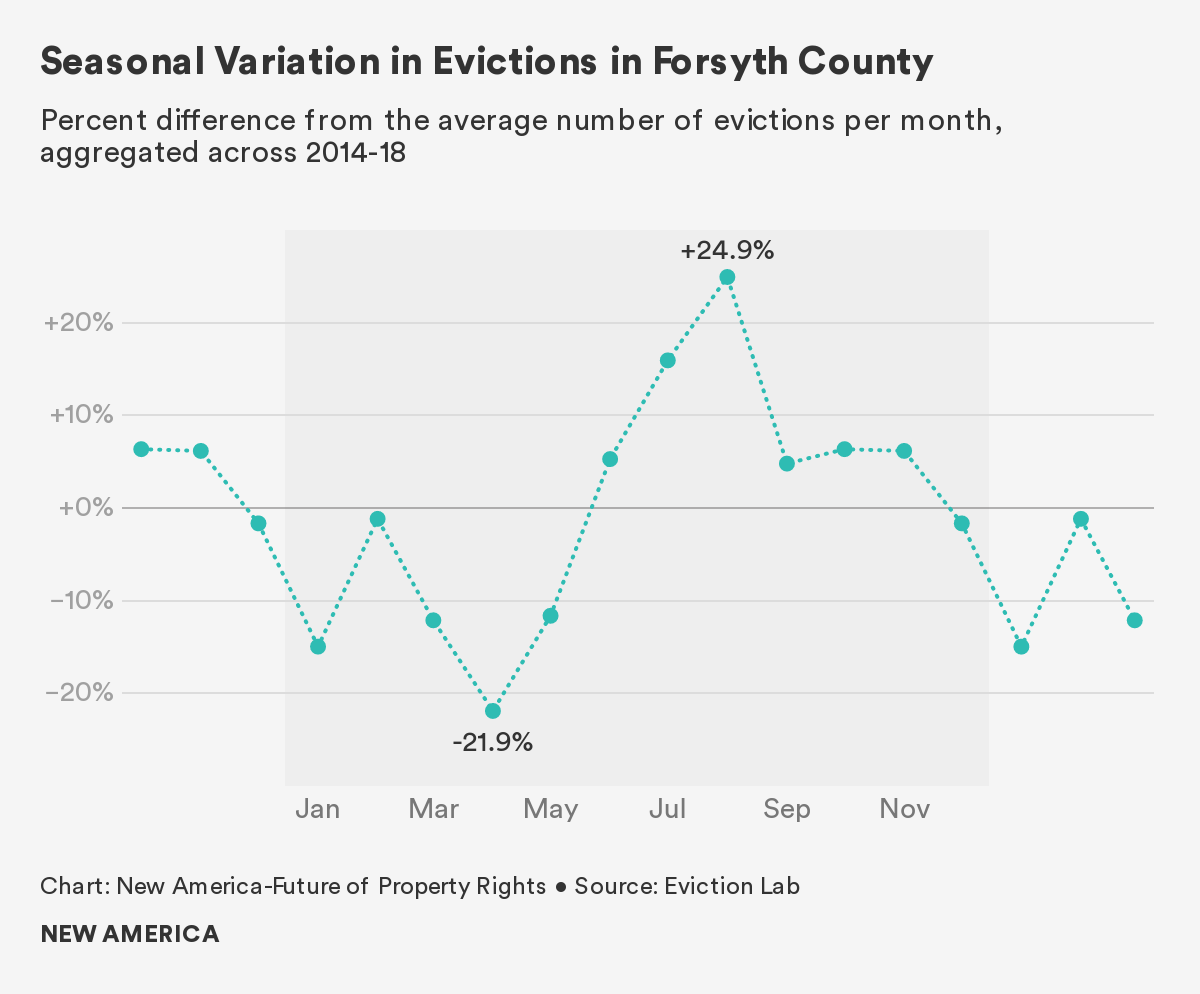
Data suggests that evictions spike during the summer. Between 2014 and 2018, April saw the lowest monthly average with 160 evictions, while August saw the highest monthly average at 256—a 60 percent increase. One potential explanation for the drop in evictions in April could be a result of households receiving their tax returns, and having extra money to put towards essential costs.
Although in-depth research into seasonal variation in evictions is outside the scope of this report, we speculate that three factors drive this uptick during the warmer months. First, the high costs of air conditioning and other utilities might place financial strain on renters. Second, the high costs of childcare and lack of school-based food support programs during school vacations might place additional financial strain on renters. Third, landlords may be more willing to evict unsatisfactory tenants during the middle of the year, because it is typically easier to re-rent homes during the summer. However, we note that these factors are simply speculative and more research is needed to better understand this trend.
Mortgage Foreclosure: The number of yearly mortgage foreclosures in Forsyth County decreased by approximately 64 percent between January 2014 and December 2018. Slightly more than two-thirds of all households in Forsyth County own their homes, yet mortgage foreclosures only account for a fifth of housing loss during this five-year span. This suggests higher levels of housing stability among homeowners, as the average rate of foreclosure among households with a mortgage in Forsyth County was 1 percent.
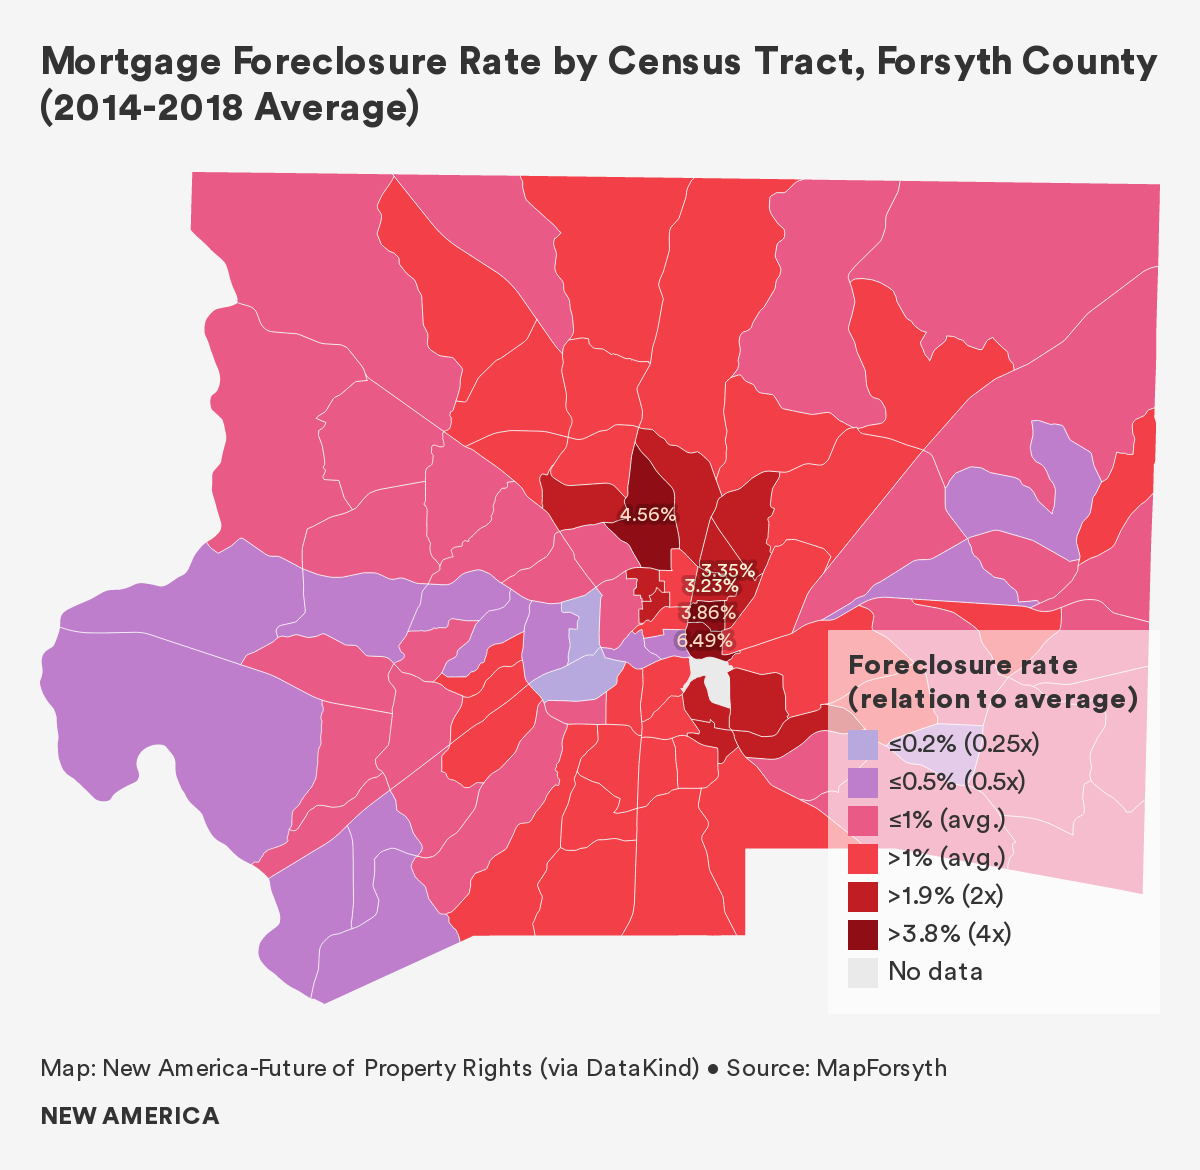
Census tract 7, directly east of downtown Winston-Salem, in East Winston, experienced the highest mortgage foreclosure rate in the county between 2014 and 2018, at 6.5 percent. This census tract has a 94 percent renter occupancy rate, which suggests that foreclosures in this tract had the secondary impact of displacing renters. Median household income in the tract is $19,861 and the population is 71.1 percent Black, according to 2018 ACS data.
Two other census tracts in Forsyth County display mortgage foreclosure rates over four times the county average. Tract 6, which sits directly to the north of tract 7 in East Winston, reports an average mortgage foreclosure rate of 3.9 percent. The tract is similarly home to poor and Black households, with a median household income of $17,550, 48 percent of residents living below the poverty line, and 71 percent of the population identifying as Black.
In north Winston-Salem, tract 14 experienced an average mortgage foreclosure rate of 4.6 percent between 2014 and 2018. Residential neighborhoods in the tract sit close to the Wake Forest campus, the university’s athletic complex, and Smith Reynolds Airport. Median household income in the tract is $26,844, while 38.7 percent of households live below the federal poverty line and 59.7 percent of the population is Black.
Many tracts located in the west of Forsyth County report average to below-average rates of mortgage foreclosure, around 0.5 to 1 percent. Census tracts in the north and east generally express rates of 2 percent or below.3 Sitting outside of Winston-Salem city limits, many of these tracts include large percentages of white households. Overall, outlying towns such as Kernersville, Lewisville, and Tobaccoville are two-thirds white, at least, and median household incomes are near or higher than the national average.
Tax Foreclosure: Tax foreclosure results from long-term non-payment of property taxes, usually over the course of several months or years. North Carolina is a “tax deed state,” meaning that investors bid on the deeds of tax-delinquent properties at public auctions. After a sale, the original property owner is given a short period of time to redeem the tax sale, or pay off back taxes, and keep the property. Otherwise, the title of property is transferred to the investor.
Data provided by MapForsyth unfortunately does not differentiate between owner-occupied properties, rental properties, and commercial or industrial properties. As a result, we were not able to calculate the tax foreclosure rate among homeowners without a mortgage—the demographic inherently at risk of tax foreclosure. Nonetheless, a map indicating tax foreclosures per total owner-occupied households in each census tract between 2014 and 2018 provides valuable insights.
Based on available data, only 140 tax sales were recorded during the five-year period measured. Many tracts were not listed in the data, and we do not know whether this is because no tax lien sales occurred in the tract, or because data was unrecorded or incomplete. Therefore, tax foreclosure results should be viewed with caution.
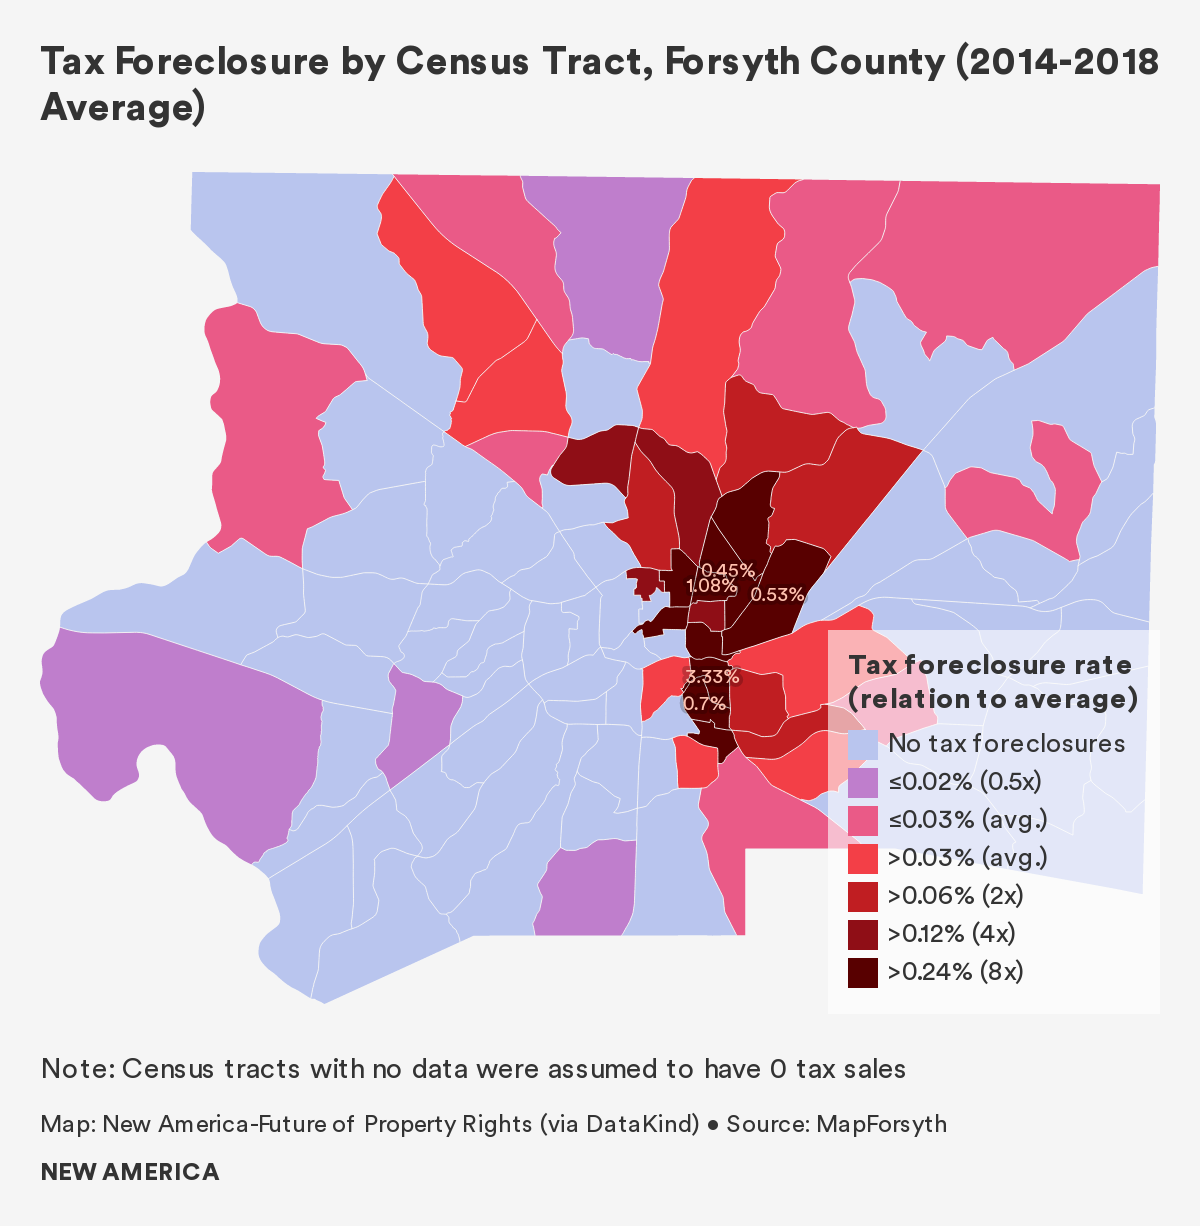
One census tract lying to the southeast of downtown Winston-Salem, tract 8.01, is worth highlighting. Encompassing parts of the Columbia Heights neighborhood, the tract reports the county’s highest tax foreclosure rate at 3.3 percent. Based on ACS data, the census tract appears distressed—to say the least. The median household income is $11,000 and 80.6 percent of households live below the poverty line, approximately five times the county average. The average property value in the tract is $44,400, while 30 percent of all units are vacant. The tract is also home to Winston-Salem State University, so low- or no-income students may be influencing the economic breakdown provided by ACS Data.
Our Housing Loss Index in Forsyth County:4 In order to measure housing loss that includes both evictions and mortgage foreclosures, we first calculated each census tract’s housing loss rate. The housing loss rate combines the total number of evictions and the total number of mortgage foreclosures in a given census tract, and then normalizes that sum by the total number of renters and the total number of homeowners with a mortgage within the census tract.
We then converted the housing loss rate into a housing loss index by comparing a given census tract’s housing loss rate to the county average. A census tract with a housing loss index of 1 experiences a housing loss rate equal to the county average, while an index of 3 indicates that the tract experiences a housing loss rate that is three times the county average.
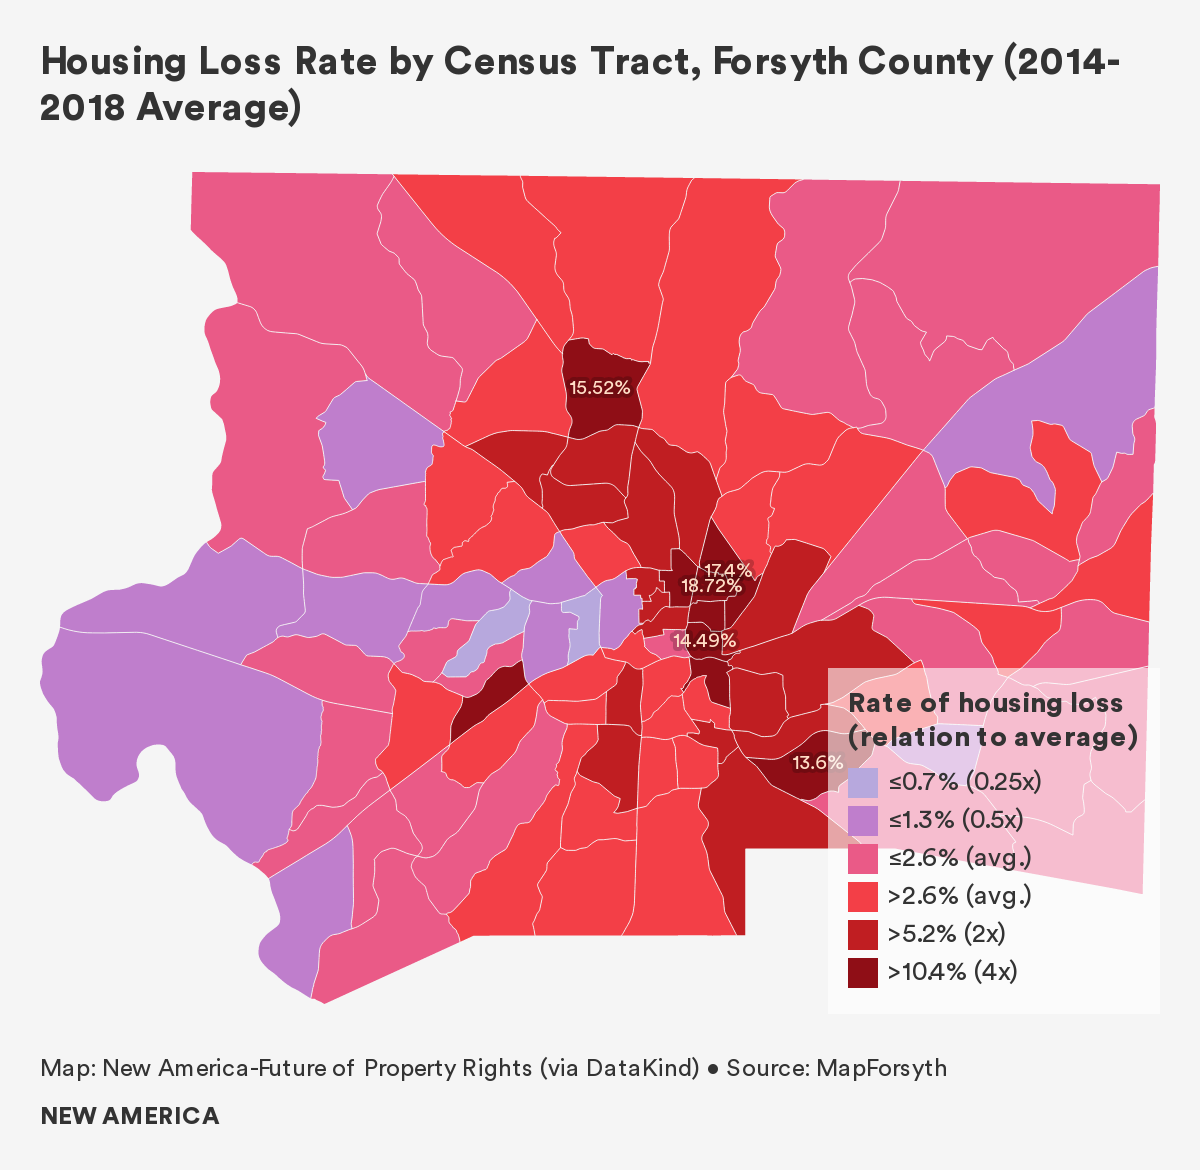
Census tracts that express the highest values within our housing loss index are primarily located in East Winston. A few of these tracts lie directly to the east of U.S. Route 52, while others lie between Smith Reynolds Airport, the Wake Forest University athletic stadiums, and the local fairground. The two tracts with the highest housing loss rates, six and a half or more times the county average, lie near the airport. These tracts are primarily home to poor and minority households, including disproportionate percentages of Black and Latinx residents when compared to the county average.
Other tracts that experience housing loss rates more than five times the county average are located to the north and south of downtown on the east side of Route 52. All four tracts with high housing loss index scores also express high rates of eviction, which pushes them to top of the county index, despite having low foreclosure rates.
By contrast, census tracts outside of Winston-Salem city limits generally express housing loss rates well below the county average. These tracts comprise parts of smaller towns in Forsyth County, such as Clemmons, Bethania, and Walkertown, many of which have a housing loss rate around half of the county average. These communities are primarily white, in comparison to a considerably more diverse Winston-Salem, and many report significantly higher median household incomes.
Who is Losing Their Home?
Census tracts with predominantly non-white residents had substantially higher rates of eviction, mortgage foreclosure and overall housing loss. In particular, we found a strong positive relationship between the number of Black households in a census tract, and the rate of mortgage foreclosures. Predominantly Latinx census tracts also showed higher rates of evictions and mortgage foreclosures than white census tracts, but the relationship was not nearly as strong as for Black households.
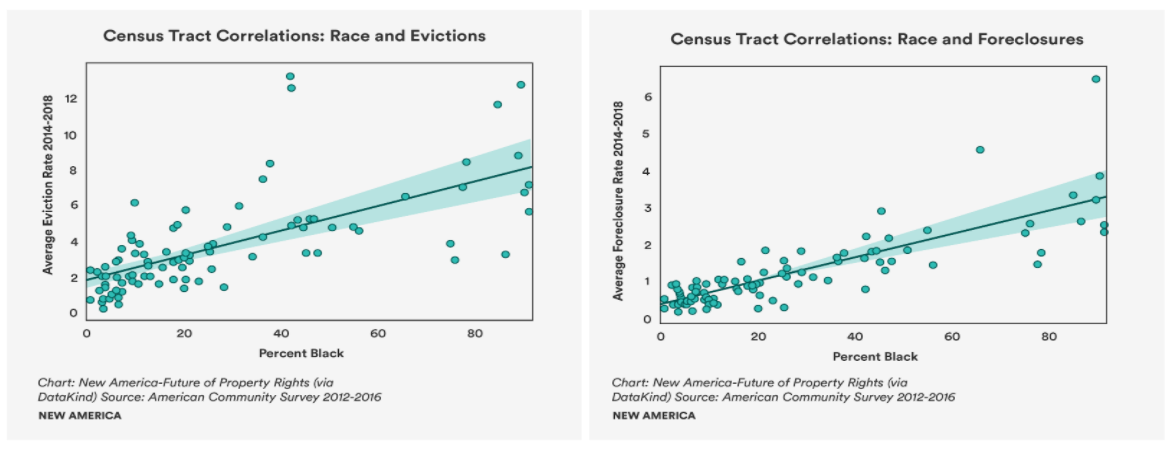
We also found that as the percentage of residents without health insurance in a census tract increases, so does the rate of housing loss, and in particular the rate of mortgage foreclosure. Many low-paying jobs do not provide health insurance, and this finding suggests that these at-risk households are generally housing cost-burdened on low income, or cannot pay for housing and medical treatment following an unexpected emergency.
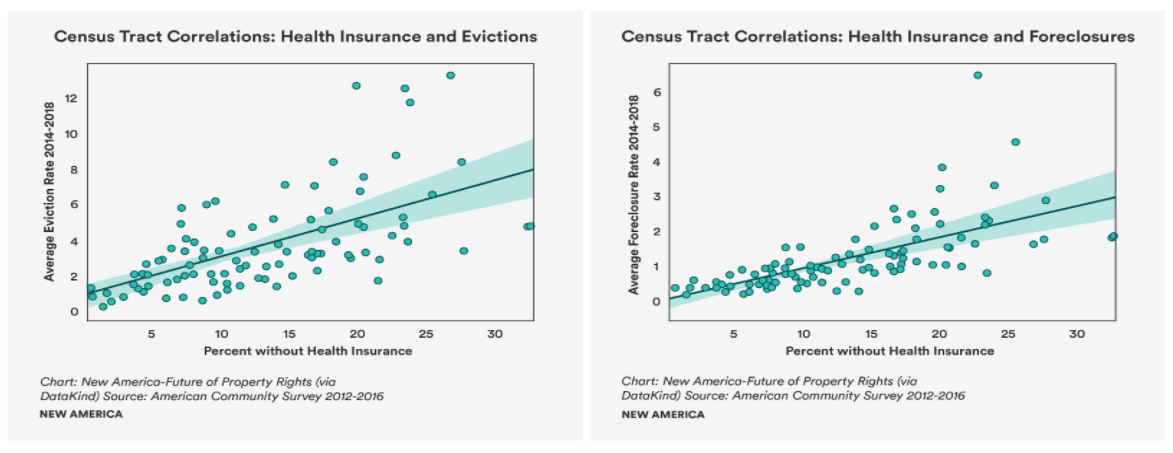
Tracts with a larger share of households that rely on public transportation for work commutes had substantially higher rates of mortgage foreclosure and overall housing loss. Local stakeholders observed that dependence on unreliable public transportation systems can lead to repeated tardiness or absence from work, job loss, and a subsequent inability to pay rent.
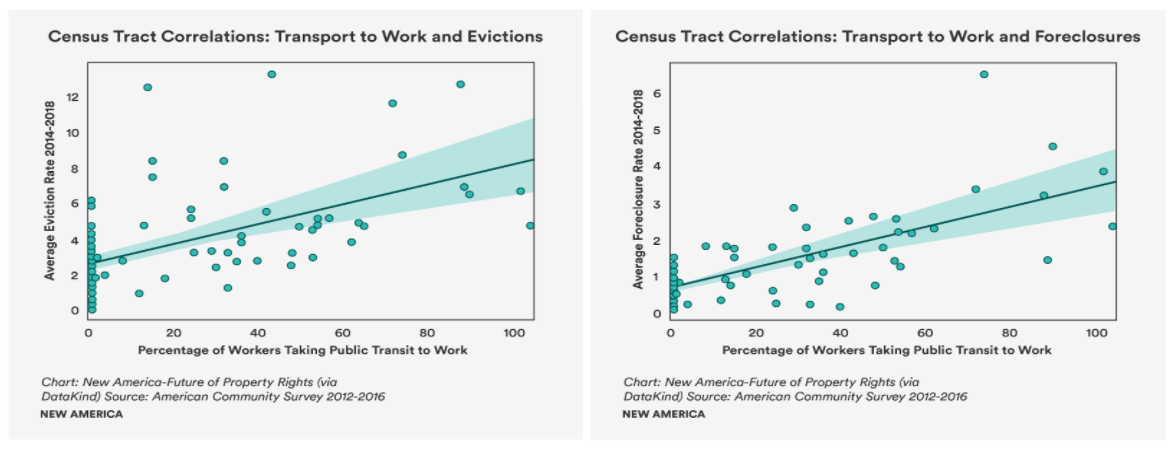
Census tracts in Forsyth County with higher shares of single-parent households had higher rates of home loss, and in particular higher rates of eviction. A lack of two incomes, the high costs of childcare, and difficulties in maintaining steady employment amid other responsibilities may all contribute to this elevated risk.5
Finally, as incomes, property values, and the percentage of owner-occupied units in a census tract rise, housing loss rates fall. This finding is unsurprising, as wealthier households more easily become homeowners; can buy more expensive homes; and usually do not struggle to pay monthly housing costs. Conversely, census tracts with lower incomes had higher rates of home loss. Specifically, households with median incomes between $10,000 and $34,999 were most strongly associated with higher rates of mortgage foreclosure.
Why Are People Losing Their Homes?
“Missing a single day of work or blowing a tire can lead to eviction” – Assistant Director, Local Nonprofit6
Housing insecurity in Forsyth County is complex and multifacveted. Based on key informant interviews, however, common themes surrounding insecurity emerged, notably the significant lack of affordable housing stock, which is exacerbated by poorly-paying jobs. Stakeholders also shared that long-time residents in Winston-Salem, and particularly in East Winston, are fearful of gentrification and subsequent displacement. While some data indicates ongoing demographic changes, there is limited evidence supporting actual displacement.
The Affordable Housing Crunch: The current supply of affordable housing in Forsyth County is quite simply insufficient to keep pace with demand. A 16,244-unit shortage of affordable rental housing for extremely-low-income households exists in Winston-Salem alone. Households that earn less than 30 percent area median income (AMI) can afford an apartment for $464 in monthly rent, but the fair-market rate for a two-bedroom apartment in the city is $729.
An additional 14,000 units of affordable housing are needed in Winston-Salem by 2027, with at least half for residents 65 years and older. Unfortunately, efforts to increase the supply of low-income housing are stymied in part by a lack of funding. Most affordable rental stock in Forsyth County is constructed via the federal low-income housing tax credit (LIHTC) program. The North Carolina Housing Finance Agency awards funding to projects in the county, but the application process is extremely competitive; only a few projects are funded each year. The 16 projects from the last decade added only 1,148 units of affordable housing throughout the entire county.
The Housing Authority of Winston-Salem runs the local housing voucher program, which provides access to quality homes for low-income households throughout the city. However, landlords are often unwilling to accept vouchers and there are not enough vouchers to support all those in need. The waitlist for the Section 8 Voucher (also known as the Housing Choice Voucher) program is currently closed to new applicants, and those who are on the list often wait years to receive support.
The county government also strives to promote homeownership, but reach is limited. The Department of Community and Economic Development, for example, operates a program to subsidize down payments and provide financial training for low-income households interested in becoming first time homeowners. This initiative has assisted over 800 families since the 1990s, but often turns away applicants due to the lack of a job or poor credit. More broadly, it is simply unrealistic to expect the program to benefit the approximately 56,000 renter households in the county.
North Carolina state policies also contribute to a shortage of affordable housing options. Due to preemption laws that prohibit local governments from establishing rent stabilization policies on properties that do not receive public subsidies, low-income tenants residing in unsubsidized housing are not protected from large rent increases. However, the efficacy of rent stabilization policies, like rent control, is hotly debated by economists.
Similar to many places around the country, Housing Choice Voucher availability in Forsyth County does not keep pace with demand.7 Not only that: program participants are often turned away by landlords, as North Carolina lacks state laws that prevent income source discrimination.
Heirs Property in Forsyth County
In Forsyth County, similar to other areas of North Carolina, some property is held through a form of tenancy-in-common known as heirs property. According to United States Department of Agriculture (USDA) research, Forsyth County has 1,524 heirs properties, the fifth highest number in North Carolina.
Heirs property disproportionately (though not exclusively) impacts Black homeowners in North Carolina. The legal structure of heirs property exposes holders to significant vulnerability. Because heirs property is passed down through generations outside the formal probate process, it often lacks “clear title.” As a result, owners may be barred from using the land as financial collateral, and may not be able to prove their ownership of the property. Equally problematic is that each heirs property owner controls all of the property equally—an undivided interest in the whole. As property is passed down through generations, the ownership—and decision-making responsibility—becomes split among dozens of owners.
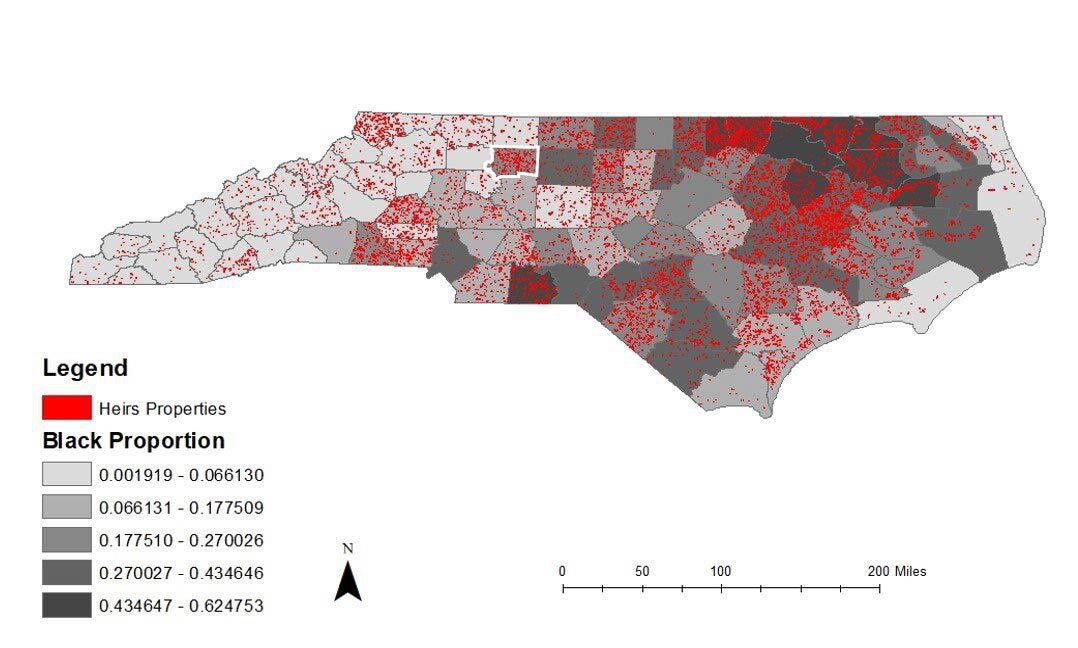
Johnson Gaither, C., "North Carolina Heirs’ Property Estimation," USDA Forest Service
As noted in a recent USDA report:
“Decisions regarding management or disposition of the property generally require unanimous agreement among the owners. This can keep the property from being used productively, such as being rented or farmed, or it can discourage owners from investing in maintenance and upkeep. More tragically, too often this situation has allowed long-time owners and residents to be dispossessed of their lands through legal maneuvers from non-family members, particularly where outside development pressures have made property values increase, such as in coastal areas.”
In Forsyth County, one family we spoke with has seen much of their heirs property sold to developers, displacing both family members and long-term renters. This has also prevented some family members who live in the area from benefiting from the development of vacant land.
Whereas heirs property is often thought of as a rural problem, key informant interviews revealed that heirs property is prevalent within the city limits of Winston-Salem. Stakeholders told us that this property often falls into blight and disrepair because its many owners, burdened by a convoluted ownership system, are loath to invest in its upkeep.
Low Wages: Based on interviews, limited access to livable wages is a significant contributor to housing instability in Forsyth County. Wages are not increasing at the same rate as housing costs. According to a county official, rent costs increased approximately 5.5 percent in recent years, while wages decreased for 30 percent of county residents. Between 2008 and 2017, income per person in Winston-Salem declined from 93 percent to 90 percent of the national average.
The steady loss of manufacturing jobs, along with an increase in low-wage service sector employment, now contributes to almost half of all renters in Forsyth County being cost-burdened by housing. The results of this financial strain are expected: according to the Crisis Control Ministry, a local social service provider in Winston-Salem, clients’ most common complaint is an inability to pay rent. Many of those seeking support earn minimum wage, a meager $7.25 per hour in North Carolina.
A relatively minor emergency is often catastrophic for low-income households. Wage workers, in particular, can experience unreliable incomes that create budgeting difficulties. Blowing a tire, or missing a single day of work, for example, can lead to nonpayment of rent and eviction. The city bus system in Winston-Salem is notoriously unreliable and inaccessible, and many poorer Black and Latinx residents cannot plan consistent commutes. Tardiness or poor work attendance can quickly spiral into firing, unpaid rent, and housing loss.
Further, according to the director of a local housing nonprofit, some companies in the county reduce work hours to avoid requirements for providing employer health insurance and benefits. Instead of employees working one full-time position, they are forced to work multiple jobs to make up the hours lost, while still lacking access to critical health insurance coverage. In Forsyth County, over 12 percent of all residents lack health insurance coverage. For those without insurance, a medical emergency can result in the inability to pay for housing costs.
Gentrification, Displacement, and Concentrated Poverty
As Winston-Salem undergoes an economic transformation, many areas adjacent to downtown are experiencing increased investment. Lower-income neighborhoods, such as Boston-Thurmond, Columbia Heights, and East Winston are targeted by developers in search of cheap property. Redevelopment is lucrative for some, but new investment can also result in the displacement of long-time residents. Concerns are especially acute in the East End, with development increasing on East 5th Street.
In general, gentrification and resulting displacement results in a wide range of consequences. Due to growing lack of affordable housing options in redeveloped neighborhoods, many of those displaced are unable to find adequate replacement housing and move away from their community. A cyclical process drives more outside investment, raising the cost of living in these neighborhoods, and resulting in even more residents losing their homes.
A local government report found that white residents are moving into downtown Winston-Salem at five times the rate of Black residents. But research from the University of Minnesota indicates that this gentrification is not actually resulting in displacement. This finding does not invalidate local fears concerning gentrification, however, nor does it negate future development and displacement.
At the same time, areas outside the core of Winston-Salem are experiencing increases in the concentration of lower-income residents of color. Several census tracts in the south and east section of Winston-Salem are designated as being racially or ethnically concentrated areas of poverty (R/ECAP), showing how the entire city has been impacted by this demographic shift. These designated areas often have low access to community amenities such as grocery stores and parks, and have suffered from historic segregation and disinvestment that has limited the economic mobility of residents.
What Happens After People Lose Their Home?
Housing loss is not only traumatic for residents who are displaced, but a shock to broader systems as well. These consequences are felt in schools, neighborhoods, and homeless shelters throughout the county.
Neighborhood Neglect: A 2017 report found that foreclosed and vacant properties had real impacts on the communities in which they are located. The study found that for each foreclosed home, the economic impacts on the entire community were valued at over $170,000. These costs include reduction in property values of adjacent houses, increases in crimes and fires, and a reduction in property tax revenue for local governments.
There are over 6,000 vacant properties in Winston-Salem, with the majority located in the east/northeast and southeast planning wards of the city. Each of these vacancies impact the entire neighborhood, driving the value of other houses down, and the crime rates up. These same neighborhoods are also vulnerable to patterns of housing problems in rental units, with 50 percent of units having some sort of maintenance issue.
Our research found that census tracts with higher numbers of vacant properties also have high rates of housing loss, particularly evictions. There are many possible explanations for these correlations including high crime rates, low property values, and maintenance issues that could also be common in these tracts. More research is needed to determine the direct impact of vacant properties on housing loss in Forsyth County.
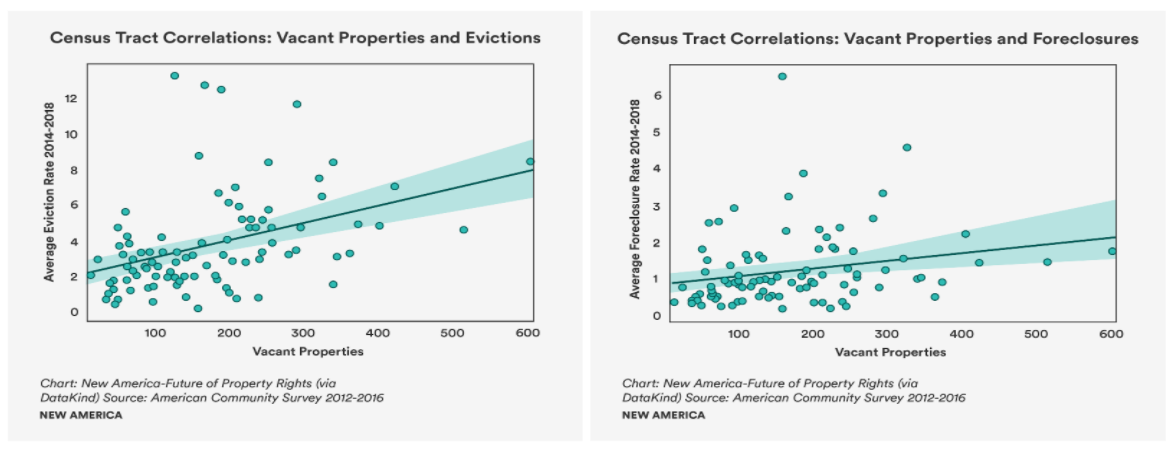
Tenants who have a history of eviction may be forced to live in substandard units for lack of a better option, as many landlords refuse to rent to tenants with a history of eviction or poor credit. Because their tenants are short on housing alternatives, this may further incentivize landlords to neglect their properties, driving neighborhood blight. This neglect spirals and drives disinvestment in the community, creating increasingly lower-opportunity neighborhoods without access to critical amenities like good schools, grocery stores, and quality employment.
A 2016 Food Access Report found that over 60,000 individuals in Forsyth County were food insecure, with large portions of the northeast, south, and southeast sections of Winston-Salem categorized as food deserts. Often in these areas, more than 33 percent of residents must travel more than a mile to get to a grocery store, limiting the potential for low-income families who do not own personal vehicles from easily accessing healthy, fresh food.
Education: Stable housing leads to stable education. Students whose families are evicted might be forced to switch schools multiple times in a single year. The Winston-Salem school system allows for school choice in designated zones throughout the county. Children can attend public schools outside of their neighborhoods, but parents must provide transportation. While a family that is displaced from their home has the ability to continue sending their children to the same school, it is often infeasible for parents to transport their children to a previous school if they have moved across town.
Key informants estimate that the county’s lowest performing schools have a turnover rate of between 20 percent and 50 percent; meaning that between one-fifth to half of students finish the school year at a different school than the one they started at, disrupting the education of thousands of students each year.
As a result of school choice policies, some underfunded schools are segregated and underpopulated, while schools in more affluent neighborhoods are overcrowded with students whose parents can transport them to better schools.
Additionally, public schools in Forsyth County rely primarily on county budgets for funding. This has led to complaints that the school board has discriminated against the very same segregated schools with predominantly Black and Latinx students regarding funding decisions for maintenance.
Lack of Access to Public Transportation: In Forsyth County, inadequate public transportation impacts economic security and housing stability in numerous ways. Many low-income residents may not have access to personal transportation, and as a result, choose to live near public transit. Local experts indicated, however, that some of the largest employers in the county are either not located on current bus routes, or typically have work shifts that do not align with current bus schedules. Herbalife and Caterpillar, for example, which collectively employ hundreds of residents, are inaccessible via public transit. Further, employees at the two top employers in the county, Novant Health and Wake Forest Baptist Medical, often work 12-hours shifts that end or begin outside of the hours that buses are typically in service.
Lack of access to public transit creates additional barriers for accessing other amenities such as libraries, grocery stores, and parks. Winston-Salem has a walk score of only 23.4, the third worst, and well below the average of 49 for cities with more than 200,000 residents, showing how dependent on cars residents are.
Jobs that are traditionally located downtown, or in the main ring of businesses around downtown, may become inaccessible for employees who have been displaced from their housing, exacerbating the impacts of housing loss. Many residents must transfer buses several times to reach their work destination as a result of the hub-and-spoke design of the local public transit system. In a 2019 report, CSEM found that individuals who rode the bus spent over eight times as long commuting to work than those who drove their cars. They did the math and discovered that the opportunity cost of their long commutes was worth more than $4,000 each year.
Homelessness: Families displaced from their housing as a result of eviction or foreclosure are at risk of homelessness, and sometimes resort to temporarily living with friends or family members. These living arrangements quickly lead to overcrowding, which is a well documented issue within Forsyth County. Overcrowding is particularly dangerous during public health emergencies, like the coronavirus pandemic.
Those unable to find community support can end up in a shelter, in their car, or on the street. In 2018, Winston-Salem and Forsyth County adopted a 10-year strategic plan to end homelessness that focuses on expanding policies for “light touch” interventions for families at risk of housing loss.
Some new research shows correlation between displacement as a child and the potential for homelessness as an adult, showing how one generation’s childhood experiences with forced displacement may contribute to future generation’s economic and housing instability. This poverty trap results in the inability for low-income families to climb the social mobility ladder.
Policy Recommendations
Housing insecurity does not have to be the norm in Forsyth County. There are several policies that can be implemented to prevent housing loss, support the maintenance and creation of affordable housing, and revitalize entire communities.
Certain policy solutions were voiced across all three of our case study locations; we included these commonly proposed solutions in our policy recommendations section, as we believe them to be broadly applicable across the country. These recommendations include but are not limited to: improving housing loss data; expanding the social safety net and increasing wages; expanding affordable housing options through voucher programs, trust funds and tax credit programs; and increasing parity between landlords and tenants, for example by improving tenants' legal rights. Below are four additional policy recommendations that were unique to our Forsyth County case study.
Expand Homeownership Programs: Forsyth County finances the Housing and Community Development Home Ownership Program, a program that provides down payment assistance to low-income families. Similarly, the state runs the Community Partners Loan Pool, which provides down payments as a deferred second mortgage with a zero percent interest rate. This loan is only repaid at the end of the loan period or when the house is sold. These programs should be expanded to provide homeownership opportunities to marginalized community members.
Adopt Forward-Thinking Development Policies: Forsyth County should be more aggressive in buying land for future affordable housing development. Local governments often wait for market-driven redevelopment before addressing issues of affordability and displacement. This hesitation to purchase land is costly in the long term, as revitalized areas often have higher land costs. In downtown Winston-Salem, for example, land used to be cheaper. However, both city and county officials refused to purchase land for future development. Now that downtown has been revitalized, they have been priced out.
Promote Affordable Housing Development as a Catalyst for Growth: The county should work to promote the development of mixed-income neighborhoods by supporting projects that rehabilitate blighted communities, similar to the Oneida Mills Loft Project in Graham, North Carolina. The affordable housing project was a catalyst for market-rate development in the area. Oneida Mills is now up and running, and the area around it has turned around. The creation of new housing developments has spurred competition for tenants. This has incentivized other property managers to improve their offerings through lower rent prices, or better housing.
Create Neighborhoods of Opportunity: Interviewees emphasized the role that communities of opportunity play in promoting social mobility. Often, affordable housing is situated in neighborhoods that lack access to grocery stores, retail stores, and professional opportunities, making nutrition and employment difficult. Local decision-makers should work to improve the opportunities within these neighborhoods, such as by expanding public transit to link these neighborhoods with grocery stores and employment opportunities. If expanding access to transportation is infeasible, bolstering community farmer’s markets and local employment should be considered. Finding creative solutions to improve the quality of life across the city benefits everyone, as no neighborhood should be left behind.
Conclusion
We began this research in 2019 to examine housing loss across the United States, and at a localized scale in Forsyth County. We could have never predicted that we would release our report in the midst of an unprecedented crisis, with tens of millions of Americans at risk for eviction and foreclosure as a result of the economic fallout of a global pandemic.
We have seen firsthand in the last few months how policy measures can help keep people in their homes. These policies, including nationwide moratorium on evictions, foreclosures, and utility shut-offs, deferments on mortgages, rapid expansion of federal housing voucher programs, and direct rent relief through local public housing authorities, have helped to delay a wave of housing loss that we believe is coming as programs begin to expire.
However, these policies must be targeted to communities most in need, and so we need to know who those communities are, and where they live. While the economic shocks resulting from COVID-19 are unique, we do believe that past housing loss provides an indication of future housing loss, even in these unprecedented times. As such, we hope this granular examination of where exactly evictions and foreclosures are most acute, and which communities are traditionally most impacted, will help municipal leaders and advocates direct outreach and resources in this time of crisis.
The COVID-19 pandemic may have elevated the urgency of eviction and foreclosure, but housing loss is a scourge even in times of relative calm. We must develop long-term policies to combat this systemic ill. Policy recommendations that we believe should be considered across the entire country are included in the national policy recommendations section of this report, and include policies to improve housing loss data, prevent housing loss, expand affordable housing options, and improve tenants' legal rights.
We also acknowledge that, in Forsyth County, the work is not done. We need more research to understand, for example, housing loss among low-income rural residents in the county. We must also better understand informal evictions, which do not leave a legal trace and are therefore difficult to track. And, we must understand why and where lower-income households move, when not forced out of their homes through eviction and foreclosure.
Citations
- From an interview with the authors.
- From an interview with the authors.
- While these rates are at or below the county average, it is critical to note that numerous tracts express mortgage foreclosure rates two to three times the national average.
- In order to generate an indicator of housing loss based on the total number of evictions and mortgage foreclosures, we created two new variables: housing loss rate and housing loss index. The housing loss rate reports the total number of evictions and mortgage foreclosures as a proportion of the total number of renters and homeowners with a mortgage in a given geography (here, Census tract). The housing loss index reports the housing loss rate by Census tract as a proportion of the mean (average) housing loss rate across the entire county. As a benchmark for interpretation, a housing loss index of 1 indicates that the Census tract under consideration has a housing loss rate equal to that of the county average, while an index of 3 indicates that the Census tract has a housing loss rate that is three times the county average.
- This finding is supported by national research which shows higher rates of eviction among families with children and single-parent households.
- From an interview with the authors.
- This problem is not unique to Forsyth County. Nationally, only one in five renter households who qualify for the housing choice voucher program—commonly known as Section 8—actually receives it. Many cities have waiting lists for up to 10 years or more; or have closed their lists down altogether.
Housing Loss in Maricopa County, Arizona
“We are so short on inventory that you either move in with somebody, you move back home, or you're homeless” – Community Development Corporation Employee1
Introduction
For several years now, Maricopa County, Arizona has ranked as the fastest-growing county in the U.S., adding over 80,000 new residents in 2019 alone. This influx comes as many already living in the region face increasing levels of housing instability, further exacerbating the crisis.
How is this rapid growth bound up with housing, a fundamental human right that for so many across the United States is under threat? In the desert metropolis of Maricopa County, Arizona we worked for a year to find out.
Researchers from New America’s Future of Property Rights program teamed up with Arizona State University’s Knowledge Exchange for Resilience Center to analyze five years of Maricopa County eviction and mortgage foreclosure data. We also interviewed government officials, housing advocates, real estate developers, journalists, lawyers, service providers, and community members to gain an in-depth understanding of local issues related to housing loss. We wanted to know how often residents lose their homes—whether through eviction, mortgage foreclosure, or another mechanism; who is most at risk of losing their home; where within the county this loss is most acute; why people are losing their homes; and what happened after they did. These interviews culminated in an accounting of how individuals are losing their home, who is most at risk, and what happens after they are displaced.
However, in the midst of completing this research, the world changed. As the COVID-19 pandemic swept across the United States, it rapidly became clear that we would release this report at a time when millions of Americans are without jobs and at risk of losing their housing. This report became more than a way to show historic housing loss, but a tool city leaders could use to better predict where the hardest-hit neighborhoods of their city may be.
It is clear that the root causes of housing loss are only being exacerbated by the COVID-19 crisis in Maricopa County. And as many have predicted, the wave is coming: on October 31 the state eviction moratorium will expire, and without any further intervention, evictions will resume. On September 1 the Centers for Disease Control (CDC) announced a nationwide ban on evictions until the end of the year. However rent will still be due on January 1, and thus far the government has not offered rent forgiveness and only limited relief.
For several months the U.S. Census Bureau has been conducting a weekly Household Pulse Survey focused on tracking the fallout from the pandemic. In the Phoenix/Mesa/Glendale metro area, the Pulse Survey conducted between July 16 and July 24 found that 27 percent of households were housing insecure, meaning that they either missed their rent or mortgage payments last month or believe they will not be able to pay this month, and 52 percent of households reported that at least one person in their household has lost employment income. Further, the Bureau of Labor Statistics reported in June that Maricopa County had an unemployment rate of 9.7 percent, more than double the rate in June of 2019. Taken together, it is clear that this economic snapshot does not bode well for already struggling households in Maricopa County.
The Maricopa Association of Government has mapped which zip-codes have been hit by job loss as a result of the pandemic. Zip codes with high job loss often overlap with tracts of high housing loss, particularly in Buckeye; between downtown Phoenix and Glendale; and South Phoenix, Guadalupe, and Tempe near Sky Harbor International Airport. The hardest-hit zip codes east of the airport had between 7,000 and 10,000 unemployment claims between March 14 and July 30, and also had 2014-2018 eviction rates as high as 14 percent, and housing loss rates more than double the county average.
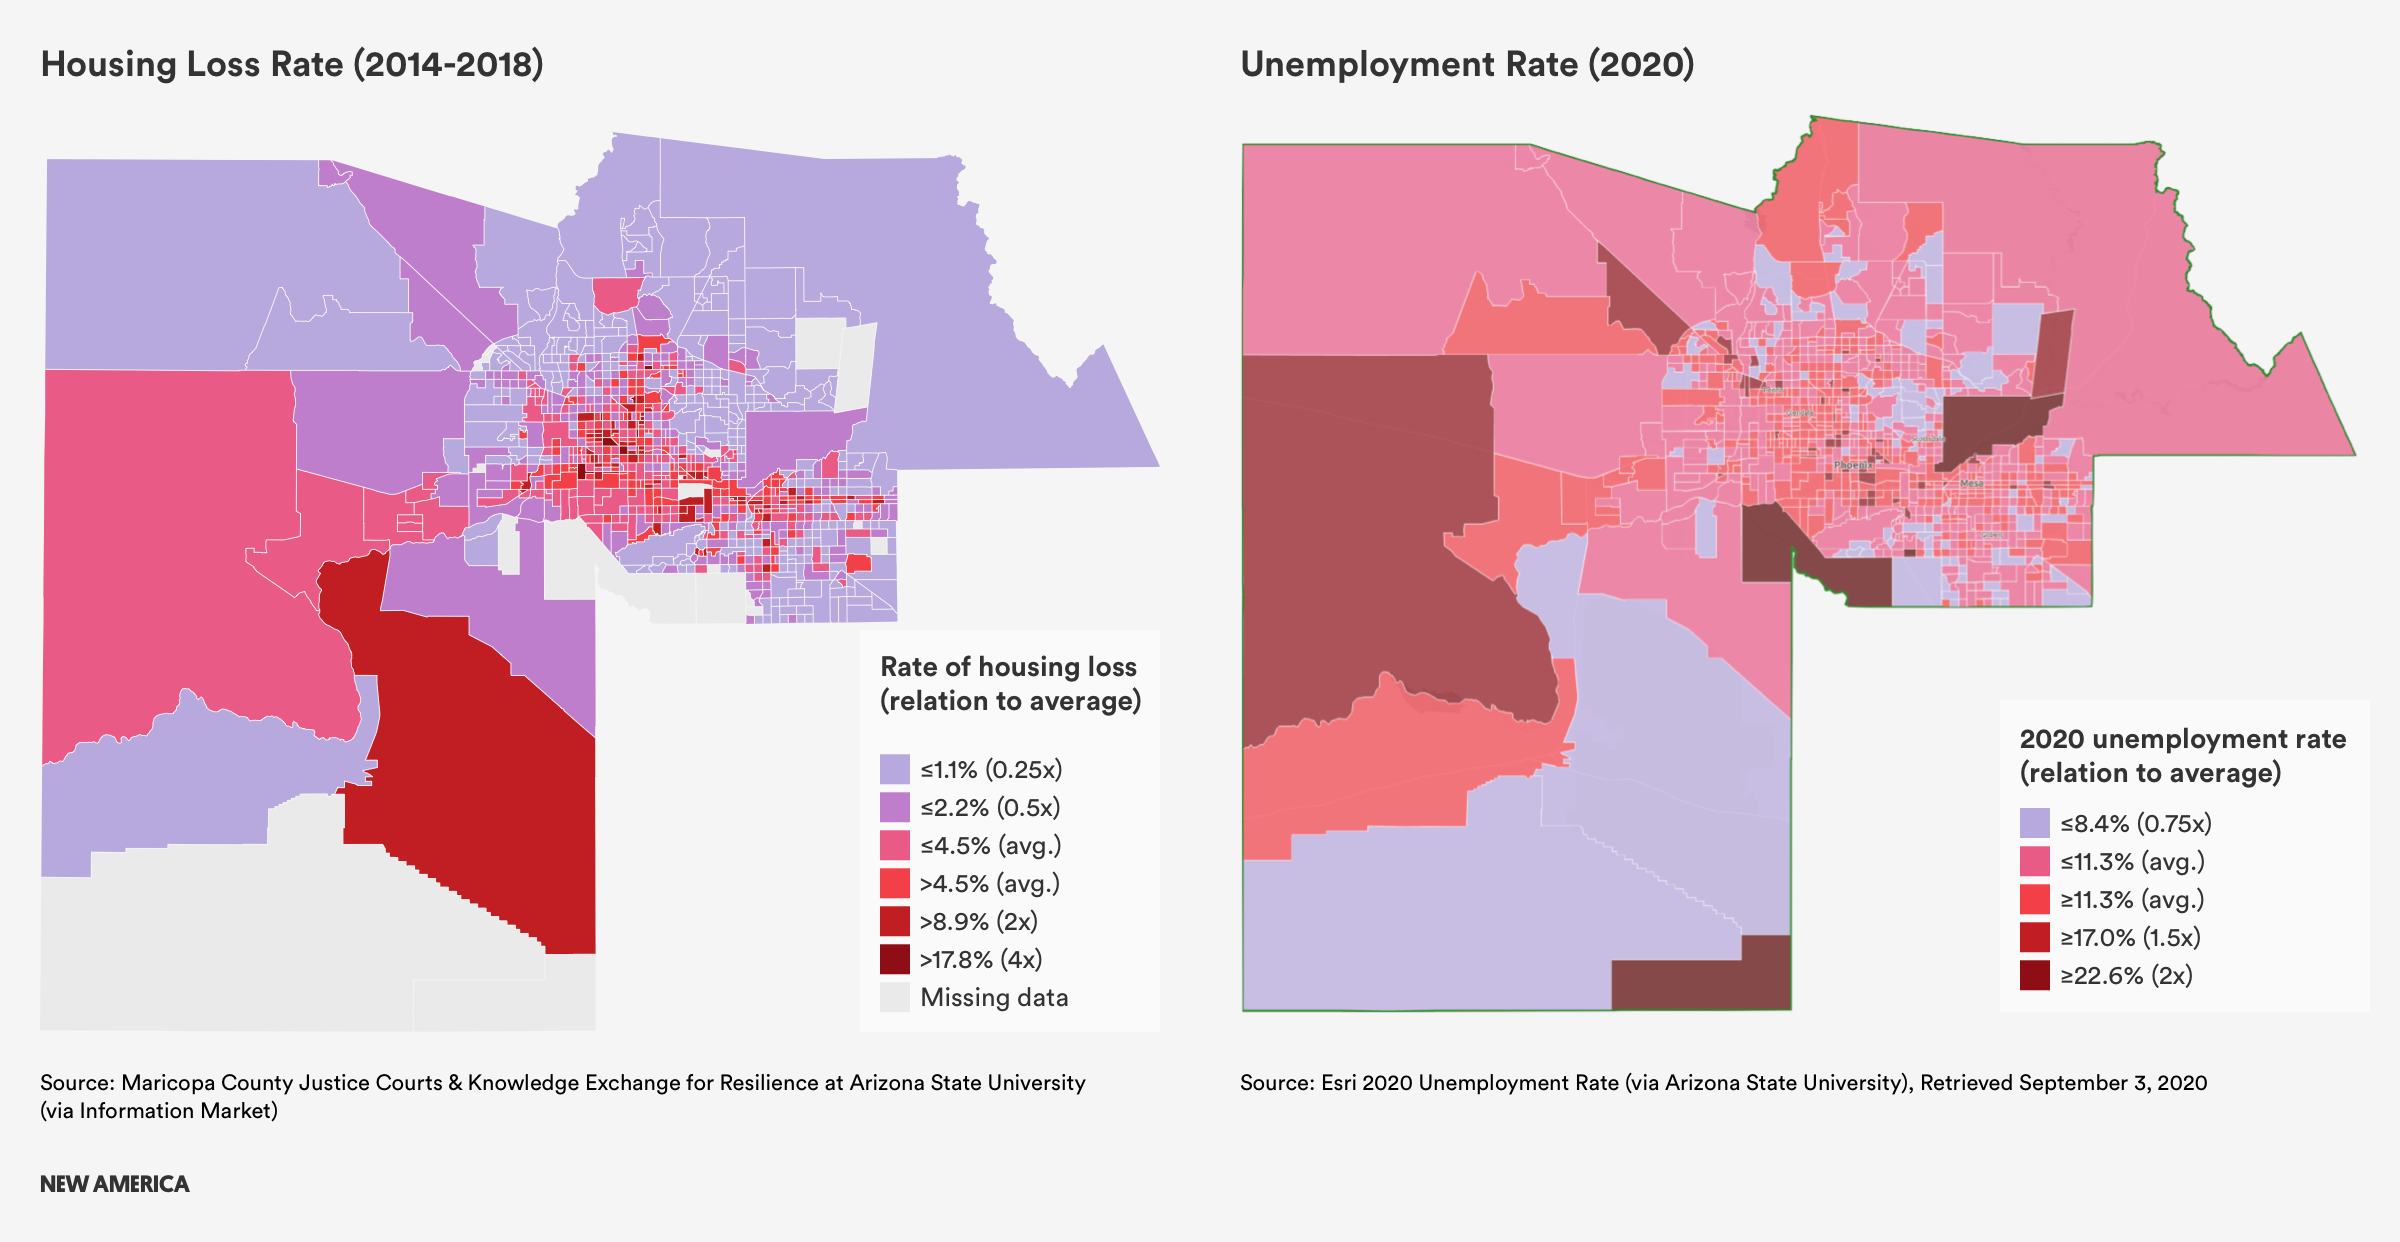
The pandemic may have shone a light on housing loss in Maricopa County, but as this report shows, the crisis has been there all along.
Background and Context
Four and a half million people, or 60 percent of Arizonans, live in Maricopa County, the fourth most populous county in the United States. The county’s recent population growth is an echo of the past, and aligned with the “boom and bust” cycles of the historic American Southwest. Between 1900 and 1940, the region saw significant Latinx immigration as cotton farming, the Mexican Revolution, and World War I drove migrants north. According to a local expert, over the next few decades, cities throughout Maricopa County saw their population boom, creating a bustling metropolitan region in the middle of the Sonoran Desert, as unionized factories moved away from the Northeast and Midwest to states with fewer labor laws, like Arizona.
The rapid growth of the region, however, has been characterized by discrimination. Black, Indigenous, and Latinx residents faced racial discrimination in housing, education, and employment throughout the twentieth century. Redlining also prevented Black and Latinx families from purchasing homes in many areas throughout the county. In Phoenix, redlining restricted these families from acquiring property in the north side of town, keeping communities of color segregated to the south of Van Buren Avenue.
These same neighborhoods were located in an area of Phoenix that was eventually filled with environmental and toxic hazards, including industrial waste facilities, factories, freeways that broke up neighborhoods, and airport noise pollution. For decades residents have fought against the siting of toxic hazards in South Phoenix, grappled with the uneven impacts of the 2008 recession, and are now worried about the potential for the expansion of the light rail to drive gentrification and widespread displacement of long-existing local business and residents.
South Phoenix is not the only area of the city undergoing transformation. As Maricopa County’s economy has diversified after the Great Recession, knowledge workers have flooded into the growing secondary education, finance, and technology sectors. These sectors now make up three-fifths of the regional economy, which is home to U-HAUL, Best Western, the electronic giant Avnet, as well as a regional headquarters for Chase Bank. Universities also maintain a large and growing presence in the county, most notably Arizona State University, and also the University of Arizona, Northern Arizona University, for-profit University of Phoenix, and for-profit Grand Canyon University.
This economic growth must be contextualized alongside continuing socioeconomic challenges. A large wealth gap and income disparity continue to worsen, with many people either working for minimum wage in the service sector, or in high-income knowledge-based sectors. Those working minimum wage jobs may then struggle to not only afford housing, but also the unique costs of living in the desert. With summer temperatures reaching well into the triple digits, the costs of cooling can be astronomical, and are a barrier for many families remaining stably housed throughout the year. As summer becomes hotter as a result of climate change, the need for A/C will only become more acute, and the danger of going without it will increase.
Development in the county is sprawling, and most residents own cars. Various stakeholders noted economic and racial/ethnic disparities between the lower-income West Valley and the higher-income East Valley. For those who cannot afford a car, lack of public transportation poses a significant barrier to employment and mobility.
These challenges contribute to complex drivers of housing insecurity throughout Maricopa County. Various key informants described residents as individualistic, entrepreneurial, and optimistic, but lacking a true sense of community. Indeed, Maricopa County has long contained a large transient population: seasonal workers from Mexico; snowbirds; college students; and young, out-of-state workers who stay for a short time.
Arizona is increasingly a “purple” state, partly due to changing demographics. Major cities such as Phoenix are largely Democratic, while smaller communities are Republican. Nonetheless, the Arizona State Legislature is usually controlled by the Republican Party, and does not prioritize publicly funding social services, affordable housing, or education. Similar to dynamics in both Indiana and North Carolina, the state legislature is known to pass preemption laws that prohibit more liberal housing policies at the county and municipal levels. Developers, landlords, and their lobbyists are a powerful political group in the state.
How, Where, and When Are People Losing Their Homes?
According to our analysis, Maricopa County experienced a housing loss rate (accounting for both evictions and foreclosures) of 4.5 percent between 2014 and 2018. During this five year period, the county had 317,036 eviction filings, which resulted in over 218,000 evictions. Over 17,500 households also lost their homes as a result of mortgage foreclosure during our study period, resulting in a foreclosure rate of 2.9 percent. When broken down, this amounts to the displacement of over 47,000 households each year.
Further, while not included in our housing loss index, insights provided by our key informant interviews highlighted that there is also some housing loss occurring as a result of the redevelopment of mobile home parks. Our correlation analysis revealed a weak, but positive, association between the share of residents living in mobile homes and both eviction and foreclosure rates. The complex ownership tenure of mobile home residents, who may own their house, but rent the land, or rent both their house and the land, creates difficulty in interpreting this data.
Eviction: The overall eviction rate for Maricopa County is 6.2 percent, although rates for several census tracts range between 20 and 30 percent. According to ACS data, renters represent 40 percent of all households, and evictions account for over nine-tenths of all housing loss.
It should be noted at the outset that significant gaps in the county’s eviction dataset led to incomplete analysis. One in three eviction records between 2014 and 2018 are missing court case judgment information, so we could not determine if the tenant was ultimately evicted. These records are not included in our eviction rate calculation. And 21 percent of records were missing an address, so while these records were included in our topline eviction rate calculations, we could not geocode these records and they are not included in our census tract-level heat maps.
Local experts indicated that the most common reason for eviction in Maricopa County is nonpayment of rent. Yet tenants in Arizona can also be evicted for violating a lease agreement and failure to maintain the premises. One major violation of lease agreements that impacts low-income renters in Phoenix is the failure to pay for utilities. During the summer months, temperatures rise to well above 100 degrees, and the cost of keeping housing units cool can be enormous. The average cost to cool a home in Phoenix during the summer is $477, the most expensive rate in the country. For a family already spending more than 30 percent of their income on rent, this extra cost adds a layer of economic vulnerability that can lead to housing loss.
Further, because Arizona does not have “just cause” eviction laws, landlords can refuse to renew a lease without cause. Despite the protections that do exist, including laws outlining the specific grounds that allow landlords to file for eviction, evictions still contribute significantly to housing loss in Maricopa County.
Tenants who are evicted may struggle to find new housing, as some landlords will not accept tenants who have a recent history of eviction on their record, or who have low credit scores. This may force tenants to find substandard housing, for lack of alternative housing options.
Many tracts with the highest rates of eviction are located in the cities of Glendale, Phoenix, Tempe, Mesa, and Apache Junction.
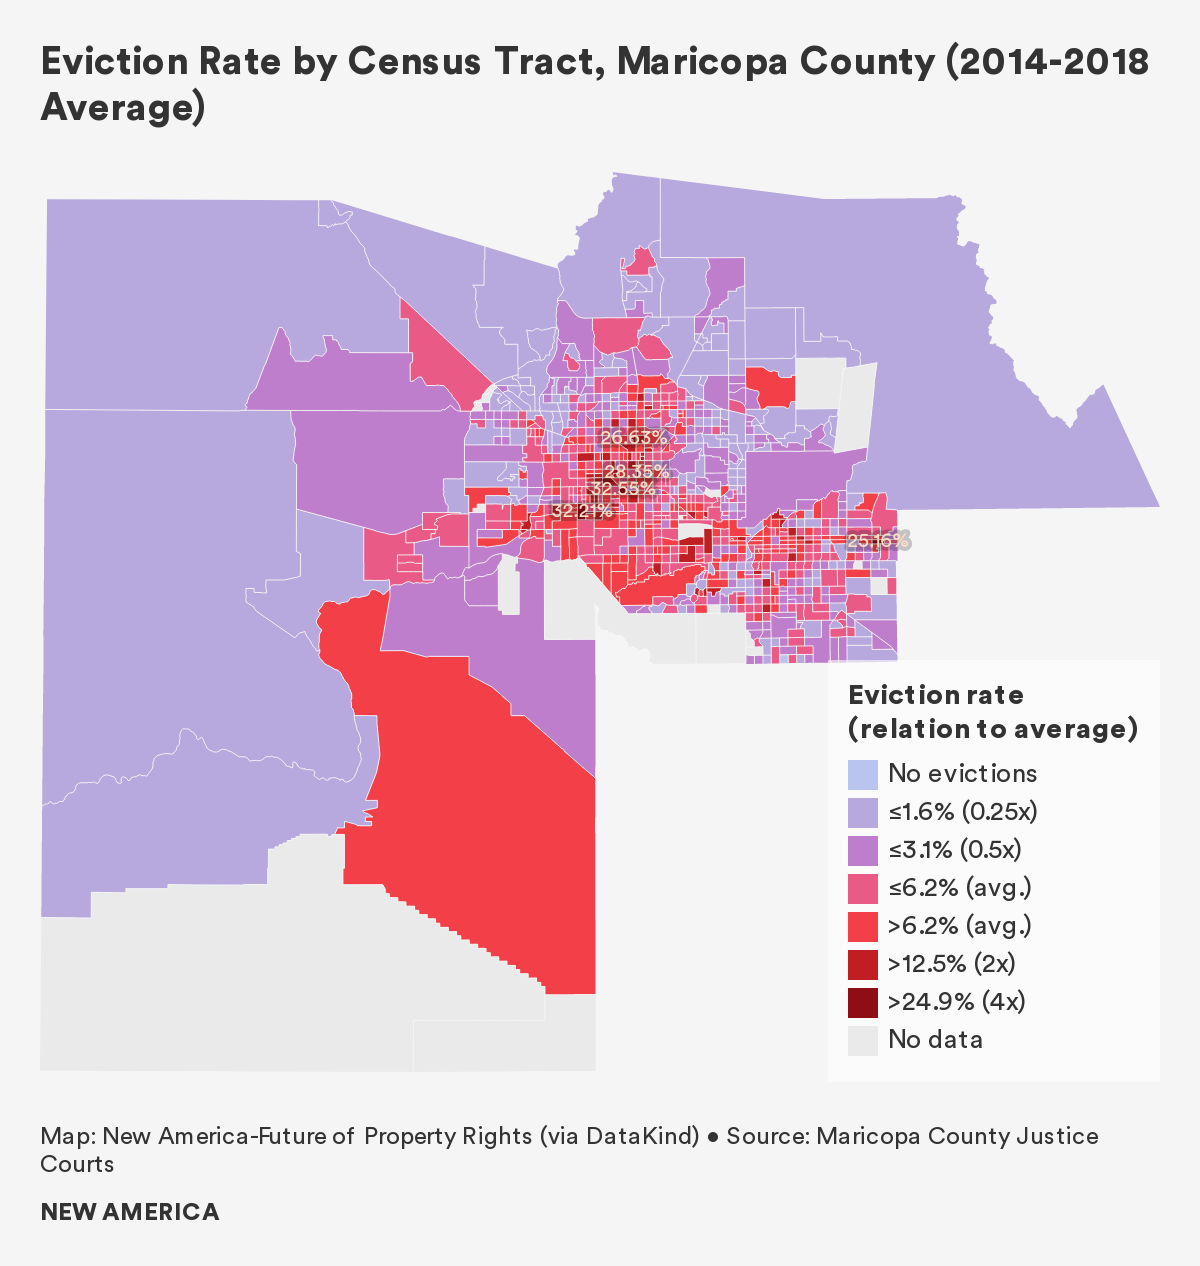
The census tract with the highest eviction rate is located between downtown Phoenix and the City of Glendale, in the Maryvale neighborhood of West Phoenix. This tract, in which over 85 percent of housing units are renter occupied, expressed an eviction rate over 32 percent between 2014 and 2018. According to ACS five-year data (2012–2016), over 30 percent of residents in this tract live below the poverty line, 68 percent of households are Latinx, and 13 percent are Black. Both of these populations are overrepresented in this tract, as throughout the county 30 percent of residents identify as Latinx and just over 5 percent identify as Black or African American. The University of Minnesota’s displacement mapping project found that there was an increase of over 300 vacant units in the tract between 2000 and 2016, despite the fact that over 13 percent of all housing units are overcrowded. This may be explained by the high cost of housing compared to the income of residents, as over 30 percent of all households are severely rent burdened.
The tract with the second highest eviction rate in Maricopa County lies in the Westridge Park neighborhood of Phoenix, and also reports an eviction rate over 32 percent. According to ACS data, over 60 percent of households in the tract are rent-burdened, and over 14 percent of housing units are designated as overcrowded. Demographic data also shows that 30 percent of residents living in the tract were not born in the United States, 46 percent live below the poverty line, and over 60 percent are Latinx.
Our research also found that most tenants in Maricopa County lack access to legal counsel in small claims court, which translates into stark disparities in eviction case judgments. Based on available data from the Maricopa County Justice Courts, 87 percent of landlords have legal representation, compared to just 0.3 percent of tenants, resulting in 99 percent of cases with judgment information being decided in favor of landlords.
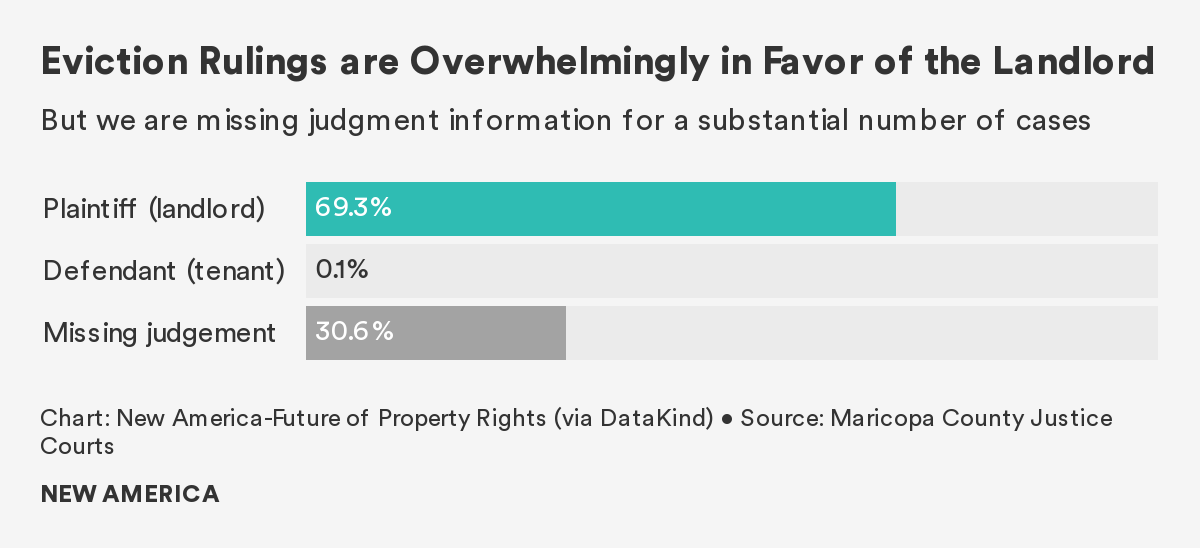
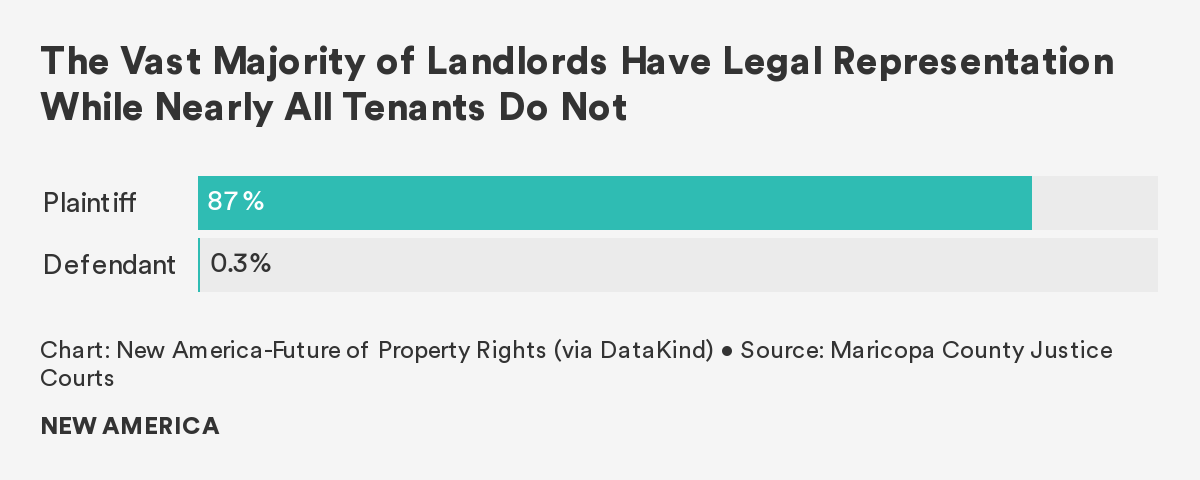
Mobile Home Park Redevelopment
The topic of displacement from mobile home parks in Maricopa County came up during several conversations with key informants. Mobile homes remain a popular, if often last-resort, housing type for over 70,000 households in Maricopa County due to their low monthly average cost of $700. In recent years, however, there have been many reports of investors purchasing parks for redevelopment. According to the Arizona Republic, investors have spent more than half of a billion dollars buying up mobile home parks in the region since 2017.
Mobile homes account for a significant percentage of some communities’ housing stock. In Mesa, 10 percent of all houses are manufactured, putting many residents at risk if their lots are redeveloped. In June 2020, Washington, D.C.-based investor group Carlyle paid over $230 million to purchase four of the older parks in Mesa, removing over 1,000 housing lots from the market.
In nearby Tempe, 42 families were displaced in 2018 when their park was sold to a developer. While residents were offered $7,500 as a relocation payment, it was not enough for some families and they were forced to abandon their homes.
Mortgage Foreclosure: The Valley of the Sun was the hardest-hit metro area during the Great Recession. Homes in Phoenix dropped 56 percent in value before foreclosures swept across the city. While some current renters may be able to purchase homes, post-2008 recession anxiety keeps many from entering or reentering the homeownership market. An expert working for a local housing nonprofit shared that he thought previous homeowners who lost their houses during the recession were terrified of owning homes again. Clearly, the impact of mortgage foreclosure can be long-term, with lasting psychological effects accompanying physical displacement.
Mortgage foreclosure rates in Maricopa County ranged from 0 percent to 7 percent between 2014 and 2018, with an average foreclosure rate of 2.8 percent. The majority of tracts indicated average foreclosure rates between 0 and 1 percent, although tracts toward the southeast and southwest portions of the county, as well as those closer to the city center of Phoenix saw rates between 4 percent and 7 percent.
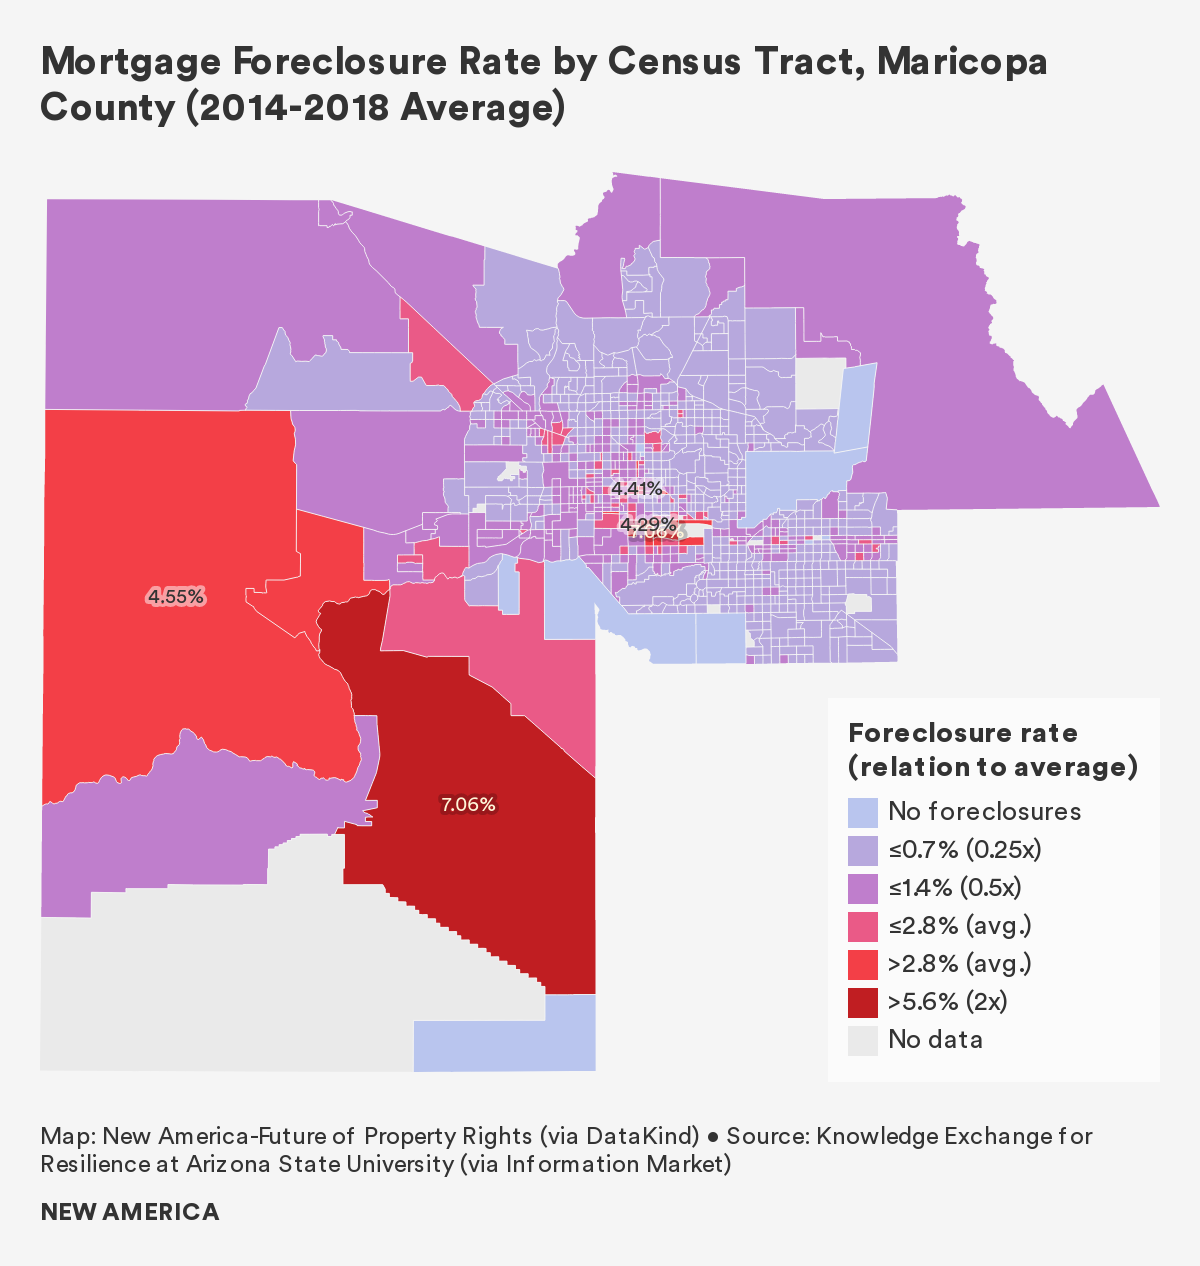
A localized hotspot of foreclosures exists to the north, south, and west of Sky Harbor International Airport, with tracts displaying rates between 3 and 7 percent. The University of Minnesota displacement mapping project found a significant net change of low-income residents in this area of the county. The tract directly south of the airport shows a 14 percent loss of low-income households between 2000 and 2016, in addition to a 4.1 percent foreclosure rate, which is almost one and a half times the county average. Another tract, directly north of the airport, expressed a foreclosure rate of above 3 percent, and saw the number of rental units increase by 344.
These tracts tend to have high percentages of non-white residents: The tracts with the highest rates of mortgage foreclosure were each comprised of over 50 percent Latinx residents.
Parts of Phoenix with the highest foreclosure rates coincide with previously redlined neighborhoods, providing evidence of the long-term impacts of the race-based planning decisions that Black and Latinx community members have lived with for generations.
There are also several large tracts in southwest unincorporated Maricopa County and in the City of Buckeye that have foreclosure rates between 4 and 7 percent. Unlike the tracts in urban Maricopa County, the population of this rural part of the county tends to be whiter and hold proportionate percentages of Latinx residents. According to census data, of the three high loss tracts in southwest Maricopa County, only tract 506.04 has a higher percentage of Latinx residents than the county average. However, almost 40 percent of residents in the tract, which has one of the county’s highest foreclosure rates at 7 percent, earn less than $14,000 per year.
Our Housing Loss Index in Maricopa County:2 In order to measure housing loss that includes both evictions and foreclosures, we first calculated each census tract’s housing loss rate. The housing loss rate combines the total number of evictions and the total number of mortgage foreclosures in a given census tract, and then normalizes that sum by the total number of renters and the total number of homeowners with a mortgage within the census tract.
We then converted the housing loss rate into a housing loss index by comparing a given census tract’s housing loss rate to the county average. A census tract with a housing loss index of 1 experiences a housing loss rate equal to the county average, while an index of 3 indicates that the tract experiences a housing loss rate that is three times the county average.
Maricopa County has a housing loss rate of 4.5 percent. Tracts with the highest housing loss rates tend to be located in urban center of the county, through the cities of Phoenix, Tempe, and Mesa, all the way to Apache Junction. Yet one tract to the southwest of Phoenix, which includes the North and South Maricopa Mountains Wilderness areas, as well as the Sonoran Desert National Monument, possesses a housing loss rate of 2.7 percent. This tract has an eviction rate of 12 percent, and a foreclosure rate of 7 percent.
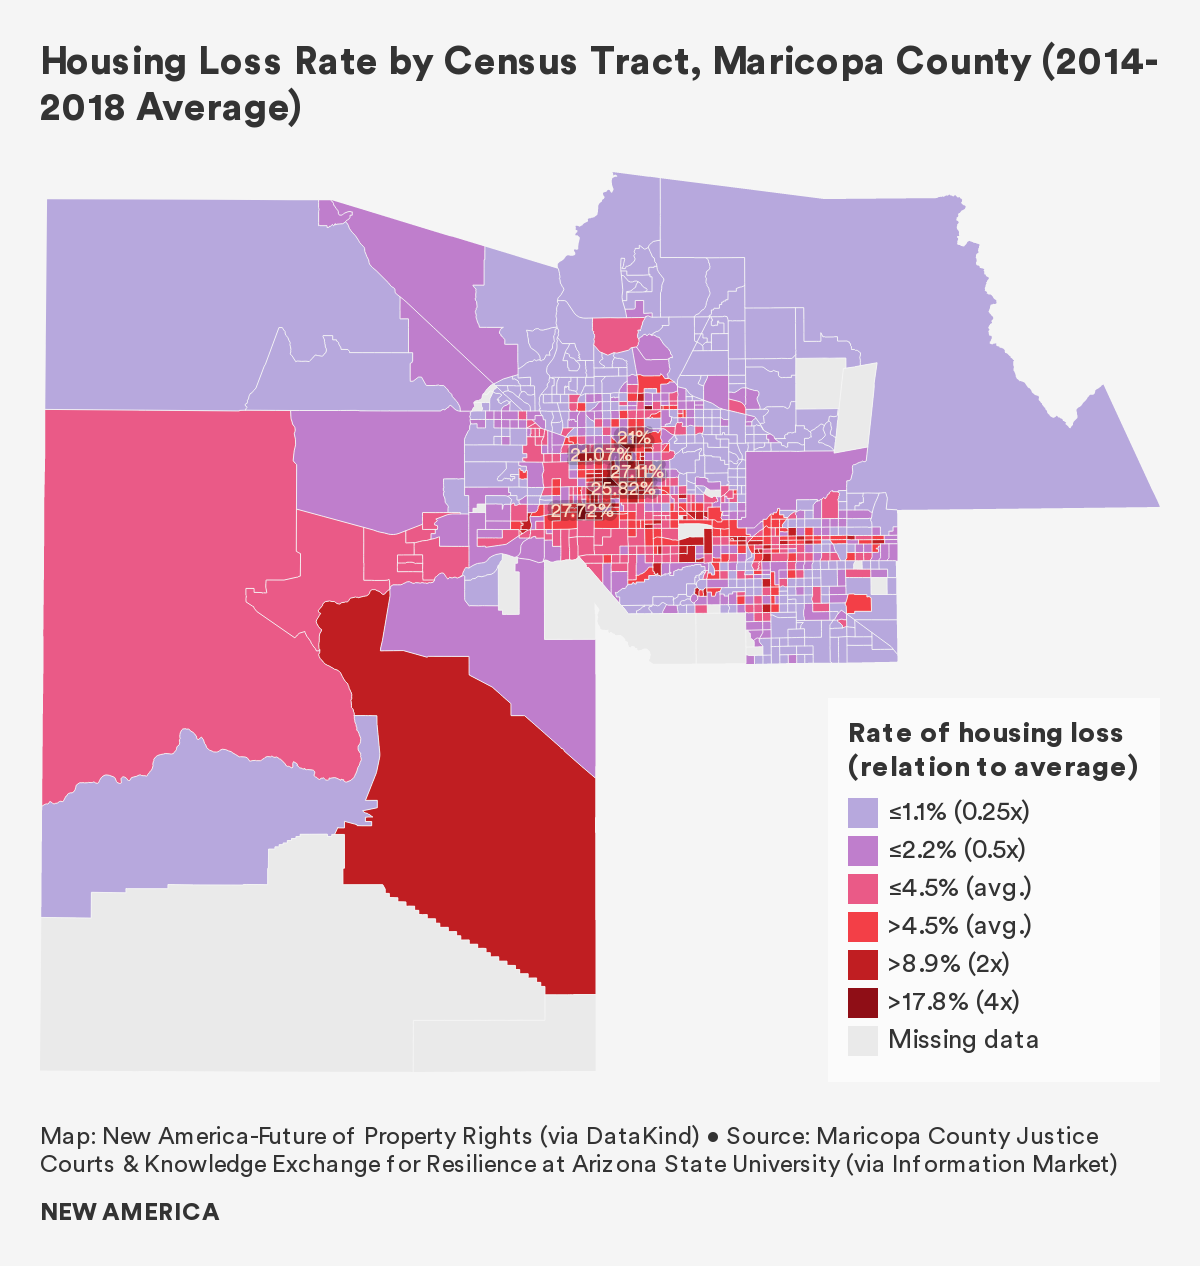
The census tract with the highest housing loss rate, 6.2 times the county average, is located in the Westridge Park neighborhood of South Phoenix. Tract 1125.09 is 65 percent Latinx, more than double the county average, and 44 percent of residents live below the poverty line.
The tracts with the second and third highest rate of housing loss are located in the Alhambra neighborhood of Phoenix. Tract 1068.01 has a housing loss rate tat is 6.1 times the county average and is home to a population with a median household income of just over $23,000, resulting in 43 percent of households living in poverty. The third highest loss tract, 9200, has a housing loss rate of 5.8 times the Maricopa County average, and is bisected by Grand Avenue and neighbors the for-profit Grand Canyon University (GCU). Local experts indicated that GCU was causing localized gentrification, however, more research is needed around the issue. According to ACS data both tracts have high percentages of non-white residents, low rates of homeownership, and substantial numbers of residents suffering from rent-burden.
While foreclosures rates are less than 3 percent in all three highest-loss tracts, eviction rates of over 28 percent push them to the top of our index.
Who is Losing Their Home?
“… When a child gets sick at school, and parents are single, they have to oftentimes go home, which means leaving work so they are very vulnerable to losing their job.” – Local Nonprofit Organization Employee3
Census tracts with predominantly Black or Latinx households had higher rates of eviction, foreclosure, and combined housing loss than census tracts with predominantly white households.4 However, citizenship status appears to be more strongly correlated with high housing loss—and in particular evictions—than race. Language barriers, predatory rental practices, and a reluctance to engage with the government could all be contributing to this dynamic. Additionally, interviews across all of our case study locations suggest that undocumented tenants are often informally evicted, with little recourse.

We found higher rates of housing loss—and in particular foreclosures—in census tracts where residents lacked health insurance. Many low-paying jobs do not provide health insurance, and this finding suggests that these at-risk households cannot pay for housing and medical treatment following an unexpected emergency. This finding is all the more salient in the context of the COVID-19 crisis.
Census tracts with a larger share of single-parent households had higher rates of eviction.5 A lack of two incomes, the high costs of childcare, and difficulties in maintaining steady employment amid other responsibilities may contribute to this relationship.
Tracts with more households that commute to work on public transit had higher rates of eviction. Based on interviews, dependence on unreliable public transportation can lead to repeated tardiness or absence from work, job loss, and a subsequent inability to pay rent.
Finally, as monthly housing costs and incomes rise, housing loss rates—and in particular foreclosure rates—fall. This finding is unsurprising, as wealthier households can rent or buy more expensive homes and usually do not struggle to pay monthly housing costs. This may also be attributed to the ability of wealthier households to build adequate savings and invest in wealth building that is not tied to property ownership.
Why are People Losing Their Homes?
“They don't have the means by which to save any money for a rainy day or if an emergency arises. And then the rents are going up as well.” – Local Nonprofit Organization Employee6
While interviewees mentioned several factors contributing to housing insecurity, the three factors discussed most frequently were lack of livable wages, an affordable housing shortage, and limitations from fixed incomes. Other insecurity factors include out-of-town real estate investors, vacation and short-term rentals that put pressure on housing stock, and the availability and conditions of seasonal and farm worker housing.
Low Wages: During key informant interviews, a lack of livable wages was the most frequently-cited factor contributing to housing insecurity. Wage growth in the county between 2018 and 2019 has been strong at 3.8 percent, yet the minimum wage in Arizona is currently $12 per hour, well below the estimated need for many households with children. The average cost of a two-bedroom apartment in the county is above $1,000, roughly double what minimum wage workers could afford.
The types of new jobs added to the economy in recent years do not adequately support low- and semi-skilled workers. While the recent increases in high-skilled technology, healthcare, and higher education jobs are reviving the local economy, they leave many long-term Phoenix residents behind. Middle-income jobs in the construction industry have decreased by 45 percent since 2010, and many service sector jobs never returned after the Great Recession.
According to the Arizona Department of Housing, in the city of Phoenix, workers must earn over $20 per hour to comfortably afford the cost of living. Those who work in retail, as teachers, or in food service do not earn a wage high enough to afford housing.
Households earning a minimum wage may also be unable to save money for emergencies, creating a precarious situation in which they are, according to a local interviewee, “a flat tire away from being homeless.”
Affordable Housing Shortage: The state of Arizona has a 153,331 unit shortage of affordable housing for extremely low-income households. During the last ten years, home prices throughout the county have increased by 83 percent. This, combined with low wages, results in 45 percent of Phoenix Metro Area renters being rent-burdened.
At the same time that housing costs in Maricopa County are rapidly increasing, Arizona has prevented local governments from adopting rent control measures that might help support lower-income households, setting the stage for landlords to drastically increase rents for tenants.
In some census tracts, particularly south of Sky Harbor International Airport, between 2011 and 2017, rental housing costs have increased by 20 percent, while median incomes have decreased by over 20 percent. Notably, this is the same area of South Phoenix that was redlined during the 1930s, showing the consequences of systemic racism for Black and Lantix communities. We found that in this area, eviction rates are between 10 and 20 percent, and foreclosure rates range between 3 and 7 percent, some of the highest in the county.
Despite the clear need for more affordable housing, the state does not allow any level of government to adopt inclusionary zoning programs. These types of policies could require market-rate builders to fund or construct affordable housing, but, as a result of state preemption, cities are limited in the tools they have at their disposal for creating permanent affordable housing.
Further the large number of migrant farm workers in Maricopa County poses a unique challenge for officials. Farm workers on the H-2A Visa program are often dependent on their employer for housing. If a farm worker loses their job, they are likely to lose their housing, regardless of whether the housing was fit for habitability in the first place. With little money, and precarious legal standing, farm workers may face homelessness, overcrowding, or displacement to their country of origin.
Wall Street, Tourism, and the Maricopa County Real Estate Market
Outside actors have significantly shaped the real estate market in Maricopa County, sometimes for the worse. Several stakeholder groups were mentioned across interviews, all contributing directly or indirectly to the affordable housing crunch and displacement. These stakeholders include out-of-state investors, the short-term rental industry, and snowbirds, or part-time residents:
- Out-of-State Investors: A report from real estate firm Redfin found that over 30 percent of all prospective homebuyers in the Phoenix metropolitan area were from other U.S. regions, with the largest share from California. Further, in 2019, 14 percent of all home sales in the Phoenix metro area were attributed to real estate investors.
According to local experts, these real estate investors often flip properties into unaffordable high-end rentals. Current tenants are often displaced through large increases in rent, or non-renewal of lease agreements. Other interviewees discussed single-family home investments purchased through real estate investment trusts. According to our interviewees, large Wall Street investors are more likely to evict their tenants, as they are far removed from the Phoenix area and are unlikely to develop any relationship or rapport with their renters.
Sales of foreclosed homes and tax liens also present a lucrative opportunity for real estate investors. A 2017 Arizona Republic article found that between 2010 and 2016, 74 percent of tax lien sales were purchased by out-of-state investors, who then proceeded to foreclose on hundreds of families across the valley. Some of these investors included large banks like JPMorgan Chase and Bank of America, consolidating the number of unique investors purchasing tax liens from over 500 in 2010 to 200 in 2016.
- The Short-Term Rental Industry: In 2017, 44 million tourists visited the greater Phoenix area, spending $7.8 billion. These visitors require lodging, and often turn to short-term rental options such as Airbnb or VRBO. Across Maricopa County, there are more than 12,000 active short-term vacation rentals, with high concentrations in Phoenix, Tempe, Scottsdale, and Mesa. Eighty-two percent of these rentals are for an entire home, rather than a single room, indicating that many properties are unavailable for long-term lease agreements. In total, over 730,000 visitors stayed in Maricopa County Airbnbs in 2019, roughly 200,000 more visitors than the next most visited county in Arizona.
While these rentals are taking away from the needed housing stock throughout the county, local governments are unable to limit their use. In 2016, Governor Doug Ducey signed Senate Bill 1350, which prohibits any attempt of municipalities to restrict short-term rentals.
- Snowbirds: Similar to the short-term rental industry, snowbirds, or part-time residents in the county, occupy a significant amount of the current housing stock, impacting housing availability. According to the Maricopa Association of Governments, there are almost 100,000 vacation homes in the Phoenix MSA. And according to the National Association of Homes Builders, Maricopa County is the top county in the United States for second homes, with over 20,000 of these seasonal homes owned by Canadians alone.
Fixed Income: Maricopa County has long been a destination for retirees, with the master-planned community of Sun City often seen as catalyzing a revolution of retirement communities across the United States. Opening in 1960, Sun City now has a population of over 30,000, and its sister community Sun City West houses over 16,000.
Of the more than 1 million retirees in Maricopa County, many are at risk for housing insecurity as they age. It’s estimated that 23 percent of seniors in the county earn less than $25,000, with 12 percent earning less than $15,000.
For low-income seniors who are dependent on social security or other fixed-income sources, a small increase in rent can result in displacement. One local resident recalled that a 74-year-old community member’s rent increased by $50 per month, an unaffordable amount for her $1,000 per month fixed-income, and was forced to leave her apartment. According to local advocates, first-time senior homelessness in their organization has gone up 96 percent in the last 5 years.
In South Phoenix and South Scottsdale/Tempe, participants in a 2017 needs assessment reported suffering from loneliness in addition to housing insecurity. Social service staff participants identified a lack of coordinated care for at-risk seniors as a contributing factor for increasing numbers of homelessness.
It is also important to note that seniors are not the only households living on a fixed-income: Those receiving social security disability insurance (SSDI) or supplemental security income (SSI) are also vulnerable to housing loss as rents rise.
What Happens After People Lose Their Homes
“They are moving in with friends, they're moving in with family and they're ending up on the street.” – Local Nonprofit Organization Employee7
The most frequently cited effects of displacement were strains on the system, mental health impacts, and education instability. This shows the far reaching consequences of housing loss on the broader Maricopa County community.
Strains on System: Housing insecurity does not occur in a vacuum—it places a strain on schools, courts, hospitals, law enforcement, and health providers.
Some residents who lack access to stable housing may establish themselves in informal encampments in public spaces, such as city parks. Some interviewees discussed the costs that municipalities put into cleaning up parks through the forcible relocation of housing encampments. Some see this funding allocation as an attempt to clean up a problem, rather than finding solutions.
Between 2019 and 2020, the number of those experiencing homelessness in Phoenix rose by 18 percent, prompting the city to direct over $20 million in funding as a response. Other cities in the county have also allocated funding towards homelessness responses, and have adopted best practices for responding to the homelessness crisis.
Aside from the physical and psychological impacts on displaced residents, cities bear a real cost for managing large populations of unhoused individuals. Healthcare costs are an acute concern, particularly in the summer months, when unhoused populations face increased risk for heat stroke, dehydration, and infections.
Catastrophic events that require EMT, police, or fire department services can be a strain on public funds, and these health events are often preventable with the proper systems in place. Not providing housing to those in need has created a situation in which unsheltered community members are at increased risk for medical emergencies, putting a strain on the system.
Mental Health Impacts of Housing Loss: The process of housing loss also contributes to real mental health consequences for those displaced. Families forced to move to a different community lose not only their home but their support network. Several individuals that work in housing nonprofits discuss bouts of depression afflicting people they serve. Depression, stress, and anxiety stemming from housing insecurity may also impact professional endeavors and personal relationships, resulting in a cyclical inability to find and maintain stable housing.
Children and Education: Children of displaced parents must often switch schools. These switches, particularly when they occur multiple times a year, are proven to impact educational attainment.
A 2011 policy brief found that while 90 percent of students in the Phoenix metropolitan area remain in the same school from year to year, there are clusters of higher mobility rates in areas of South and Central Phoenix, indicating that students in these areas of the city face higher levels of school instability.
These same areas of the county show higher rates of evictions in our analysis, setting the stage for potential future research into the relationship between housing loss and educational stability in Maricopa County.
Children have also been shown to have poorer health outcomes after experiencing housing loss, including lower body weights and issues with mental health. As one local expert described, “I think trauma is major. I think it's overlooked… if you're a child and you don't know where your next meal is going to come from, you're not getting healthcare, if you don't know where you're going to sleep at night, if you don't know where you're going to go to school, if you don't know if you have a backpack or not, if you've got pencils, all of that impacts the development of your brain.”
Policy Recommendations
Policy solutions represented the most robust and diverse spectrum of answers from our key informant interviews in Maricopa County. These answers varied from very specific changes, such as revisions to Senate Bill 1350 (i.e., state preemption on local governments limiting short-term vacation rentals), to broad recommendations, such as increased creativity in developing housing solutions.
Certain policy solutions were voiced across all three of our case study locations; we included these commonly proposed solutions in our policy recommendations section, as we believe them to be broadly applicable across the country. These recommendations include, but are not limited to: improving housing loss data; expanding the social safety net and increasing wages; expanding affordable housing options through voucher programs, trust funds and tax credit programs; and increasing parity between landlords and tenants, for example by improving tenants' legal rights.
Below are three additional policy recommendations that were unique to our Maricopa County case study.
Protect Mobile Home Residents: Residents who live in mobile home park communities have few protections. Currently, Arizona law requires compensation for moving expenses of $7,500 for a single-wide home and $12,500 for a double-wide home. Alternatively, households can choose to abandon their homes and receive compensation equal to one-fourth of the predicted moving expenses on their home.
According to interviews, this compensation does not adequately reflect the real costs of moving, and many residents are forced to abandon their homes. As such, the state should work to provide increased compensation for residents who are displaced as a result of mobile home park redevelopment. Relocation compensation should be based on independent expert estimation of relocation expenses associated with each particular instance of park redevelopment, as is done in Sunnyvale, California. Further, if households wish to abandon their houses, they should be given the full appraised value of their homes.
Alternatively, the State of Arizona and Maricopa County should investigate ways to support resident-owned communities that would permanently provide affordable housing options to those who reside in mobile home parks. Across the United States there are currently over 1,000 resident-owned mobile home park communities, providing long term security and agency to owners.
Better Regulate Short-Term Vacation Rentals: Arizona law prohibits any municipality from adopting policies that would regulate or limit the use of short-term vacation rentals like Airbnb or VRBO, unless for public health or safety. For counties like Maricopa, that house a significant number of short-term vacation rentals, this state preemption prevents local policy from being implemented. State leaders in Arizona should reconsider its preemption of local policy regulating short-term vacation rentals.
Streamline and Improve Data Availability: Maricopa County should work to track real-time housing loss data that can be used by local agencies, researchers, and nonprofits to support residents at risk of housing loss. This data can then be used for better integration and interoperability of support systems. A better coordinated system would prevent those at risk of losing their home from experiencing homelessness and its spiraling impacts.
Conclusion
We began this research in 2019 to examine housing loss across the United States, and at a localized scale in Maricopa County. We could have never predicted that we would release our report in the midst of an unprecedented crisis, with tens of millions of Americans at risk for eviction and foreclosure as a result of the economic fallout of a global pandemic.
We have seen firsthand in the last few months how policy measures can help keep people in their homes. These policies, including nationwide moratorium on evictions, foreclosures, and utility shut-offs, deferments on mortgages, rapid expansion of federal housing voucher programs, and direct rent relief through local public housing authorities, have helped to prevent a wave of housing loss that we believe is coming as programs begin to expire.
However, these policies must be targeted to communities most in need, and so we need to know who those communities are, and where they live. While the economic shocks resulting from the pandemic are unique, we do believe that past housing loss provides an indication of future housing loss, even in these unprecedented times. As such, we hope this granular examination of where exactly evictions and foreclosures are most acute, and which communities are traditionally most impacted, will help municipal leaders and advocates direct outreach and resources in this time of crisis.
The COVID-19 pandemic may have elevated the urgency of eviction and foreclosure, but housing loss is a scourge even in times of relative calm. We must develop long-term policies to combat this systemic ill.
We also acknowledge that, in Maricopa County, the work is not done. More research is needed to better understand where displaced households are moving to, how tracts that overlap with Native American Reservations experience housing loss, how rural residents are losing their houses, and whether race or ethnicity is indeed a predictor of housing loss in the county.
Citations
- From an interview with the authors.
- In order to generate an indicator of housing loss based on the total number of evictions and mortgage foreclosures, we created two new variables: housing loss rate and housing loss index. The housing loss rate reports the total number of evictions and mortgage foreclosures as a proportion of the total number of renters and homeowners with a mortgage in a given geography (here, census tract). The housing loss index reports the housing loss rate by census tract as a proportion of the mean (average) housing loss rate across the entire county. As a benchmark for interpretation, a housing loss index of 1 indicates that the census tract under consideration has a housing loss rate equal to that of the county average, while an index of 3 indicates that the census tract has a housing loss rate that is three times the county average.
- From an interview with the authors.
- While our research did show a relationship between housing loss and race, more research is needed to determine if race is truly a predictive variable for housing loss in Maricopa County, and to examine race while controlling for possible covariates, such as income. This research is currently being conducted by the Knowledge Exchange for Resilience (KER) at Arizona State University.
- This finding is supported by national research which shows higher rates of eviction among families with children and single-parent households.
- From an interview with the authors.
- From an interview with the authors.
Housing Loss in Marion County, Indiana
“I had raw sewage in my basement. I refused to pay rent. They evicted me.” – Shelter Operator, citing a client.1
Introduction
Indianapolis is one of the largest cities in America, with a rich Black history. Like so many Midwestern centers, it blends innovation with a production economy and seeks to find balance with the smaller towns and rural communities with which it trades people, services, and culture. Also, like so many locations in the Great Migration region, Indianapolis struggles with rapid economic progress against the backdrop of segregation and systemic racism.
How are these economic and racial dynamics bound up with housing, a fundamental human right that for so many across the United States is under threat? To answer that question, researchers from New America’s Future of Property Rights program teamed up with New America – Indianapolis and the Institute for American Thought at Indiana University-Purdue University Indianapolis (IUPUI) to analyze five years of Marion County eviction, mortgage foreclosure, and tax foreclosure data. We also interviewed government officials, housing advocates, educators, and representatives in nonprofit organizations, government housing agencies, community development corporations, social service centers, nonprofit legal services, real estate firms, and policy institutes to gain an in-depth understanding of local issues related to housing loss. We wanted to know how often residents were losing their homes—whether through eviction, foreclosure, or other mechanisms—who were most at risk of losing their homes, where within the county this loss was most acute, why people were losing their homes, and what happened when they did. These diverse interviews evoked an array of common themes steeped in a history of wage stagnation, racial segregation, and gentrification.
However, in the midst of completing this research, the world changed. As the COVID-19 pandemic swept across the United States, it rapidly became clear that we would release this report at a time when millions of Americans are without jobs and at risk of losing their housing. This report became more than a way to show historic housing loss, but a tool city leaders could use to better predict where the hardest-hit neighborhoods of their city may be.
The root causes of housing loss are only being exacerbated by the COVID-19 crisis in Marion County. And as many have predicted, the wave is coming: On August 14, evictions resumed in Marion County for those who do not live in subsidized affordable housing, and the CARES Act eviction moratorium for federal public housing, housing choice vouchers, FHA-insured multifamily properties, and multifamily-assisted properties expired on July 25. On September 1 the Centers for Disease Control (CDC) announced a nationwide ban on evictions until the end of the year. However rent will still be due on January 1, and thus far the government has not offered rent forgiveness and only limited relief.
For several months the U.S. Census Bureau has been conducting a weekly Household Pulse Survey focused on tracking the fallout from the pandemic. In Indiana, the Pulse Survey conducted between July 16 and July 24 found that 24 percent of households were housing insecure, meaning that they either missed their rent or mortgage payments last month or believe they will not be able to pay this month, and that 50 percent of households reported that at least one person in their household has lost employment income. Further, the Bureau of Labor Statistics reported in June that Marion County had an unemployment rate of 12.3 percent, almost triple the rate in June 2019. Taken together, it is clear that this economic snapshot does not bode well for already struggling households in Marion County.
In a SAVI mapping project from Indiana University’s Polis Center, census tract-level accounting of unemployment claims helps to spatialize pandemic-related job loss in a similar manner to how our housing loss index spatially visualizes displacement. Several of the tracts with the highest numbers of unemployment claims are also included as high housing loss tracts within our index. Tracts particularly hard hit by pandemic-related unemployment and housing loss tend to be clustered in the mid-north neighborhoods, and on the east side. Some tracts with high job loss had 2014-2018 eviction rates between 15 and 30 percent and housing loss rates ranging between two to three the county average, before the pandemic.
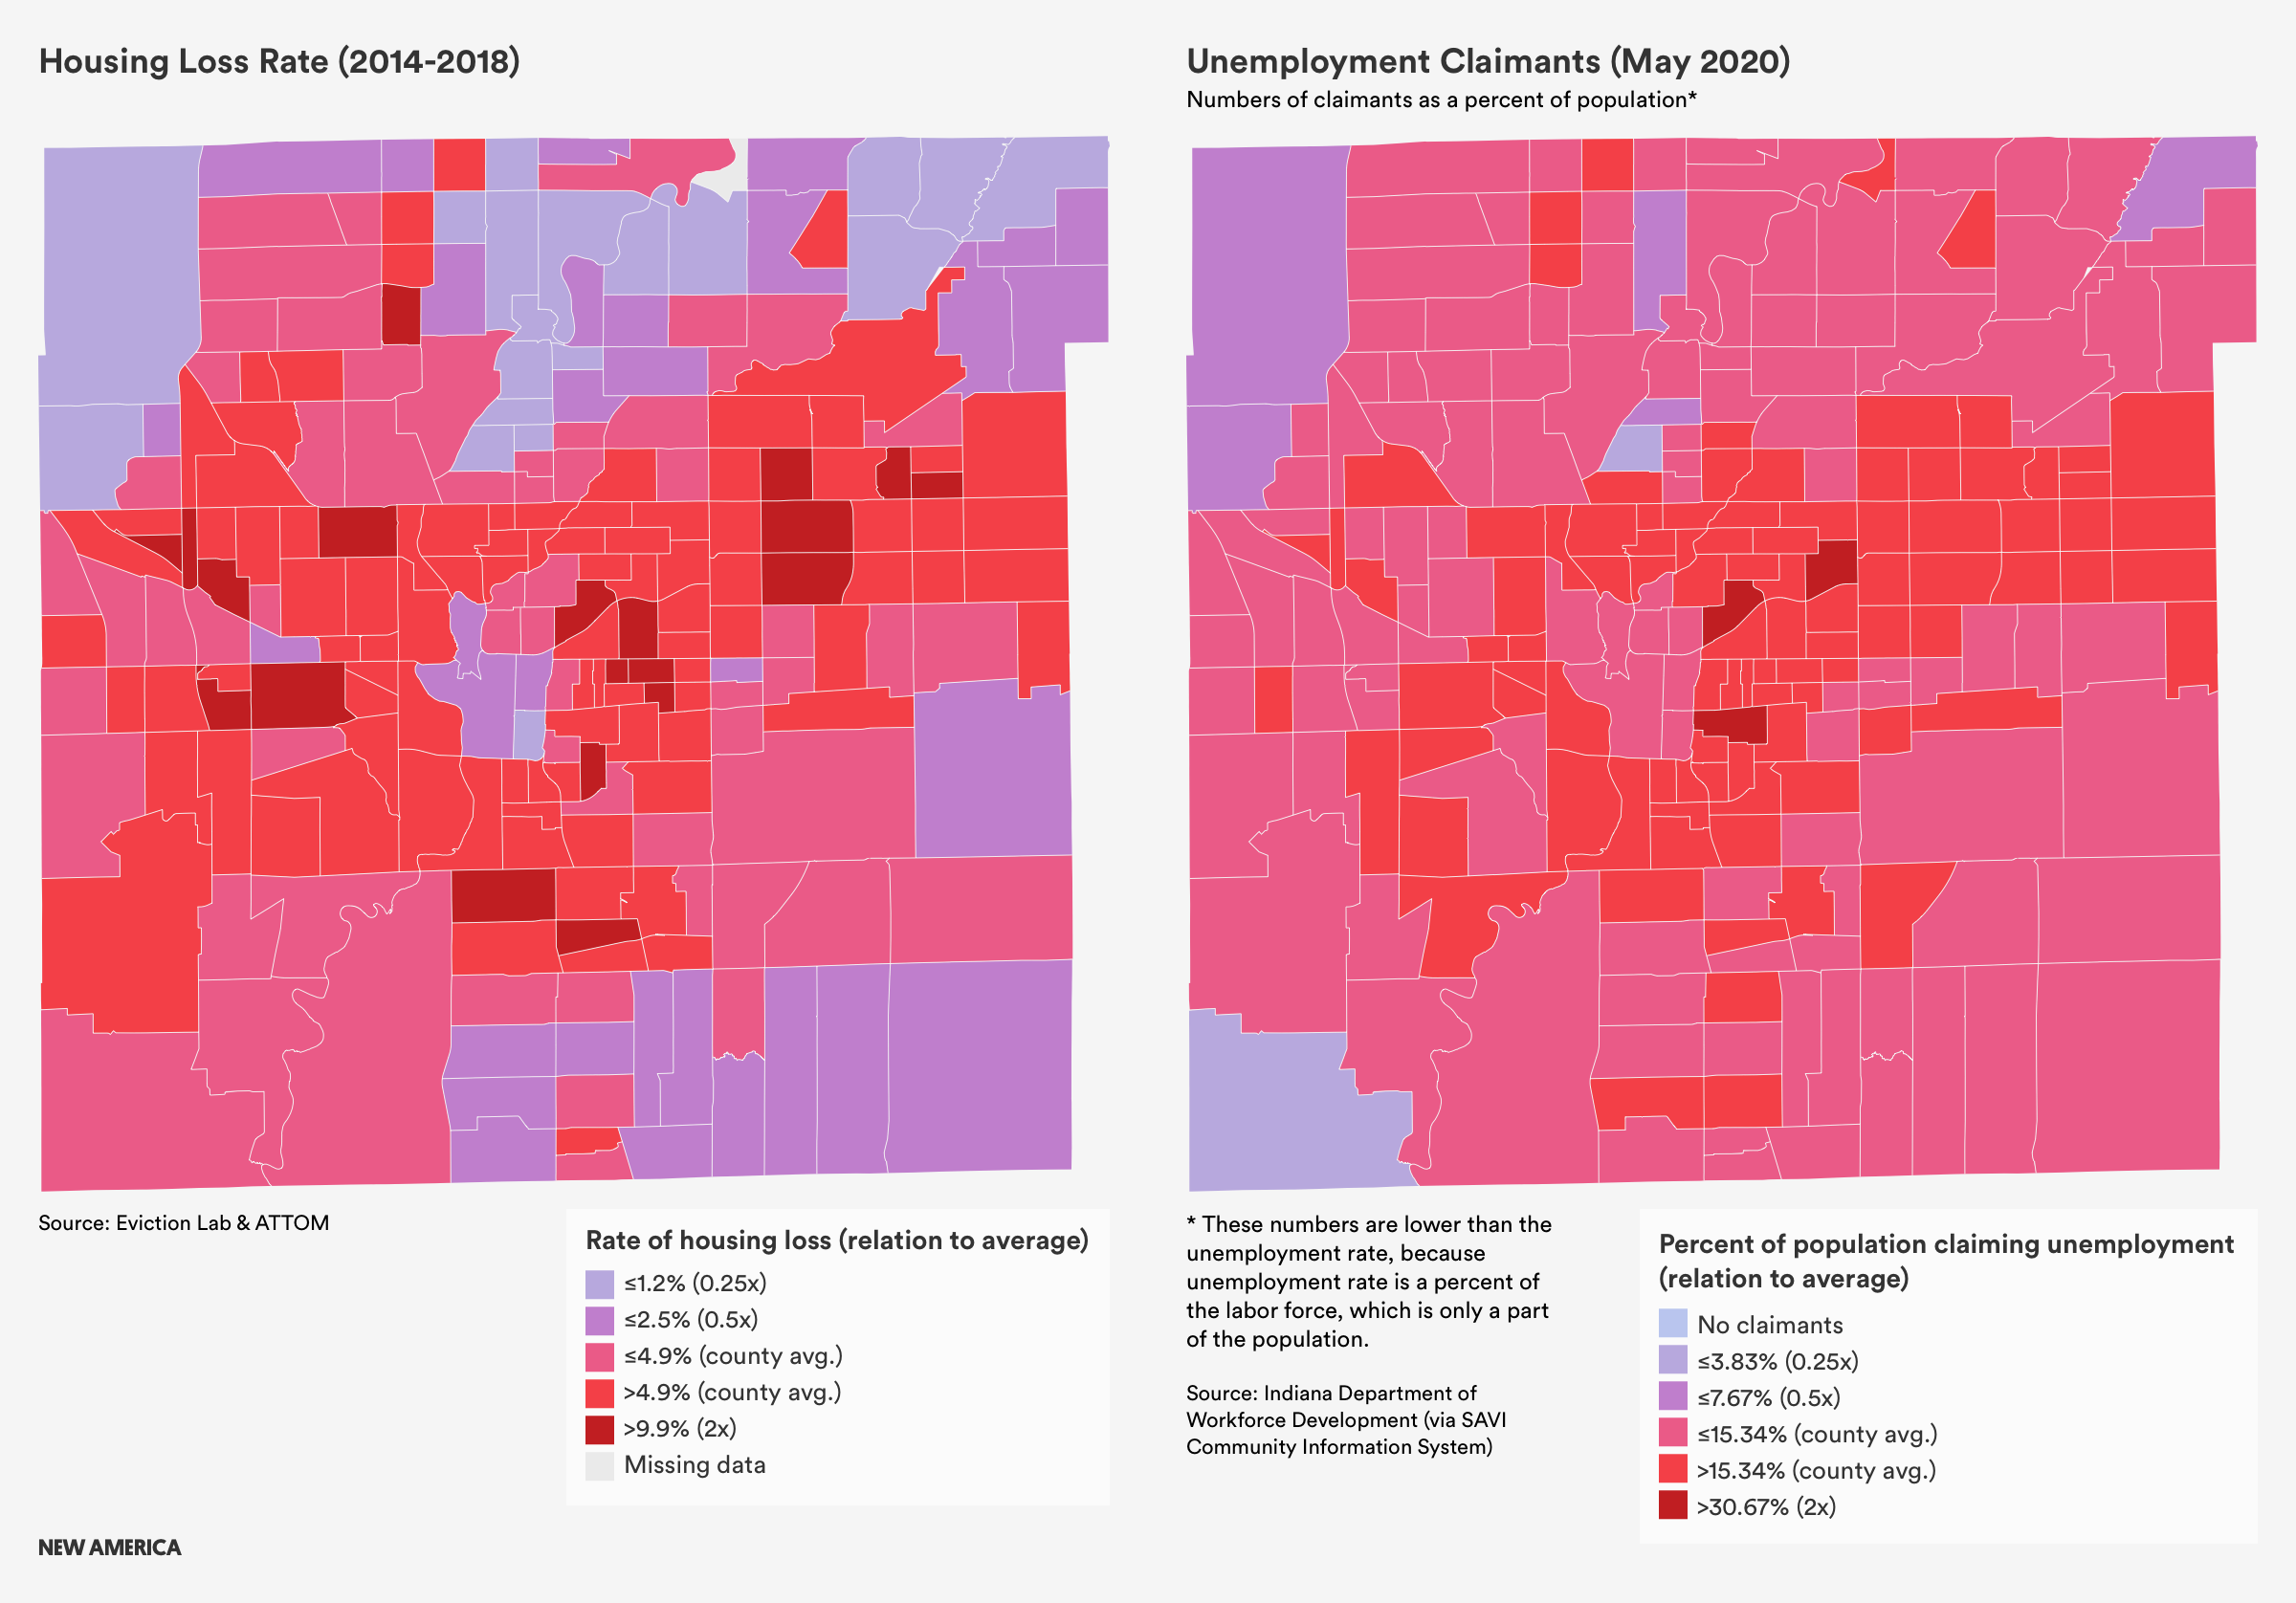
The pandemic may have shone a light on the scope of potential housing loss in Marion County, but as this report shows, the crisis has been there all along.
Background and Context
On the edge of “flyover country,” a sprawling residential and economic hub stretches across Central Indiana. This is Marion County—Indiana’s most populous county with nearly 1 million residents. The county is more or less coterminous with Indianapolis, which is the state’s capital and largest city, and is the epicenter of Indiana’s economic activity. Indianapolis alone accounts for approximately one-third of Indiana’s gross domestic product.
The city is the 17th largest by population in the United States, and the 16th largest by square mileage. In terms of area, Indianapolis is actually larger than its Midwestern cousin, Chicago.
A consolidated city-county government, known as Unigov,2 manages Marion County, with the exception of four municipalities—Beech Grove, Lawrence, Southport, and Speedway—which retain full autonomy. Because Unigov artificially expands the municipality’s population and square mileage, Indianapolis sometimes feels like a small-time town with big-city problems.
To understand housing instability and loss in Marion County, it is critical to understand the county’s socioeconomic history.
During the Great Migration of the early twentieth century, many Black Americans in the South migrated to northern cities in search of opportunity—including to Indianapolis—where they faced racial discrimination in education, employment, politics, access to social amenities, and housing. As a result of segregation, many of these new residents were concentrated along and to the north of Indiana Avenue, and large portions of the city were redlined, preventing scores of Black families from purchasing homes.
Various policies and trends radically shaped Marion County during the latter half of the twentieth century. For example, consolidation via Unigov added 250,000 residents to Indianapolis overnight, and wealthier, white residents fled from the city center to newly created suburban communities. The acreage of agricultural land in the county decreased dramatically, while Marion County lost approximately 60,000 jobs between 2000 and 2010. The midcentury establishment of IUPUI, northwest of Monument Circle and the central business district, as well as the building of the interstate that cuts through downtown, led to the physical destruction of Black communities along Indiana Avenue.
Over the past few decades, new growth downtown, spurred in part by an increased tax base and federal loan eligibility resulting from Unigov, has driven younger residents back to the city center. Sustained political will from the Indianapolis Mayor’s Office, as well as the established presence of the NCAA and other high-powered sport organizations, has also significantly driven Indianapolis’ redevelopment.
Gentrification and displacement, while certainly a historical phenomenon, is also ongoing. Today, neighborhoods surrounding downtown, such as Fountain Square to the southeast, are experiencing renewed investment. And the Super Bowl Legacy Project, resulting from Indianapolis hosting Super Bowl XLVI, is responsible for the revitalization of neighborhoods, especially on the Near Eastside. Often, the result is that low-income individuals are pushed further away from the amenities, jobs, and services of downtown in order to find affordable housing.
Aside from corporate sports, other major industries in the region include education, manufacturing, and health care, as the city is headquarters for both Anthem and Eli Lilly and Company. There is also an emerging technology sector in Indianapolis, especially with Salesforce, a cloud-based software company, establishing a large office in 2017, and the 16 Tech Innovation District opening its first building on its 60-acre campus in August 2020.
While the transformation of the Marion County economy has contributed to new job growth for high-skilled workers, many low- and middle-income earners have been left behind. In Indianapolis, between 2000 and 2016, high-income earners saw income growth of 5.8 percent, while middle-income workers saw their annual earnings decrease by 8.5 percent. This decrease in middle-income wages is at least partially explained by Indiana’s shift away from manufacturing: Between 1969 and 2014 Indiana lost around 31 percent, or 200,000, manufacturing jobs. As a result, many workers have become reliant on low-wage work in the food service and retail industries; a 2018 report on economic opportunity in Central Indiana found that two-thirds of job growth in the region between 2006 and 2016 was in low-wage industries. While low-wage workers have seen income growth of 4.9 percent during the last two decades, these wages are not high enough to afford the cost of living, which has increased faster than wages.
How, Where, and When Are People Losing Their Homes?
Marion County experienced a housing loss rate, accounting for both evictions and foreclosures, of 4.9 percent between 2014 and 2018. Roughly 17,500 households lost their homes each year during this time frame.
Evictions: Approximately 46 percent of households in Marion County rent their homes, yet these households account for 75 percent of all housing loss in the county. The overall rate of eviction for renter households in Marion County was 6.8 percent between 2014 and 2018.
According to interviewees, the most common reason for eviction is the inability to pay rent, and our quantitative analysis indicates an association between rent-burdened households and higher rates of eviction. We also heard anecdotal evidence regarding retaliatory evictions after tenants contacted local authorities about inhabitable rental units or unfair rental practices.
Personal crises, notably loss of income, or an unexpected expense, such as car repair or a medical emergency, can easily result in a low-income household missing rent. Many families lack adequate emergency savings, and local rent relief programs are inaccessible to many. Low-income renters often cannot gather the necessary documents to qualify for assistance, or find the time for an application appointment.
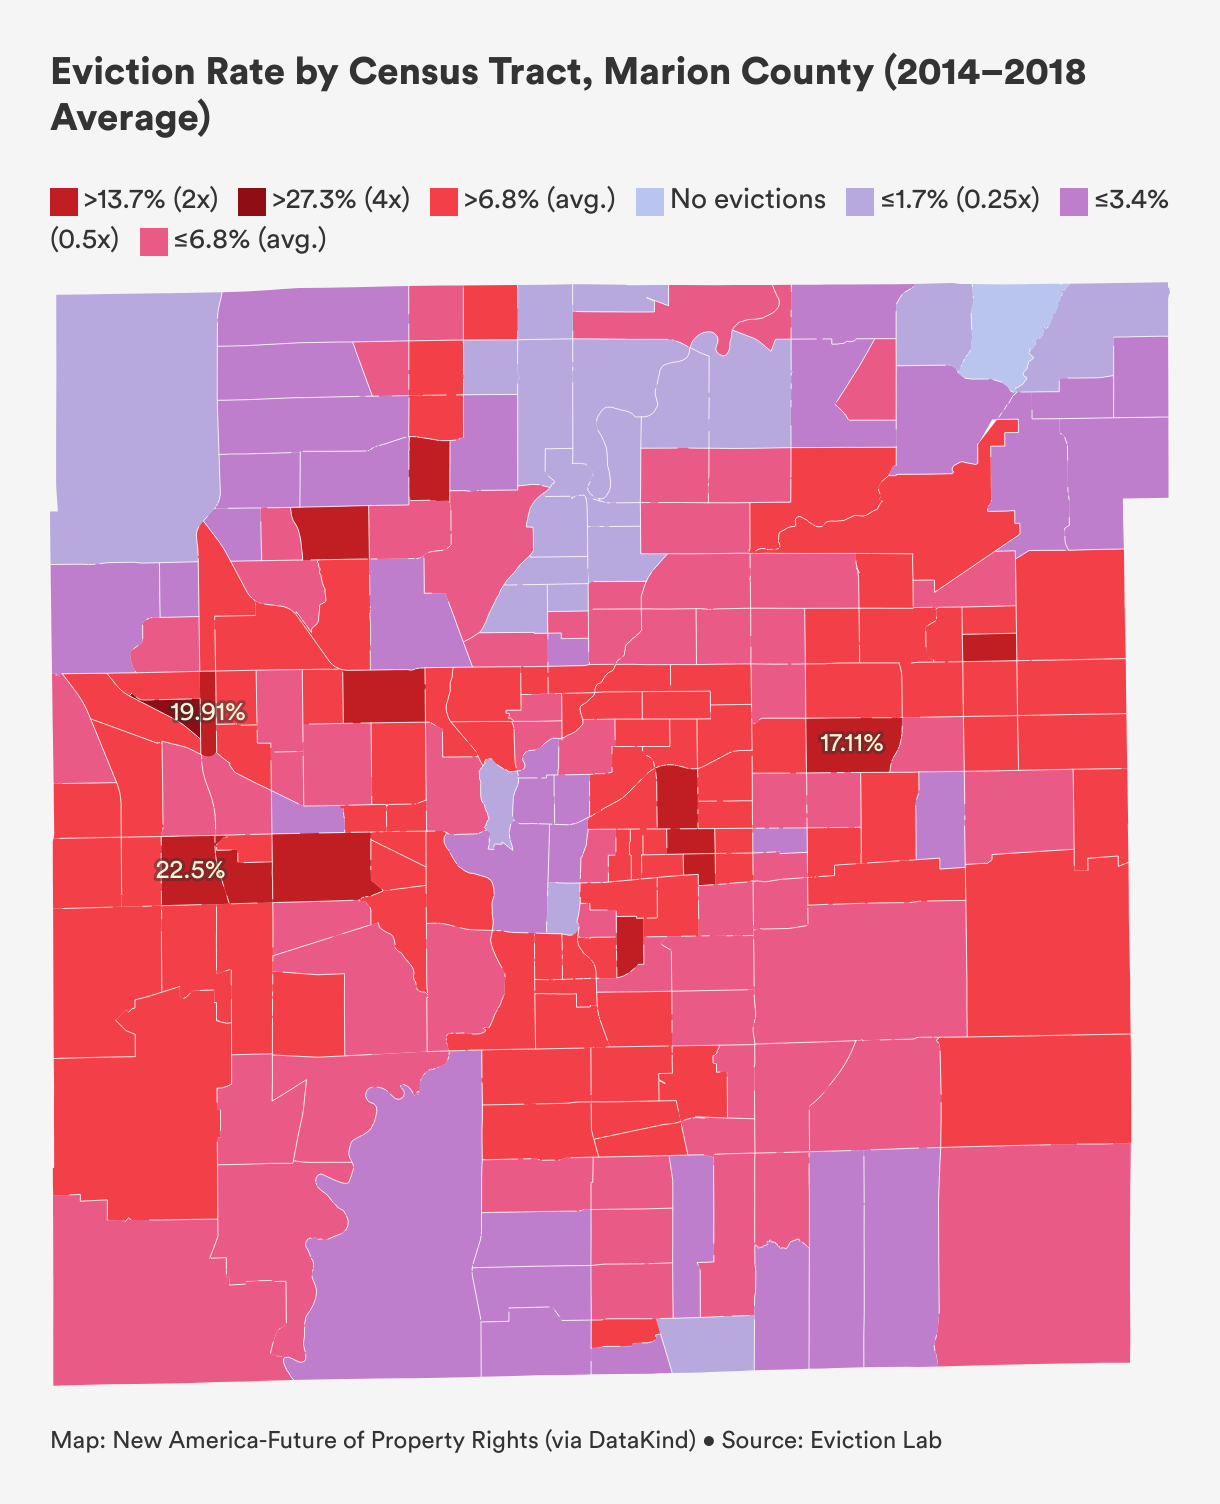
Generally, census tracts experiencing above-average rates of eviction are located on the periphery of downtown Indianapolis. These tracts are also home to more Black households, the demographic group with the second-strongest association with evictions, behind Latinx households. Tracts directly south of downtown that record high rates of eviction, however, are home to large percentages of white households. These findings suggest that neighborhoods surrounding Mile Square suffer significant rates of home loss, regardless of race.
Yet the two tracts with the highest rates of eviction between 2014 and 2018 are located in Wayne Township, to the west of downtown Indianapolis.
The worst tract for evictions, with a shocking rate of 34 percent—meaning that more than a third of renters are evicted every year—lies just outside the enclave of Speedway. Wedged between I-465 and I-74, the tract is roughly 50 percent Black and 14 percent Latinx. Most significantly, the median household income in the census tract is $54,757, about 20 percent higher than the county average. Tracts with higher incomes generally show lower rates of eviction, so why does this relatively wealthy tract express the highest eviction rate in Indianapolis?
The only clue we could find was a 2013 article in the Indianapolis Star that highlights habitability issues within the Heather Ridge Apartments, a 204-unit complex in the census tract. According to the report, the apartments’ owner was ordered by the Indianapolis Housing Authority to repay over $500,000 due to welfare fraud. The public housing authority found that the owner was not providing adequate housing for residents with housing choice vouchers, a violation of the program’s requirements. Management was also illegally billing these residents for past-due utility bills. Because Indiana lacks “just cause” eviction laws, which stipulate acceptable reasons for which a landlord can pursue eviction, landlords often evict tenants simply for contacting local officials about substandard living conditions or unfair rental practices. It is possible that tenants in the Heather Ridge Apartments were evicted for withholding rent due to habitability concerns, however this is only a guess and more research is needed to understand the exceptionally high eviction rate within this census tract.
The second hardest-hit census tract in Wayne Township reported an eviction rate of 22.5 percent. This tract also does not appear to include distressed neighborhoods or large percentages of marginalized populations, which show strong associations with housing loss. Located about halfway between the racetrack and Indianapolis International Airport, the tract reports a median household income of $56,050 and 80 percent of housing units are owner-occupied. In fact, the census tract is majority-white, the racial group most weakly associated with eviction in Marion County according to our analysis.
Mortgage Foreclosures: The foreclosure rate for owner-occupied households with a mortgage in Marion County was 2.7 percent between 2014 and 2018. Mortgage foreclosure accounted for 25 percent of all housing loss in Indianapolis during this five-year span, resulting in the displacement of over 3,700 households per year.
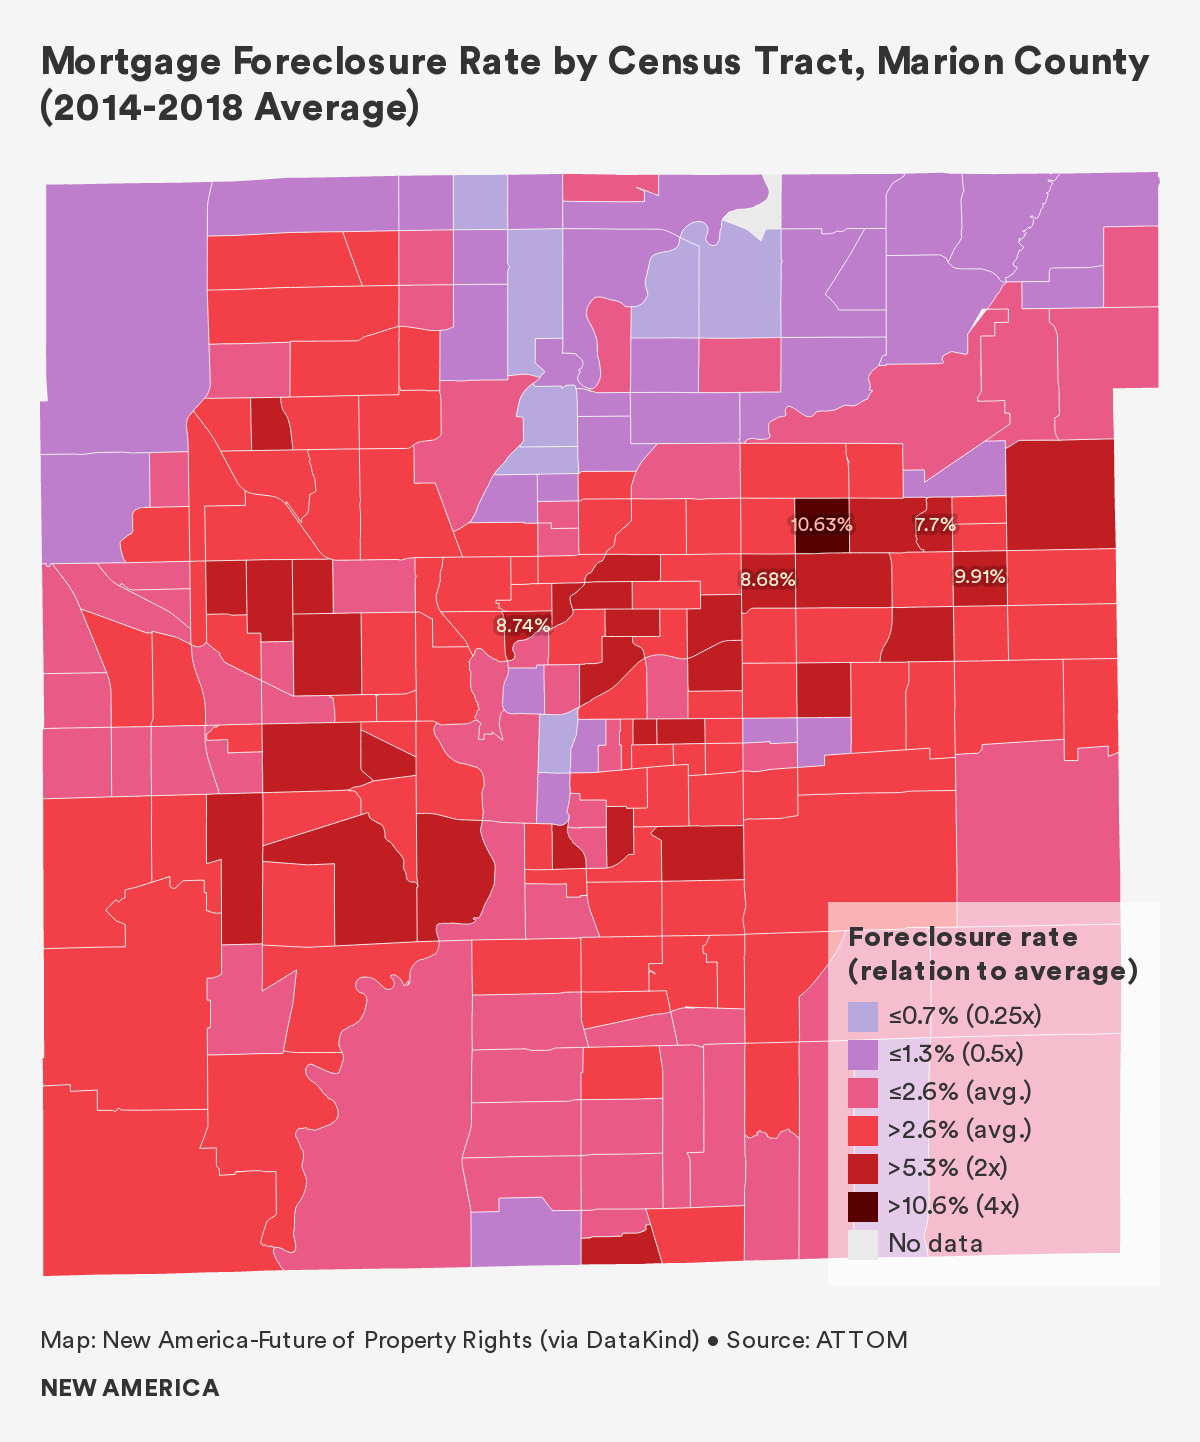
A number of census tracts in Marion County experienced foreclosure rates significantly above the county average. Most of these tracts are located along a tilted "V" shape, starting on the northwest side, dipping down along I-465, and then stretching up and across the city from the southwest side to Lawrence on the northeast side. Some tracts record rates as high as 7 and 8 percent. Hard-hit tracts to the north, and especially to the northeast, of downtown Indianapolis are home to higher percentages of Black households, and report both high poverty rates and low property values. Mortgage foreclosure rates to the south of Mile Square, in more white neighborhoods, are lower but still significant at 4 to 5 percent.
The census tract with the highest foreclosure rate in the county—10.6 percent—sits in the northeast township of Lawrence. The tract’s population is 75.5 percent Black and 9.6 percent Latinx, the median household income is $31,327 and approximately 30 percent of households live below the poverty line. Only 26 percent of homes are owner-occupied.
The University of Minnesota’s Displacement and Concentration of Low Income mapping project found that between 2000 and 2016, this census tract lost 489 units of homeownership and gained over 350 rental units. The number of vacant housing units also skyrocketed by over 300, providing some evidence of the spiraling impacts of foreclosure on neighborhood health. Census tracts adjacent to this high housing loss tract also saw the loss of thousands of homeownership units, and a rapid growth of either rental replacements or housing units sitting vacant.
The tract with the second highest foreclosure rate, at 9.9 percent, sits near the county’s eastern edge. The tract has a median household income of $46,196, near the county average, and is 55 percent Black, 15 percent Latinx, and 22 percent white.
Similar to the geography of evictions in Marion County, the far north as well as the southeast township of Pike generally record the lowest eviction rates. This finding is unsurprising: Census data indicates that these areas are wealthier and whiter, with households living in more expensive homes.
Tax Foreclosure: Typically, tax foreclosure occurs after long-term non-payment of property taxes, usually over the course of several months or years. Indiana is a “tax lien state,” meaning that investors bid on liens for tax-delinquent properties at public auctions. After a sale, the original property owner is given a period of time to “redeem” the tax lien, or pay off back taxes, and keep the property. Otherwise, ownership of the property is transferred to the investor. Generally, the redemption period is one year in Indiana.
Data provided by the Marion County Auditor’s Office unfortunately does not differentiate between owner-occupied properties, rental properties, and commercial or industrial properties. We were not able to calculate the tax foreclosure rate among homeowners without a mortgage—the demographic inherently at risk of tax foreclosure—as a result. Nonetheless, a map indicating tax foreclosures per total owner-occupied households in each census tract between 2014 and 2018 provides valuable insights.
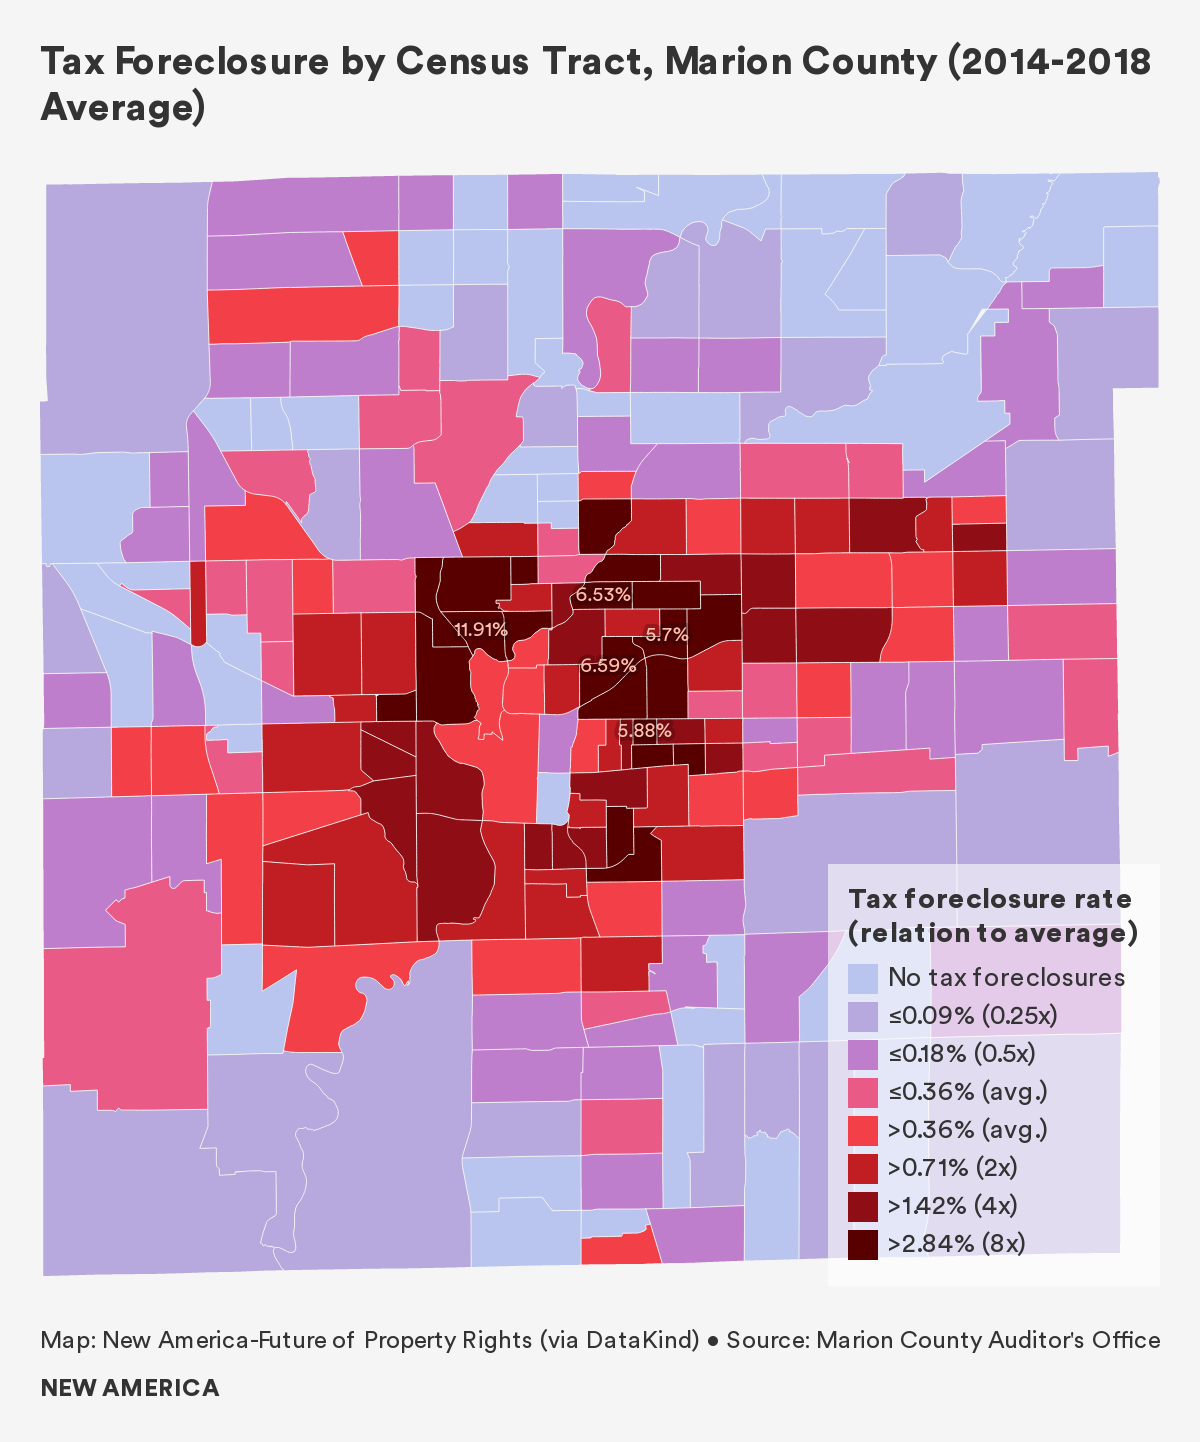
Geographically, tax foreclosures occurred in a ring surrounding downtown Indianapolis, with one tract expressing a rate at nearly 12 percent. There were a number of tracts with no data reported, which may mean there were no foreclosures during the time period but this should not be assumed without verification. This ring of foreclosures aligns with previously redlined areas of the city, and our data shows that census tracts with more non-white households experienced higher rates of tax foreclosure.
A focus on Black homeownership and tax foreclosure has been prominent in other research across the country. Black Americans have paid a disproportionate amount of property tax as a result of the purposeful overvaluation of their properties in many American cities. As a result, Black homeowners have lost their homes through tax foreclosure in cities such as New Orleans, Chicago, Detroit, and Philadelphia. Local research in Marion County is needed to determine if Black homeowners are paying more in property taxes than their white counterparts.
According to a 2015 article in the Indianapolis Star, tax foreclosures are a long-term consequence of the bursting of the U.S. housing bubble in 2008. Families, banks, and various other actors abandoned roughly 10,000 Marion County properties since the Great Recession, and the data suggests the trend continued well into the next decade.
Many of these tax-foreclosed properties now sit vacant or abandoned, with investors—many from outside of Indianapolis—significantly responsible for this blight. Maps built by OpenIndy and Renew Indianapolis indicate that neighborhoods such as the Near North, Martindale-Brightwood, and the Near East Side are acutely affected. These areas overlap to a considerable degree with our tax foreclosure map: Local census tract 3512, in particular, reported a tax foreclosure rate of 11.9 percent, and sits directly to the south of Crown Hill National Cemetery, on the southside of I-65.
Our Housing Loss Index in Marion County:3 In order to measure housing loss that includes both evictions and foreclosures, we first calculated each census tract’s housing loss rate. The housing loss rate combines the total number of evictions and the total number of mortgage foreclosures in a given census tract, and then normalizes that sum by the total number of renters and the total number of homeowners with a mortgage within the census tract.
We then converted the housing loss rate into a housing loss index by comparing a given census tract’s housing loss rate to the county average. A census tract with a housing loss index of 1 experiences a housing loss rate equal to the county average, while an index of 3 indicates that the tract experiences a housing loss rate that is three times the county average.
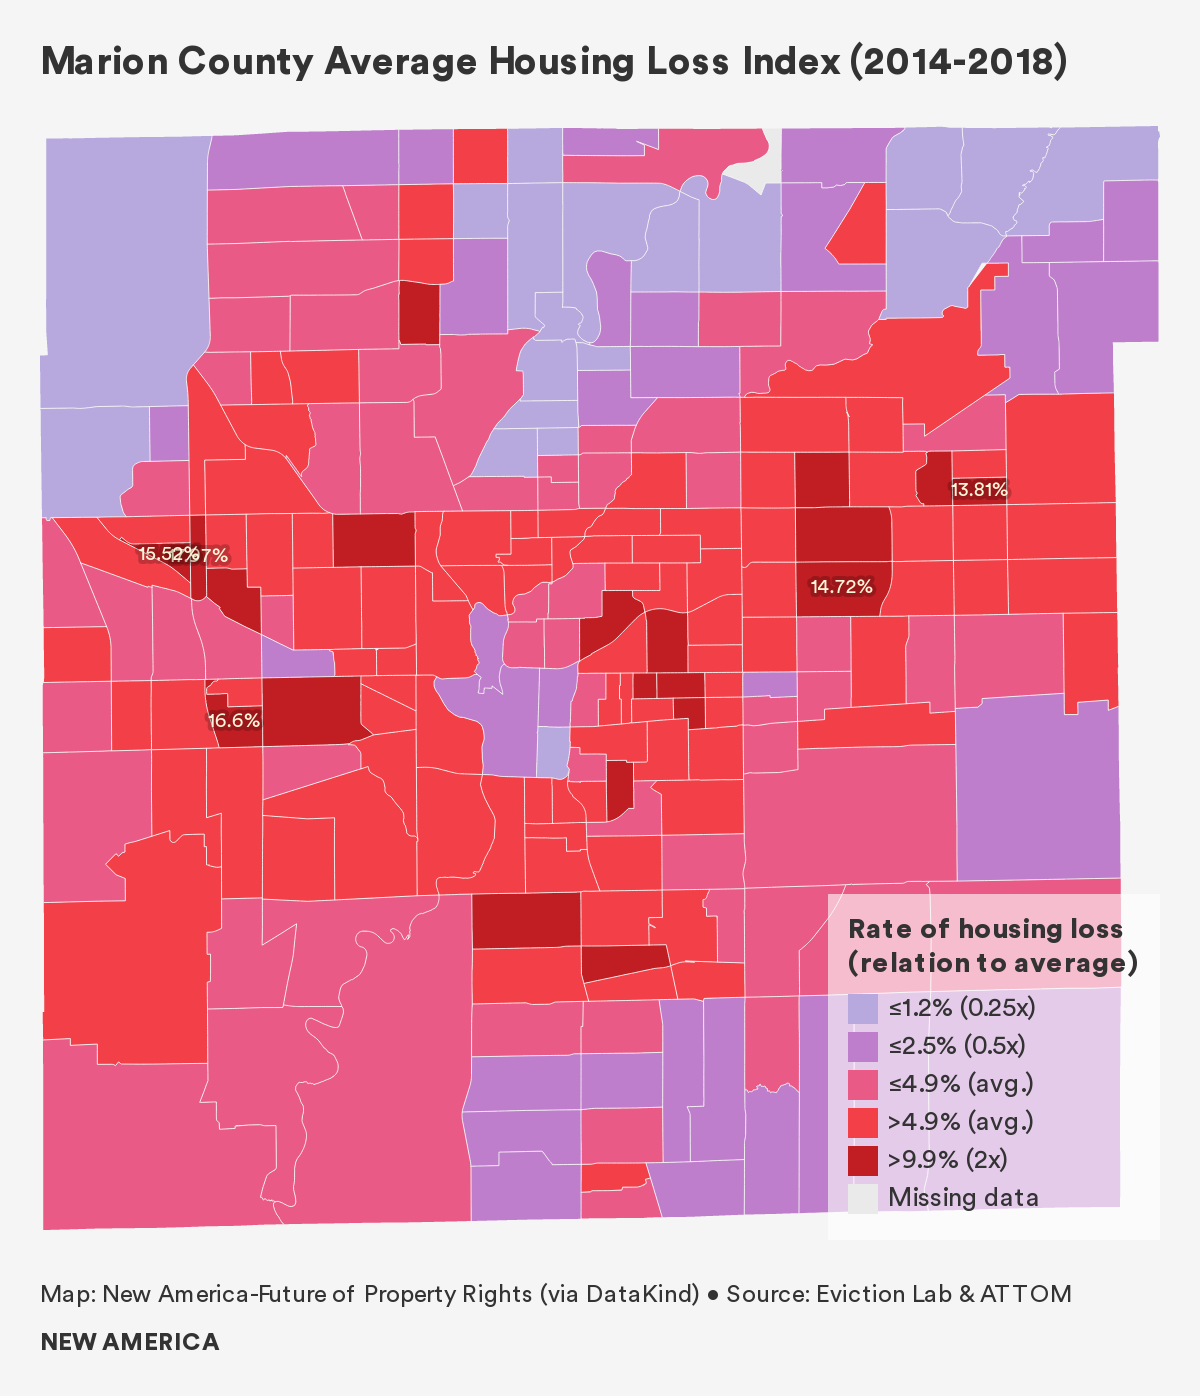
Overall, two townships—Wayne and Center—exhibit the most acute housing loss, as a few tracts in these areas report rates of loss two to three times the county average. A few census tracts in Warren, Lawrence, and Perry townships express rates double the county average, as well.
This band of housing loss stretching east to west through the middle of the county is no coincidence. Local stakeholders observed that when people are displaced, they move laterally, and almost never north or south. Research shows that displacement is often a neighborhood-wide phenomenon, and so it is unsurprising that tracts in this middle band appear so vulnerable.
The census tract with the highest rate of loss in Marion County is located in Wayne Township, and actually sits in both Indianapolis and the enclave of Speedway. Long and narrow in shape, the tract experienced housing loss at a rate 3.6 times the county average between 2014 and 2018. The tract reports a median household income of $30,883, and 31.1 percent of the population lives below the poverty line. Renters comprise 84 percent of all households, and the tract is 50 percent Black and 23 percent Latinx.
Two other tracts on the west side experienced housing loss rates three or more times the county average. The first, adjacent to the west of the hardest-hit census tract, reports a median household income of $54,757, about 20 percent higher than the county median. While this tract’s foreclosure rate is in line with the county average, its eviction rate is extremely high, as discussed above. The second tract sits slightly to the south, between the neighborhoods of Keystone Manner and Lynhurst. The tract reports a median household income of $31,548, and 30.5 percent of the population lives below the poverty line. The tract is 56 percent Black, 23 percent Latinx, and 20 percent white. Notably, almost 40 percent of the tract’s population is foreign born; quadruple the county average.
Who is Losing Their Home?
We found a strong positive relationship between lack of health insurance and housing loss. In fact, of the 20 socioeconomic and other variables examined, both evictions and foreclosures were most strongly associated with a lack of health insurance, showing the truth of the adage: “one health scare away from being out on the street.” Many low-paying jobs do not provide health insurance, and this finding suggests that these at-risk households are generally housing cost-burdened and/or low-income, or cannot pay for housing and medical treatment following an unexpected emergency.
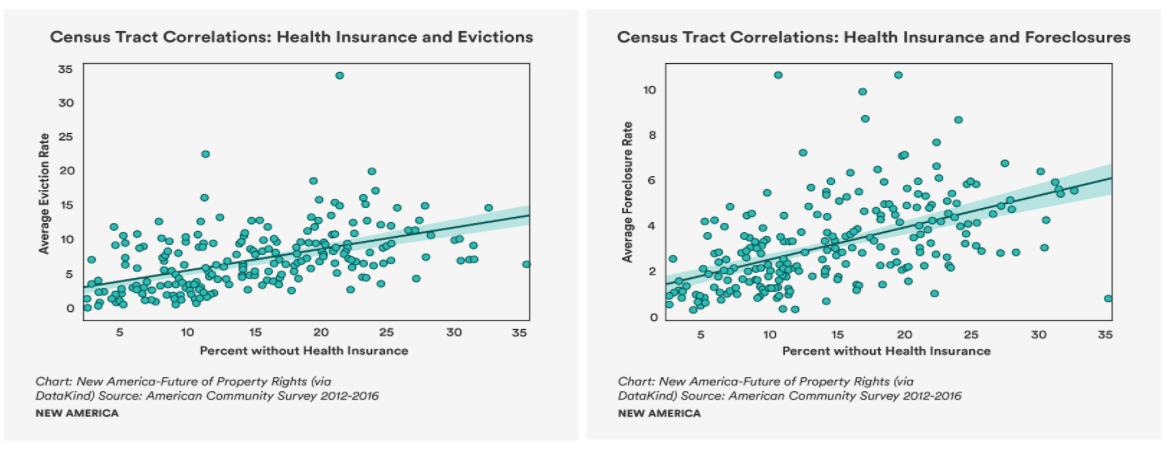
Census tracts with predominantly non-white residents, and in particular Latinx residents, had higher rates of housing loss than predominantly white census tracts. Interestingly, Latinx households were more strongly associated with eviction than Black households, whereas Black households were more strongly associated with foreclosure than Latinx households.
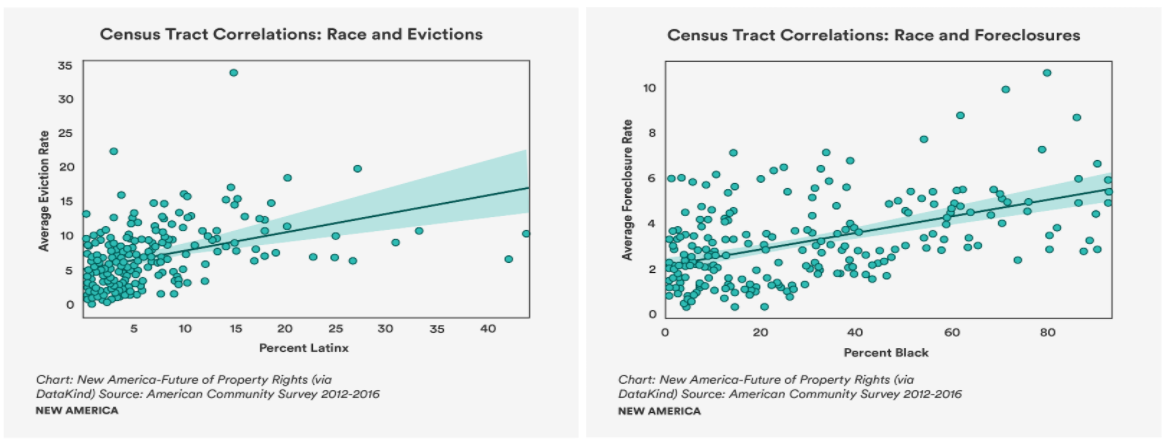
Unsurprisingly, we found that census tracts with a higher proportion of rent burdened households experienced higher levels of evictions and foreclosures. We also found that census tracts with lower property values and lower monthly housing costs had higher rates of both evictions and foreclosures: This finding suggests that even lower-priced housing may be out of reach for low-wage workers.
Notably, census tracts with larger numbers of vacant properties have higher rates of home loss, in particular evictions. In other words, evictions are happening at a greater rate in blighted or run-down neighborhoods. We did not find this strength correlation in our other deep dive cities, indicating that blighted properties are a larger issue in Indianapolis than elsewhere.
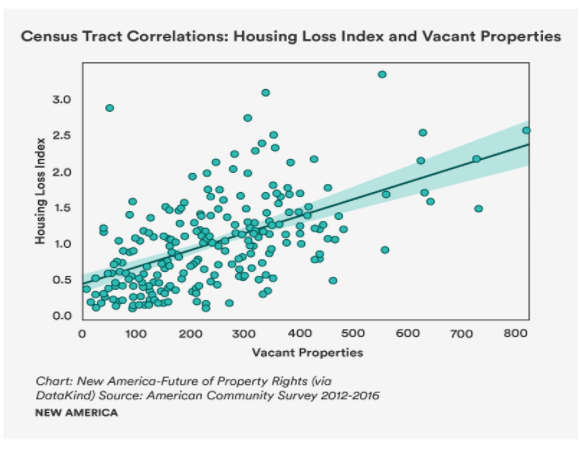
Tracts with higher shares of older adults living alone had a negative association with housing loss, suggesting that older adults are less likely to lose their homes. This finding is surprising, as senior citizens often rely on fixed incomes, leaving them at risk for any increase in housing costs. Many older adults are also burdened by the costs of medical care, ostensibly creating difficulty in making housing payments.
Why Are People Losing Their Homes?
“People are working multiple jobs to be able to afford basic housing” – Housing Nonprofit Director4
While interviewees mentioned several underlying reasons for housing vulnerability, the three factors most frequently discussed were low wages, the lack of affordable—or even available—housing stock, and the “habitability trap,” or the toxic combination of landlord-friendly laws, widespread habitability issues, and the common practice of tenants withholding rent to force or pay for repairs.
Low Wages: The transition from middle class manufacturing jobs towards low-wage work in sectors like hospitality, food service, and retail has resulted in high rates of poverty for many residents in Marion County. The National Low-Income Housing Coalition observes that a household in Marion County must earn at least $12.87 per hour in order to afford a one-bedroom apartment, and $16.03 an hour in order to afford a two-bedroom apartment. However, just over a quarter of all residents earn $17 or less per hour, and seventeen percent of all households in Marion County earn an income below the poverty threshold. The situation becomes more complex, however, when taking race into consideration. Only 13 percent of white residents earn poverty wages, while 20 percent of Blacks and 34 percent of Latinx do. Median income for white households is over $53,000, while Blacks earn $32,000 and Latinx earn $33,000 per year. This disparity in incomes has real consequences for affording housing in Marion County.
With a median income of $46,000, the average white worker in Marion County can afford to pay just over $1,000 per month for housing. Those who pay more than 30 percent of their income are considered cost burdened. Due to racial disparities in income, a Black household earning their median income of $32,000 can only afford an apartment that costs $800 per month, well below the fair market rent (FMR) of over $900 for a two-bedroom apartment.
While housing costs have been rising, wages have remained stagnant. Indiana University found that wages increased only 5.3 percent between 2012 and 2017, while housing costs for renters increased 11.3 percent during the same period.
Affordability and Availability: According to the National Low Income Housing Coalition, Indiana has 38 affordable units for rent per 100 extremely low-income renter households across the state. As a result, almost half of all renter households in Marion County spend more than 30 percent of their incomes on rent and so are considered rent-burdened. A further 26 percent are extremely housing cost burdened, paying more than half of their incomes towards housing.
Due to severe underfunding, more than 100,000 Marion County residents whose incomes qualify them for either public housing or housing choice vouchers are not being served. In 2018, the Indianapolis Housing Agency provided 9,389 households with assistance, via 688 public housing units and 8,701 housing choice vouchers. However, if half the county’s 169,000 renter households are housing cost burdened, and there are only 9,389 housing vouchers, that means more than 75,000 renter households are being neglected.
This acute shortage in affordable rental stock leaves Indianapolis’s many low-income tenants with scarce options. Landlords can easily take advantage of desperate renters as a result, charging inflated prices for substandard units, and sometimes renting without a lease, paving the way for quicker evictions.
Minority Homeownership in Indianapolis
The overall homeownership rate in Indianapolis is 54 percent. Among white households, 64 percent are homeowners. For Black residents, however, that rate falls to 34 percent. Mechanisms driving this disparity include low credit scores among Black residents, rising home values in Black neighborhoods, housing discrimination, and a lack of intergenerational property ownership.
In the recent Community Credits Needs Assessment, the Indiana University Public Policy Institute (PPI) found significant disparities in home purchasing power for Black and Latinx residents when compared to their white counterparts. PPI also found that Black residents in majority Black neighborhoods face the most barriers to homeownership, as they are least likely to apply for home mortgage loans, and most likely to be denied following an application.
Ten percent of Black and 13 percent of Latinx potential homebuyers were rejected for loans in majority-non white neighborhoods, white buyers were rejected only 8 percent of the time. In majority-Black neighborhoods, however, the proportion of rejected loan applications by Black buyers rose to 14 percent, showing ongoing disparities—and perhaps discrimiation—in lending practices based on neighborhood.
In a settled case against the First Merchants Bank, allegations of lending discrimination based on race led to a settlement in which the bank, in partnership with the Fair Housing Center of Central Indiana, will work to expand lending opportunities in majority-Black neighborhoods.
Overall, the widespread lack of property ownership leaves Black and Latinx residents more vulnerable to variability and inequality within the Indianapolis rental market.
The Habitability Trap: In Indiana, landlords are required to maintain fit and habitable housing, however, this requirement is not well enforced in Marion County. In the report Indiana’s Eviction Problem, an attorney with Neighborhood Christian Legal Clinic explains that the Marion County Public Health Department is only authorized to investigate habitability complaints if the complaining tenant is still living in the unit. As a result, landlords are incentivized to evict tenants who complain in order to avoid inspections and fines.
Indianapolis news media have covered the city’s rampant habitability issues in rental homes over recent years, drawing attention to the prevalence of the problem, especially in poor neighborhoods with many single-family homes and duplexes for rent.
According to local practitioners, habitability issues are concentrated in low-income areas, where housing stock is old and home values are low. Landlords who own multiple properties often charge rents similar to what renters pay in middle- and upper-income neighborhoods. Landlords in these low-income areas may be inclined to “milk” their properties by deferring maintenance in order to maximize short-term returns. This impacts renters who are then obligated to pay rent for apartments that are not suitable for habitation.
Tenants may think that landlords who do not repair maintenance issues have violated their responsibilities in the lease agreement, but in fact Indiana tenants must pay rent regardless of housing conditions. Tenants who withhold rent payments due to habitability issues are therefore at risk for eviction.
To provide some support to tenants who report habitability issues, the Mayor of Indianapolis proposed an ordinance early in 2020 instituting fines on landlords who retaliate against tenants who report issues to the Public Health Department. The city-county council passed the proposal, giving Marion County renters a small amount of protection against negligent landlords. However, the state legislature attempted to overrule the new ordinance by passing a bill that would have micromanaged the tenant-landlord relationship at the state level. Due to the COVID-19 pandemic, the governor of Indiana vetoed the bill, but housing rights advocates are concerned this bill will be reintroduced after the pandemic is over. This concern is reinforced by a long history of the state legislature passing several “bad bills” that prohibit local governments from passing policies that would protect renters.
Out-of-Town Investors and Marion County
“I’ve got buyers from California, New York. They’re all swarming to Indiana because you can get a deal. You can buy a neighborhood.” – Indianapolis Realtor5
Low property ownership rates and cheap and substandard housing stock in poor, marginalized neighborhoods have provided opportunities for outside investors to enter into the Indianapolis rental market, particularly after the subprime mortgage crisis of the mid-2000s.
Between the 2008 financial crisis and 2015 there were more than 19,000 properties in Indianapolis sold at the county’s tax sale auction, raising over $152 million in revenue. Of these homes, over 2,800 were sold twice, and one in five were abandoned by 2015.
The Indianapolis Star reported that the tax liens tied to abandoned or foreclosed properties were often purchased by large, out-of-state investors—from at least 31 states. One San Diego, California based company, Mt. Helix, acquired hundreds of homes through the county tax sale program.
Many of these investors who purchased tax liens were not focused on owning property, but sought the increased interest they hoped to accrue from the original property owners. As a result, they often left their properties to fall into disrepair.
What Happens After People Lose Their Homes?
“[The kids are] having heavy behavioral issues, heavy attendance issues… and so much of it is due to the fact that mom is always trying to secure money for rent” – Elementary School Social Worker6
The effects of housing loss are not isolated. The staggering impacts of displacement and housing instability on a community—not just the individuals and households directly displaced—include health and stress impacts, education, homelessness, and neighborhood neglect.
Health and Stress, or “Crisis Mode”: Crisis mode is both a cause and an impact of housing vulnerability and loss. According to a local shelter manager, housing is simply the “top of a pyramid” regarding household costs; others include transportation, food, healthcare, and childcare. These expenses are usually interconnected, and a disruption in transportation, for example, can impact the income earning capacity for a family. This interruption is a catalyst for a seemingly endless struggle to afford necessities.
The potential for variable earnings, and the reality of little savings leads to vulnerability for housing loss. One shelter manager remarked that for struggling families it was “hard to build back up because you’re constantly fighting that push down.” Housing loss in particular seems to catalyze a downward spiral. As long as families maintain housing, it may be possible to maintain a certain level of stability. Displacement, however, can mean switching school districts, leaving behind social networks, moving further away from work, or relocating to an area of town without access to public transportation.
The process of finding new housing can be especially difficult and time-consuming for low-income renters. Anyone with poor credit, a criminal record, or an eviction filing on record will struggle significantly with a housing search, and likely be forced to settle for substandard housing. One mother of four young children recalled spending well over 150 hours looking for new housing after being evicted twice in a four-month period. Many larger families also find their options limited, as many units have only one or two bedrooms. Overcrowding is often the result.
For those who rely on housing choice vouchers, the search for new housing may be even more complicated. The Indiana State Legislature has banned local governments from passing laws that would prohibit source of income discrimination laws, meaning landlords can refuse to rent to someone if they are housing voucher recipients. For voucher holders, this results in limited housing options, and when housing is available it is often in resource-poor neighborhoods. In a 2014 audit, the Fair Housing Center of Central Indiana found landlords refusal to rent to voucher holders to be pervasive, with 82 percent of landlords participating in this form of discrimination.
Children and Education: During the 2017–2018 school year, over 75,000 students in Central Indiana transferred schools. A majority of these transfers were from charter schools throughout the region, however, Indianapolis public schools have a transfer rate of over 30 percent. This indicates that many students in the city have their education disrupted each year. Children who receive free or reduced lunch account for two-thirds of the transfers, showing how income-status is linked to school stability.
Not only does housing insecurity impact school stability, but the complex consequences of housing loss contribute to disparities in school funding as well. While local property taxes in Indiana account for school funding to a lesser extent than other states, areas with high housing instability, vacancies, and blight still contribute less funding for neighborhood schools as a result of lower property values.
This has racial and spatial consequences in funding within Marion County. Three quarters percent of Indianapolis Public School (IPS) students are non-white, while only 27 percent of neighboring Beech Grove School District students are non-white. A 2019 report on education funding found that there was a $3,000 per student difference in funding between IPS and neighboring district Beech Grove City, with IPS students suffering as a result.
In Marion County there is no good data showing how many school transfers are due to housing loss, however based on key informant interviews, the relationship between evictions and school transfers appears significant. According to a local shelter case manager, evicted families are often forced to find housing in parts of the city that belong to a new school district, particularly the underfunded IPS. The significant implications of housing loss on educational achievement warrant further research.
Homelessness: Housing instability may result in homelessness if households are unable to quickly find new housing. In 2019, two-thirds of those experiencing homelessness in Marion County were housed in emergency shelters, 26 percent in transitional housing, and 7 percent were unhoused. A quarter of those without permanent housing are families—living in motels, with family members for a period of time, in shelters, or on the street.
The racial disparities of those experiencing homelessness are again clear in the county. While Black residents make up only 30 percent of the population, they account for over 60 percent of those experiencing homelessness.
As in other places, homelessness in Marion County can be chronic and intergenerational, with a single instance of housing loss spiraling into a lifelong struggle passed down from parents to their children. A case manager at a local homeless shelter recalled providing intake for a woman who came to the shelter with her children. The woman had remarked that she herself had been in that same shelter when she was a child. She had struggled with housing insecurity as a child, and her children were now experiencing it too.
Neighborhood Neglect: Indianapolis alone has over 6,800 abandoned properties. Often unkempt, these eyesores continue to harm disenfranchised communities by devaluing their land, decreasing the tax base, and increasing crime, as found in a 2017 report by Community Blight Solutions. The Indianapolis Star found that non-resident property investors own around 40 percent of all abandoned homes in the city, preventing community organizations from rehabilitating them. The Fair Housing Center of Central Indiana has three ongoing legal challenges against Fannie Mae, Bank of America, and Deutsche Bank alleging they market and maintain properties differently in majority Black neighborhoods than majority white neighborhoods.
We found that neighborhoods with large amounts of vacant properties also experience higher rates of evictions and foreclosures.
Foreclosures contribute to this rise in investment property ownership in Marion County, as the county’s tax sale program allows for investors to purchase some homes for as little at $500. Foreclosed properties can be lucrative for investors who purchase them cheaply, put relatively little money into them, and turn them into either rental units or predatory rent-to-own contracts. Many of these homes then suffer from continued disinvestment and thousands of code violations. The Indianapolis Star found that one particular San Diego-based real estate company, which owns over 600 properties in Indianapolis, has three times as many code violations as any other property owner.
A local housing advocate expressed concern that investors who purchase multiple properties through the county tax sale program lack interest in the overall condition of the neighborhoods in which they are purchasing properties. This drives underinvestment in developing amenities or providing quality housing in these areas.
Policy Recommendations
Marion County’s housing problems, sustained through previous generations, will continue into the future unless city and state leaders act. Protecting renters, especially those who are financially vulnerable, can help prevent a housing loss-driven downward spiral, and contribute to the economic stability and growth of the city.
City of Indianapolis leaders in both public and private sectors are striving toward inclusive economic growth. However, issues stemming from property investors profit driven actions that harm the health of the communities in which they own property. This contributes to low-income residents financially struggling, and hinders city efforts to create more equitable growth and opportunity among all residents and neighborhoods throughout the city.
Certain policy solutions were voiced across all three of our case study locations; we included these commonly proposed solutions in our policy recommendations section, as we believe them to be broadly applicable across the country. These recommendations include but are not limited to: improving housing loss data; expanding the social safety net and increasing wages; expanding affordable housing options through voucher programs, trust funds, and tax credit programs; and increasing parity between landlords and tenants, for example by improving tenants legal rights. In addition, below are three policy recommendations that were unique to our Marion County case study.
Incentivize Property Maintenance: The City of Indianapolis should consider partnering with the Department of Business and Neighborhood Services (BNS) and Marion County Public Health Department to ensure all landlords are registered with the city’s Landlord Registration Program. The city currently requires landlords to register, however the registry remains incomplete. With over 160,000 renter households in the city, maintaining an updated landlord registry is essential to ensuring proper maintenance of units. Landlords that have repeated code violations should have their certificate of occupancy revoked until issues are resolved.
Establish Property Ownership Tracking Programs: Creating government programs that track who is purchasing property within Marion County would help decision makers better understand trends in low-income and gentrifying areas, where there is risk for exploitation. These policies should require buyers to declare at point of purchase if the property will be owner-occupied or rented, which may help to ensure landlords are registered.
Amend the Marion County Tax Sale Program: Marion County should immediately amend their ongoing tax sale program. The county should consider policies that would prioritize the sale of these homes to nonprofit organizations working to build more affordable housing and to rehabilitate neighborhoods. The county should also prohibit the sale of properties through this program to landlords who do not have an established history of renovating and providing quality housing, and should consider restricting sales to out-of-town purchasers.
Conclusion
We began this research in 2019 to examine housing loss across the United States, and at a localized scale in Marion County. We could have never predicted that we would release our report in the midst of an unprecedented crisis, with tens of millions of Americans at risk for eviction and foreclosure as a result of the economic fallout of a global pandemic.
We have seen firsthand in the last few months how policy measures can help keep people in their homes. These policies, including nationwide moratorium on evictions, foreclosures, and utility shut-offs, deferments on mortgages, rapid expansion of federal housing voucher programs, and direct rent relief through local public housing authorities have helped to prevent a wave of housing loss that we believe is coming as programs begin to expire.
However, these policies must be targeted to communities most in need, and so we need to know who those communities are, and where they live. While the economic shocks resulting from COVID-19 are unique, we do believe that past housing loss provides an indication of future housing loss, even in these unprecedented times. As such, we hope this granular examination of where exactly evictions and foreclosures are most acute, and which communities are traditionally most impacted, will help municipal leaders and advocates direct outreach and resources in this time of crisis.
The COVID-19 pandemic may have elevated the urgency of eviction and foreclosure, but housing loss is a scourge even in times of relative calm. We must develop long-term policies to combat this systemic ill.
We also acknowledge that, in Marion County, the work is not done. More research is needed to better understand the relationship between out of state property owners and housing loss, assess the impacts of gentrification, and develop pathways for tenants to assert basic habitability rights without being evicted.
Citations
- From an interview with the authors.
- Unigov is short for “unified government.”
- In order to generate an indicator of housing loss based on the total number of evictions and mortgage foreclosures, we created two new variables: housing loss rate and housing loss index. The housing loss rate reports the total number of evictions and mortgage foreclosures as a proportion of the total number of renters and homeowners with a mortgage in a given geography (here, Census tract). The housing loss index reports the housing loss rate by Census tract as a proportion of the mean (average) housing loss rate across the entire county. As a benchmark for interpretation, a housing loss index of 1 indicates that the Census tract under consideration has a housing loss rate equal to that of the county average, while an index of 3 indicates that the Census tract has a housing loss rate that is three times the county average.
- From an interview with the authors.
- From an interview with the authors.
- From an interview with the authors.
Policy Recommendations
Laws, policies, and even attitudes related to housing differ across states, counties, and municipalities. Every community is shaped by its own history, geography, economy, and demography, and as a result certain policy reforms appropriate for Phoenix might not work in Winston-Salem. Based on our research, however, we believe that certain policy recommendations are applicable to myriad communities across the United States. The recommendations are grouped into four broad categories: 1) Improve Housing Loss Data; 2) Prevent Housing Loss; 3) Expand Affordable Housing Options; and 4) Broaden Tenants’ Rights.1
Improving Housing Loss Data
A lack of standardized data was a limiting factor in our ability to study and track housing loss. Without standardized data it is impossible to understand the full scope of the crisis, and craft policy responses to successfully respond.
Establish National Database on Evictions: There is no national system in place to track evictions. And while critical work by groups like Eviction Lab have helped to bring to light the crisis that plagues our cities, even their databases remain incomplete. The Eviction Crisis Act of 2019, introduced by Sen. Michael Bennet (D-Colo.), would have created a comprehensive national eviction database, allowing the government to better track and respond to the eviction crisis. Congress should pass the Eviction Crisis Act, or work with HUD to develop a publicly available national eviction database.
Improve Foreclosure Tracking Databases: The federal government should improve available data on foreclosures in two ways. First: While there is a national default and foreclosure database, it contains limited public information. While this database has existed since 2010, it's clear that HUD has not populated it to the extent that it would be useful for analysis. This forces researchers to turn to private data companies like ATTOM to source foreclosure data at scale.
Second: Congress should establish a database that tracks tax foreclosures. Currently different municipalities across the country collect data differently, if at all, limiting the possibility for wide scale research on the occurrence of tax foreclosures.
Develop Strategies to Monitor Informal Housing Loss: Throughout our research we heard stories of families losing their homes through partition sales of heirs property, informal evictions, and redevelopment of colonias along the U.S-Mexico Border. These forms of housing loss often impact the most vulnerable in our communities, and yet these displacements are almost never tracked. We must dedicate resources to mapping this informal loss and developing strategies to support those at risk.
Prevention of Housing Loss
Various experts we engaged indicated the need for a fundamental shift from responding to housing loss, to preventing it. Much of the available housing funding is allocated toward addressing needs that arise after displacement occurs, when it would be more efficient and effective to develop policies that prevent displacement from occurring in the first place.
Raise Wages: Across more than 60 key informant interviews, the most frequently cited reason for housing loss was an inability to make housing payments due to low wages. Our lowest-paid American workers, often earning only the federal minimum wage rate of $7.25 per hour, are confronting dual oppressive forces: stagnant wages and a mismatch between available work and the local laborshed.
First: The U.S. government must raise the minimum wage. U.S. wages have remained relatively stagnant since the 1970s. Many states do not set a minimum wage higher than the federal rate of $7.25 per hour. Some of these states even prohibit cities and counties from establishing their own wages to be more consistent with local costs of living. 1.6 million in the United States earn exactly or less than the federal minimum wage, putting them at risk for housing instability.
Next: We must make more workers competitive for well-paying jobs. Across the United States, jobs that require postsecondary education and credentials are growing more rapidly than jobs that require only a high school diploma. The share of available service work (e.g., hospitality and retail) is contracting and certain roles in industries that once guaranteed a middle class lifestyle without requiring a college degree (e.g., manufacturing) are going away. In fact, as of January 2020 70 percent of the workforce held jobs that required—or paid a premium to those who held—a postsecondary degree, but only half of working age Americans had one. Unable to qualify for high-paying jobs, these workers are left unable to afford basic necessities including housing.
Expand Socioeconomic Benefits: Housing is not the only major expense that families must pay; others include healthcare, childcare, transportation, and groceries. The costlier each slice of the household expenditure pie, the less there is left over for other expenses. These costs, when paired with high housing costs, impede a household’s ability to pay rent or keep up with mortgage payments. Providing both healthcare and childcare at affordable rates would help to ensure families don't have to choose between paying for housing and paying for medical treatment or safe care for their children.
For example, over 13 percent of Americans lack health insurance, and the number has been rising since 2018. Lack of insurance leads to significant unplanned expenditures in case of illness, rendering families unable to make rent and mortgage payments. Indeed, in each of our three deep dive locations we found that as the percentage of households without health insurance increases, so does the rate of evictions, foreclosures, and overall housing loss.
Childcare is another major expense, and for too many a large financial burden. According to the Department of Health and Human Services, childcare expenses for two children at a center costs more than average mortgage and rent payments in 35 states and the District of Columbia. Childcare is considered affordable if families spend only 7 percent of their income on expenses, however, no state in the country has an average childcare cost below 11 percent of annual income. The New America Care Report found that an individual earning minimum wage would need to spend two-thirds of their earnings to cover full time in-center care for just one child.
Establish Permanent Foreclosure Prevention Programs: In the years since the 2008 financial crisis federal programs targeted at struggling homeowners have expired, despite continuing housing loss throughout the country. The National Foreclosure Mitigation Counseling (NFCM) Program established in 2007 to support families on the verge of foreclosure understand their rights and the process. However, after supporting over 2 million households during the height of the Great Recession, the program ended in 2015. Similarly, 18 states and the District of Columbia received allocations from the Treasury Department’s Hardest Hit Fund, established in 2010 to help homeowners make mortgage payments and mitigate underwater mortgages. Originally funded with over $7 billion, the program received $2 billion in additional funding in 2016, however, states only have by the end of 2020 to utilize the funds before the program expires.
Congress should consider allocating more permanent funding for programs that prevent housing loss through foreclosure. This could be done through Community Development Block Grants or direct funding to housing authorities. In June, amidst the economic fallout from the Coronavirus Pandemic, HUD allocated $40 million of CARES Act funding to foreclosure prevention counseling programs across the country, showing the acute need for continued funding.
Develop Tools to Target Assistance: Applying for and receiving housing assistance is complicated and onerous. Public housing authorities should use enrollment information from other government benefit programs to strategically target housing interventions to those in most need. This could be done using lists of residents who are enrolled in programs such as SNAP (Supplemental Nutrition Assistance Program), TANF (Temporary Assistance for Needy Families), free and reduced school lunch, and WIC (Special Supplemental Nutrition Program for Women, Infants, and Children).
Reconsider State Preemption of Local Housing Solutions: Local governments have an array of tools they can use to drive more affordable housing development, maintain housing affordability, or raise wages for low-income workers. However, a number of states across the country have passed laws that limit or prohibit tools such as inclusionary zoning, minimum wage laws, or even the right to regulate short-term vacation rentals like Airbnb. These laws should be reconsidered in order to remove local limitations on policy responses to housing loss.
Expand Affordable Housing Options
While it is clear that simply building more affordable housing will not solve the complex realities of housing insecurity, expanding the stock of housing available to low- and very-low-income households is a critical component of a broader solution.
Expand the Low-Income Housing Tax Credit Program: There is a real need to reconsider how affordable housing is financed across the United States. Current reliance on the Low-Income Housing Tax Credit (LIHTC) is not producing nearly enough units to address the multi-million unit deficit of affordable housing. And still, most LIHTC buildings are unaffordable to families that earn very low or no income. HUD should adjust rates to ensure all low-income families can qualify to live in LIHTC buildings. One way to expand access for very low-income households, would be to better coordinate project-based housing vouchers and tax credit projects to help families make up the difference in rent payments.
Further, as a result of community pushback and NIMBYism, many LIHTC projects are built in areas already struggling with high rates of poverty. State or local policy reformation that would allow LIHTC projects to be built “by-right,” or without a full vote needed by city councils or planning commissions, would greatly improve the ability of developers to build affordable housing in high opportunity areas.
Adequately Appropriate Funding to Housing Trust Funds: Housing trust funds (HTF) at every level of government would support the development of affordable housing. The National Housing Trust Fund, established in 2008, saw its first state allocations in 2016 totaling over $170 million dollars. In 2018 over $260 million dollars was dispersed to states, but the National Low Income Housing Coalition says more resources are needed to keep up with demand. In 2018, over 1,800 organizations wrote to congress asking them to appropriate $3.5 billion annually to the trust fund, which is disbursed to states as a block grant. This funding type allows for flexibility in usage, providing states a tool they can tailor to their specific needs. Congress must appropriate more funding to the National Housing Trust Fund to support the development, stabilization, and preservation of housing across the country.
City and county governments can also work to expand or establish housing trust funds. Funding could be sourced from a small sales tax, filing or application fees, or through specific developer fees attached to market rate construction. In 2016, county trust funds across the country raised over $100 million for affordable housing projects through various revenue sources including developer impact fees, document recording fees, and real estate excise taxes.
Expand Housing Voucher Programs: Across the country 20 million households are eligible for vouchers based on their income, and yet, over 70 percent do not receive housing vouchers as a result of limited funding. Some households who are eligible for vouchers wait years to receive them, perpetuating the rent burden for millions of families on the waiting list.
Every family eligible for housing vouchers should receive them, and congress must appropriate new incremental vouchers for disbursement through HUD to local public housing agencies. These could be in the form of general housing choice vouchers, or be targeted at specific population groups including homeless families (CoC), seniors, or veterans (VASH). Studies show that one-third of households who receive vouchers will be lifted out of poverty, freeing up cash for other expenses including childcare and food, and allow families to afford housing in higher opportunity areas.
Expand the use of Inclusionary Zoning: Almost 900 jurisdictions in 25 states utilize inclusionary housing policies to drive the development of affordable housing. Across the United States inclusionary housing policies have created 50,000 new homeownership units, over 120,000 units of affordable rental housing, and over 2,000 affordable single-family homes.
Some states like Arizona prohibit local authorities from enacting inclusionary zoning to bolster the development of affordable housing. States with preemption laws should allow local jurisdictions to establish inclusionary zoning programs if they wish. This would help cities and counties to better incentivize the development of affordable units for lower-income residents using methods tailored to their unique circumstances.
Ban Income Source Discrimination: Fifteen states and over 90 cities and counties across the country have laws banning source of income discrimination in housing rentals. Landlords who refuse applications from Housing Choice Voucher program participants, or refuse to receive social security or veterans’ benefits, are discriminating against tenants on the basis of source of income. Banning this type of discrimination is essential to fully realizing the potential of federal housing benifits.
The success of policies that prohibit discrimination is clear. In areas where there are no income source discrimination laws, landlords reject 77 percent of tenants who rely on vouchers. This percentage falls to 35 percent, however, in areas where there are protections for voucher holders.
Support Innovative and Equitable Revitalization: As cities struggle with a shortage of affordable living options, the tendency of developers to target low-income neighborhoods for redevelopment is pernicious. Cities must think about ways to preserve neighborhoods and prevent the displacement of long-time residents as a result of gentrification.
One method for neighborhood stabilization and preservation of affordability is the use of community land trusts (CLTs). Land trusts work to prevent property from being sold to developers by giving owners the option to sell to the trust. This allows the trust to maintain the availability of affordable housing options in the neighborhood.
Advocate for Changing HUD Definition of Homelessness: 2012 changes to HUD’s definition of homelessness have limited the support available to those who are unstably housed. Families who live in overcrowded or precarious housing are not considered homeless and so barred from receiving homeless support and funding for rehousing. Additionally, service organizations and local governments cannot count these families as homeless in funding allocation requests. As a result, those experiencing housing instability, but who do not meet the narrow HUD criteria, are barred from accessing much needed housing services and support. A broad definition of homelessness would better capture the diverse experiences of those facing housing instability. This could expand the reach of homeless service programs to families currently excluded and create a more robust continuum of care.
Tenants’ Rights
A vast information and power asymmetry exists between landlords and tenants. Whereas homeowners are protected by multiple legal and financial instruments stemming from the 2008 financial crisis, tenants are—as one expert told us—at the mercy of their landlord. The following policy recommendations aim to shrink the gulf between landlords and tenants, and increase tenants’ bargaining power.
Guarantee Tenants a Right to Counsel: Some cities, including New York City, Los Angeles, Philadelphia, and Cleveland, have experimented with programs to guarantee legal representation to tenants facing eviction. In New York City, before their right to counsel program was established, just 1 percent of tenants had legal representation in eviction court. After program implementation, in the zip codes where the program was active, over half of tenants all were represented, and over 80 percent were able to remain in their homes. The program has also contributed to an 11 percent reduction in eviction filings versus other areas of the city that are not yet participating in the program. The success of this program is clear, and should be expanded nationwide.
Expand Representation for Undocumented Households: We must create legal aid programs for undocumented or mix-status households. Many federally funded legal-aid programs are unable to serve those without legal residency, excluding households who need legal representation the most. Landlords may exploit a household’s immigration status in order to provide substandard housing or proceed with informal evictions. These households often have few options for recourse, and with legal-aid programs unable to help them, they are vulnerable to repeated abuses.
Increase Bilingual Accommodations in Court: The lack of bilingual information within the court system places an unfair burden on the millions of households who dont speak or read English. Legal jargon is difficult to understand for even those well versed in the English language. Courts around the country should provide increased accommodations in legal proceedings for those who are not English proficient.
Ensure Right to Withhold Laws: A majority of states allow tenants to place money in escrow or with the court system if a rental unit becomes substandard in quality. However, some states like Indiana and Arkansas have no laws in place to protect tenants from landlords who refuse to maintain their property. The ability to withhold rent, or even “repair and deduct,” is an effective method to empower tenants vis-a-vis negligent or malicious landlords.
Just Cause Eviction Laws: In many cities and states, landlords are not required to provide a reason for the eviction of tenants approaching the end of their lease term or who may not have a formal lease agreement. These evictions are typically categorized as “no cause” evictions. “Just cause” eviction policies can prevent displacement through evictions by stipulating that there are only certain grounds upon which a landlord may pursue an eviction (e.g. nonpayment of rent, noncompliance with the terms of a lease).
Support Tenant Education: In many localities, tenants facing a formal or informal eviction notice are not aware of their rights or resources available to them. In some cases, local tenants’ rights organizations advocate for widespread education about rights and resources. Local policymakers should facilitate connections between these organizations and tenants, as these networks can help to build stronger systems of social safety nets and expand the continuum of care.
Citations
- We note that these recommendations are not always housing-specific fixes. That is because housing instability and loss sits deep within an interconnected social web, and often solutions to bolster other components of the social safety net may have the impact of improving housing stability.
Conclusion
"Dear landlord
Please don't put a price on my soul
My burden is heavy
My dreams are beyond control" – Bob Dylan
Overwhelmingly, our findings came down to this simple fact: People cannot afford decent homes.
The disparity between income and housing cost growth over the past 50 years, compounded by more than a century’s worth of race-based housing discrimination have created a housing insecurity for both homeowners and renters across the United States. The country sees stark disparities in homeownership rates between white and non-white households, and in turn a staggering racial wealth gap: In 2019, the average Black family had 12 times less wealth than the average white family. In a country in which property ownership is tied to intergenerational wealth building, limited homeownership among Black and Latinx Americans has kept millions stuck at the bottom of the economic mobility ladder, while many of their white peers had helping hands pulling them up.
Among the third of the country who rent their homes, a substantial number are forced to make trade-offs between life’s necessities such as food, shelter, and heat.
We also know that racial and economic disparities only deepen in times of crisis, and never has the nation faced an economic crisis quite like the one driven by the COVID-19 pandemic. As the national unemployment rate languishes above 10 percent, we know tens of millions can’t pay for their homes. Not only that: As the number of U.S. COVID-19 infections tops 6 million, we know hundreds of thousands of low-wage workers—those who couldn’t afford housing in the first place—have neither the employment benefits nor the income to remain solvent if they fall ill.
A cashier, retail worker or health aid stands to lose between $200 and $500 from a single week off for being sick. Consider the two-week quarantine requirement in case of exposure to COVID-19. Then consider that only 30 percent of the lowest earners have paid sick leave, and only 58 percent of all workers in service occupations have sick leave, period. For most Americans, health insurance is tied to employment, and laid off workers could face overwhelming health care bills in the case that they fall ill. Here, we see quickly how the COVID-19 crisis may exacerbate housing loss through variable income earnings, even for those who manage to keep their jobs.
These considerations lead us to the million dollar question: Can we pair data on historic housing vulnerability with data on current income loss and other pandemic-specific considerations, to identify and predict where housing loss will be the most acute during and after this crisis?
This, we believe, is the next frontier of studying the housing loss impacts of the pandemic. Pairing data on previous housing loss with current economic trends and data may enable decision makers to better understand the relative importance of systemic and historical factors, as opposed to one-time, uncharacteristic shocks, in triggering displacement. Policies could then be crafted to target and deliver resources to improve community resilience to all shocks—be they anomalous events, like a pandemic, or everyday stressors, like a flat tire.
While we hope this research provides a starting point for this sort of analysis, we also hope the questions don’t stop coming after the initial economic shock of the COVID-19 crisis subsides.
If nothing else, our study reveals the magnitude of housing instability across America, irrespective of the pandemic. And so, while our most immediate solutions should orient around stopping the bleeding caused by the current economic crisis, they should not end there.
Stable, decent housing is a fundamental human right that our country fails to provide to millions of its residents each year. This is an injustice that must be solved.
More About the Authors

Tim Robustelli
Senior Policy Analyst, Future of Land and Housing

Yuliya Panfil
Senior Fellow and Director, Future of Land and Housing

Emily Yelverton

Chenab Navalkha


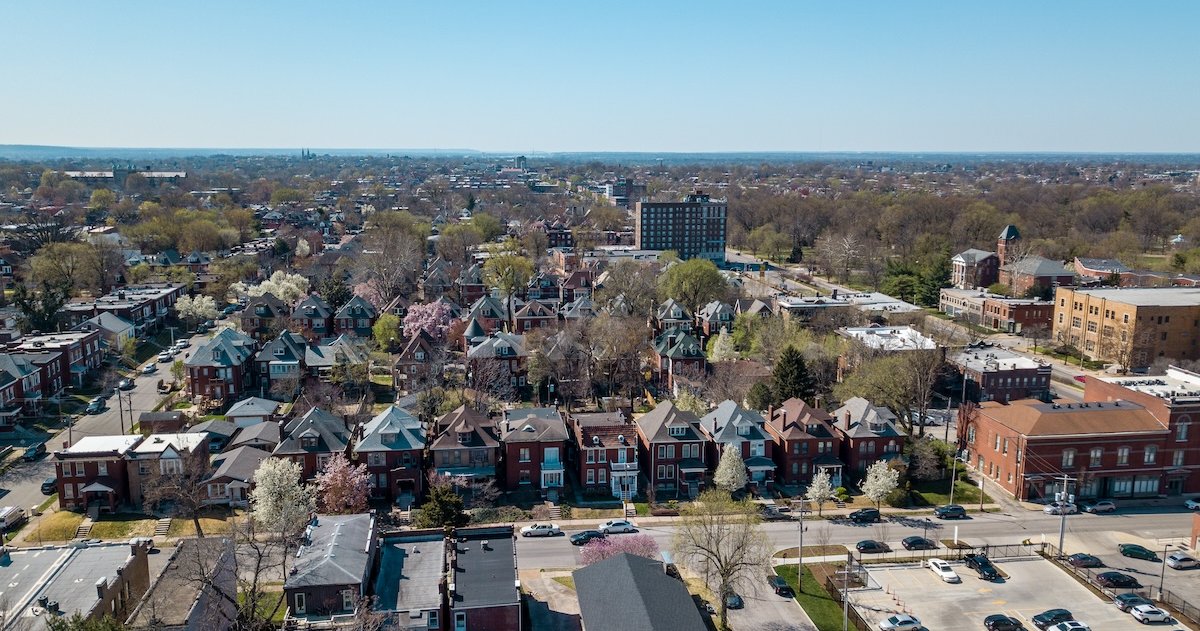

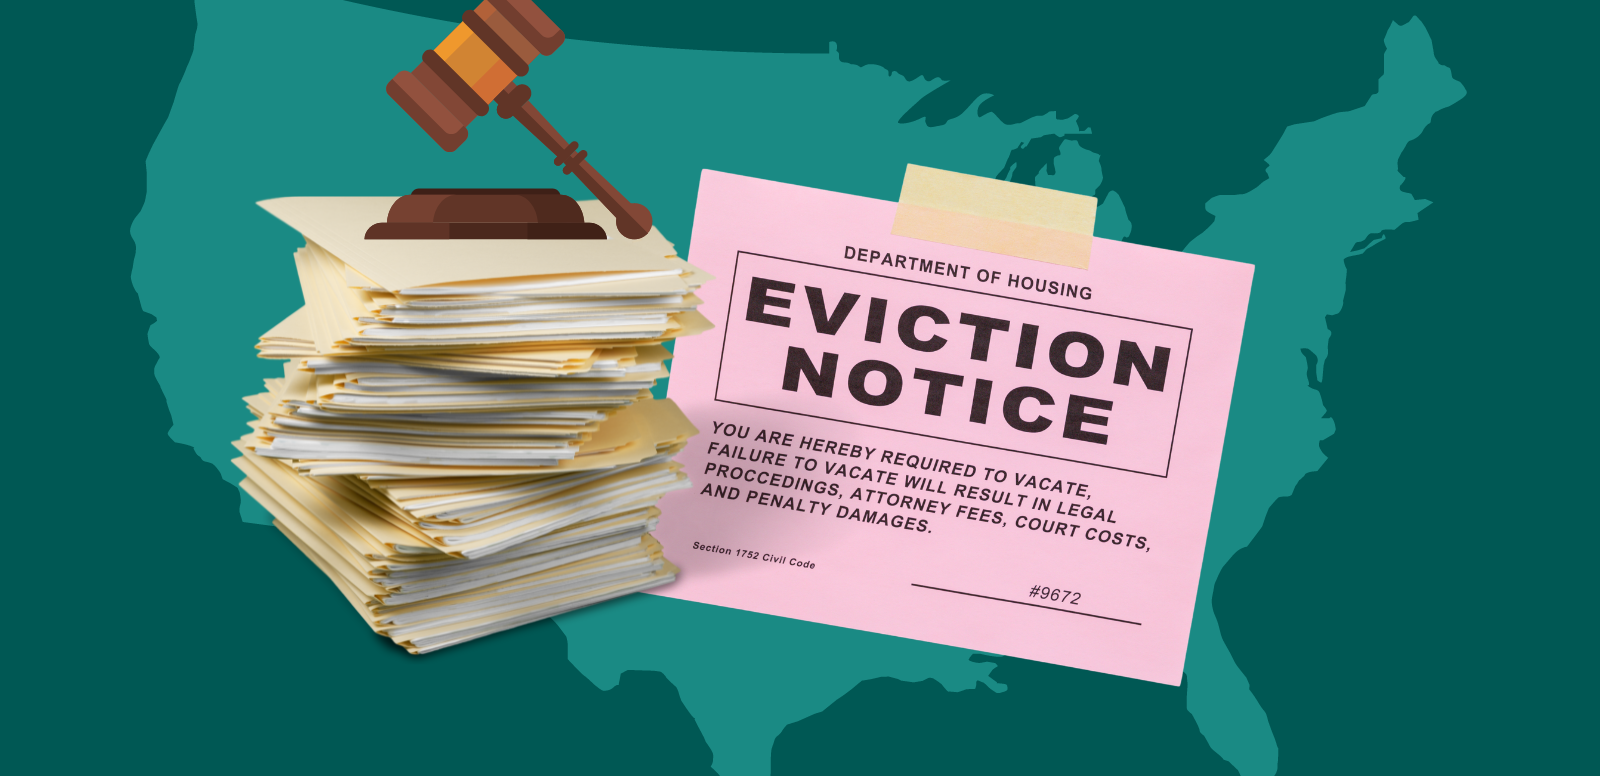