Congressional Brain Drain
Abstract
This research report comprehensively investigates congressional capacity and governance using publicly available data on long-term trends in legislative branch expenditures and data Furnas and LaPira collected in the 2017 and 2019 Congressional Capacity Surveys (CCS). When combined, the CCS is the most comprehensive panel study of congressional staffers’ professional backgrounds, career paths, policy views, technical knowledge, substantive expertise, and job experiences ever conducted. We document how the decline in legislative capacity has changed during the era of rising polarization and increasing political party competition. As a consequence, legislative staff in Washington are asked to do more and more, with less and less.
Acknowledgments
This report was prepared in accordance with the 2019 consultant agreement between Democracy Fund, Inc. and James Madison University. We thank the Democracy Fund, and especially Chris Nehls, for supporting this project. Additional funding for the 2019 CCS was generously provided by the Center for Effective Lawmaking at the Frank Batten School of Leadership and Public Policy at the University of Virginia and the Center for the Study of Democratic Institutions at Vanderbilt University. We are grateful to Craig Volden and Alan Wiseman for their support. Funding for the 2017 CCS was provided by the Madison Initiative of the William and Flora Hewlett Foundation to the Legislative Branch Working Group, a joint project between New America and R Street Institute. We are grateful to our collaborators Lee Drutman, Kevin Kosar, and Alexander Hertel-Fernandez for sharing data. Additionally, we report data from the ongoing Congress and Its Experts project, a collaboration with Jesse Crosson of Trinity University. We thank Amy Cesal for her data visualization expertise, and Elena Souris, Joe Wilkes, Naomi Morduch Toubman, and Maria Elkin for editorial guidance.
Executive Summary
This research report comprehensively investigates congressional capacity and governance using publicly available data on long-term trends in legislative branch expenditures and data Furnas and LaPira collected in the 2017 and 2019 Congressional Capacity Surveys (CCS).1 When combined, the CCS is the most comprehensive time-series cross-sectional survey of congressional staffers’ professional backgrounds, career paths, policy views, technical knowledge, substantive expertise, and job experiences ever conducted. We document how the decline in legislative capacity has changed during the era of rising polarization and increasing political party competition. As a consequence, legislative staff in Washington are asked to do more and more, with less and less.
- Congress is a funnel to lucrative jobs in lobbying. Between 40−45 percent see the private sector as their next career step. Roughly half of staff aiming to enter the private sector after serving on the Hill want to become lobbyists. For the most part, working on the Hill is viewed as an entry-level position for K Street, rather than a stepping stone for a career in public service.
- Staff resources have shifted to the district. The share of total staffer full-time equivalents dedicated to Washington, D.C. offices has fallen from more than 70 percent in the 1970s to 50 percent in recent years.
- There are fewer resources to pay staff. In the House of Representatives, the budget allocated for office staff hires fell by 10 percent from 2013 to 2017.
- Staff pay is declining. Salaries fell among communications, legislative, and administrative staff following the 110th Congress (2007-2008). The decline cannot alone be attributed to the member pay freeze and austerity measures resulting from the Great Recession because the decline in resources allocated for legislative staff started well before 2007.
- Congressional staffers in important roles are largely inexperienced. Most staff who manage policy portfolios in Congress have only one or two years of Hill experience. That is, roughly one-third of legislative staffers have not yet served the duration of a single Congress. Conversely, staffers in both chambers who have spent more time working in Congress are measurably more knowledgeable about institutional procedures and important policy topics.
- Capitol Hill is staffed primarily by Millennials. Roughly 60 percent of the congressional staffer population is under the age of 35, and 75 percent under 40 years old.
- Turnover among congressional staff is exceedingly high. The average tenure for staff on Capitol Hill is 3.1 years. About 65 percent of staffers plan to leave Congress within five years. Even more strikingly, 43 percent plan to depart by the end of the Congress in which they are employed.
- Most do not see working in Congress as a long-term career option. Even among those who would like to continue careers in the public sector, more than half (55 percent) plan to leave Congress.
- Staffers work extremely long hours, and are spread thin. More than 65 percent of staff work 50+ hours a week, and 20 percent of staff work 60+ hours. Of senior staffers, 65 percent work 60+ hours a week. The average legislative staffer works on two to six issue areas every single day.
- Staff like working for their boss, but not so much for Congress. Seventy-six percent report a very strong or strong sense of belonging in their employing office, but only 61 percent feel similarly about Congress as a whole. This institutional deficit is greater for women and staffers who are Black, Indigenous, and people of color (BIPOC).
- In Congress, experience yields knowledge, but is not rewarded. Staffers that have spent more time working in Congress are measurably more knowledgeable about institutional procedures and important policy topics. This is true across both chambers, and is unrelated to actual work assignments. Yet, turnover is so high and retention rates so low that members fail to keep that knowledge in house, so must rely more and more on K Street.
- Staffers are highly partisan and highly ideological. Sixty-five percent of staffers identify as strong partisans, and almost no staffers identify as true independents. Staffers are well-sorted ideologically, such that there is little ideological overlap between Democratic and Republican offices.
Citations
- Co-principal investigators of the 2017 CCS also include Lee Drutman, Alexander Hertel-Fernandez, and Kevin Kosar.
Long-term Trends in Congress’s Brain Drain
Congressional staff compensation has generally declined in recent decades, but these patterns are not uniform across all positions and employing offices. The cause of the decline is complicated. During this time period, information technology innovations have made constituent and media communication cheaper, but also more demanding.1 The declining cost of constituent communication and the rapid pace of public relations, in both traditional media and the break-neck rise of social media, have made members of Congress shift their attention away from legislating, toward communication and constituent service.2 The former is typically oriented toward developing policy and overseeing the Executive, and the latter toward ensuring reelection.
But technological innovation alone is only part of the story. Much larger, structural shifts in American politics have changed what Congress is today. The rise of ideological polarization and the increased competitiveness for majority control of both chambers have consequences. Congress went from being an institution that painstakingly solved problems to one where members tweet about how their ideological faction would solve problems—without actually following through.
The result is congressional brain drain.3 Not only are resources increasingly scarce in the legislative branch generally, the typical member’s policy shop has shrunk by about a third since the 103rd Congress.
Official Allowances and Personnel Compensation Analysis
The House and Senate appropriate funds for official expenses based on the members’ representational allowance (MRA) and senators’ official personnel and office expense account (SOPOEA). The MRA and SOPOEA have developed differently over time, creating divergent paths for structuring how members allocate their resources. We show here the SOPOEA is a far superior planning and budget tool.
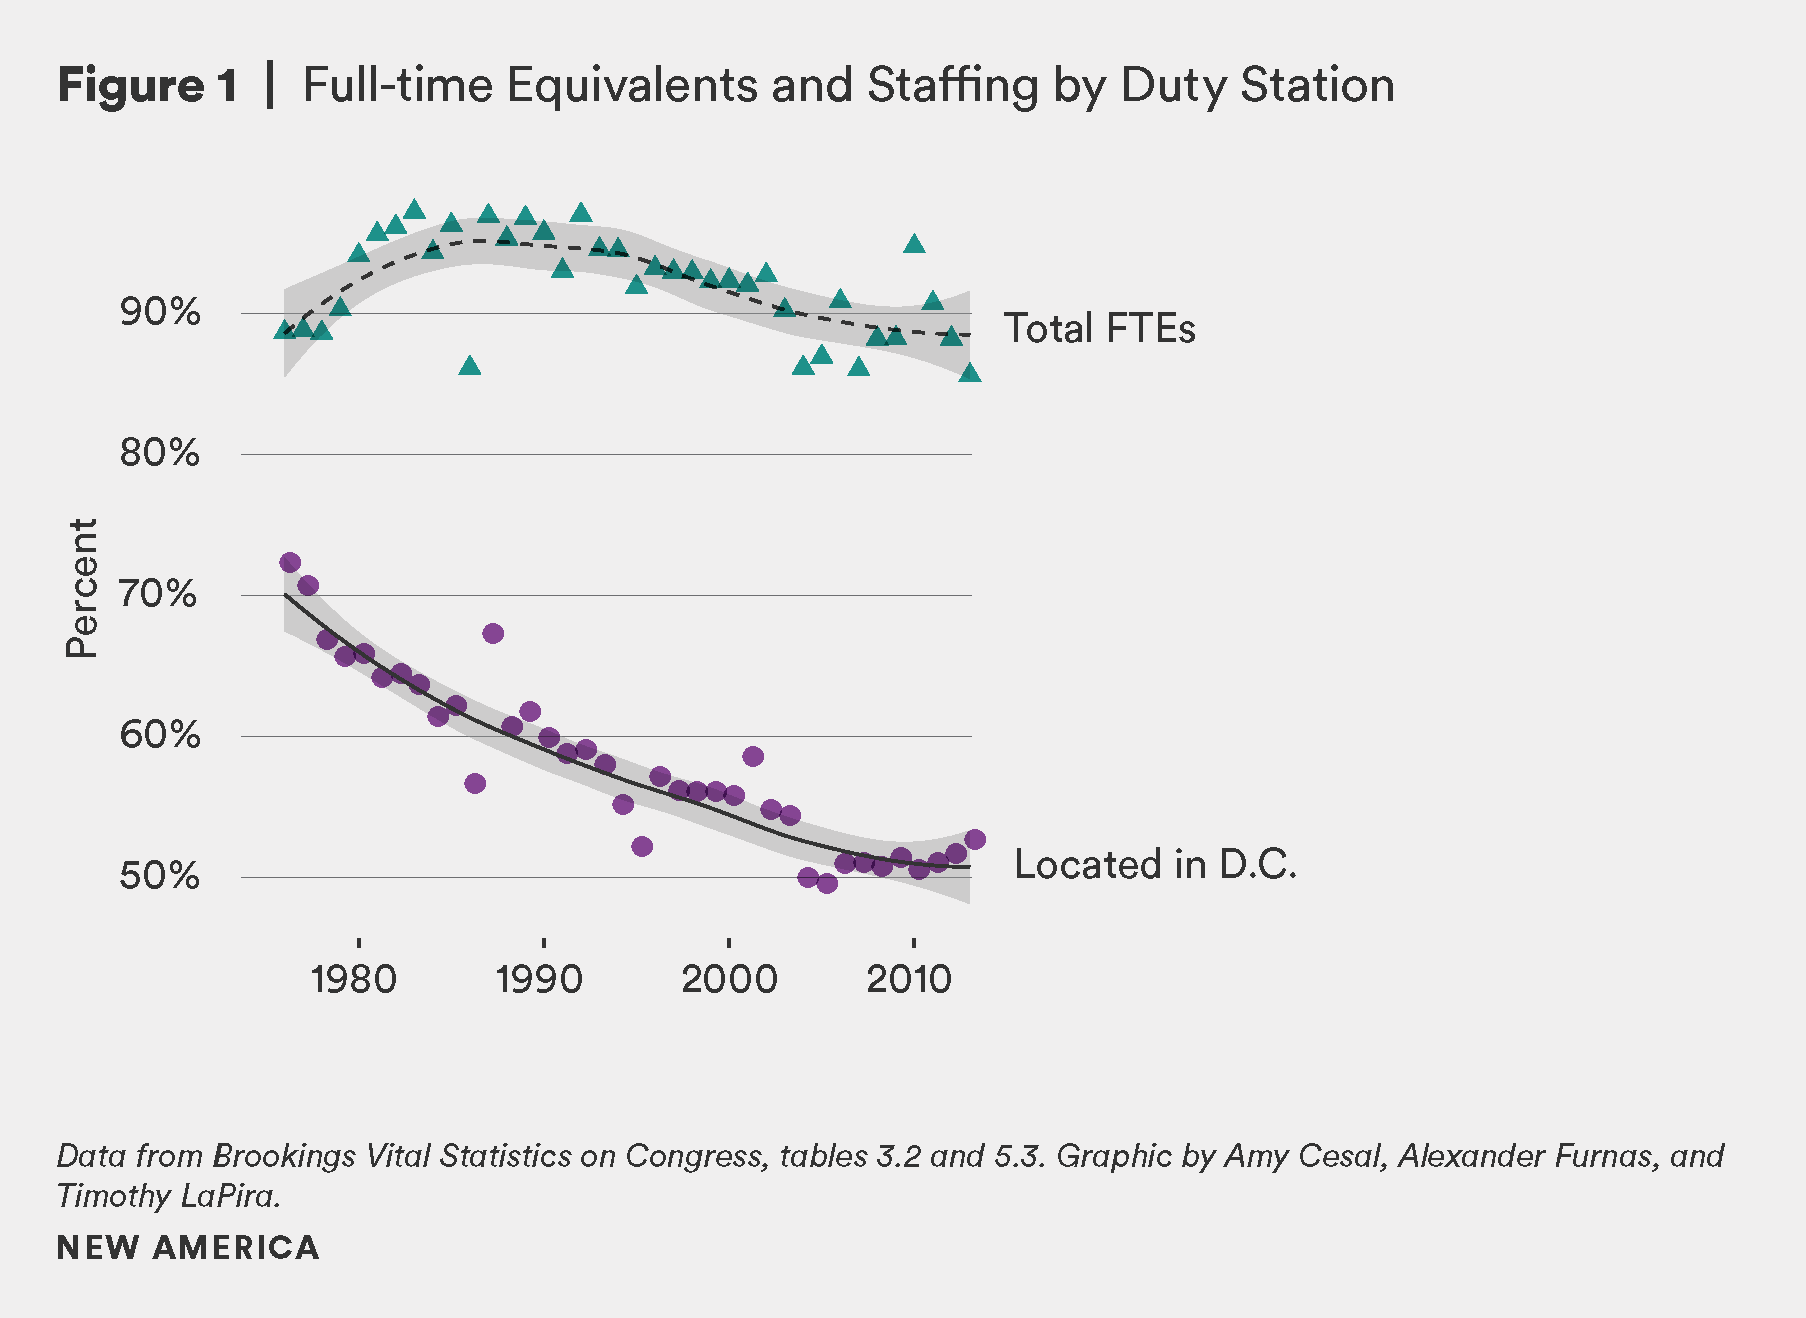
In addition to the budget constraints imposed on members’ personal offices by the MRA, the Rules of the House of Representatives dictate that each office is limited to the so-called “18+4” full-time equivalent (FTE) rule. In response to a scandal in the 1970s where no-show employees were discovered on payroll, the House permits members to have 18 FTEs, plus up to four part-time equivalents. If we assume all offices could employ a total of 22 people, then we can measure the completeness of Representatives’ personal office rosters. Figure 1 shows a rise in staffing from the 1970s to the early 1990s, when FTEs began declining steadily through the 115th Congress (2017-2018). More importantly, the number of House personal office staff located in Washington declined from a peak of more than 70 percent to just about 50 percent. This trend is consistent with the rise of the permanent campaign and the post-Reagan era of heightened partisan competition.4
In the midst of these broader trends, Congress adopted the MRA in 1995 and implemented it in 1996. Beginning in the 1970s, the House frequently established new accounts that members could draw from, creating a maze of duplicative pots of money. Sometimes members would use funds from one account to pay credits in others, which often made it impossible to follow the money. These “new” MRA accounts were not actually new at all. They simply codified the many existing accounts into three primary functions, or “allowances.” The three allowances include the “clerk hire” (staff) component intended for the hiring of all personal office staff (in both Washington and back in the district), the office expense component intended for operating expenses, and the variable component intended for member travel, district office rent, and other items.5 Importantly, the clerk hire and office expense components are constant for all 440 members of the House; the variable component formula is based on the geographic location of the district to account for variation in costs like commercial real-estate prices. The point was to create parity among offices. The MRA was supposed to account for the fact that some members can take the subway to work while others have a three-legged flight to a rural district, or that some members pay district office rent and wages in the most expensive cities in the country.
The three components are separate for purposes of calculating the overall MRA budget. However, members can use their overall MRA budget for any allowable expense as they please.6 They can hire as many or as few staff as they want, and they can pay them whatever they choose, regardless of the clerk-hire allowance amount. They can open as few or as many district offices, buy as many printers, or send as many constituent newsletters as they want, so long as they do not overspend their total MRA budget in a given fiscal year.
From 1996 to 2012, legislative branch appropriations reports listed these three allowances per congressional office separately. Beginning in 2013, appropriators simply stopped reporting the allowances. Since then, no further adjustments were made to the base amounts, while the variable component formula remains unchanged. In other words, the House simply has ignored its personal office budget for eight years running.
Thus, the MRA remains stagnant, despite a total inflation rate increase of 9.8 percent from 2013 to 2017. In effect, by simply appropriating a constant total MRA amount as is, the House has chosen to reduce its spending on staffing and overhead by 10 cents on the dollar in just five years. The consequence has been a marked decline in staffing.
Figure 2 plots average amounts for all three components, along with mean personnel spending across all 440 House member personal offices.7 Since it was launched, the average MRA has grown in nominal dollars, until recently. In constant dollars, the MRA peaked in 2010, declined through 2016, and has modestly increased in recent years. It has never returned to pre-2010 levels.
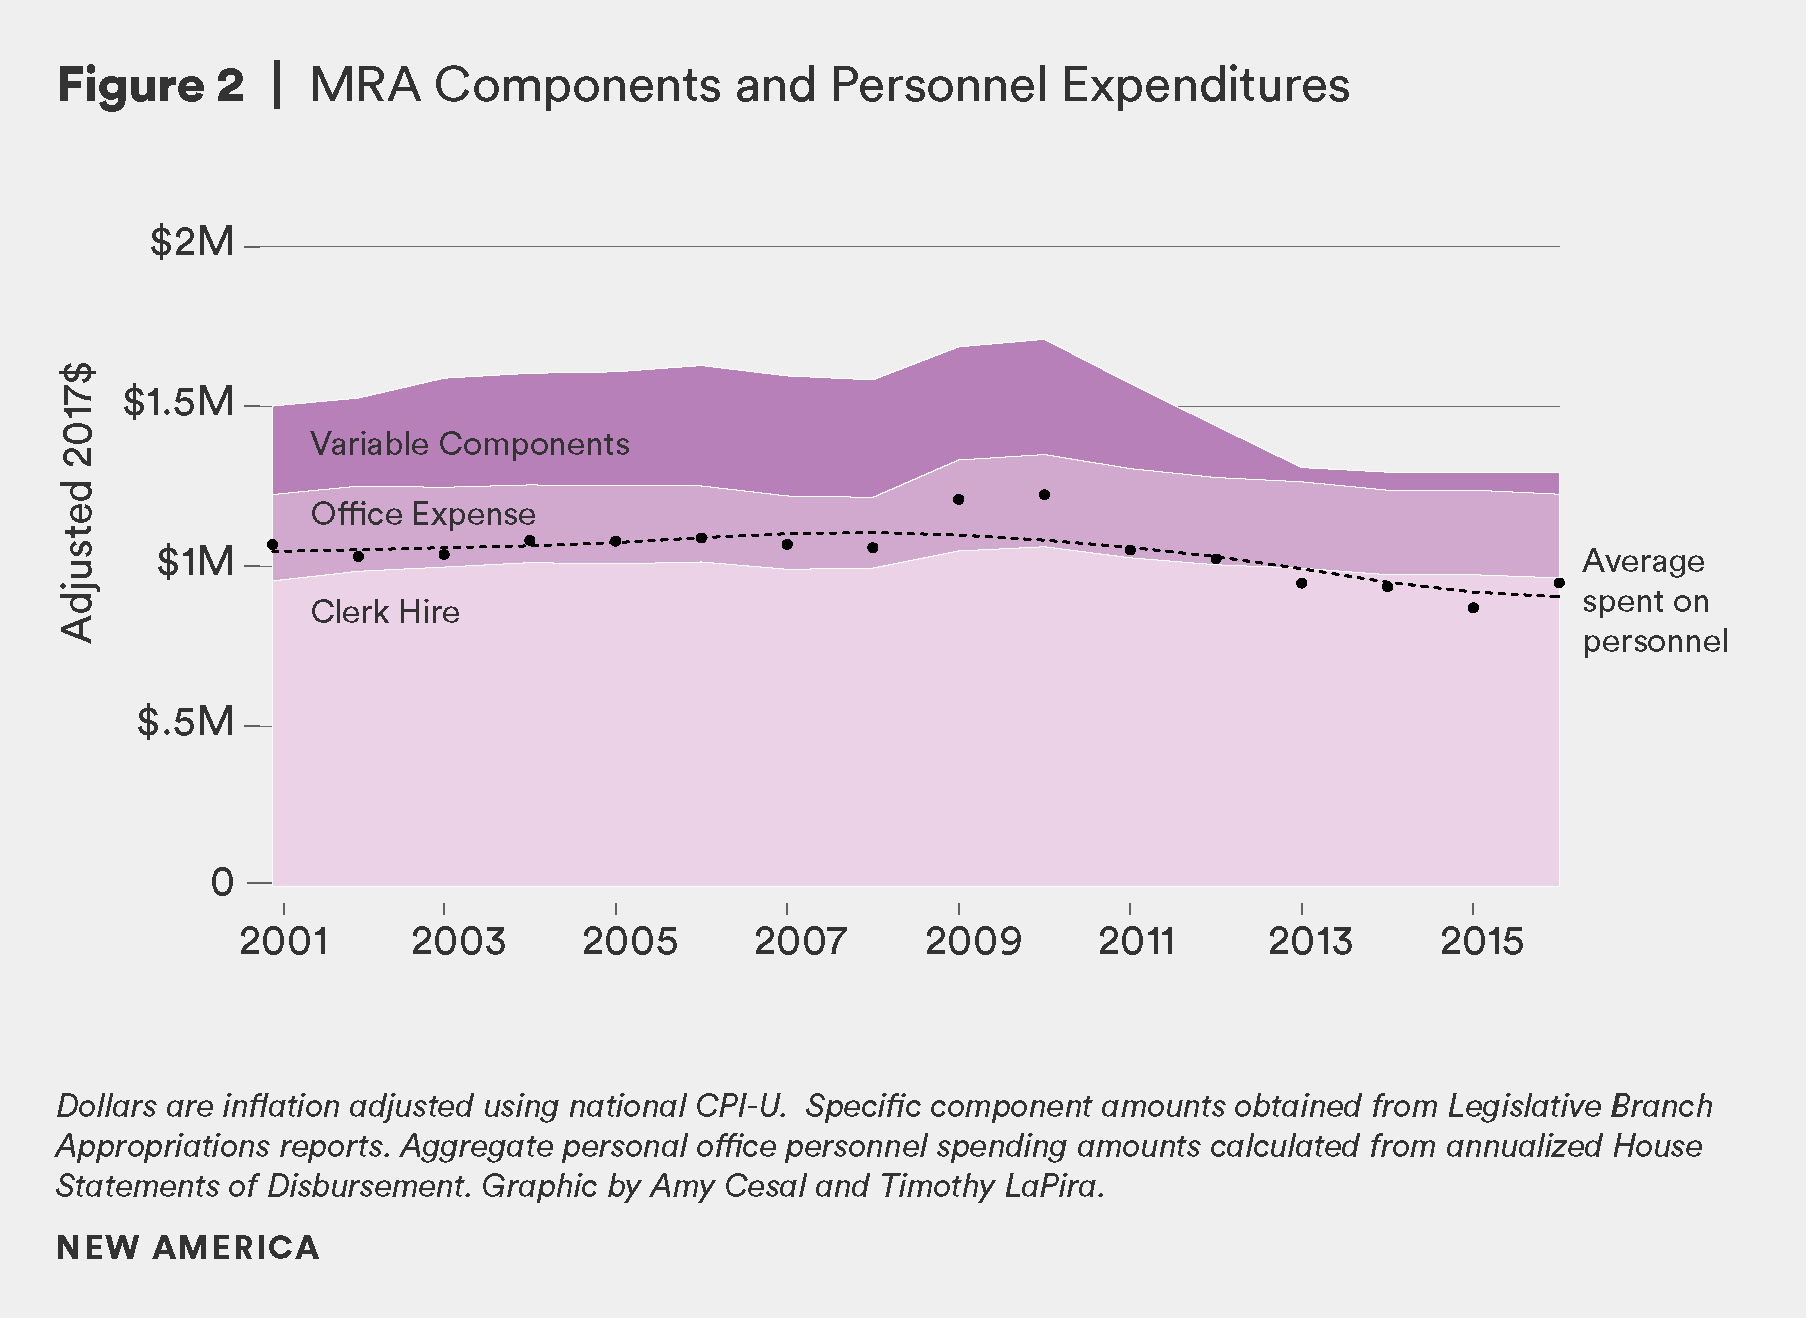
From 2001 to 2009, personnel spending was consistently higher than the clerk hire component, suggesting that members were dipping into the other components to staff their offices. In other words, members were forced to use slack in non-personnel allowances to pay staff. Eventually, that slack ran out.
It is important to note the context of these personnel expenditure trends. In response to the Great Recession in 2008, members chose to freeze their own pay in the 110th Congress. They have not adopted cost-of-living pay increases since 2009, despite the strong pre-COVID-19 recovery that started in 2010. Rules in the House and Senate prevent staff from earning more than the current member salary fixed rate of $174,000.8 Coupled with the Affordable Care Act (ACA) rules changes requiring Washington, D.C.-based staff to buy into the District of Columbia exchange, members dramatically reduced personnel expenditures from 2009 forward. Anecdotal evidence suggests that senior staff with relatively long tenures chose to leave to avoid costly health care contributions and salary ceilings created by members’ self-imposed pay freeze. In turn they were likely replaced by relatively younger and less experienced staff. If the congressional response to the economic crisis caused by COVID-19 follows a similar trajectory, we should expect further debilitating declines in congressional capacity in coming years. Staffers are long overdue for cost-of-living pay increases, which may be further forestalled by the current economic crisis.
These declining personnel expenditures may be particularly challenging for Capitol Hill staff. The Bureau of Economic Research now ranks the Washington-Arlington-Alexandria, D.C.-Va.-Md.-W.Va. metropolitan area as the 10th most expensive in the country, and the second most on the East Coast.9 So, even adjusting for inflation using the nation-wide Consumer Price Index for All Urban Consumers (CPI-U), these trends may be underestimating the loss of purchasing power for Capitol Hill staff.
The consequence of the pay freeze and the ACA rule is that after 2009, inflation-adjusted personnel expenditures were at or below the budgeted clerk hire amount. With no slack remaining after paying for relatively fixed non-personnel overhead, members have been left with little choice but to cut staffing. This is the new normal. Almost 70 percent of the 116th Congress (2019-2020) first took office since 2009. Therefore, the overwhelming majority of members have never been budgeted an allowance with sufficient slack to cover both overhead costs and personnel. Most members do not know any different than being offered a summary office allowance that no longer accounts for changes in purchasing power or variation in district-specific costs. Simply, what was the MRA has devolved into a poor planning and budgeting tool, and most members are oblivious to the fact.
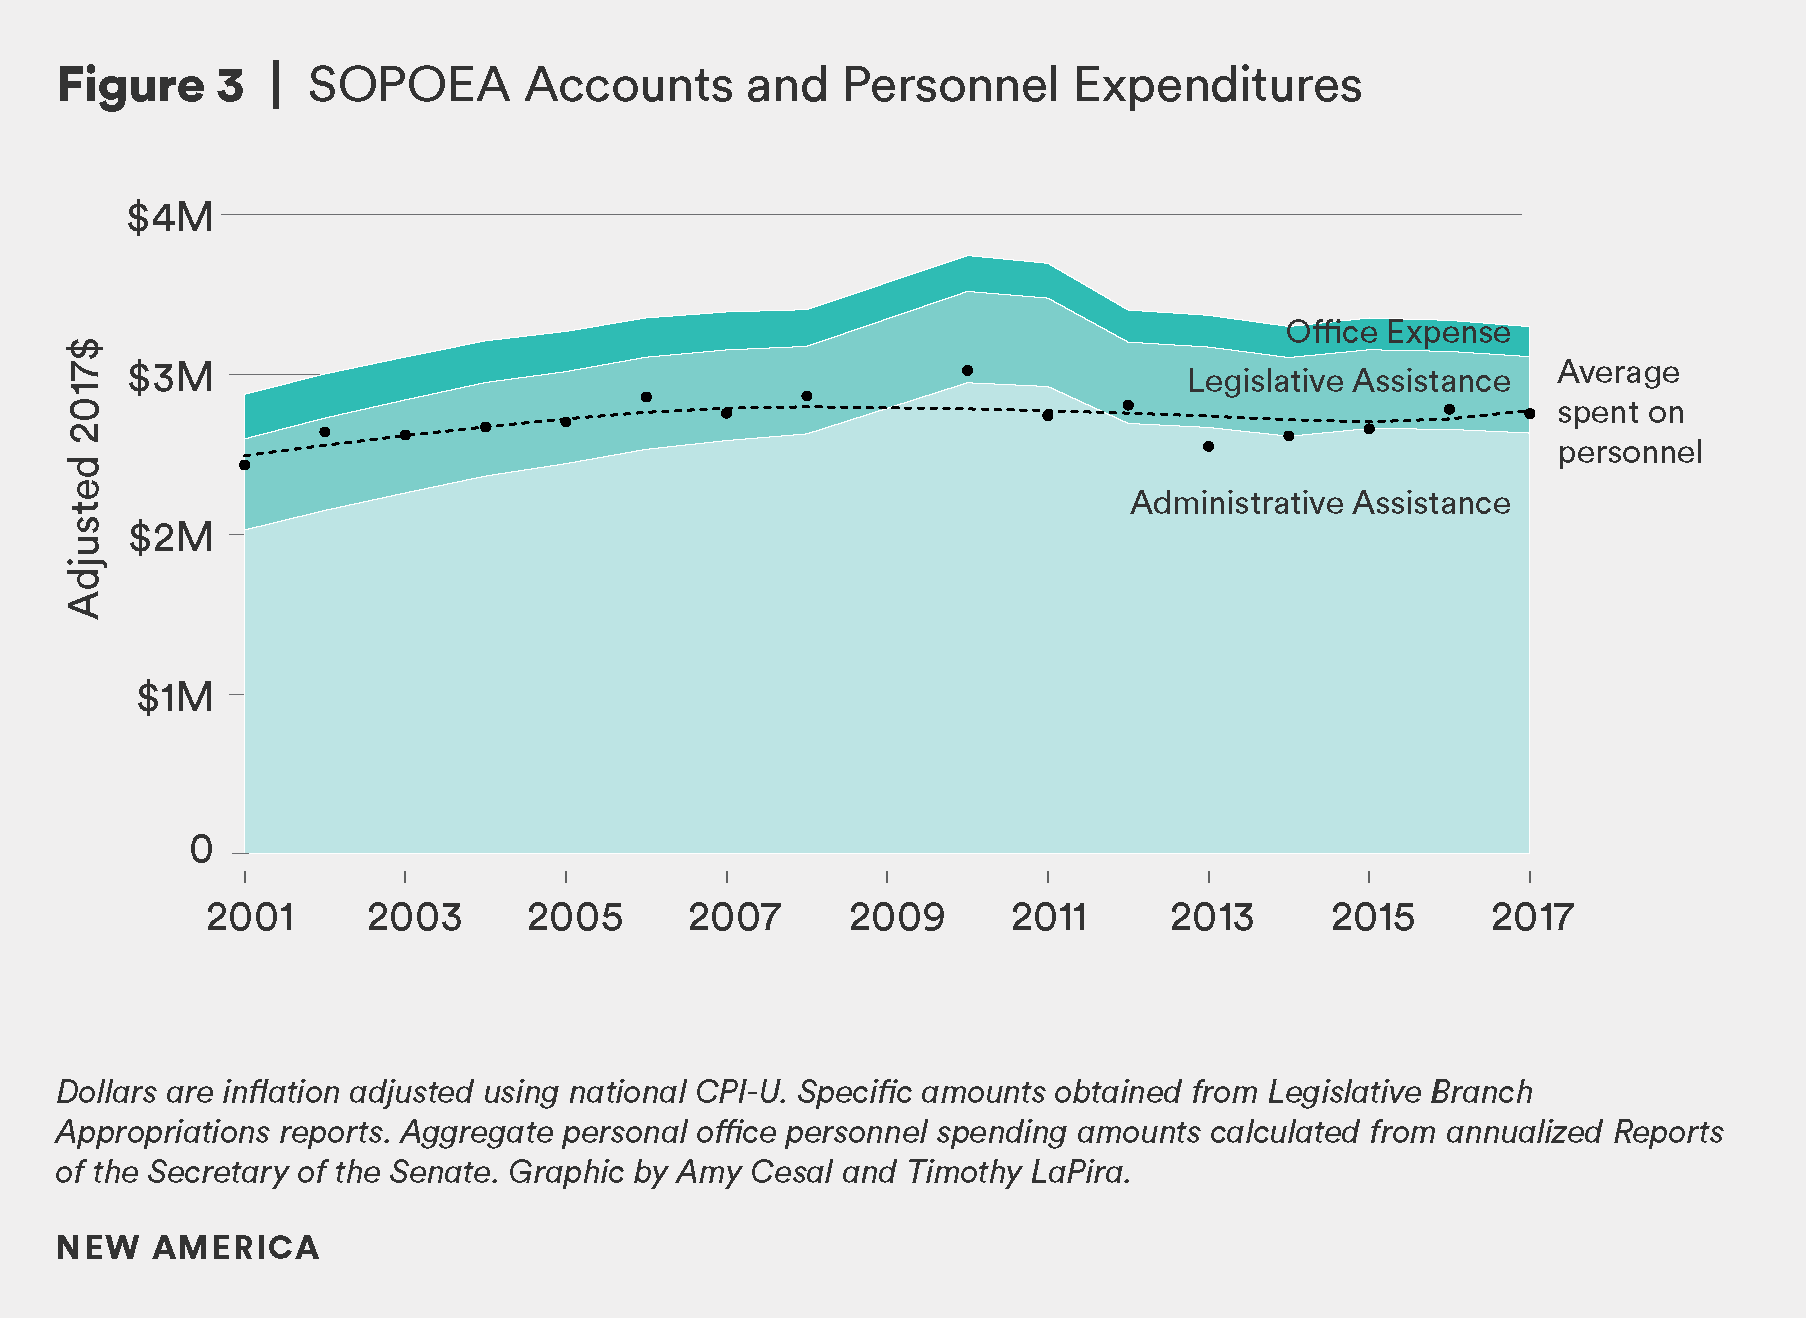
The same is not true in the Senate. The SOPOEA is based on three distinct accounts: the administrative and clerical assistance allowance, the legislative assistance allowance, and the official office expense. The office expense formula varies on state size and other factors, and senators are free to use their official funds as they please. The first two accounts combined represent the budget allocations for senators' personal office staff.10
Unlike the MRA, Senate Legislative Branch appropriators actually continue to budget these component expenditures. Figure 3 shows that personnel spending has remained much more stable over time, despite inflation-adjusted fluctuation in senators’ administrative assistance accounts. Additionally, it is common for senators to hold a chair or ranking member position at a committee or subcommittee, or to be afforded committee funding for designated staffing needs. Senators, then, meet their personnel needs using a combination of ample personal office and committee funds. Unlike the general prohibition against designating committee staff to specific members in the House, it is commonplace for committee staff to be de facto employed exclusively by individual senators.11 With the combination of better budget planning by Senate appropriators and greater discretion in the use of committee funds, senators are much better positioned to consistently recruit and retain staff than representatives.
If the SOPOEA administrative and clerical and the legislative assistance components are taken together as the total amount budgeted for all personnel, then senators’ staffing budgets far exceed their staffing expenditures. In other words, senators purposely allocate sufficient slack for staff, so they have little need to dip into the office expense allowance. Of course, senators and representatives have very different constitutionally defined constituencies, with most senators representing far more constituents than House members. For comparison, we calculate the percentage of the personnel portion of the MRA or SOPOEA used for actual personnel spending. For the entire 2001 to 2016 time period, senators spent over time an average of 89 percent of their personnel budget for staff, whereas House members spent 104 percent of their clerk hire allocation on personnel.12 Consequently, as we explore in our human capital analysis below,13 senators have greater flexibility to recruit and compensate more experienced staff, which we know improves their legislative effectiveness.14
House of Representatives Job Title Analysis
These aggregate trends do not themselves reveal how members allocate their shrinking personnel budgets and smaller Washington office rosters. In this section, we disaggregate House members’ personnel expenditures by common job titles.15 We group job titles by their primary area of responsibility, though doing so is not precise because the titles themselves do not match actual assigned duties very well, as we demonstrate in the next section.
Once again, these data need to be understood in the context of the 2009 member pay freeze and ACA rule for staff. Despite these changes, Figure 4 shows that the median salary for chief of staff (CoS) has remained relatively constant between the 103rd (1993-1994) and 115th Congresses.

The CoS typically supervises all staff and all work within an office—and is tasked with managing the MRA—so is not surprisingly the highest ranking staffer would be paid more than others. Also, the CoS typically controls the budget and sets salary rates in consultation with the member, including his or her own. It is not uncommon for members to delegate most or all of those decisions to senior staff, sometimes with regrettable consequences.
Contrast that stability with communications and legislative staff, both of which are typically considered the primary areas of responsibility in a Washington office. In the “Communications Staff” facet in Figure 4, we see not only a decline in both common job titles post-110th Congress, but a growing gap between communications directors and press secretaries. Both positions peaked in the 110th Congress, but the inflation-adjusted median press secretary salary dropped more than 50 percent through the 115th Congress. Communications directors’ salaries have likewise declined, but only at a fraction of their more junior colleagues.
Alternatively, staff in members’ so-called “policy shop” exhibit a relatively stable secular trend through the 110th Congress, then a post-110th drop across all levels. The third panel in Figure 4 shows the most common Capitol Hill position—legislative assistant—decline significantly in the 111th Congress (2009-2010), never to recover. The median legislative assistant earned just over $35,000 in the 115th Congress. The typical legislative correspondent earned less than $30,000. The mid-level supervisory position of legislative director shows the most volatility, peaking at more than $80,000 in the 110th, and dropping by nearly a quarter by the 115th Congress.
Job titles associated with constituent service operations in the district follow a similar pattern to legislative operations in Washington. The most notable decline is the supervisory district director, which dropped considerably after the 110th Congress. The requirement that staff use state-based ACA exchanges may have particularly affected district directors, since rates in some exchanges may far exceed those in the federal employee health benefits program
Finally, administrative and clerical staff experienced the largest and longest running declines in salary across all levels. These positions are the most likely to be impacted by improved communication technology and office operation efficiencies. Executive assistants, typically a position that is both politically and personally sensitive to members, has plummeted from a pre-110th Congress (2007-2008) pay rate equivalent to communications directors down to one roughly equal to the much more common legislative assistant.
Positions like office manager and staff assistant—commonly considered foot-in-the-door jobs that position staff for promotion to jobs in legislative operations or communications—have likewise declined. Staff assistants’ annualized salaries dropped down to below $20,000 in the 115th Congress—in a city where the living wage for an adult with no children is $35,194.16 Though turnover in these positions are high, these extremely low salaries suggest that staffing is a sellers’ market, especially at the entry level. It is not uncommon for hundreds of applicants to seek out these entry-level positions, nor is it rare that staff assistants have additional jobs on nights and weekends or require assistance from family, despite Congress being the most professionalized legislature in the world. These jobs, then, are extremely difficult for underrepresented and lower income populations to seek and obtain, contributing to a long-term, persisting lack of diversity within congressional staff.
House of Representatives Human Resource Allocation Analysis
Comparing compensation by common job title is misleading because conventions have changed significantly over time and across chambers. For instance, the job title “chief of staff” has all but replaced the title “administrative assistant,” which was very commonly used for the most senior staffer until the late 1990s. And, as personnel budgets have tightened, it has become standard practice on Capitol Hill to offer staff a change in job title without significantly increasing pay, with the implicit understanding that a more prestigious title may improve career advancement in the future. The result is de facto job title inflation. So, while intuitive for those familiar with Capitol Hill jargon, job titles are an ineffective way to measure how members prioritize the functions in their office.17
To better measure how members allocate resources to their specific needs, we systematically identify job responsibilities for each staffer by cross-checking their payroll records with quarterly Congressional Yellow Book volumes that coincide with their work.
Often there is a perfect correlation between job title and duties, as with legislative assistants. But that is not always the case, since some chiefs of staff maintain a policy portfolio and some staff hold joint job titles such as press secretary/legislative assistant. We identify ambiguous cases like these, and split the staffers’ reported salary between the relevant functions. Doing so more realistically reflects the allocation of resources in an office. The result is a superior measure of how members allocate MRA to specific duties, rather than to job titles.
In Figure 5, expenditures are tracked in five categories: (1) political leadership, (2) legislative, (3) communications, (4) constituent service, and (5) administrative functions. Political leadership staff is typically senior positions that have multiple supervisory and operational responsibilities, such as CoS, committee staff director, or a deputy. In some cases, positions such as “scheduler” play a gatekeeping role, so may be wholly or partially categorized as political leadership; in others, the same position is relatively junior, so may be categorized as administrative. Our investigation painstakingly categorized every staffer, in every quarter, to more precisely account for what their responsibilities are rather than relying solely on job titles, which can be uninformative.18
The y-axis is the percentage of expenditures on staffing across all five functions.19 When measured by function, there is no sudden decline after the 110th Congress that we observe in pay per job title, suggesting that members were sensitive to changing budget constraints that came with member salary freezes. Most importantly, the decline in the allocation of personnel funding across all categories began long before the Great Recession, the member pay freeze, and the ACA rules for staff.
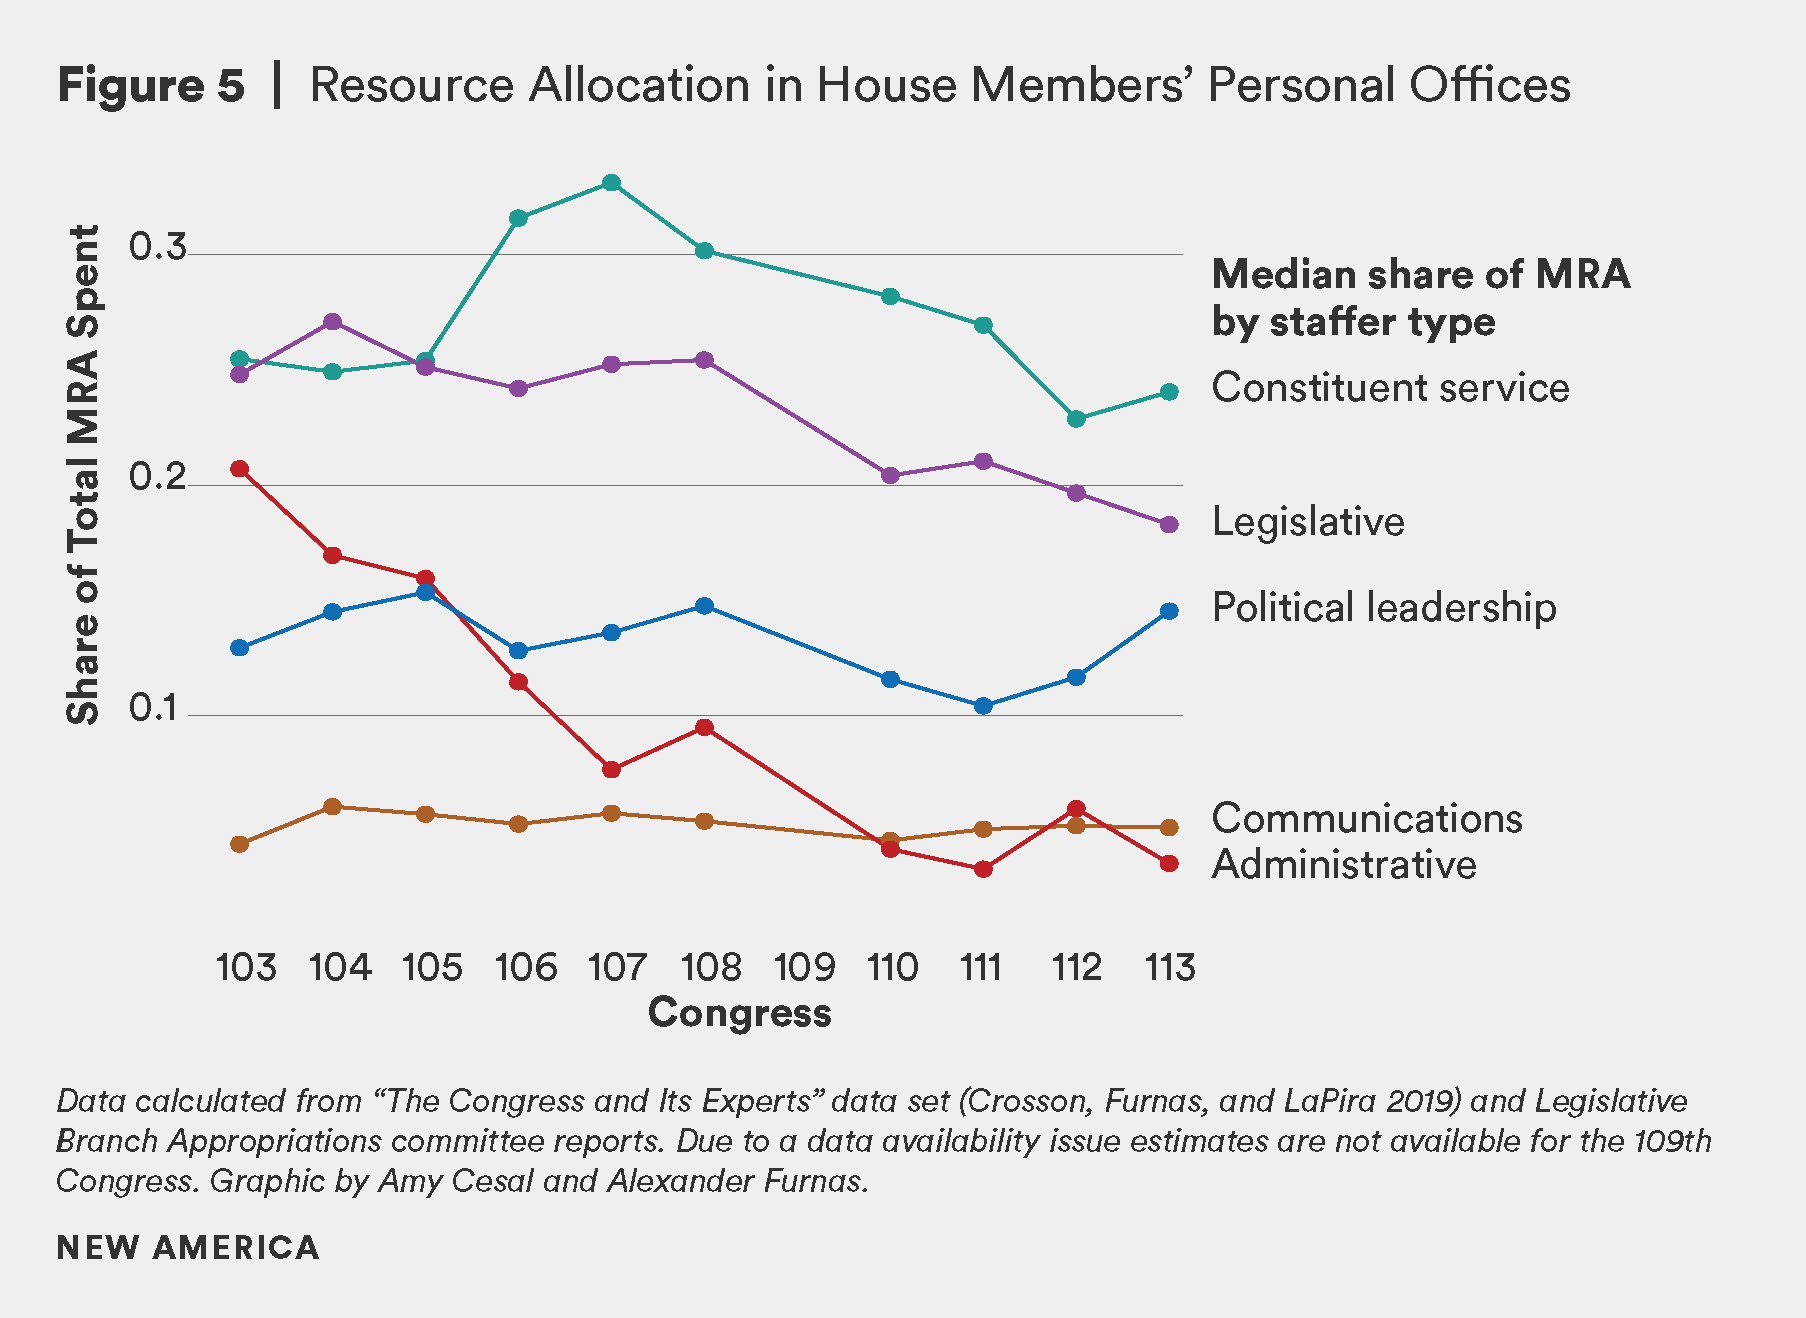
The largest secular trends are the sharp decline in administrative staffing and the rise of constituent service personnel. The decline in administrative functions is driven by reduced information technology costs. Thus, the savings accrued by the introduction of low-cost technology were initially shifted to constituent service, which is most closely tied to members’ reelection motivation. But that increase in district operations staffing was short lived.
The most striking feature is that legislative operations and constituent service were once prioritized equally in House offices. From the 103rd through the 105th (and, most likely prior to the 103rd), members’ legislative and constituent service allocations reflect equal priorities.20 Since the 105th, members rank policy shops far below district work.
This is true even though both constituent service and legislative operations both decline at roughly similar rates after the 107th Congress (2001-2002). At its peak, the median office allocated about 27 percent of the MRA to legislative staff. By the 113th Congress (2013-2014) this share had decreased to 18 percent, a cumulative decline of roughly one-third of legislative operations staffing. This decline is equivalent to just over one FTE assigned primarily with legislative tasks, such as a legislative assistant earning about $35,000 plus fringe benefits. In the same period, median expenditures on political leadership and communications staffers remain relatively constant. And, we already know the legislative workload slack has not been picked up by committee staff. In fact, committee staffing rosters have themselves declined during the same period.21 The decline in committee staffing coincides with a dramatic reduction in committees’ legislative productivity, which has largely been replaced by highly partisan oversight theatrics.22 Alternatively, there is some evidence that party leadership staff has increased during this period to manage the legislative workload, but of course that is not the same as having rank-and-file members fully participate in the legislative agenda setting and lawmaking process.23 Finally, these trends are consistent across multiple Congresses, regardless of which party is in the majority.
All told, judging by their expenditures on staff, members of the House today value representation activities like constituent services far more than they do legislative activities such as conducting rigorous oversight, drafting legislation, and building support for their ideas. Thus, the story is that rank-and-file members are legislating less, and focusing more on district work that is geared toward reelection and representation, as opposed to policy and oversight. Combined with fewer legislative days and an increased expectation to raise election funds, especially while in Washington, Congress’s capacity to govern has diminished to its lowest levels in generations.
Citations
- Michael A. Neblo, Kevin M. Esterling, and David M. Lazer, Politics with the People: Building a Directly Representative Democracy (New York: Cambridge University Press, 2019).
- Jesse Crosson, Alexander Furnas, Timothy LaPira, and Casey Burgat, “Partisan Competition and the Decline in Legislative Capacity among Congressional Offices,” Legislative Studies Quarterly, published online (July 29, 2020). source
- Timothy M. LaPira and Herschel F. Thomas, Revolving Door Lobbying: Public Service, Private Influence, and the Unequal Representation of Interests (Lawrence, KS: University Press of Kansas, 2017).
- Frances E. Lee, Insecure Majorities: Congress and the Perpetual Campaign (Chicago, IL: University of Chicago Press, 2016).
- Ida A. Brudnick, Members’ Representational Allowance: History and Usage (Washington, DC: Congressional Research Service, 2019).
- Constrained only by the Rules of the House and what is permissible by the House Ethics Committee.
- The mean for the clerk hire and office expense amounts are equal to the total since it does not vary, whereas the mean for the variable amounts is calculated across all Members.
- Ida A. Brudnick, Salaries of Members of Congress: Recent Actions and Historical Tables (Washington, DC: Congressional Research Service, 2020).
- See Eric Figueroa: “Regional Price Parities by State and Metro Area,” (Suitland, MD.: Bureau of Economic Analysis, May 18, 2020). source
- Ida A. Brudnick, Senators’ Official Personnel and Office Expense Account (SOPOEA): History and Usage (Washington, DC: Congressional Research Service, 2019).
- House Rules occasionally permit certain committees, such as Rules and Appropriations, to designate committee funds for individual Members’ personnel needs, but it is not common or consistent over time.
- Senate mean = 88.7 (sd = 1.07); House mean = 104.1 (sd = 1.7), t = 7.8; adjusted df = 23.9.
- See section 4 of this report.
- Jesse M. Crosson, Geoffrey M. Lorenz, Craig Volden, and Alan E. Wiseman, “How Experienced Legislative Staff Contribute to Effective Lawmaking,” in Congress Overwhelmed: The Decline in Congressional Capacity and Prospects for Reform, Eds. Timothy M. LaPira, Lee Drutman, and Kevin R. Kosar (Chicago, IL: University of Chicago Press, 2020).
- To date, the Congress and Its Experts data set (see source) we draw on here includes reliable, clean data for House Members’ personal offices only. The timeline extends further into the past then all other publicly available sources, including LegiStorm data that is censored in the year 2001. The ongoing project is extending this research to committee, party leadership, and other offices in the chamber, and to Senate offices. Data from House Statements of Disbursements for the 109th Congress (2005-2006) are unavailable.
- Amy K. Glasmeier, Living Wage Calculator, (Cambridge, MA: Massachusetts Institute of Technology, 2020). livingwage.mit.edu.
- Eric Petersen, Congressional Staff: Duties and Functions of Selected Positions (Washington, DC: Congressional Research Service, 2012).
- See section 6.6 for a more detailed description of the staffer coding process.
- All other overhead and expenses are excluded, so these figures do not sum to 100% of the MRA.
- The sharp increase is frequently attributed to Speaker Gingrich, though the evidence suggests this is not true. Both parties simultaneously, equally, and consistently shift resources from legislative operations to constituent service, even when majority control switches between parties. See Jesse Crosson, Alexander Furnas, Timothy M. LaPira, and Casey Burgat, “Partisan Competition and the Decline in Legislative Capacity among Congressional Offices,” forthcoming in Legislative Studies Quarterly.
- See Timothy M. LaPira and Herschel F. Thomas, Revolving Door Lobbying: Public Service, Private Influence, and the Unequal Representation of Interests (Lawrence, KS: University Press of Kansas, 2017) and Molly E. Reynolds, "The Decline of Congressional Capacity," in Congress Overwhelmed: The Decline in Congressional Capacity and Prospects for Reform, Eds. Timothy M. LaPira, Lee Drutman, and Kevin R. Kosar (Chicago, IL: University of Chicago Press, 2020).
- Jonathon Lewallen, Committees and the Decline of Lawmaking in Congress (Ann Arbor, MI: University of Michigan Press, 2020)
- James M. Curry, Legislating in the Dark: Information and Power in the House of Representatives (Chicago, IL: University of Chicago Press, 2015) and Lee, 2016.
Congressional Staffers’ Job Satisfaction, Career Trajectories, and Compensation
These 30,000-foot, chamber-wide changes in legislators’ priorities have certainly impacted staff pay in Congress. But the trends themselves do not reveal how individual staffers experience work in Congress, and how that experience affects their career prospects and salary. Here, we rely on our Congressional Capacity Surveys (CCS) that integrate information from publicly available payroll records with specific details on staffers’ educational and professional backgrounds, knowledge of policy and legislative procedure, and political and social identities. The data from nearly 800 staffers responding to both CCSs better reveal how their personal and professional characteristics are associated with future career trajectories, job satisfaction and sense of belonging, and salary. We assess and compare job satisfaction and career trajectories across several categories: employer’s party, chamber, office type, staffers’ own ideology and party identity, job responsibility, seniority, and demographics.1
Staffers’ Employing Offices
Our sampling process intentionally screened Washington, D.C.-based staff who can reasonably be expected to impact the policymaking and representational responsibilities across a variety of employing offices. In other words, we focused our attention on political appointees working on Capitol Hill.
Table 1 shows that three in five staff work on the House side, despite House members outnumbering senators by more than four to one. There are more staff per members in the Senate, though both chambers have roughly the same number of committees with similar jurisdictions.
Table 1 | Staffers by Employing Office (Percent)
| 2017 | 2019 | Combined | ||
|---|---|---|---|---|
| Chamber | House | 58 | 60 | 59 |
| Senate | 42 | 40 | 41 | |
| Office Type | Personal | 69 | 69 | 69 |
| Committee | 24 | 27 | 25 | |
| Party leadership | 6 | 5 | 5 | |
| Party | Democrats | 44 | 55 | 49 |
| Republicans | 56 | 46 | 51 | |
| Primary Responsibility | Communications | 10 | 15 | 13 |
| Legislative | 74 | 70 | 72 | |
| Political leadership | 16 | 15 | 16 |
Notes: Cells are weighted frequency percentages. Rounded percentages may not sum to 100 percent.
Employing offices follow a familiar pyramid structure based on the hierarchy of offices on Capitol Hill. Seven in 10 staffers work in members’ personal offices, whereas only one in 20 work in party leadership. The combined party breakdown is split evenly, with Republican offices employing more staff in 2017 when they were the majority in the House, and vice versa for Democrats in 2019. The weighted employing office frequency patterns in Table 1 suggest our survey respondents are representative of staffer population level data.
Staffer Race and Gender Identity
Between all of these employment categories, about 6,500 political-appointee staffers work on Capitol Hill,2 Even so, the most common demographic profile for a typical staffer is a white male with a bachelor’s degree who works as a legislative assistant in a majority party House members’ personal office. In general, there is a longstanding and significant underrepresentation of Black, Indigenous, and people of color (BIPOC) among Hill staff. For example, people of color only made up 14 percent of all top House staff3in 2019 and 11 percent of top Senate staff in 2020. Though these numbers are still low—and are lower than the percentage of BIPOC in the greater American population—they both represent significant improvements in recent years.4
This fact is borne out by a conversation with a senior House committee staffer in 2017. When one of the authors pointed out that she was the first Black woman he interviewed among the nearly 50 interviews he had conducted among House and Senate senior staff, she noted that:
I'm the first African-American staff director of this committee…When they say it's “the last plantation,”5 they're not that far off. Unfortunately, I'm normally one of very few African Americans at the table for most high-level policy discussions.
This anecdote is most certainly true in a general sense, but extremely difficult to dig further into using survey methods. Precisely because white staffers make up the overwhelming share of those within the institution, our survey samples of BIPOC staff are simply too small to present detailed breakdowns of responses by identity. Therefore, our inability to use this survey data to speak to issues of race in Congress and the potential impacts—beyond rough estimates at demographics in most cases—is, itself, a result of the severe diversity problem within the institution.
The data presented here are from our external data provider, LegiStorm. What we present is limited by the format and manner in which these data have been collected.6 Despite their shortcomings, however, these data reveal that the population of congressional staff is considerably more white than the population they serve.
Table 2 presents the racial and ethnic demographics of the 6,505 congressional staffers in the 2019 Congressional Capacity Survey sampling frame. Overall, Democratic offices employ 73 percent Caucasion staffers. Republican staffers are almost exclusively Caucasion at 94 percent. In total, BIPOC staffers represent less than seven percent of all Republican staff, and just over one quarter of Democratic staff. In contrast, the U.S. census estimates that only 60.1 percent of the U.S. population is white, non-Hispanic.
Table 2 | Staffer Race and Ethnicity, by Party (Percent)
| Race/Ethnicity | Democrats | Republicans | Difference |
|---|---|---|---|
| Caucasian | 73 | 94 | -21 |
| Black | 12 | 2 | 10 |
| Hispanic | 7 | 2 | 5 |
| Asian-American/Pacific Islander | 7 | 2 | 5 |
| Arab/Persian | 1 | < 1 | < 1 |
| American-Indian/Alaska Native | < 1 | < 1 | < 1 |
| Biracial | < 1 | 0 | < 1 |
Notes: N = 6,505 staff meeting our sampling criteria, described in detail in section 6.2.
Using this same external data provided by LegiStorm, we report congressional staff gender by party in 2019 in Table 3. Democratic staff are evenly split, whereas males are overrepresented among Republican staff.
Table 3 | Staffer Gender, by Party (Percent)
| Democratic | Republican | |
|---|---|---|
| Male | 50 | 60 |
| Female | 50 | 40 |
Notes: N = 6,505 staff meeting our sampling criteria, described in detail in section 6.2.
As with the race and ethnicity information, here we are limited to LegiStorm codes identifying staffers exclusively with a binary salutation of “Mr.” or “Ms,” which does not fully reflect staffer gender identity. As such, these data do not speak to the significant issues of representation of gender non-conforming and trans people in Congress.
In the 2019 CCS, we ask a more nuanced question regarding gender identity: One out of 249 staffers that answered this question self-identified as trans and zero staffers self-identified as non-binary, or opted to self-describe using the free text field provided.
Analysis of our survey respondents does reveal important differences in legislative staff by gender. Female staffers are substantially more likely to hold jobs of mid-level seniority, such as legislative assistant. But, women are less likely to serve in senior positions like CoS or legislative director than their male counterparts.7 These results are similar to studies showing women face significant challenges rising through the staff hierarchy on Capitol Hill.
Table 4 | Staffer Seniority, by Gender (Percent)
| 2017 | 2017 | 2019 | 2019 | |
|---|---|---|---|---|
| Male | Female | Male | Female | |
| Senior | 22 | 17 | 33 | 22 |
| Mid-level | 55 | 67 | 56 | 69 |
| Junior | 22 | 16 | 11 | 9 |
Notes: Cells are weighted frequency percentages. Rounded percentages may not sum to 100 percent.
Staffers’ primary responsibility is gendered as well. Table 5 shows the percentage of men and women in different roles. While female staffers served in legislative functions at similar rates in 2017 and 2019, they were substantially more likely to serve in communications and less likely to serve in the political leadership functions, which are often the most highly compensated and powerful within an office.
Table 5 | Staffer Responsibility, by Gender (Percent)
| 2017 | 2017 | 2019 | 2019 | |
|---|---|---|---|---|
| Male | Female | Male | Female | |
| Political Leadership | 18 | 11 | 17 | 11 |
| Legislative | 74 | 75 | 70 | 71 |
| Communications | 8 | 14 | 14 | 17 |
Notes: Cells are weighted frequency percentages. Rounded percentages may not sum to 100 percent.
Staffer Age and Tenure on Capitol Hill
The CCS and the associated payroll data for staffers in our sample reveal several intuitive and surprising results. We know staff age and tenure have been declining on Capitol Hill since at least the mid-1990s.8 Here, we dig deeper to reveal what individual factors are associated with age and tenure.
Table 6 reveals that the typical staffer is between 26 and 30 years old. Capitol Hill is staffed primarily by Millennials. Roughly 60 percent of the congressional staffer population is under the age of 35, and 75 percent under 40 years old. Most members are Baby Boomers, but less than 10 percent of their staff are of the same generation.9
Table 6 | Staffer Age (Percent)
| 2017 | 2019 | Combined | |
|---|---|---|---|
| Under 25 years old | 15 | 13 | 14 |
| 26-30 | 25 | 27 | 26 |
| 31-35 | 18 | 22 | 20 |
| 36-40 | 14 | 17 | 15 |
| 41-45 | 11 | 9 | 10 |
| 46-50 | 5 | 6 | 6 |
| 51-55 | 5 | 3 | 4 |
| 56-60 | 3 | 2 | 2 |
| 60 or older | 4 | 1 | 3 |
Notes: Exact age is binned to maintain respondent confidentiality. Cells are weighted frequency percentages. Rounded percentages may not sum to 100 percent.
Staffers can’t grow old in their jobs if they don’t stay very long. In 2019, the average tenure for staff on Capitol Hill is 3.1 (SD = 1.9) years, which may vary between 2.9 and 3.3 for the full population of staffers due to sampling uncertainty.10 Despite that short time in the institution, staff hold multiple positions within an office and may move between offices. Just over half of staffers in our survey held three separate or more job titles, and two-thirds have worked for at least three separate employing offices. Results not shown here show that tenure in the job does not vary much across different employing offices.
However, the number of years working in Congress does vary meaningfully for senior staff and for those in political management positions. Figure 6 is a box-and-whiskers scatterplot for tenure in Congress by the three primary responsibilities in a Washington, D.C. personal office. The median communications and legislative staffers’ tenure have roughly three years of experience on the Hill each, reflecting the overall average. However, communications staff are more concentrated around the average tenure.
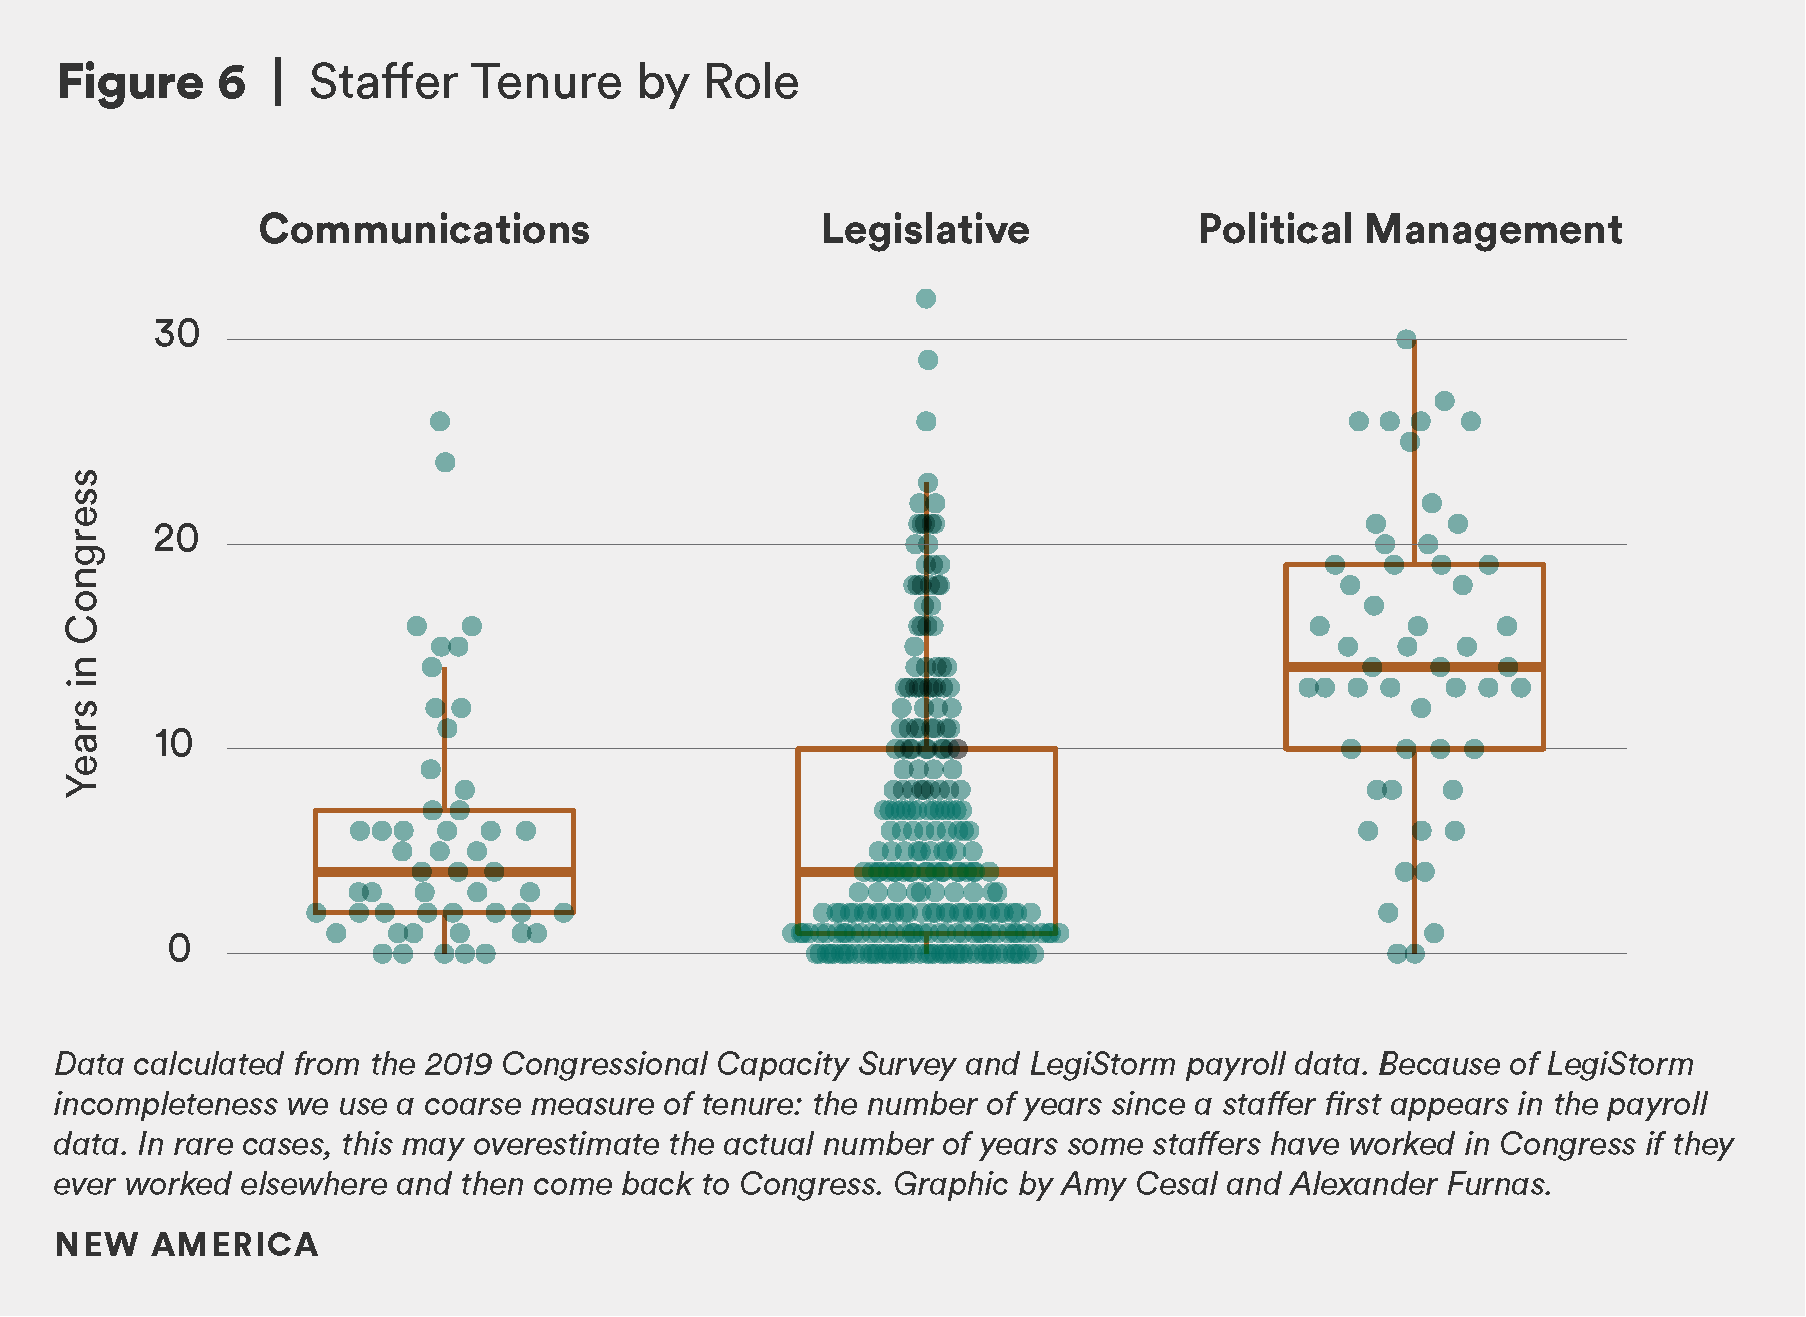
Alternatively, staff in the upper quartile (e.g., those above the box) have at least 10 years of experience in Congress. But these long-serving legislative staffers are not the norm. The concentration of staff around the bottom quartile reveals that most staff that manage policy portfolios in Congress have only one or two years of experience. That is, roughly one-third of legislative staffers have not yet served the duration of a single Congress.
Senior staffers in political management positions on the other hand are highly experienced in Congress, as may be expected. The typical staffer in a political management role has spent more than 14 years on Capitol Hill, and the outliers above the 75th percentile have been on the Hill for 20 or more years. This experience is greater than the typical member, who in the 116th Congress has served 8.4 (House) or 10.1 (Senate) years.11
Career Trajectories on Capitol Hill
Most staff work in Congress for very little time compared to most professions.12 And, they typically get started with an unpaid or low-paying internship. Though the House and Senate have recently set aside money outside the MRA and SOPOEA to fund internships, most current mid- and senior-level staffers were not eligible for them when they got their start. And, though these funds are a step in the right direction, the House makes only enough money available for one FTE intern per office at a rate of $15 per hour; the Senate internship money can fund two FTEs.13
In addition, anecdotal evidence from interviews and conversations with current staffers suggests that many started their internships after graduating college. This practice amounts to unpaid or extremely low-paid labor, but no publicly available evidence exists to know how common the practice is. As a consequence of the sellers’ labor market we document above, it is not surprising that staff are willing to accept unpaid work as a foot in the door.
Just over half of all respondents started their congressional staff careers as interns. Table 7 shows a fairly sharp decline from 2017 to 2019, though that may be due to the Democrats’ net gain of 41 seats in the 2018 elections. With 90 new members of the House and nine freshman senators, it is likely that new members recruited a disproportionately large number of staff from the campaign trail or from previous elected offices.
Table 7. Staff Starting in Congress as Interns
| 2017 | 2019 | Combined | |
|---|---|---|---|
| No internship | 41 | 50 | 46 |
| Internship | 59 | 50 | 55 |
Notes: Cells are weighted frequency percentages. Rounded percentages may not sum to 100 percent.
The overwhelming majority of staff who did start with an internship did so without any pay. Table 8 reveals that more than four in five (83 percent) started with an internship in Washington, with only 10 percent starting in a district or state office. Unpaid internships outnumber paid internships at nearly four to one (ratio: 3.7:1). That is, 79 percent of internships on Capitol Hill are unpaid, a rate almost twice that of the private sector.14 All told, more than two of every five staffers on Capitol Hill started their careers as unpaid employees of the legislative branch.15
Table 8 | Paid and Unpaid Internships in Congress
| 2017 | 2019 | Combined | |
|---|---|---|---|
| Washington, DC office | 57 | 72 | 64 |
| District or state office | 15 | 5 | 10 |
| With campaign | 5 | 4 | 5 |
| Washington, DC office | 19 | 17 | 18 |
| District or state office | 1 | 0 | 1 |
| With campaign | 2 | 2 | 2 |
Notes: Cells are weighted frequency percentages. Respondents include only those responding “internship” reported in Table 3. Rounded percentages may not sum to 100 percent.
Of course, internships offer valuable work experience and exposure to how Congress works, and Congress (as well as other government and nonprofit employers) is not bound by the Fair Labor Standards Act, which applies only to for-profit employers. Furthermore, Congress is generally exempt from the labor laws it enacts, and is bound only by its own rules, constitutionally. Each chamber has adopted some workplace protections such as those for sexual harassment, but the rules typically permit members to hire and fire staff as they please. In principle, though, there is nothing stopping employing offices from following labor law guidelines for congressional interns, especially because they so frequently mark the beginning of staffers’ careers.16
In addition to being unpaid, internships are frequently the product of networking opportunities, which further limits access to future careers on the Hill. According to the senior staffer who is “normally one of very few African Americans at the table,” despite efforts on the Hill to conduct outreach, there are often fewer professional network opportunities for prospective BIPOC interns, compared to their white peers.
We try to do pipeline stuff. So we work with [Historically Black Colleges and Universities,] and the caucuses.17 All the caucuses have programs, like fellowship and internship programs… I think you have to be very intentional about it because you know that only some people are getting into the internships in the first place. So you just have to be very intentional about it. We do significant outreach and try to make sure we're always letting people know.
More precise data on interns and their experiences was not available for this study, as LegiStorm data on interns and entry-level positions are not available and very few or no interns responded to the CCS survey. However, a study conducted by Dr. James Jones estimates that in the summer of 2019, the House of Representatives’ intern class was 64 percent white, 13 percent Black, 5 percent Hispanic/Latino, 11 percent Asian/Pacific Islander, 0 percent Native American, and 3 percent Middle Eastern/North African.18 Ultimately, the dependence on unpaid internships for future careers on Capitol Hill suggests that they act as a significant obstacle to developing a more diverse legislative workforce.
Internships are how most staffers enter Congress. How do they exit? The low pay and long hours (see below) are associated with the decades-long trend that staffers’ tenure in Congress is decreasing. But the aggregate data do not speak to the reasons why staff leave or where they plan to go. The CCS permits us to dig deep into individual staffers’ intent to stay or leave Congress, and if they leave, where they anticipate going.
Table 9 reveals that 65 percent of staffers plan to leave Congress within five years. But on Capitol Hill five years is a professional lifetime. More than two of every five staffers plan to leave within just two years. That is, 43 percent of staff plan to depart by the end of the Congress in which they are employed. In the business and nonprofit world, an organization expecting to lose nearly half its workforce by the end of its industry’s normal business cycle would be considered a colossal failure. Congress, on the other hand, is reducing staffers’ pay while expecting unusually long hours.
Table 9 | Intent to Leave Congress (Percent)
| 2017 | 2019 | Combined | |
|---|---|---|---|
| Within 1 year | 10 | 18 | 14 |
| 1-2 years | 34 | 23 | 29 |
| 3-5 | 33 | 30 | 32 |
| 6-10 | 20 | 15 | 18 |
| More than 10 | 12 | 14 | 13 |
Notes: Cells are weighted frequency percentages. Rounded percentages may not sum to 100 percent.
Only a small proportion of staff—6 percent across both surveys—anticipate working in Congress until they retire. Roughly half intend to stay in government or in public service more broadly. The remaining 43 percent plan to move into the private sector in some capacity. In 2019, staff in Democratic offices (64 percent) were about twice as likely to want to stay in public service than their Republican counterparts (36 percent).
Table 10 | Ideal Next Career Step (Percent)
| 2017 | 2019 | Combined | |
|---|---|---|---|
| Likely retire | 7 | 5 | 6 |
| Move into private sector | 45 | 41 | 43 |
| Stay in government | 48 | 54 | 51 |
Notes: Cells are weighted frequency percentages. Response of “Don’t know” or “other” excluded. Rounded percentages may not sum to 100 percent.
Among those staff who envision staying in government in some capacity, more than half (55 percent) hope to stay in Congress. Therefore, the conditional probability that a person plans to both stay in government and continue working in Congress (rather than seek any other option in the public or private sector) is only 28 percent. Another way to look at these results: Congress is an unattractive employer in the long run for nearly half of the respondents who want to continue their careers in public service, and almost two of every five staffers overall.
Moreover, Table 11 shows the intent to stay in Congress declined from 62 percent in 2017 to 48 percent in 2019, a more than 14 percentage point drop. Staff are slightly more likely to want to move to a different office, which is consistent with Capitol Hill norms and research suggesting that experience for multiple members improves staffers’ professional reputations.19
Table 11 | Next Step if Staying in Government (Percent)
| 2017 | 2019 | Combined | |
|---|---|---|---|
| Stay in Congress, same office | 30 | 22 | 26 |
| Stay in Congress, different office | 32 | 26 | 29 |
| Move to the White House | 13 | 13 | 13 |
| Move to federal agency | 19 | 24 | 22 |
| Move to state government | 2 | 7 | 5 |
| Other | 4 | 8 | 6 |
Notes: Cells are weighted frequency percentages. Respondents include only those responding ”stay in government” reported in Table 6. Rounded percentages may not sum to 100 percent.
Roughly one-third of the staffer sample hopes to use their experience on Capitol Hill to move to the executive branch. Only about one in twenty plan to go to state and local government or some other form of government service, respectively.
Staff seeking to exit public service for the private sector mostly want to land on K Street. In Table 12, roughly half of the staffers who want to go into the private sector want to be a lobbyist.20 It’s no wonder, since staff can expect to earn at least three times as much as a lobbyist, and maybe more depending on their experience.21 No other option even comes close, with the general response of working at a think tank or university—which typically requires advanced credentials or decades of distinguished public service—coming in a distant second.
Table 12 | Next Step if Moving to Private Sector (Percent)
| 2017 | 2019 | Combined | |
|---|---|---|---|
| Government relations / lobbying / policy advising | 50 | 46 | 48 |
| Research / think tank / university | 10 | 19 | 15 |
| Start your own business unrelated to politics or government | 6 | 6 | 6 |
| Election campaign / campaign consulting | 2 | 2 | 2 |
| Political party organization (DNC, RNC, RNCC...) | 2 | 1 | 2 |
| Other (different industry, graduate / law school...) | 30 | 26 | 28 |
Notes: Cells are weighted frequency percentages. Respondents include only those responding “move into private sector” reported in Table 6. The “Other” residual category includes several response options that are inconsistent across 2017 and 2019. Rounded percentages may not sum to 100 percent.
The conclusion to draw here is that Congress—with its declining pay, demanding expectations, and short job tenure—is subsidizing the lobbying industry. For the most part, working on the Hill is an entry-level position for K Street, rather than a stepping stone for a career in public service. Members of Congress pay little attention to these trends so long as their immediate staffing needs are met, and staff use their brief experience on the Hill as a résumé boost. The taxpayers foot the bill, and special interests come out on top.
Workload and Job Satisfaction
Congressional staff are overworked and underappreciated. The average staffer works more than 50 hours per week and earns less than $40,000 per year. Table 13 reveals that in both Congresses about two-thirds of all staffers work more than 50 hours per week, and one in five work more than 60 hours. These kinds of wages and hours put the median staffer on par with truck drivers and oil-rig roustabouts.22
Table 13 | Number of Work Hours Per Week (Percent)
| 2017 | 2019 | Combined | |
|---|---|---|---|
| < 40 hours | 2 | 1 | 1 |
| 40-49 | 31 | 36 | 33 |
| 50-59 | 46 | 43 | 44 |
| 60-69 | 15 | 14 | 15 |
| 70 + | 6 | 5 | 5 |
Notes: Cells are weighted frequency percentages. Rounded percentages may not sum to 100 percent.
It is common for Washington offices to remain open during normal business hours fitting the district, and members typically expect staff to be present while in session or at after-hour events. Congress today, if they meet at all, typically do so Tuesday through Thursday. When Congress finds itself negotiating “must-pass” bills, the chambers can only act after party leaders reach 11th-hour agreements. As late evening and even weekend votes have become more common given shorter and fewer legislative work weeks—one impact of the Contract with America-inspired shift for members to “go home” as much as possible—it has become increasingly common for staff to be expected to work extended hours. These kinds of tasks are not common outside the congressional workplace, and are considered to be part of the job.
This extra time is not separately compensated. Coupled with relatively low annual salaries, this atmosphere contributes to the common view that staff are under-appreciated and that they need to leave the institution. Given the pressures of a sellers’ labor market on Capitol Hill and the strong norm of loyalty toward the boss, few staff feel empowered to work a typical nine-to-five work week.
Work hours are not distributed equally across all levels of seniority, though. More than one-third of senior staff—defined here as those with supervisory authority, such as CoS, committee staff director, legislative director, and the like—work more than 60 hours per week on average.
Table 14 | Number of Work Hours Per Week, by Seniority (Percent)
| 2017 CCS | 2017 CCS | 2017 CCS | 2019 CCS | 2019 CCS | 2019 CCS | |
|---|---|---|---|---|---|---|
| Junior | Mid-level | Senior | Junior | Mid-level | Senior | |
| < 40 hours | 0 | 3 | 0 | 0 | 2 | 0 |
| 40-49 | 34 | 34 | 18 | 32 | 42 | 23 |
| 50-59 | 44 | 48 | 45 | 59 | 41 | 43 |
| 60-69 | 13 | 11 | 26 | 9 | 11 | 25 |
| 70 + | 9 | 4 | 11 | 0 | 4 | 10 |
Notes: Cells are weighted frequency percentages. Rounded percentages may not sum to 100 percent.
Despite the long hours and low pay, staff at least superficially report that they are satisfied with their work, as shown in Table 15. Based on interviews and informal conversations with current and former staff, working in Congress—even though today’s “Executive-dominated” politics remains the focal point of any and all issues of the day—is exciting, prestigious, and stimulating.
Table 15 | Job Satisfaction: Staffers’ Sense of Belonging In… (Percent)
| Your Office? | Congress? | Institutional Deficit | |
|---|---|---|---|
| Very strong | 36 | 23 | -13 |
| Strong | 40 | 38 | -2 |
| Neither weak nor strong | 15 | 24 | 9 |
| Weak | 8 | 13 | 5 |
| Very weak | 1 | 2 | 1 |
Notes: This question was only asked in 2019. Cells are weighted frequency percentages. Rounded percentages may not sum to 100 percent.
Contrary to studies that ask direct questions about job satisfaction23 that are known to invite socially desirable responses, the 2019 CCS instead asked about staffers’ sense of belonging.24 The sense-of-belonging concept has been shown to more accurately reflect employees’ non-conscious feelings of engagement with their employers. And, more importantly, it is a superior measure to distinguish workers’ feelings of job satisfaction toward their specific employing unit and the employer more generally.25
Our results bear this out. More than three-quarters of staff feel a strong or very strong sense of belonging to their own office, suggesting staff feel engaged with their boss’s vision and strategy. In a recent study of a national sample of workers in a variety of industries, roughly 40 percent of people say they feel isolated. So, that only one in four staffers feel as if they do not belong in their employing office is a sign that the congressional workplace is doing something right. This is a puzzle: If employing offices do well to develop employee engagement, then why leave after only three years?
We asked staff to also rate their sense of belonging to the institutional as a whole, and the results offer some insight. Only about 60 percent of staffers feel very strongly or strongly to the institution as a whole. Given the low pay and the fact that Congress necessarily undergoes an institution-wide reorganization every two years, the relatively low sense of connection to the institution is not strong enough to retain staff.
We refer to the difference in sense of belonging to staffers’ own office and to Congress-at-large as the “institutional deficit.” In the last column of Table 11, we see a 15-point drop-off for staff who feel strongly or very strongly. In contrast to studies reporting relatively strong job satisfaction in Congress, this deficit suggests staffers’ connection to their jobs is on par with the typical worker in the national population. This is important because work in Congress assumes a strong public service motivation. Public service motivation is strongly correlated with a willingness to forego the material benefits offered in the private sector.26 Thus, work in Congress is a public service perfect storm: Rapidly declining wages, long hours, and the ever-present media and public perception that Congress is broken all make the K Street swamp an enticing career move.
Moreover, the relatively high sense of belonging to one’s employing office is not equal for traditionally underrepresented staffers. Table 16 reports the same office-to-Congress institutional deficit, but in relative terms for BIPOC and female staffers. In this table, the strong and weak categories are collapsed for simplification. In the cells are relative frequency percentages for each ethnic and gender category. The net deficit is the difference in institutional deficits between whites and people of color and between men and women, respectively.
Table 16 | Institutional Deficit for Minorities & Women
| Ethnicity | Ethnicity | Ethnicity | Gender | Gender | Gender | |
|---|---|---|---|---|---|---|
| BIPOC | White | Net Deficit | Female | Male | Net Deficit | |
| Strong / very strong | -23 | -14 | -9 | -19 | -12 | -7 |
| Neither strong nor weak | 20 | 8 | 12 | -2 | -2 | 0 |
| Weak / very weak | 3 | 6 | 3 | 0 | 0 | 0 |
Notes: This question was only asked in 2019. Cells are difference in weighted relative frequencies. Rounded percentages may not sum to 100 percent.
For the full population of staffers, the institutional deficit for sense of belonging is 15 percent in Table 15. However, the deficit for BIPOC staffers is a much higher 23 percent, for a net loss of 9 points. In other words, those staffers’ connection to Congress is much lower than the average employee nationwide. The same is true for women staffers, whose net deficit loss is 7 points. The number of women in the House and Senate has increased in recent years—most notably in 1992 and 2018—to be more descriptively representative of the population as a whole, but the data suggests that female staffers still experience lower feelings of belonging.
Staffer Knowledge and Expertise
An important implication of the high turnover and low tenure among congressional staff is that they have less time within the institution to develop specialized expertise that would make them more effective at their jobs. The CCS asks staffers several detailed knowledge questions to assess procedural knowledge about the institution and their policy knowledge in highly salient policy areas: health and budget. In other words, the CCS embeds a “pop quiz” within the survey on institutional procedures that are specifically tailored to the chamber in which they work. These factual questions could easily be Googled or quickly researched via CRS report, particularly as participants independently answered the survey questions online, but they are intended to measure instantaneous recall of highly specific questions that typically comes with higher order training and experience.
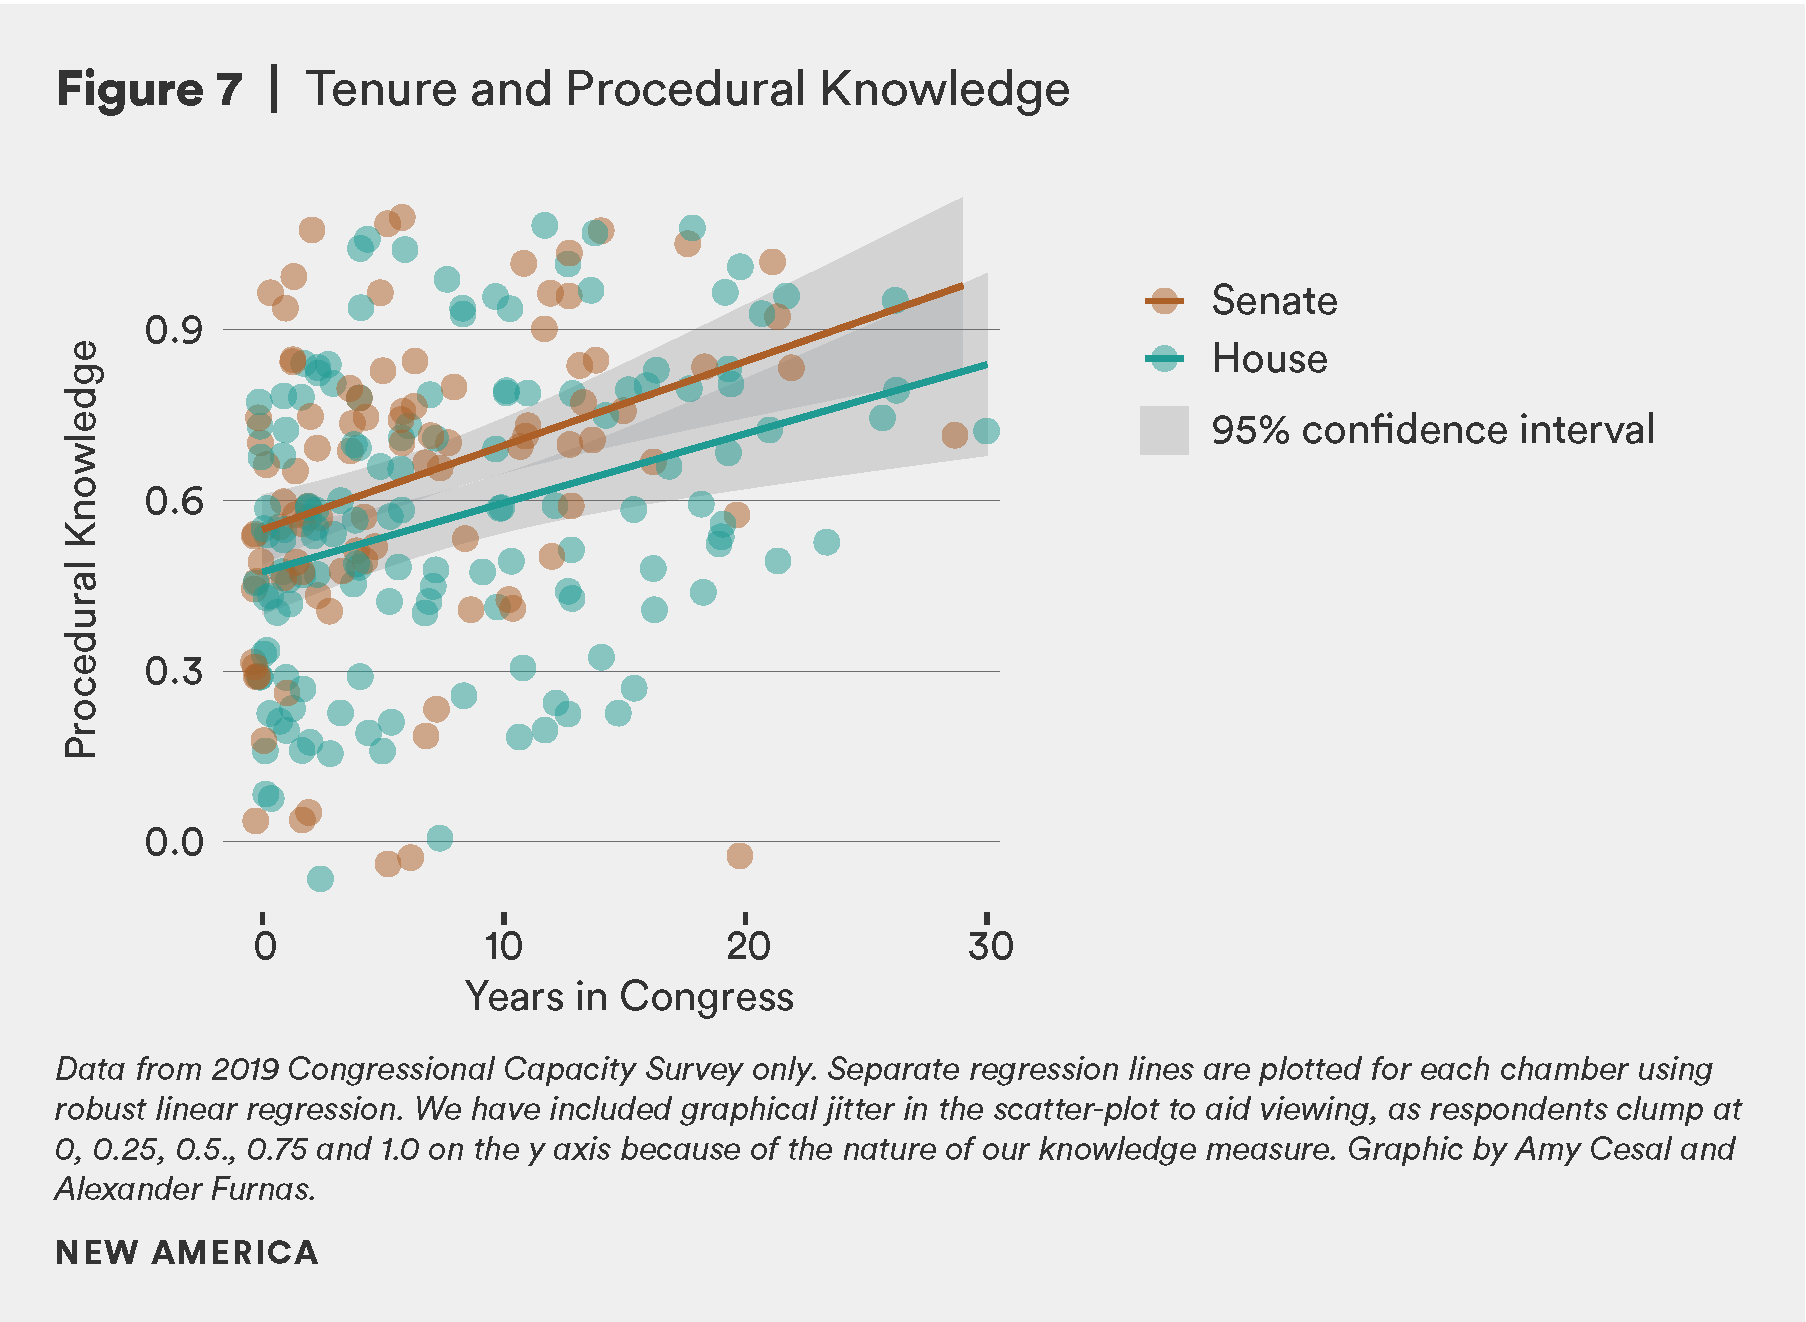
Our procedural knowledge batteries are made up of four questions such as “What does it mean to invoke ‘martial law’ in the House?” and “When does a cloture motion ripen?” We then construct knowledge variables using the percentage of answers in the battery that a staffer answers correctly.27
Figure 7 displays the relationship between staffers’ procedural knowledge and their tenure working in Congress. We find a robust relationship between time spent in the institution and staffers’ level of knowledge of the procedural intricacies of the institution. Interviews we conducted in 2017 bore out the importance of particularly knowledgeable staffers, skilled in legislative procedures at helping members of Congress achieve their policy goals. In addition, recent research notes that members with long-serving staffers are particularly effective, and that staffers have a measurable impact on their bosses’ agendas.28
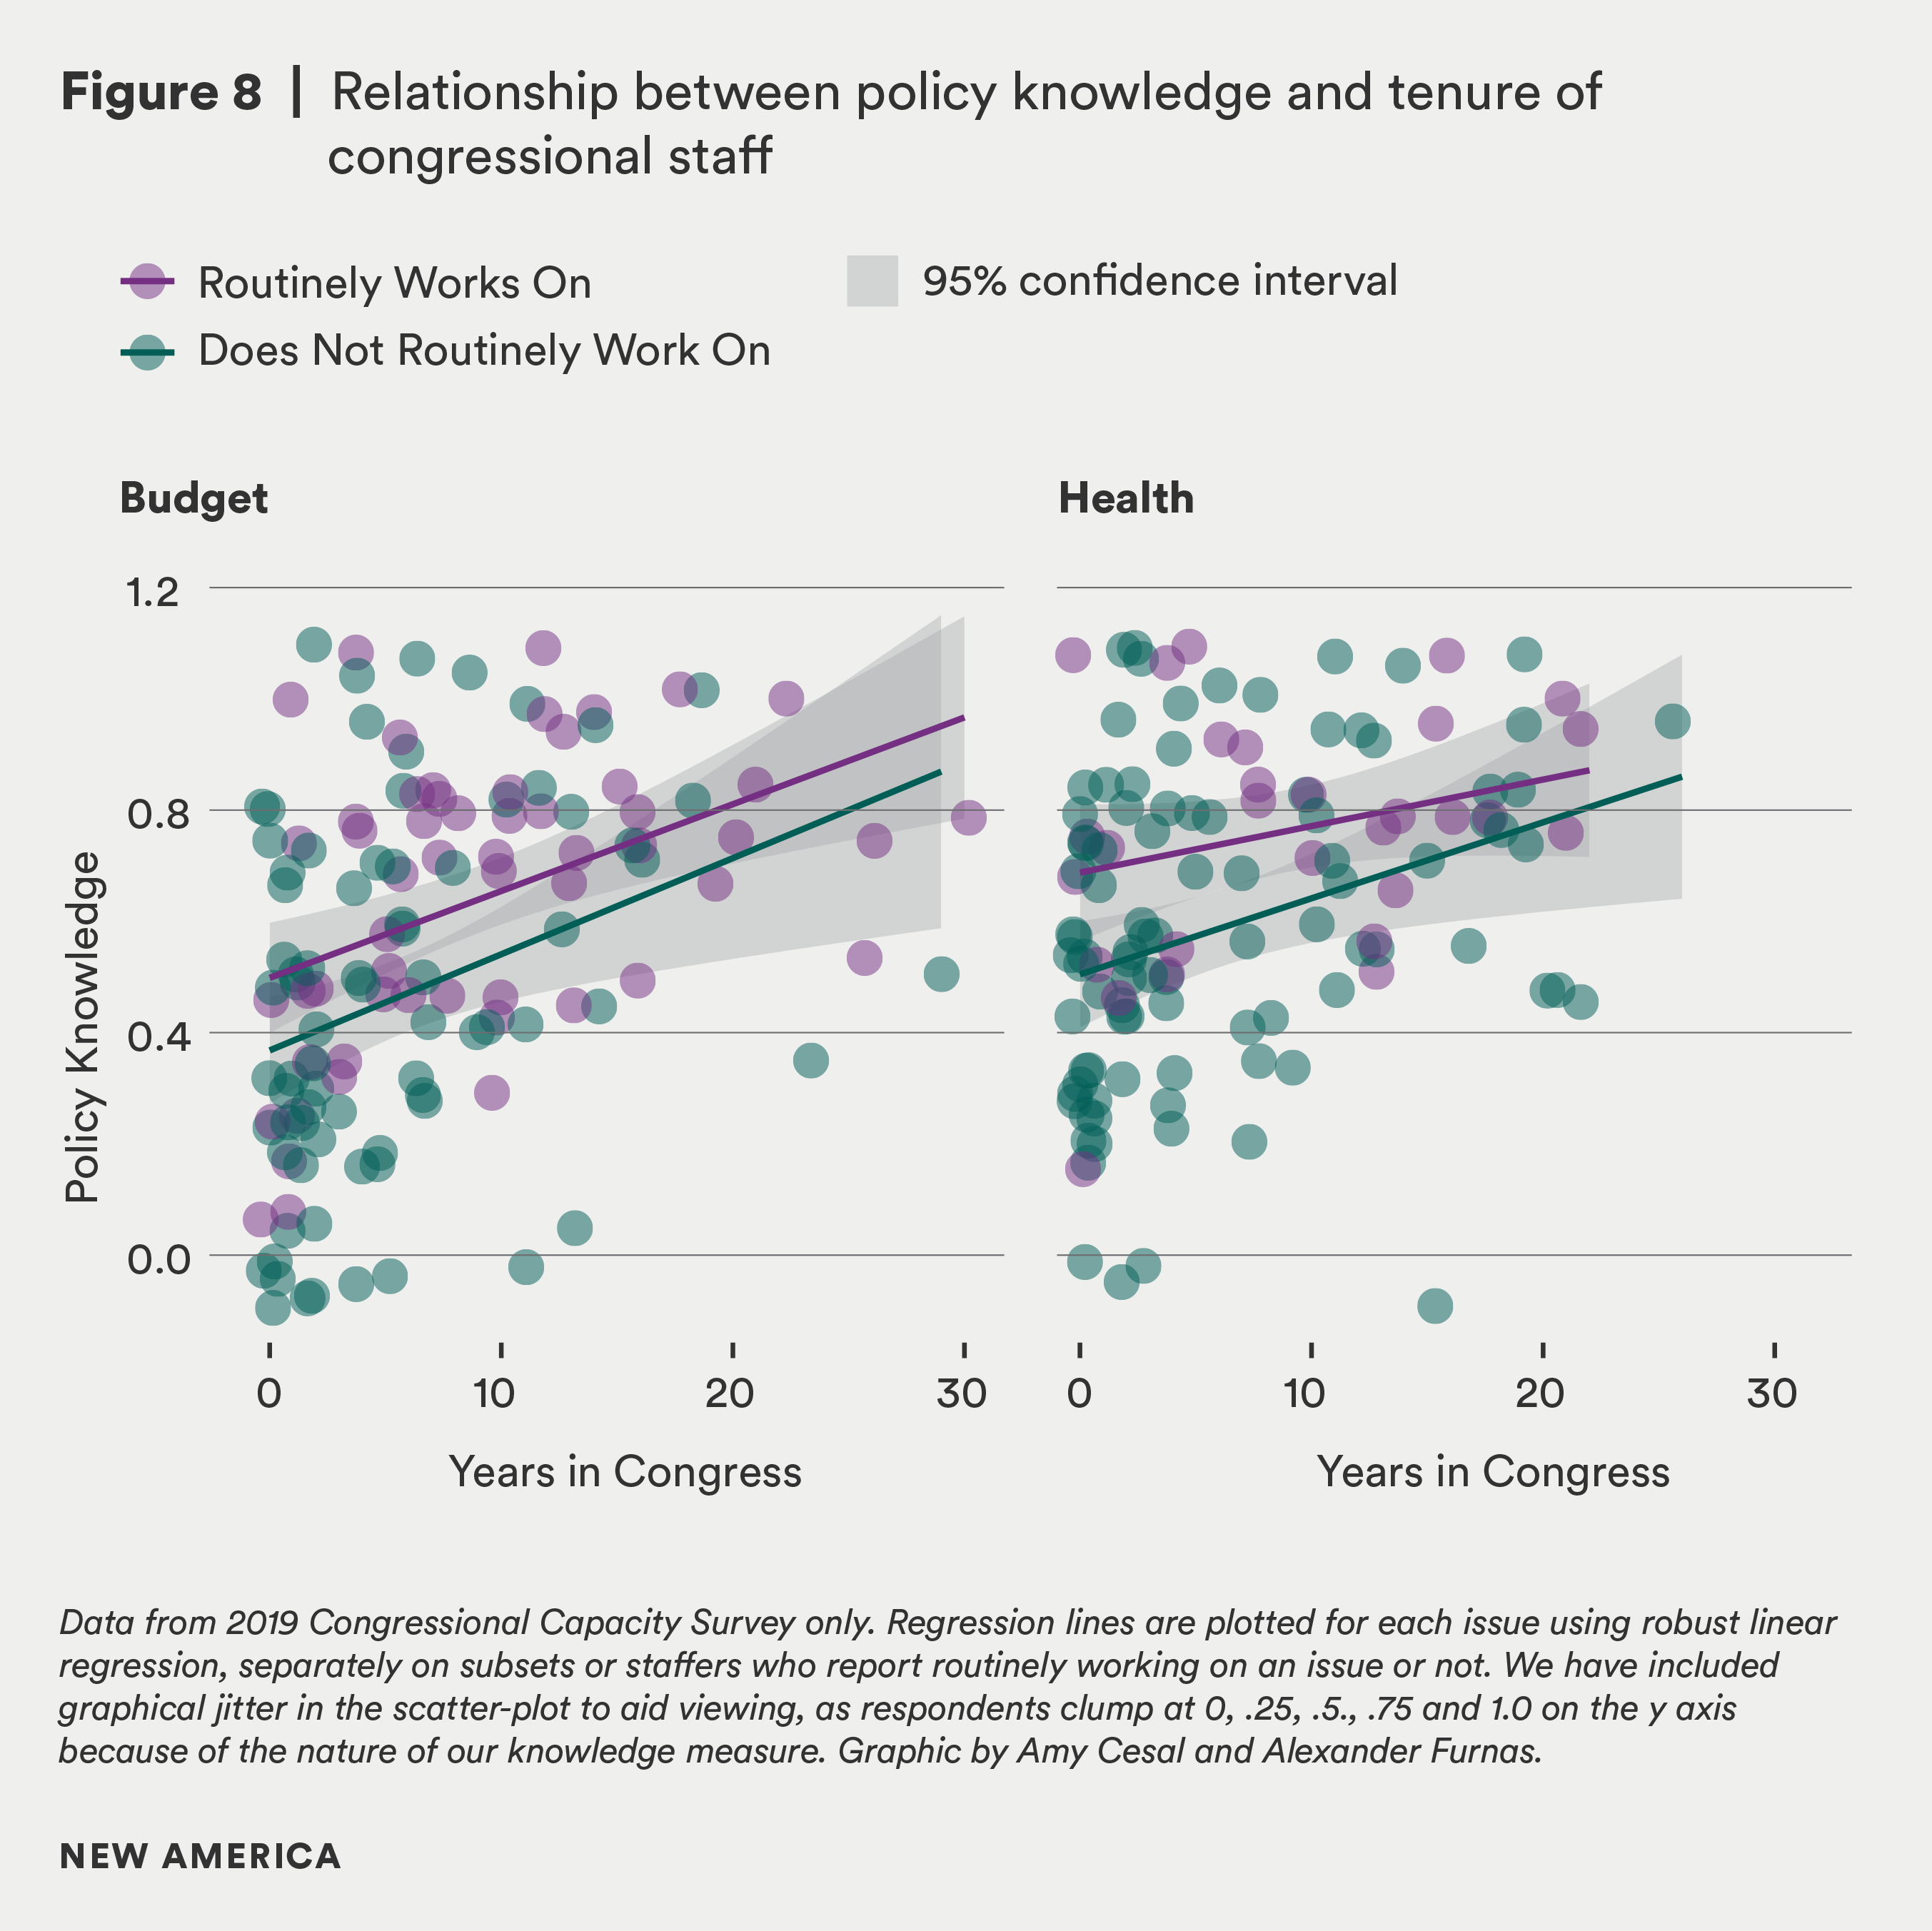
We assess knowledge of policy issues using the same approach we used to measure procedural knowledge. We had issue area experts draft four multiple-choice question batteries on budget and health issues (e.g. “About what percent of the federal budget is allocated through the annual appropriations process?” and “In 2017, total spending on health care in the US is ____, with roughly ___ spent on hospital care.”), and staffers were scored according to the percentage of questions they answered correctly.
We find a similarly strong relationship between tenure and knowledge of policy issues, shown in Figure 8. For both health and budgetary issues, staffers who have worked in the institution longer are more knowledgeable about the issues. This relationship holds whether staffers report routinely working on the issue they were asked about or not. Staffers who work on budget or health on a regular basis do tend to be more knowledgeable than those who do not, which may be unsurprising. As we show above, staff tenure tends to be very short, so most staffers do not accrue enough experience to have advanced policy knowledge, even on those topics within their issue portfolio.
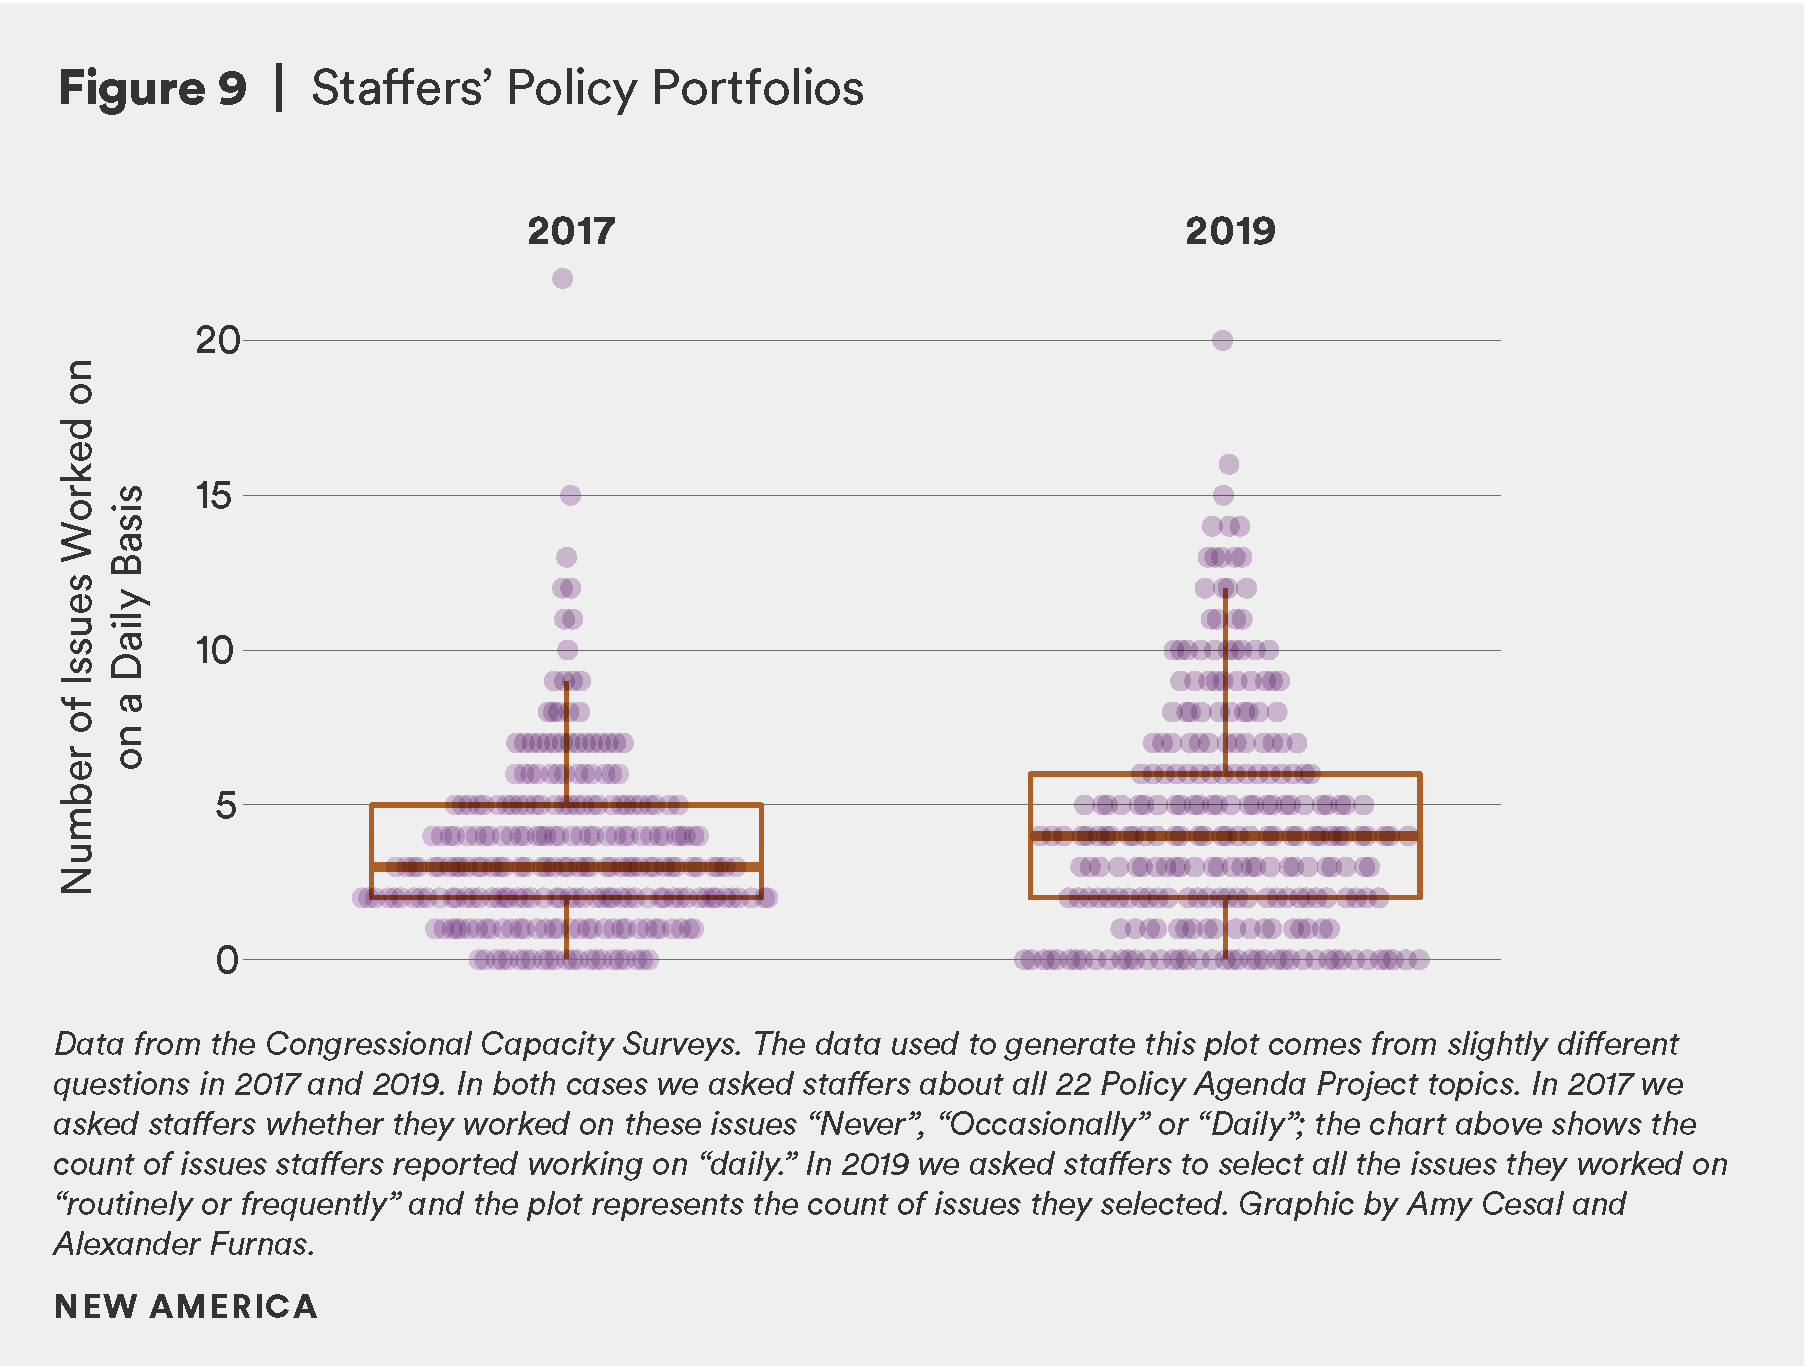
Not only do staffers rarely stay in the institution long enough to develop deep institutional and substantive expertise, they are often tasked with extensive portfolios which limit their ability to focus on a given issue. The typical legislative staffer works on between two and six issues on a daily basis. In most offices the “expert” staffer on an issue must still spread their attention across multiple other issue responsibilities.
This is particularly troubling given that these staffers routinely meet with lobbyists, advocates, and group representatives that spend all of their time focusing on a single issue that affects their interests. As a result, staffers are at an information and expertise disadvantage in almost every meeting they take with outside stakeholders.29 This information asymmetry can have a profound effect on how decisions are made.
While the typical staffer routinely works on almost a half-dozen issues, Figure 9 shows fully 25 percent report working on seven or more issues regularly. This enormous breadth in policy domain responsibility is as concerning as it is consistent with evidence of the shrinking size of members’ policy shops. These smaller teams force individual legislative staffers to cover ever-broader ranges of topics, which necessarily sacrifices the time and attention they can dedicate to any one issue on behalf of constituents.
The consequence of shrinking policy shops and expanding portfolios is that these staffers are not only being drawn to K Street for the pay, but also for the ability to focus on a narrower set of issues. They are drawn to develop expertise in a single space, which, for most, is more satisfying work.
Staffer Partisanship and Ideology
It is of course natural that staffers have their own partisan and ideological identities that are in line, yet distinct from their bosses. Staff are not ideological superconductors who perfectly reflect the opinions of their employers. But, to date, we don’t know how distinct their ideology and partisan commitments are from that of their bosses.
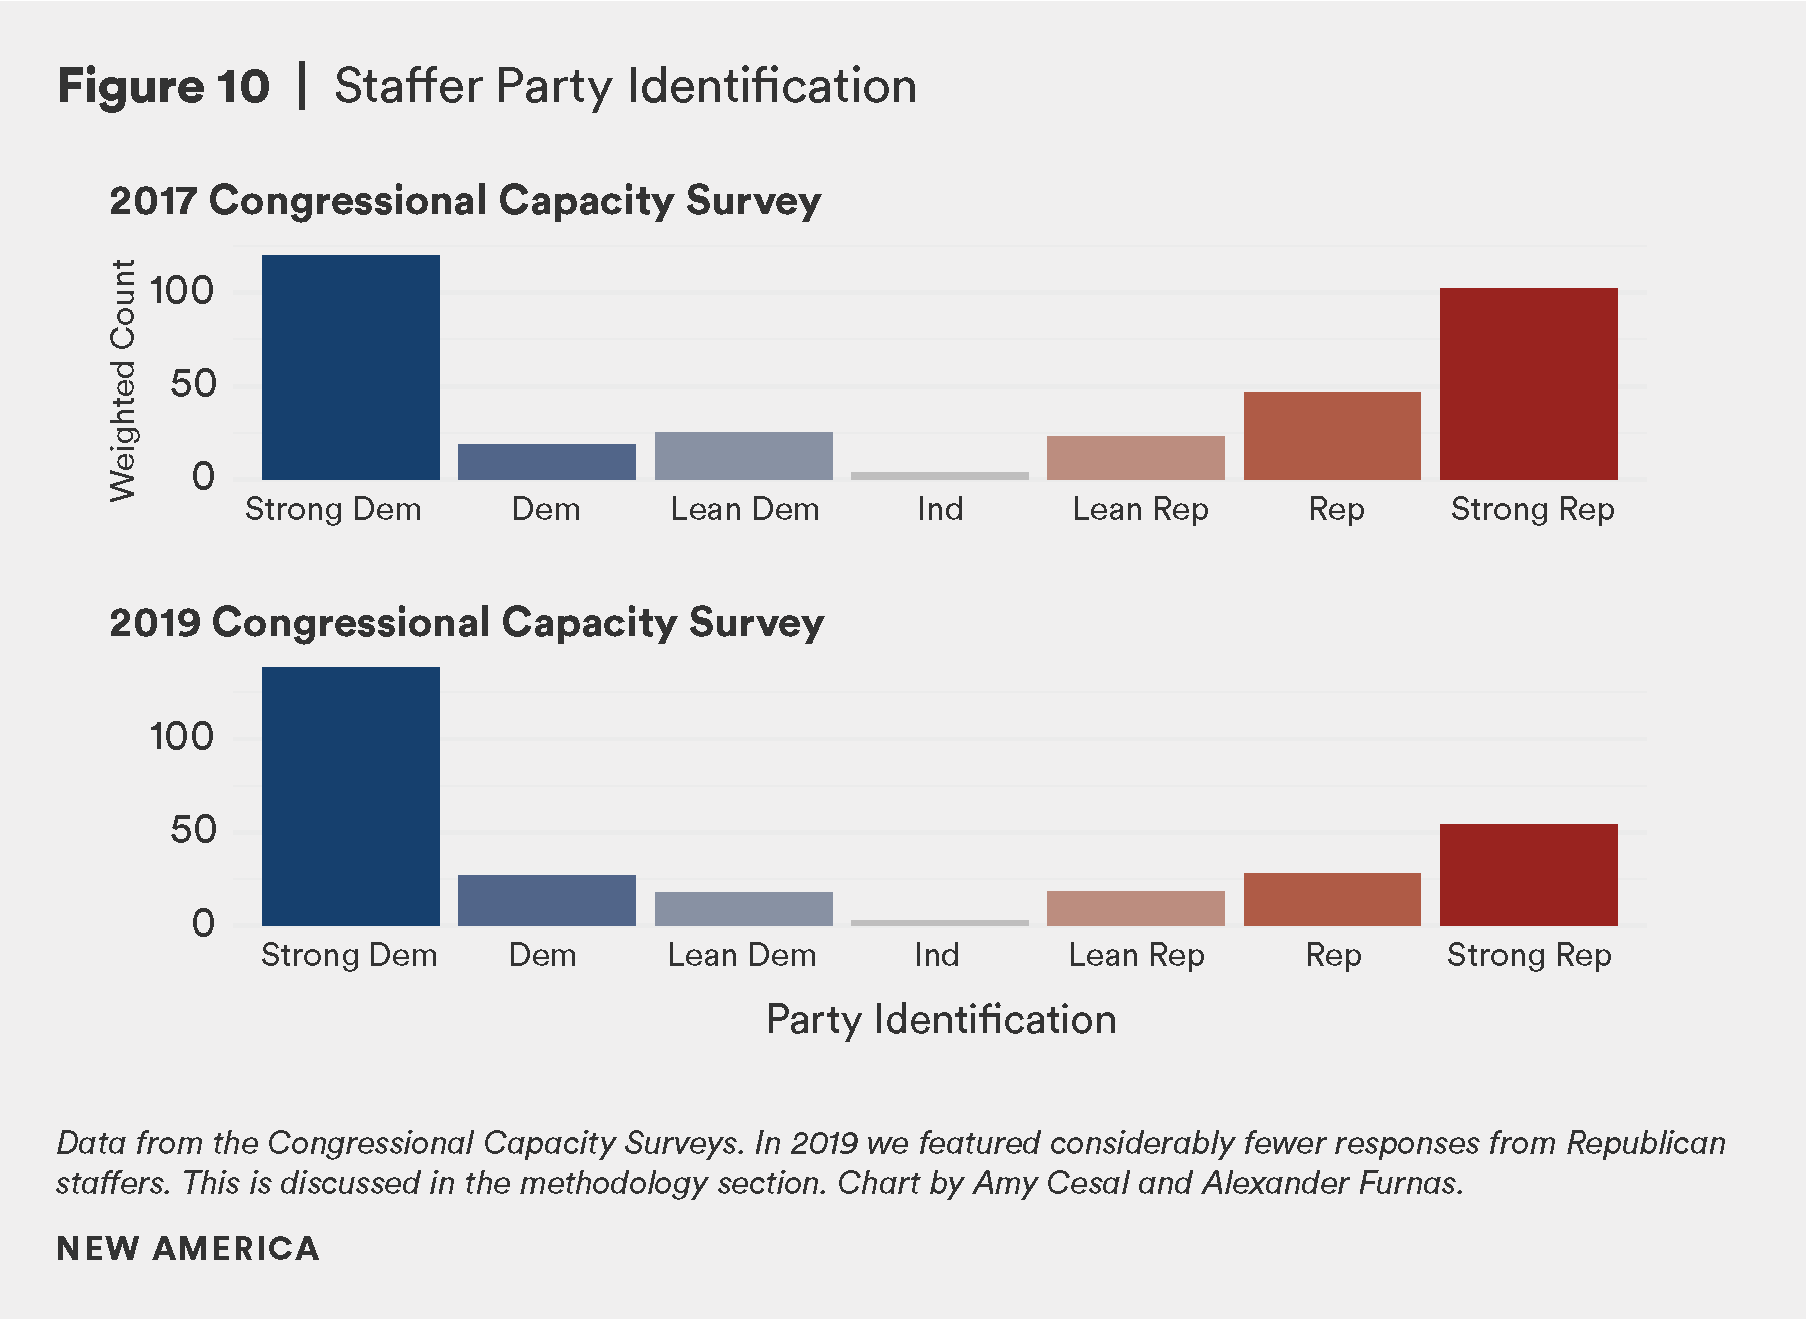
We ask staffers to report their partisanship using the discipline-standard battery, which measures if they generally think of themselves as Republicans, Democrats, Independents, or something else. If they select either major party, they are then asked whether they consider themselves a “strong” or “not very strong” Republican or Democrat. If respondents select independent or other, they are asked whether they think of themselves as “closer to the Democratic or Republican party.” These responses are recoded into the seven-point party identification scale shown in Figure 10 below.
Compared to average voters who self-report relatively weak attachments to both parties, congressional staffers are highly partisan. This is consistent between the two waves of data, with 65 percent of staffers identified as strong partisans in both. Approximately 73 percent of Democrats think of themselves as strong Democrats, compared to only 63 percent strong Republicans.
More importantly, Figure 11 shows that consistently strong partisanship translates into a high degree of ideological polarization. We measured ideology as a latent scale based on a standard five question battery about the size, scope, and role of government. Details on this measure are included in the methodology section.
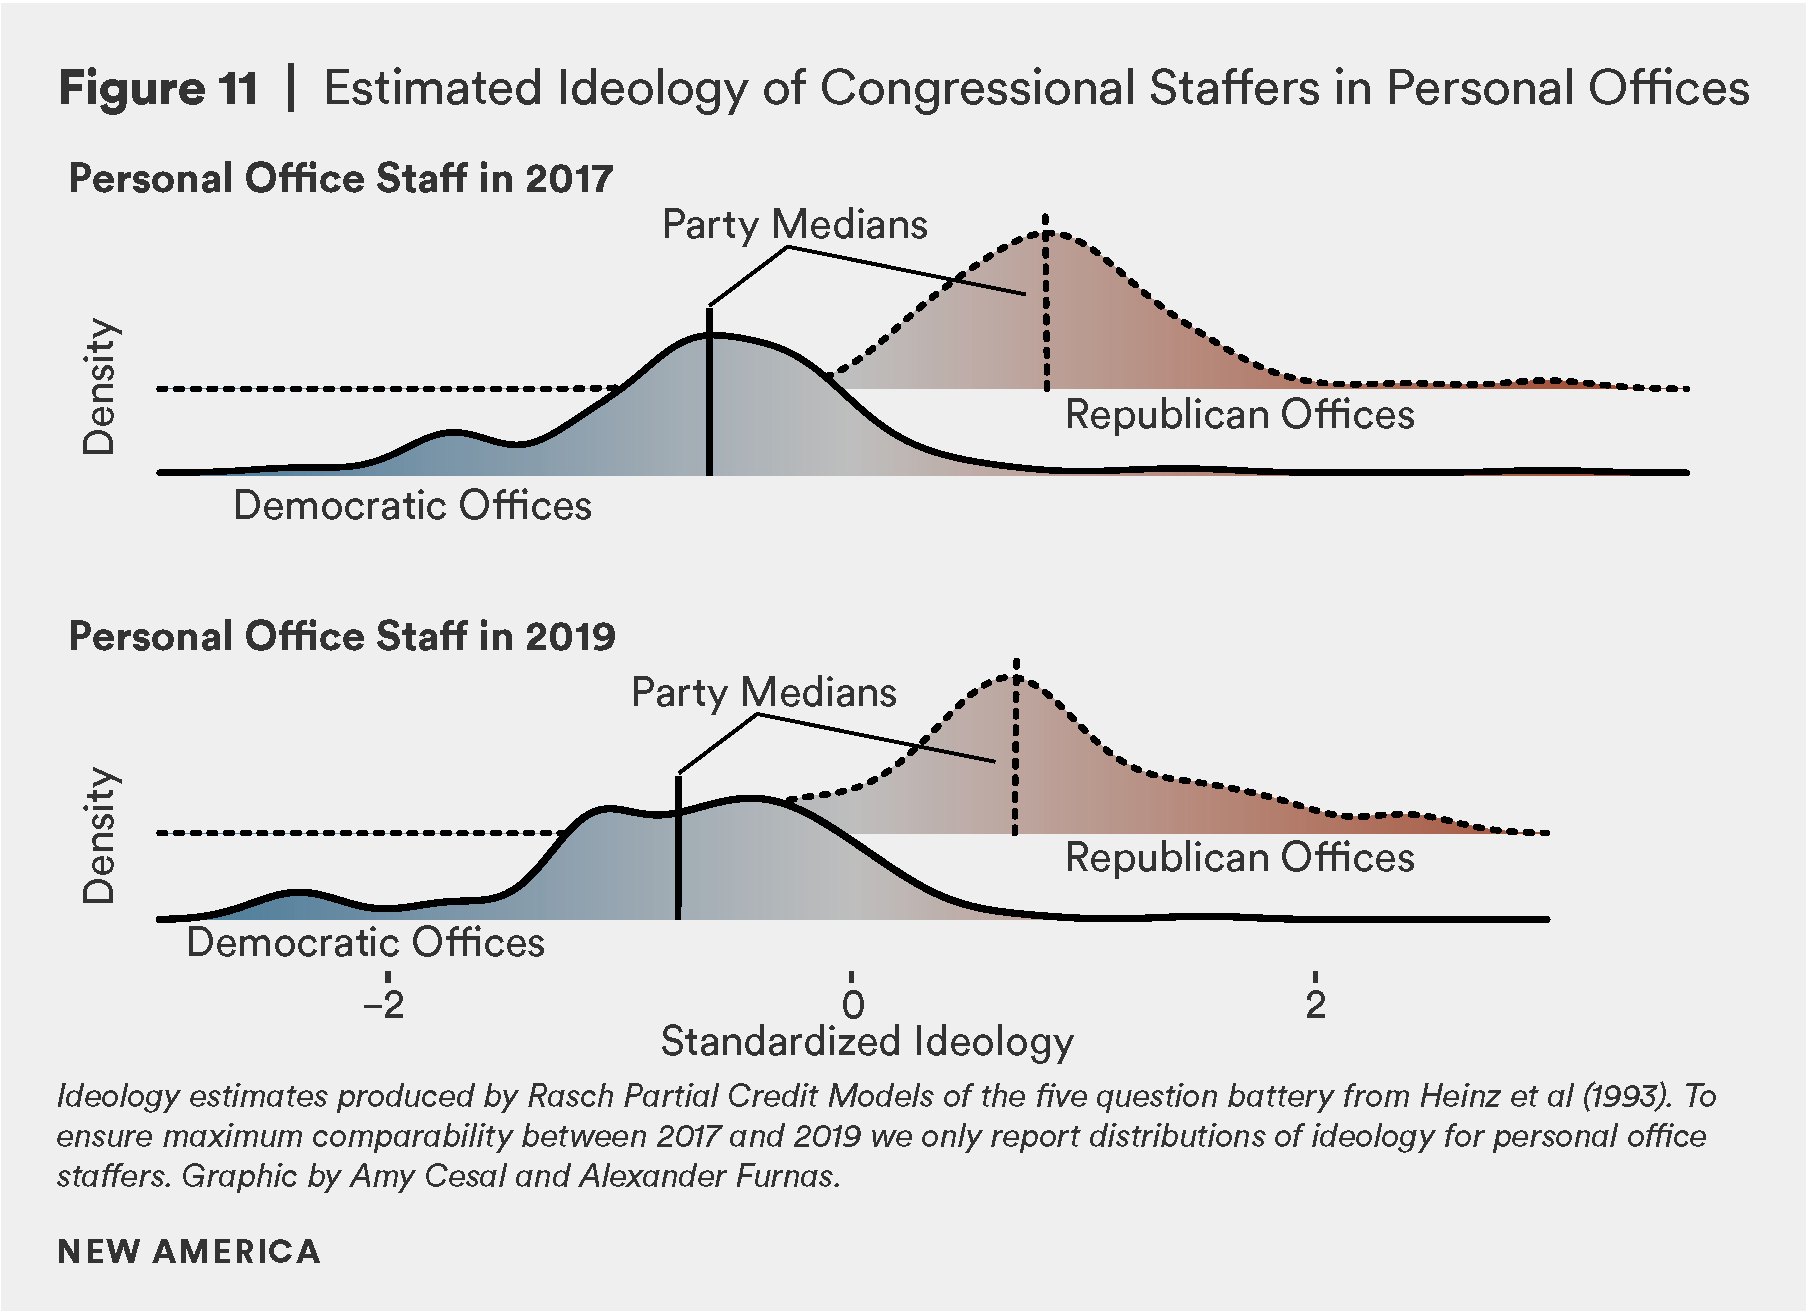
We observe relatively little overlap in the empirical distributions of staffers in offices of different parties.30 Not only do staffers strongly identify as partisan, they appear to hold consistently different positions from each other. This may not be surprising on its face, but does reinforce the fact that the congressional staffer labor market is partisan. Staffers’ own ideological orientations within their respective parties are distributed relatively normally.
Congressional dysfunction may not be driven simply by partisan animus, or the need for partisan politicians to generate clear distinctions between themselves and their opponents. Rather, the lack of bipartisanship and the concomitant gridlock may, at least in part, be driven by the fact that staffers who are hired to make the institution function substantively disagree about the role of government in addressing large issues like health care, consumer protection, and inequality. These results are particularly troubling since strong ideology and party identity are associated with exclusively using information from partisan-aligned sources.31
Citations
- The topline results we present are based on N ≈ 441 (5.2%) in 2017 and N ≈ 355 (5.4%) in 2019. All calculations use post-stratification weights to better approximate the sample’s representativeness and to improve the validity of our measures. See methodology section for greater detail.
- See appendix for a more detailed discussion of who qualifies as a “staffer” for the purposes of our analysis among the more than 11,000 employees on the Hill.
- Elsie L. Scott, Karra W. McCray, Donald Bell, Spencer Overton, Racial Diversity Among Top U.S. House Staff, (Washington, D.C.: Joint Center for Political and Economic Studies, 2018). source
- LaShonda Brenson, Racial Diversity Among Top Staff in Senate Personal Offices, (Washington, D.C.: Joint Center for Political and Economic Studies, 2020). source
- This phrase was first used in 1978 by Senator John Glenn in reference to the fact that federal workplace laws do not apply to Congress, which also decreased protections for staff against racial discrimination. James Jones, “John Glenn and the ‘Last Plantation,’” The Hill, December 9, 2016. source ; Lawrence Lerner, “Sociologist James Jones Dubs Congress America’s Last Plantation,” Rutgers University – Newark, April 21, 2017. source
- Here we only present racial, ethnic, and biological sex demographics for the 6,505 staffers in our 2019 survey sampling frame because similar data for 2017 is over 90 percent incomplete. The source is LegiStorm, which assigns a racial identity for congressional staff. Without knowing LegiStorm’s exact coding procedure, we recognize this to be an extremely problematic measure, as it may not accurately reflect the racial or ethnic self-identification of staffers themselves. Unfortunately, self-identification measures are not available for a census of congressional staff (Approximately 40 out of 355 CCS 2019 respondents identified as BIPOC), so we reluctantly use these data, albeit sparingly and with caution.
- Melinda N. Ritchie and Hye Young You, “Women’s Advancement in Politics: Evidence from Congressional Staff,” forthcoming The Journal of Politics, 2020.
- Casey Burgat, PhD dissertation. (College Park, MD: University of Maryland, 2019).
- Jennifer E. Manning, Membership of the 116th Congress: A Profile (Washington, DC: Congressional Research Service, 2019).
- 95% confidence interval about the mean.
- Manning, 2019.
- Note the roughly three-year tenure we report here is working in Congress overall, not in a single position or office. According to the Bureau of Labor Statistics, national average tenure per job is 4.2 years. Employee Tenure Summary, (Washington, D.C.: U.S. Bureau of Labor Statistics, 2018). source.
- See: Tim LaPira and Alexander Furnas, “Paying Congress’s interns a living wage is a good idea. Paying professional staff one is even better,” Vox, December 13, 2018. source
- Michael J. Gaynor, “43 percent of internships at for-profit companies don’t pay. This man is helping to change that,” The Washington Post, January 15, 2019. source
- Pr(Unpaid | Internship) = 79% unpaid internship × 55% any internship = 44%.
- Wage and Hour Division, “Fact Sheet #71: Internship Programs Under the Fair Labor Standards Act,” (Washington, D.C.: Department of Labor, 2018). source
- Though not explicit in this pull-quote from the interview transcript, it is clear that this staffer is referring to the Congressional Black Caucus, the Congressional Hispanic Caucus, and the Congressional Asian Pacific Islander Caucus from earlier in the interview.
- James R. Jones, The Color of Congress: Racial Representation Among Interns in the U.S. House of Representatives, (Washington, D.C.: Pay our Interns, 2020). source
- Jacob M. Montgomery and Brendan Nyhan, “The Effects of Congressional Staff Networks in the US House of Representatives,” The Journal of Politics 79, no. 3 (2017).
- It is not important here if their intended job would require formal lobbying disclosure, just that they intend to seek a job in the field of government relations, government affairs, policy advocacy, or related.
- LaPira and Thomas, 2017.
- See: “Average Commercial Truck Driver Hourly Pay,” Payscale. source and “Average Roustabout Hourly Pay,” Payscale. source
- Life in Congress: Job Satisfaction and Engagement of House and Senate Staff, (Washington, D.C.: Congressional Management Foundation and the Society for Human Resource Management, 2017). source
- Robert J. Fisher, “Social Desirability Bias and the Validity of Indirect Questioning,” Journal of Consumer Research 20, no. 2 (1993).
- Alan M. Saks, “Antecedents and consequences of employee engagement,” Journal of Managerial Psychology 21, no. 7(2006); Alan M. Saks, “Antecedents and consequences of employee engagement revisited,” Journal of Organizational Effectiveness: People and Performance 6, no.1 (2019); James K. Harter, Frank L. Schmidt, and Theodore L. Hayes, “Business-Unit-Level Relationship Between Employee Satisfaction, Employee Engagement, and Business Outcomes: A Meta-Analysis,” Journal of Applied Psychology 87, no. 2 (2007).
- James L. Perry, “Measuring Public Service Motivation: An Assessment of Construct Reliability and Validity,” Journal of Public Administration Research and Theory 6, no. 1 (1996); Adrian Ritz, Gene A. Brewer, and Oliver Neumann, “Public Service Motivation: A Systematic Literature Review and Outlook,” Public Administration Review 76, no. 3 (2016).
- We find substantively similar results when we use more complicated latent variable measures based on these same batteries.
- Crosson, Lorenz, Volden, and Wiseman, 2020.
- Richard L. Hall and Alan V. Deardorff, “Lobbying as Legislative Subsidy,” American Political Science Review 100, no. 1 (2006).
- These ideological distributions are relatively constant between the two waves of data collection, however in the 2019 sample we do observe slightly higher variance in the distribution of ideology within Democratic offices. This may reflect the fact that Democrats both picked up seats in more conservative districts like Calif. 40, and elected more progressive representatives like in N.Y. 14).
- Alexander C. Furnas, PhD dissertation (Ann Arbor, MI: University of Michigan, 2020).
Compensating Congressional Staff: A Human Capital Analysis
The personnel expenditure and resource allocation analyses above illuminate how and when the decline in legislative capacity began, though only in the aggregate across common job titles and major office functions. In this section, we use CCS data to conduct a human capital analysis. Human capital analysis more precisely observes professional characteristics at the individual worker level to predict compensation. Using data only available from the CCS, we can assess the factors that influence given congressional staffers’ salaries based on their employing offices, job assignments, knowledge, skills, and abilities, as well as education and identity.
The human capital approach rests on straightforward logic about which staffers should be expected to earn more. Job title analyses are misleading because they assume all staffers holding the same title have similar education, experience, and expertise. And, as we already noted, the job title inflation that occurred while staff compensation declined creates more noise than signal. And, most importantly, the human capital analysis includes staff from both chambers and all types of employing offices (i.e., committee and leadership offices), not just House member personal offices.
First, it is reasonable to expect the inherent organizational hierarchy in Congress to determine salaries, so we first note the staffers’ chamber (House = 0, Senate = 1), office type (Personal = 0, Committee = 1, Party Leadership/Elected Officer = 3) and whether or not they work for the majority party (Minority party = 0, Majority party = 1). Second, we account for job titles. Though they may be imperfect, it is still reasonable to expect supervisors to earn significantly more than more common job titles like legislative assistant or professional staff member. Third, we measure tenure as described above, and the institutional knowledge measure is normalized on a scale of 0-1. Fourth, we use LegiStorm data on staffers’ highest educational attainment. Note that the JD degree is omitted because it is perfectly collinear with the job title “counsel.” And, finally we include standard identity variables for age (measured in five-year intervals), gender (binary), and race (white = 0; BIPOC = 1).
Figure 12 shows the results of a linear regression model predicting annualized salary. The plots are the marginal effects associated with each independent variable; the lines are a measure of uncertainty.1
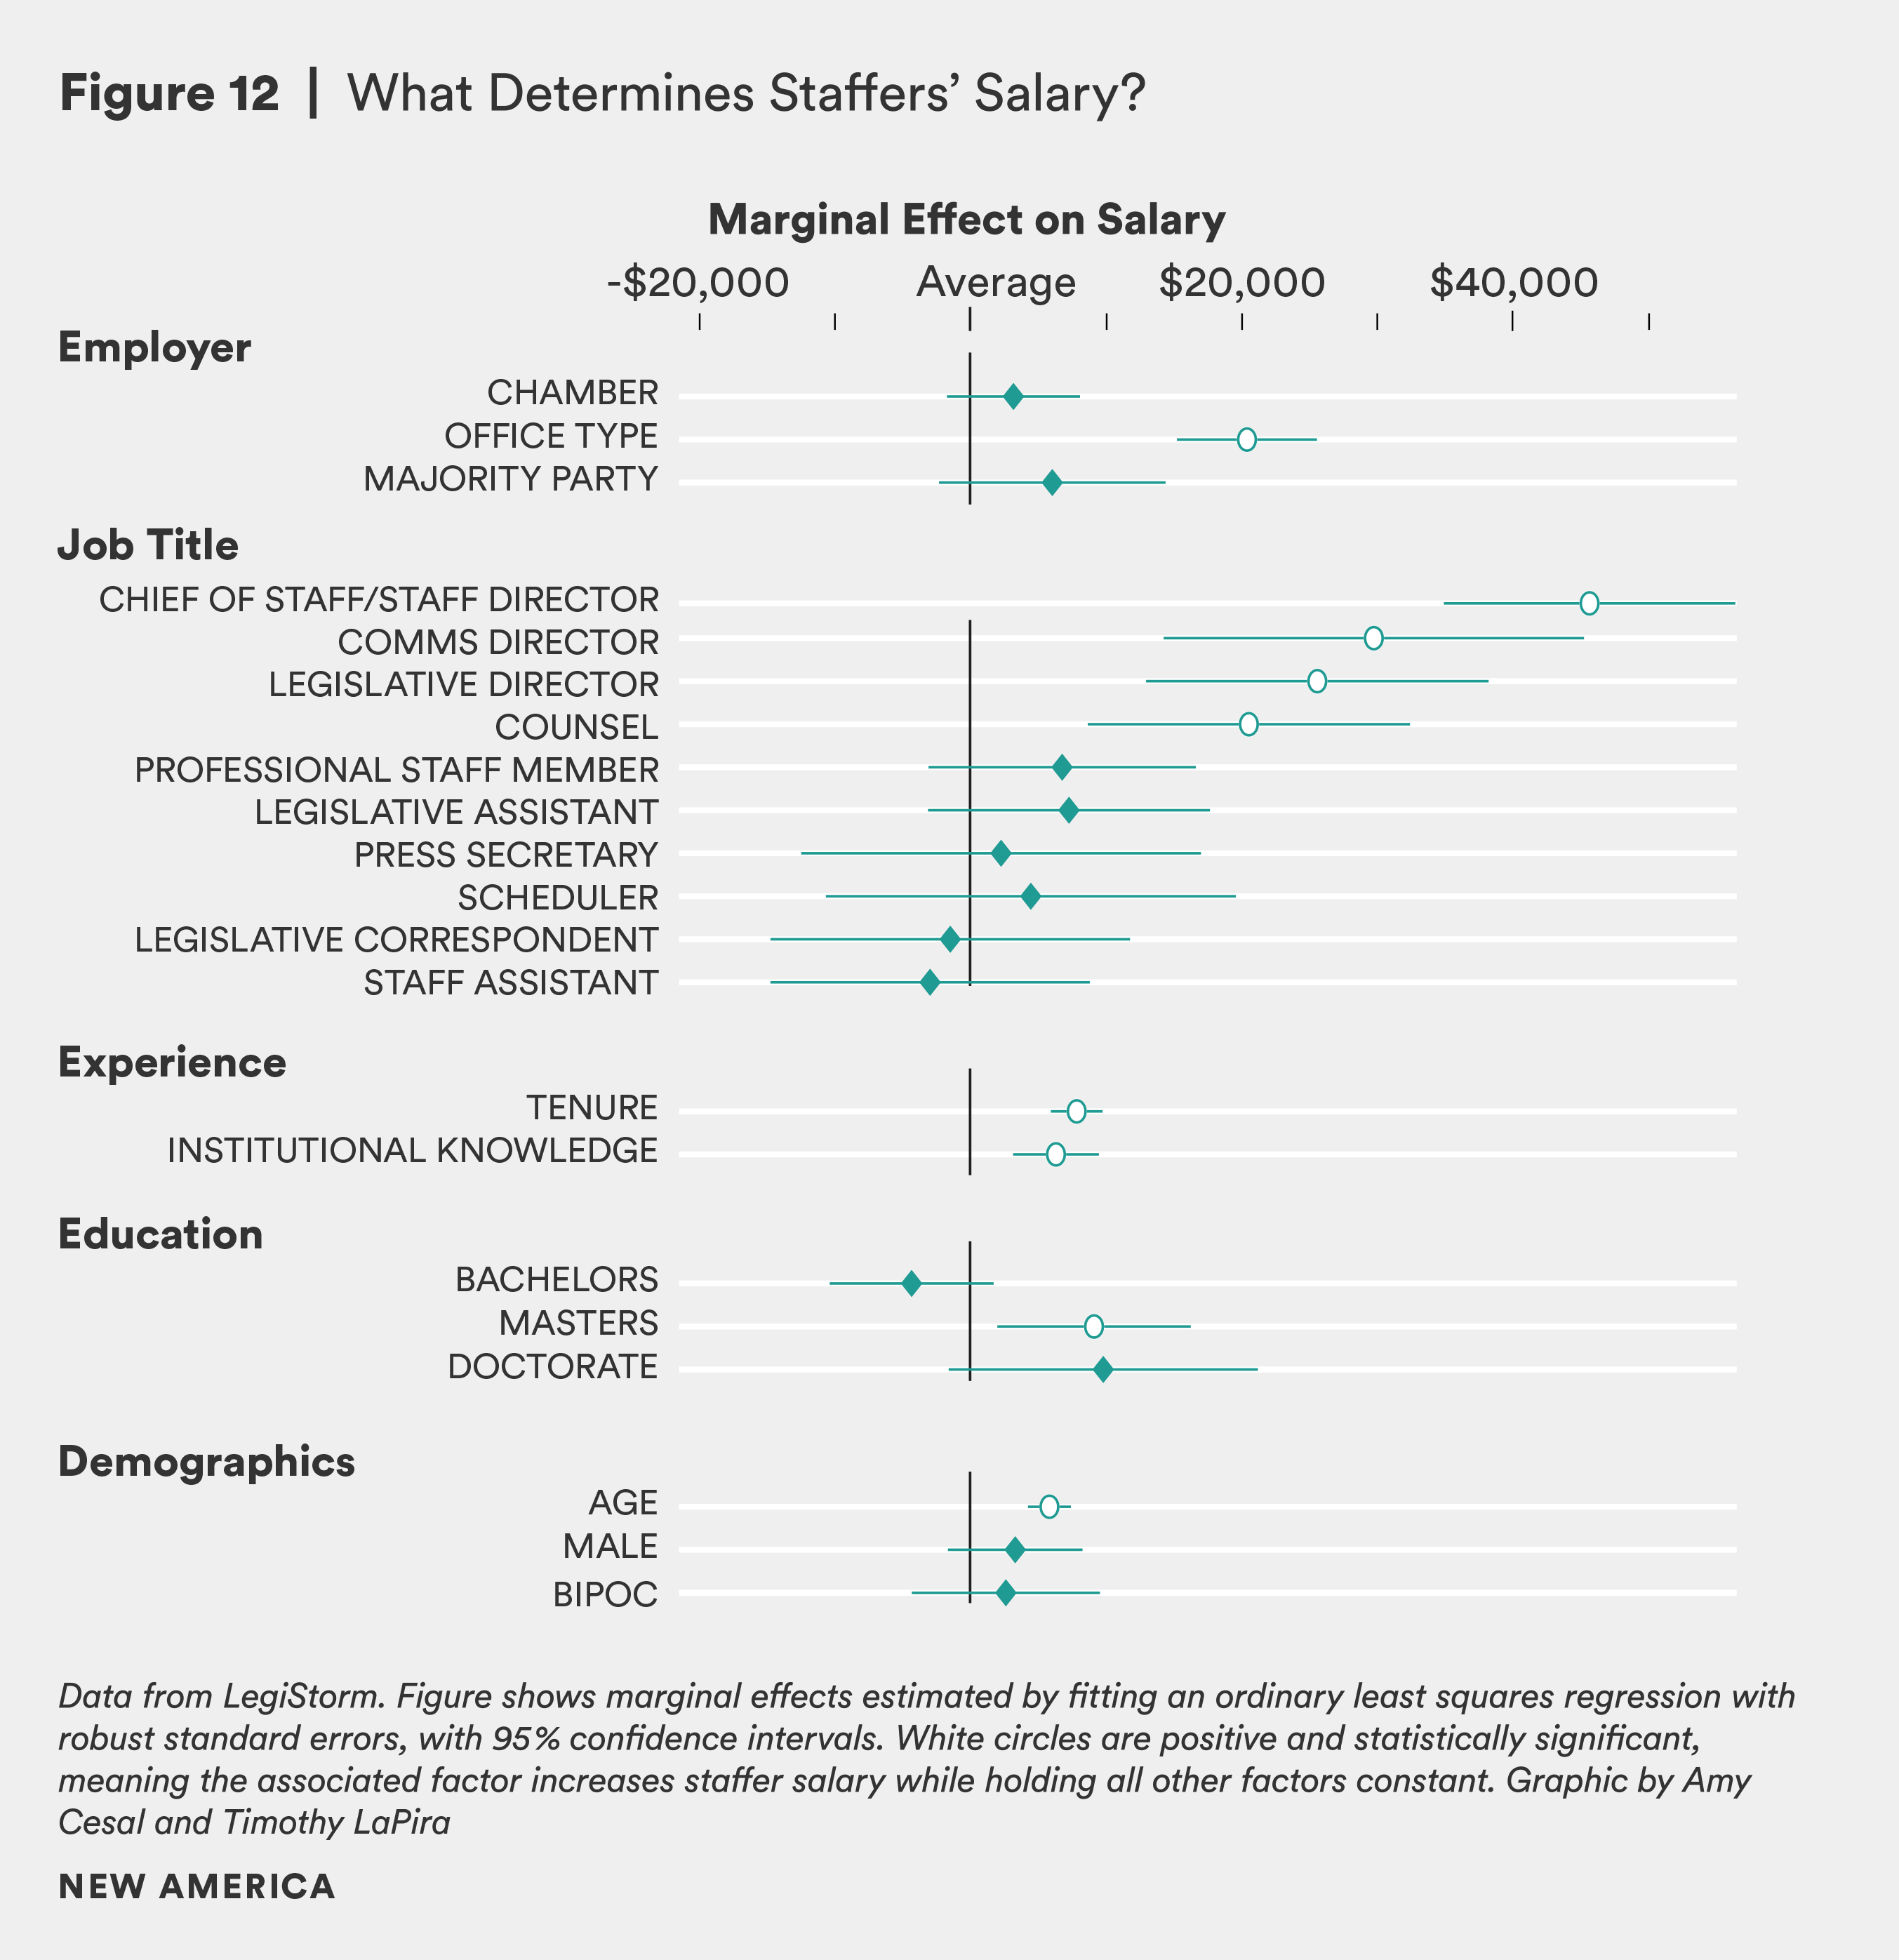
Job titles do matter, but only for those holding positions of supervisory authority. After controlling for all other factors, staffers holding mid-level positions such as press secretary or professional staff member do not earn more than those in entry-level positions like legislative correspondent or staff assistant. The statistically insignificant difference between low- and mid-level staff is likely due to the downward pressure of declining personnel budgets and the highly competitive job market on Capitol Hill, as we document above. Members of Congress exploit their job-sellers’ market status.
Alternatively, holding a counsel job (or having a law degree) earns staff $20,000 more per year than they would otherwise earn with the same experience. Legislative directors earn $25,000 more than counsels, and communications directors get paid an additional $5,000 more than legislative directors. Staff directors and chiefs of staff earn an average of $46,000 more than the typical staffer, all else equal. In other words, senior staff earn more than twice what a legislative assistant earns, even after controlling for other factors. These large inequalities cannot be attributed to senior staffers’ experience or knowledge alone, but instead to the inefficient and unequal legislative staff job market. The higher salary margins for senior staff is independent from how much we may expect them to be paid based on their age, experience on Capitol Hill, and knowledge of legislative procedure.
Congressional offices pay for experience, suggesting members value staffers who spend significant time on the Hill and those who develop their knowledge, skills, and abilities. A one standard deviation increase in tenure—equal to roughly 2.5 years of experience—translates into nearly $9,000. And, staffers’ institutional knowledge is rewarded at a rate of roughly $6,000 for every one additional correct answer in the procedural pop quiz. In addition, the only demographic variable that predicts salary is age, which can reasonably be expected to reflect alternative professional and life experience. Recall the majority of staff are under the age of 35, and two in five are under 30. Among our study, there is not a distinguishable difference in pay for BIPOC and female staffers compared to white staffers holding the same position, though we know these groups are both underrepresented and less likely to advance to more senior roles.2 Overall, pay discrepancies do exist between Black and white staffers on average, perhaps because white staffers are more likely to hold senior titles.3
These results are counterintuitive given the long-term trend of declining tenure and age among staff. Members reward employees’ knowledge and experience, yet they have sharply reduced their staffers’ salary over the course of several Congresses. The declining purchasing power of a Capitol Hill paycheck compels staffers to leave the Hill after an average of three years. In other words, members’ of Congress management of human capital is extremely inefficient for their immediate needs and woefully inadequate for the institution as a whole.
Ultimately, our research reveals a notable paradox: Members both reward knowledge and experience and also offer little incentive for staff to stay long enough to develop the kinds of knowledge and experience that can be rewarded.
Citations
- The model estimates ordinary least squares coefficients, with 95 percent confidence intervals for heteroskedastic-corrected (HC3) robust standard errors.
- Ritchie and You, 2020.
- LaShonda Brenson, “New LegiStorm Report Shows the Highest Pay Disparity Between Black and White Staffers on the Hill in 20 Years,” Joint Center For Political and Economic Studies, June 18, 2020. source
Lessons for Congressional Capacity Reform
Our research covering both long-term trends and in-depth analyses of individual staffers suggests several avenues for reform. We list general considerations for institutional reforms related to the work we report here, fully understanding that several are aspirational and may not be politically feasible in the near future. But we think the data—not anybody’s preconceived notions about how things “really” work—should prompt institution-minded members and the political reform community to seriously reconsider how Congress recruits, prepares, develops, and retains its staff. These itemized recommendations are not ranked in order.
- Acknowledge bipartisan and bicameral institutional neglect. The decline in legislative capacity we document here is the product of many years of institutional neglect. Members in both chambers—and in both parties—must acknowledge that the Congress they have inherited has less capacity to govern than that of only a decade or two ago. The bipartisan, bicameral problem demands bipartisan, bicameral cooperation to reinvigorate the legislative branch to oversee a strong and growing Executive, regardless of who sits in the Oval Office. Investing in the institution’s capacity will improve members ability to represent the American people and to govern in the twenty-first century.
- Reorganize Congress. Congress has not seriously reconsidered how its rules, structure, and organization are outdated, inefficient, and inadequate for their constituents’ needs. Congress should authorize a bicameral, bipartisan, and simple majority-rule joint committee with sufficient resources to do more than merely recommend trivial improvements that existing standing committees and elected officers in each respective chamber are already considering.
- Pay staff more. The cost of living adjusted wages for entry- and mid-level congressional staff who work 50 hours per week or more is paltry for supposedly the most professional legislature in the world.
- Overhaul the MRA. The House of Representatives does not adequately manage member office operations. The MRA is not a meaningful strategic planning and budgeting tool, so it should be significantly restructured by first identifying overhead expenses in member personal offices that may be fully centralized, including basic information technology and routine office functions. The MRA should also structure a reasonable allowance for district and Washington personnel that accounts for local cost of living and health care benefits.
- Assess and reward high-performing offices. Members have little incentive other than their own reelection to change how they operate their offices. There should be routine mechanisms to reward offices for excellent performance, such as low turnover, long average tenure rates, professional development achievements, and other measurable objectives for service. Rewards and other forms of recognition accrued per office could be passed on to staff, giving them tangible incentives for achievement.
- Discard overall FTE and staff sharing limitations. Though the Senate does not necessarily pay staff more than the House after controlling for things like age and experience, the Senate does outperform the House in recruiting older, more experienced staff. The House could compete better if it no longer inhibited members’ flexibility in building the staff rosters they prefer.
- Restore balance to Washington and district work. The decades-long shift in staffing resources from Washington to the district is the consequence of much larger political forces in American politics, but it is not unrelated to how members’ use their official allowances. Members now face no limitation on how much they use taxpayer resources to conduct constituent services, most of which is for legitimate representation needs. But, Congress’s first priority is to govern, which requires members’ presence and attention while assembled in Washington. Allocating more resources to the “policy shop” is one way that members can assert their institutional prerogatives to influence legislation and oversight. Of course, this reallocation ought to be part of a comprehensive reconsideration of how members’ time in Washington is spent, such as reducing “call time” and reelection fundraising.
- Pay our interns. The pipeline for working in Congress is fit only for those with sufficient privilege and resources to accept non-paying or extremely low-paying employment. Recent funds allocated for internships are a good start, but are not sufficient. Congress should rethink internships in congressional offices as public service apprenticeships.
- Centralize the legislative staff labor market process. Members of Congress exploit a race-to-the-bottom legislative staff labor market, and fail to recognize that their market extends beyond Capitol Hill. Members, committees, and leadership offices in both chambers can retain the flexibility that comes with autonomous hiring and firing authority and cooperate to make the legislative staff market more efficient. The failure to fully use existing central human-resources mechanisms to screen candidates and improve placement is a collective action failure. Both parties free-ride on the prestige of working in Congress by continuing to use informal networks to recruit and retain staff. Such informal networks are especially problematic for traditionally underrepresented groups.
- Proactively recruit, retain, and promote a diverse staff. Congressional offices should be rewarded for recruiting, retaining, and promoting staff to better represent women, people of color, and others who are not typically represented among staff. Both chambers should cooperate to proactively recruit, retain, and advance staff with explicit attention to race, ethnicity, national origin, primary language, religion, age, veteran status, ability, immigration status, economic status, sex, gender identity, and sexual orientation. Congress should create a joint Office of Diversity and Inclusion, and go further to support efforts such as the Joint Center for Political and Economic Studies “Hill Diversity” initiative.
- Improve labor market transparency. Congress is a sellers’ labor market, giving members an extreme information advantage and negotiation leverage over prospective staff. Congress should develop routinely updated guidelines for pay, job title definitions, job descriptions, and occupational ranks and steps based on demonstrable knowledge, skills, and abilities. Members would retain full authority to hire and fire staff at will, and would be free to use the guidelines as much or as little as they please. Supervisors and staff would have reliable information about work expectations, salary, and career progress, and members could convey their commitment to fair and equitable treatment of staff to constituents.
- Slow the revolving door. The consequence of the inefficient staff labor market is high turnover and brief tenure that subsidizes K Street. Congressional offices now serve as a professional stepping stone for the influence industry, which is an inefficient use of tax dollars. And, existing “cooling-off” rules are ineffective, as the revolving door has continued to expand since they have been adopted. Congress needs to offer staff a reason to stay, including a work environment that makes full use of their intrinsic public service motivation. Now, Congress simply concedes that it can’t compete with the exorbitant salaries offered by K Street, and ignores non-salary incentives to retain staff.
- Sponsor and reward professional development. Currently, professional development is limited to basic administrative skills, routine office functions, and basic substantive policy training. There is no accessible training oriented toward higher order skills such as legislative negotiation, complex congressional processes, or issue area expertise. Congress should partner with the political reform community, federal agencies, private sector organizations, staff affinity groups, universities, and think tanks to develop bipartisan professional development standards and expertise certification. Congress should subsidize professional development up front and reward staff after completion with incremental increase in pay, rank, and scale. Offices should accommodate staff seeking professional development opportunities by changing norms of constant presence in the office, especially when in session.
- Create a venue for staff to offer feedback. Staff—especially those who are young and junior—have very few opportunities to offer feedback without fear of retribution. The norm of loyalty to the boss is so strong on Capitol Hill, and most members remain so distant from the day-to-day challenges that staff face, there is no existing avenue for dialogue. Members and senior staff could be subject to annual peer review using a committee of staff from other offices or from neutral outside experts.
Methodology
The 2019 Congressional Capacity Study is a collaborative research project conducted by a core team of political scientists: Alexander C. Furnas and Timothy M. LaPira. The project followed the successful fielding of the 2017 Congressional Capacity Survey which included original qualitative and quantitative data.
From May through October, 2019, the research team fielded an online questionnaire targeting all congressional staff with political or legislative responsibilities primarily located in Washington, D.C. offices. The sampling frame was purposely broad based on staffers’ geographic location to best capture those who contribute to Congress’s legislative, appropriations, oversight, or general public policy operations.
Purpose
The survey questionnaire sought to find out more about the backgrounds, career paths, policy views, technical knowledge, substantive expertise, and job experiences of congressional staffers, as well as the procedures and organizational structures that allow them to assist members of Congress to do their work in the most effective and democratically responsive ways. The sampling and fielding process is purposely intended to seek as broad and representative a sample of congressional staff as possible.
Sample Construction
We constructed the sampling frame from the full LegiStorm contact list as of July 18, 2017 that included individual’s names, employers, and official email addresses. The contact list contained the full census of 10,369 legislative branch employees with a Washington, D.C. office address. The contact list included 729 House, Senate, and bicameral offices and organizational units. The list excluded legislative support agencies (such as the Congressional Research Service, Government Accountability Office, and the Congressional Budget Office) that employ personnel as federal civil servants. From this list of organizational units, the research team selected 633 organizational units with names suggesting the primary mission contributed to legislative operations, as broadly as could be determined by public information about the office. Primarily, these units focus on members’ personal offices, standing committees, and party leadership offices. Secondarily, we included “other” administrative offices (such as the House Parliamentarian)1 and institutionalized caucuses or member organizations (such as the Senate Caucus on International Narcotics Control and the House Republican Study Committee).
The sampling frame excludes offices with exclusively administrative, facilities, or maintenance missions (such as House Office of Logistics and Support and Senate Office of Printing, Graphics and Direct Mail). We also excluded staffers with primarily administrative responsibilities, limiting our sample to legislative, communications, and political management staff.
Table 17 summarizes the 6,505 individuals in our sampling frame this process considered to be primarily employed as political appointees in the legislative branch. The table cross-tabulates prospective respondents by chamber and office type.
Table 17 | 2019 Sampling Frame
| Personal | Committee | Party Leadership | Total | |
|---|---|---|---|---|
| House | 2,756 | 953 | 184 | 3,893 |
| Senate | 1,768 | 741 | 103 | 2,612 |
| Total | 4,524 | 1,694 | 287 | 6,505 |
The process intentionally makes no assumptions about individual staffers within an office based on common job titles to maximize the variety of staff. Moreover, job titles are notoriously noisy descriptions of staffers actual responsibilities within an office. This sampling frame conservatively biases toward over-coverage of prospective participants that may reasonably be thought of as politically appointed staff engaged in legislative operations, even if their role is tangential, such as press secretaries. The ex ante expectation is that response rates would be artificially deflated because we were likely asking non-legislative staff—such as office operations managers—employed in legislative offices to participate. We expect these non-legislative staff employed in legislative offices to be more likely to decline to participate in the survey.
Fielding Process and Timeline
The survey was offered exclusively online using the James Madison University license to the Qualtrics survey platform. The survey was offered in three sequential data collection stages between August and December. Each of the 6,505 prospective staffers were contacted first by mail with a personalized survey link and then by email with a personalized link to identify respondents with existing biographical data and to maintain strict confidentiality. In addition to direct contacts, the research team recruited senior legislative staffers in our professional networks to ask them to spread the word as much as they were willing, and partnered with external validator groups including the Congressional Management Foundation, R Street, the Legislative Capacity Working Group, and Demand Progress to promote participation. The fielding process was conducted over the course of five months in 2019, including:
- May 14-17: Initial invitation emails sent in batches of 100.
- June 2: Email response declines and survey completions identified, dropped from first follow-up contact list.
- June 4-5: First reminder email sent.
- June 30: Second round email response declines and survey completions identified, dropped from first follow-up contact list.
- July 2-10: Second reminder email sent.
- August 1-5: Third round email response declines and survey completions identified, dropped from first follow-up contact list.
- September 5-11: Third reminder email sent.
- October 28th: Survey closed and response data collected from Qualtrics.
- December 6: LegiStorm delivers biographical data for in- and out-samples.
- December 7-18: Survey response and Legistorm biographical data processing.
Response Rates, and Post-stratification Weights
The overall response rate was 5.5 percent (355 of 6,505). The margin of error at the 95 percent confidence level is 5.2 percent. Post-stratification survey weights (psweight) were calculated using the survey package in R. For the purpose of calculating weights, respondents were counted as having taken the survey for the purpose of inclusion in the numerator if they agreed to participate in the survey and responded to any other question in the survey. The provided psweights are the inverse probability of selection for each respondent conditioning on the joint distribution of chamber, office type, and party in the population, using the sampling frame purchased from LegiStorm.
Linking back to biographical data
In addition to the variables collected with the survey instrument, respondents were subsequently linked back to the original biographical and payroll data in the sampling frame purchased from LegiStorm. Selected variables were used to calculate psweights and to define subgroups by chamber, party, office type, job title, seniority, and gender.
Categorizing Staffer Responsibility
Our analyses rely on unique staffer responsibility classifications. To develop these classifications, we employ a hybrid human- and machine-based coding algorithm. According to this protocol, certain job titles receive automatic coding decisions, which are assigned via a simple algorithm in Python. However, for more ambiguous job titles, research assistants investigated the staffer's responsibilities for the specified year and quarter in greater detail. This additional investigation involved searching for staffers in quarterly volumes of the Congressional Yellow Books, where factors such as the staffer's office location (Washington versus the district), policy portfolio (if one exists), and (occasionally) more descriptive job titles are listed. This information was incorporated systematically into coding decisions, as delineated in the coding protocol.
While some studies have opted to fully automate similar coding decisions, such automation is highly likely to encourage both measurement error and systematic bias. Careful human coding can capture cross-sectional differences and over-time changes in naming conventions and more accurately report staffers' responsibilities. Our codes reflect a staffer's primary office responsibilities. For example, if a CoS has legislative issues associated with her Congressional Yellow Book entry, we assume that a larger portion of her time is occupied by legislative matters than a CoS presenting no associated legislative issues. This captures common differences in CoS duties between offices. Chiefs are particularly important, because they occupy a significant portion of a member's MRA. Other titles are less consequential, but our process nevertheless treats them with equal care. Interns, for example, are known to perform multiple functions for the office, even though many focus primarily on answering phone calls or giving tours. In some cases, a staffer will have multiple responsibilities, with no single responsibility dominant. In these cases, we split the staffer's salary equally between the categories.
Another crucial feature of the coding process is that it is designed to minimize underestimation of legislative and constituency service investment. Any code may be overridden by the presence of legislative responsibilities within the Congressional Yellow Book. In practice, these cases were double-checked to make sure member offices are credited with the fullest possible measure of legislative investment. Constituency service is handled similarly. The procedure therefore renders the “Legislative,” “Constituency Service,” and “Communications” codes as the most precise coding categories available in the dataset. Each of these categories has informative, concrete coding rules to capture underlying responsibilities accurately. By contrast, “Political Management'' and “Administrative'' serve as residual categories determined by a combination of salary information, absence of legislative responsibilities, and presence in Washington.
Question Wording and Variable Construction
Ideology: We measure staffer ideology as a latent variable derived from a five question battery taken from Heinz and colleagues,2 validated by Kevin Esterling.3 We use the items in this battery to create an ideal point estimate for each staffer using a Partial Credit Model (PCM), a Rasch model extension of item-response theory (IRT) that is appropriate for ordinal variables.4 We standardize this ideology score to have a mean of 0 and a standard deviation of 1.
Ideology Battery Questions
Q19 Thinking about YOUR OWN personal opinions—not what you think your boss believes—what do you think about the following? [Responses on a Likert-type agreement scale: (1) Strongly agree (2) Somewhat agree (3) Neither agree nor disagree (4) Somewhat disagree (5) Strongly disagree]
q19.1 The protection of consumer interests is best insured by a vigorous competition among sellers rather than by federal government regulation on behalf of consumers.
q19.2 There is too much power concentrated in the hands of a few large companies for the good of the country.
q19.3 One of the most important roles of government is to help those who cannot help themselves, such as the poor, the disadvantaged, and the unemployed.
q19.4 All Americans should have access to quality medical care regardless of ability to pay.
q19.5 The differences in income among occupations should be reduced.
For purposes of scale construction q19.1 was reverse coded so that higher numbers were always the more conservative codes.
Party Identification Battery
Q21 Generally speaking, do you usually think of YOURSELF as a Republican, a Democrat, an Independent, or something else? Note: your response here may differ from your boss’s party. (1) Republican (2) Democrat (3) Independent (4) Other (5) No preference
[Display This Question if Q21== 1] Q23 Would you call yourself a strong Republican or a not very strong Republican? (1) Strong (2) Not very strong
[Display This Question if Q21== 2] Q25 Would you call yourself a strong Democrat or a not very strong Democrat? (1) Strong (2) Not very strong
[Display This Question if Q21 === 3,4 or 5] Q27 Do you think of yourself as closer to the Republican or Democratic party? (1) Republican (2) Democratic
Citations
- Institutional officers and their staff are arbitrarily attributed to the respective majority party, though they operate in fact as non- partisan employees.
- Heinz, J. P., E. O. Laumann, R. L. Nelson, and R. H. Salisbury (1999). Washington, D.C., Representatives: Private Interests in National Policymaking, 1982-83. ICPSR..
- Esterling, Kevin M. "Constructing and Repairing our Bridges: Statistical Considerations When Placing Agents into Legislative Preference Space." Available at SSRN 3107266 (2018)..
- Gerhard H. Fischer and Ivo W. Molenaar, “Rasch models: Foundations, recent developments, and applications,” Springer Science & Business Media, 2012, and Patrick Mair and Reinhold Hatzinger, “Extended Rasch modeling: The eRm package for the application of IRT models in R,” 2007.
More About the Authors

Alexander C. Furnas