Table of Contents
Using FEAT to Build Statewide Dashboards in Arizona, Florida, and Indiana
A tool is only as good as its uptake, and the only way to ensure a tool like the Foreclosure and Eviction Analysis Tool (FEAT) serves local communities is to drive its adoption and ownership by local leaders. For this reason, in parallel to developing FEAT, we partnered with high-capacity organizations with statewide reach in Arizona, Florida, and Indiana to use FEAT to create statewide eviction and foreclosure (EF) data dashboards. Our goal was to provide these partners with tools and technical support to access EF data statewide, use FEAT to build dashboards responsive to the needs of local housing communities, and engage with these communities to use the insights to inform housing policy, advocacy, and programming decisions.1
Each state scaling partner made significant progress in advancing efforts to collect and analyze EF data statewide within the 12-month partnership. In December of 2023 our partner in Indiana, the Polis Center at Indiana University–Purdue, released its dashboard, making Indiana the first state in the country to have full and publicly available data on evictions and foreclosures. Our Arizona partner, the Knowledge Exchange for Resilience (KER) at Arizona State University (ASU), released the Arizona statewide dashboard in May 2024. Our Florida partner, the Shimberg Center for Housing Studies at the University of Florida, plans to release its statewide dashboard in the coming months.
In each state, partners followed a similar roadmap, starting with gathering the data needs of local housing communities and culminating in unveiling statewide EF dashboards. Because each state partner operated in a different data, legal, and housing context, their strategies differed accordingly. The differing contexts that each partner operated in allowed us to better understand the range of challenges and facilitators for sourcing EF data, creating dashboards, and working with communities to use the dashboard insights to develop data-driven policies and programs that reduce housing instability.
FEAT State-Scaling Roadmap
Step 1: Partner Selection
Step 2: User-Centered Design with Local Housing Communities
Step 3: Unlocking Access to Statewide Data
Step 4: Analyzing the Data Using FEAT
Step 5: Building Data Dashboards
Step 6: Dashboard Rollout and Impact
Step 1: Partner Selection
New America believed an organization charged with building a statewide EF data dashboard should possess the following qualities.
- The necessary mix of skills: Ideally, an organization would have housing, information technology (IT), and data visualization capacity on-staff. If not, the organization would be able to source these capacities.
- Strong networks statewide: Expressed through relationships with county and state leaders, courts, housing communities, and other stakeholders crucial to developing and then using an EF data dashboard.
- Flexibility and autonomy: To take on and execute projects like a statewide EF data dashboard.
- Legitimacy: A respected partner with a track record in the community is critical for driving acceptance, trust, and uptake of an EF data dashboard.
- Sustainability: A partner must have long-term capacity and funding to sustain both the dashboards and the data pipelines that feed them.
In each state, based on the above criteria, we partnered with a research center within a large, public university to collect, develop, and steward a publicly accessible, statewide EF dashboard—we refer to these programs throughout as “state-scaling partners” or “state partners.”2
- Arizona: Arizona State University’s Knowledge for Exchange Resilience (KER) and Geospatial Research and Solutions Program (GRS); and Wildfire AZ (“Wildfire”)
- Florida: DataKind engaged the Shimberg Center for Housing Studies at the University of Florida (“Shimberg”)
- Indiana: Indiana University–Purdue University Indianapolis’ Polis Center (“Polis Center”)
While each state partner differed in their focus and expertise (e.g., Arizona State University’s KER focuses on resilience and GRS focuses on geospatial analysis; the Shimberg Center focuses on housing; and the Polis Center focuses on data for good), they all share a belief that stable housing advances well-being and that better local data is foundational to improving local policy. Further, each state-scaling partner had a multidisciplinary team with a mix of geospatial and data skills; statewide reach and credibility for providing reliable data analysis on pressing problems; and the human resources and financial capacity to undertake this effort.
With the Polis Center in Indiana and ASU and Wildfire AZ in Arizona, New America provided modest sub-grants to undertake this effort; in Florida, the Shimberg Center worked closely with DataKind to use FEAT to produce Florida-specific housing loss dashboards.
Step 2: User-Centered Design with Local Housing Communities
Across all three states, scaling partners began by convening community sessions with the intended users of the dashboards. This included local government leaders (at the city, county, and, sometimes, state level); court entities; community-based service providers; journalists; legal aid organizations; and researchers.
In these sessions, state partners inquired about the most pressing EF prevention needs, how participants anticipated using the data dashboards, what types of information they would find most useful, and the way in which they would like it presented. In each state, this feedback formed the basis for dashboard development.
Step 3: Unlocking Access to Statewide Data
The primary source of data on evictions and foreclosures—local court records—varies widely in its quality and availability. Each state partner operated in a different EF data landscape, requiring different strategies for its collection. The table below shows the data sources for EF data in each state.
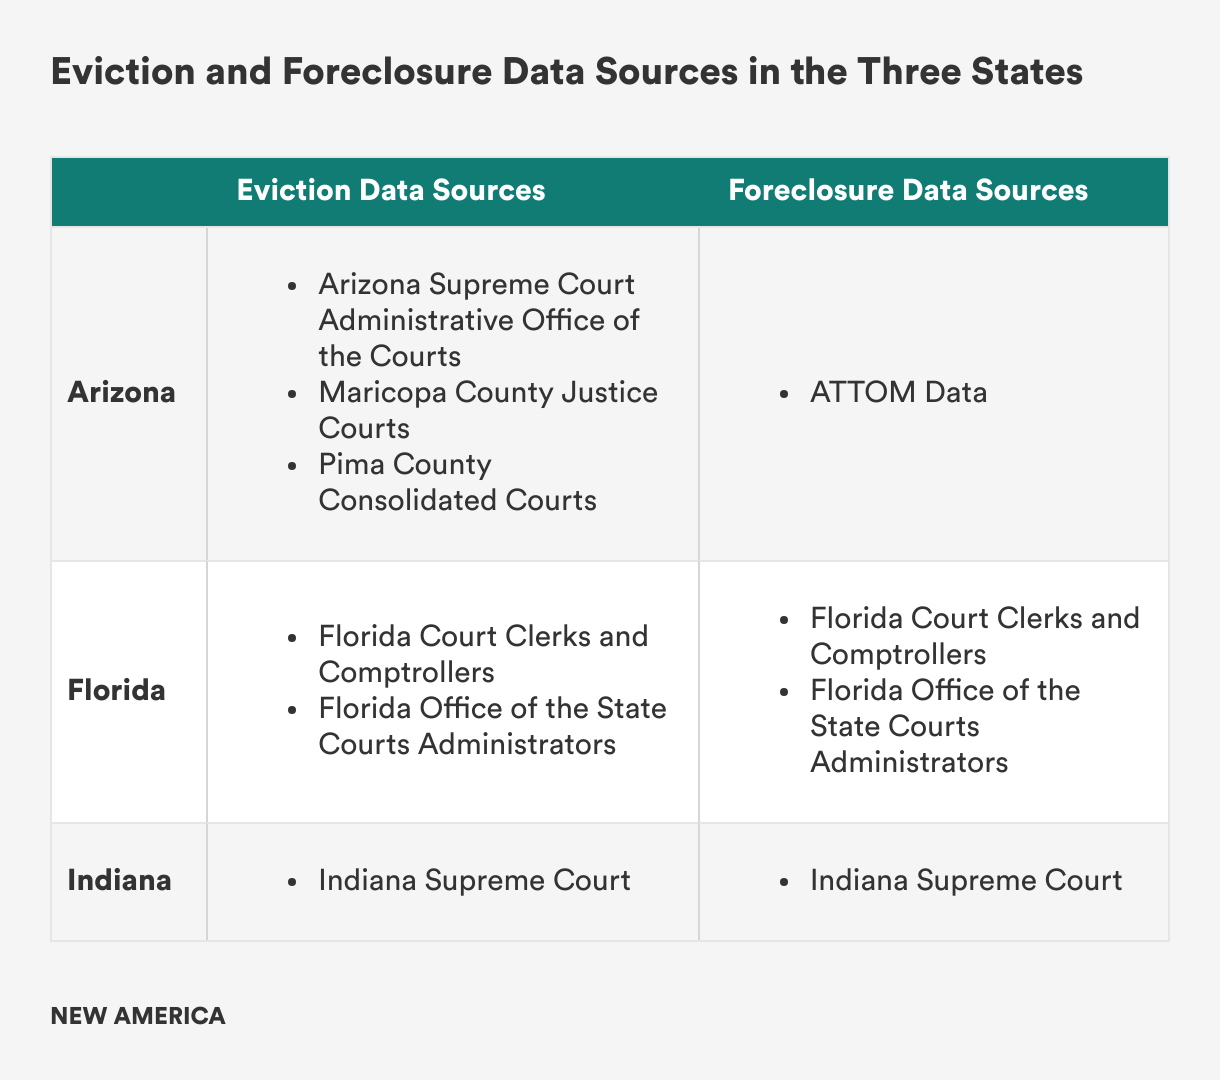
Arizona: Victories and Setbacks
In Arizona, the road to accessing EF data was less straightforward, in part due to the lack of a unified court system. The Arizona Supreme Court Administrative Office of the Courts (AOC) oversees data collection for 13 out of Arizona’s 15 counties, while Maricopa and Pima Counties—the two largest counties—each maintain their own processes and case management systems. Neither the AOC nor Pima County had a practice of making eviction data publicly available, with the exception of county-level eviction filing figures maintained by the Arizona Supreme Court. Maricopa County, despite previously sharing address-level eviction data once a month with a list of stakeholders, had halted this practice after the passage of Arizona’s eviction record sealing legislation in 2022.
Over the next 12 months, New America, ASU, and Wildfire AZ worked persistently to unlock data access across the state. After a meeting in early summer of 2023, in which New America and ASU shared the goal of the state-scaling effort, the AOC agreed to enter into a data-sharing agreement with full access to eviction data across the 13 counties covered by the AOC.
While a data-sharing agreement was reached, the process highlighted the lack of standardized procedures for data provision, relying heavily on individual relationships to broker the arrangement. With no processes in place about whether to provide this data, the decision rested on the unilateral decision of court executives.
In Maricopa County we worked for many months with a close court partner to find a data access arrangement that was compliant with Arizona’s eviction record sealing legislation. That legislation, enacted in 2022, mandates that all dismissed eviction cases be sealed. Prior to this law, the Maricopa Justice Courts (MJC) kept Maricopa housing researchers and advocates well-informed about the local state of evictions, via a monthly mailing. After the law was passed, and without clear implementation guidance, court staff erred on the side of releasing limited and less granular data on a delayed basis.
Over the course of several months and multiple conversations, we worked with MJC on a solution that met our requirements for data access while complying with their eviction record sealing law: MJC would share topline counts of all eviction filings with ASU, but would only share address-level data for unsealed eviction judgments after the cases were settled.
In the remaining county, Pima County, the Pima County Consolidated Justice Court agreed to provide data, but entering into a data-sharing agreement took many months. When ASU received the data they realized they could only query the prior two weeks of filings, rather than the full historical record agreed. ASU and Pima County Court administrators worked for another two months to resolve this hiccup. Foreclosure data access was not offered by any of the parties, and as a workaround we facilitated a purchase of foreclosure data from the company ATTOM Data.
Florida: Building on Existing Data Framework
In Florida, Shimberg came into the partnership with statewide access to EF data. The Shimberg Center’s Florida Housing Data Clearinghouse obtains its data from two sources: the Florida Court Clerks and Comptrollers (FCCC) network and the Florida Office of the State Courts Administrator (OSCA). The FCCC network is a membership organization of court clerks from all 67 Florida counties.
The organization collects address level EF data from each county and provides it to the Shimberg Center on a quarterly basis through a data-sharing agreement. While the data is provided for free, the process is not automated, and it often takes significant time to collect data from all 67 counties.
Separately, OSCA provides Shimberg with monthly EF counts from each Florida county, once per year. Shimberg uses OSCA figures as a quality control check on the more detailed data provided by the FCCC network.
Indiana: A Streamlined Data Scenario
In Indiana, the Polis Center successfully collected EF data from all 92 counties across the state by entering into a data-sharing agreement with the Indiana Supreme Court. When it comes to data access, Indiana’s unified court system allowed for efficiency, simplifying the process and enabling the Polis Center to submit one bulk data request to the Supreme Court for statewide data.
Another major facilitator was a change in the way that Indiana courts code eviction cases in their system, instituted in 2021, that allows court staff to more easily respond to requests related to eviction court records. Still, it took four months from the time the request was submitted to the time the Polis Center received the first tranche of data.
Step 4: Analyzing the Data Using FEAT
Even once the necessary data is obtained, working to clean, standardize, and address discrepancies in the data so it is ready for analysis can present a whole new set of challenges.
Arizona
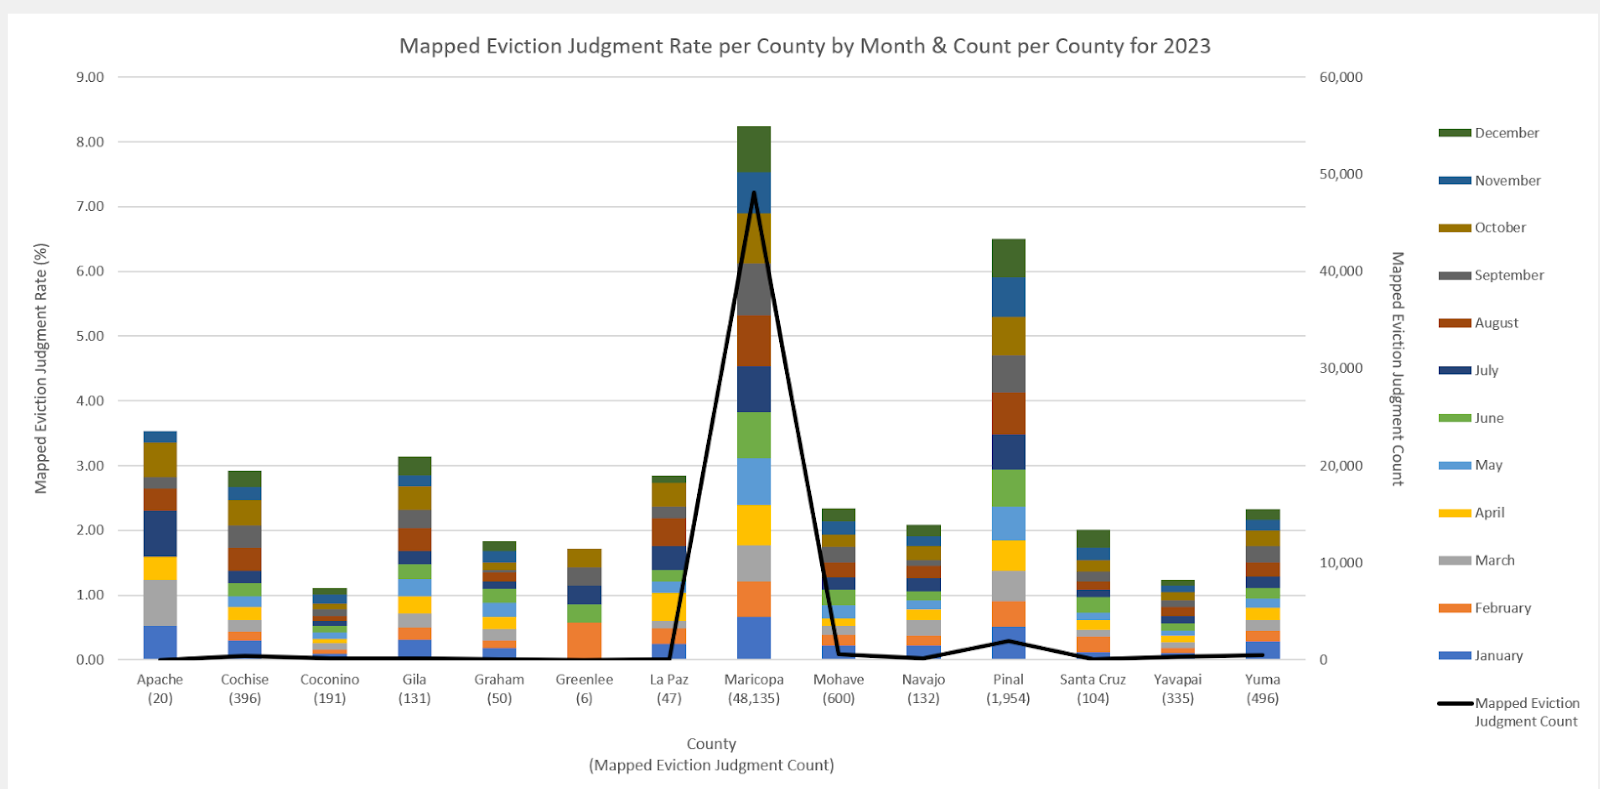
The bulk eviction data obtained from the Arizona Supreme Court required significant back and forth with staff at the AOC to understand which cases represented evictions (as opposed to other civil cases). The eviction data from MJC was limited to eviction cases and shared with a detailed data dictionary, however one-third of the cases had been dismissed and were therefore sealed. Thus, ASU possessed the raw case counts for the full set of eviction filings and eviction judgments, but only the address information to map two-thirds of these cases. To adapt to this data limitation and ensure it was clearly communicated to users, ASU’s geospatial analysts decided to define and use “mapped eviction judgments” as their unit of measure for the Arizona heat maps. The Arizona dashboard contains extensive text to explain the difference between an eviction filing, an eviction judgment, and a “mapped” eviction judgment.
Given the complexities of the foreclosure process, the ATTOM data purchased by ASU similarly required back and forth to understand how to combine data fields to accurately represent a completed foreclosure.
Florida
The Shimberg Center has entered into a partnership with Eviction Lab, whereby the university shares its Florida-wide data for use in the Eviction Tracking System, and Eviction Lab geocodes it, processes it, and shares the clean data back with the Shimberg Center. While Shimberg’s FEAT dashboard is under construction, the center uses this data on an ad hoc basis to share insights with researchers, advocates, and policymakers.
Separately, the Shimberg Center has a data-sharing agreement with DataKind and New America, whereby Shimberg shares its raw data with DataKind for processing. DataKind is in the process of building a Florida-wide EF dashboard using this data.
Indiana
The data obtained from the Indiana Supreme Court had been compiled from court systems across Indiana, and had been cleaned and validated. Still, working with the data required an in-depth knowledge of legal terms and processes across jurisdictions—to understand how each court handles and categorizes the data and to further standardize the data for analysis. This was especially true for classifying eviction judgments across jurisdictions. Despite the streamlined data collection process, the Polis Center worked closely with staff at the Indiana Supreme Court over the course of several months to refine and clean the dataset and figure out how to interpret it.
Step 5. Building Statewide Data Dashboards
Arizona
Determining how to display data from different data sources, each of which covers different time periods and has different limitations, in a way that is easily understandable was challenging. But the ASU team’s geospatial and data expertise allowed them to develop a dashboard that visualizes eviction judgments and mortgage foreclosures across different administrative boundaries including counties, census tracts, and legislative boundaries.
The dashboard also contains “Evictions 101” and “Foreclosures 101” tabs to explain the terminology and legal processes behind these two forms of displacement. In early feedback, dashboard users found these tabs helpful in contextualizing and grounding the rest of the dashboard analysis.
Florida
DataKind is in the process of developing a statewide dashboard that the Shimberg Center will integrate into its website in the coming months.
Indiana
With a team of data analysts comfortable working with large datasets and data visualization skills, the Polis Center team was well-suited to stand up a dashboard building off FEAT analysis using ArcGIS. In addition to census-tract analysis that shows where eviction filings, eviction judgments, and mortgage foreclosures are most acute across Indiana, the dashboard incorporates information about eviction record sealing rates, case processing times, rental index priority indices, and other inputs identified during the user sessions. Feedback from local housing communities also led the team to include resident stories to show the everyday impacts of evictions on Hoosiers across the state.
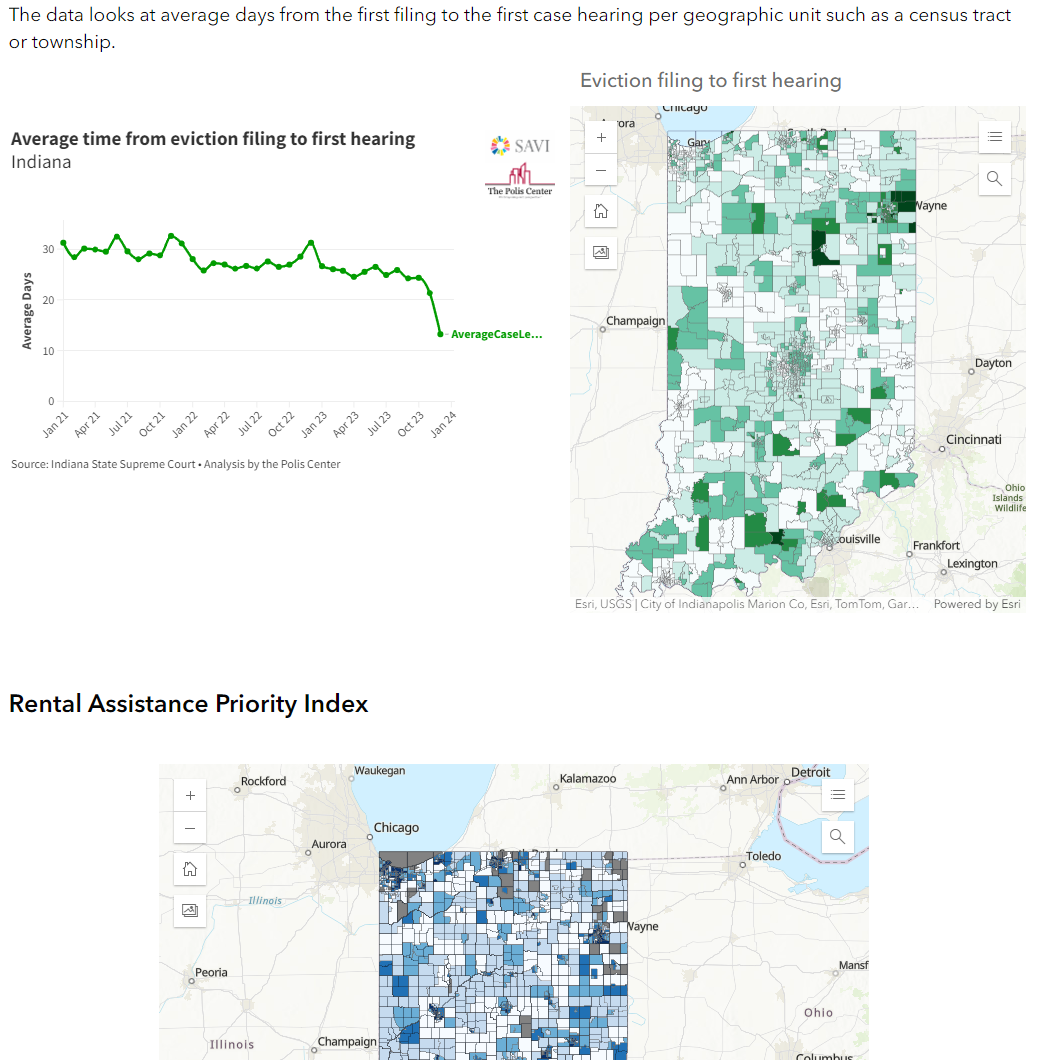
This marked the first time that statewide eviction and foreclosure data would be made publicly available statewide in Indiana.
Step 6. Dashboard Rollout and Impact
We are just beginning to see the ways in which the data our partners have made available in Arizona, Florida, and Indiana is driving change on the ground. Gleaning and disseminating insights from EF data analysis is a large undertaking that is distinct from building a dashboard. Because of resource limitations, we have not been able to support our state-scaling partners to undertake this phase of the work, and so each has pushed it forward as their own resources have allowed.
Arizona
ASU released the Arizona statewide dashboard in May 2024. Its statewide reach, and focus on census-tract level insights, provides a level of transparency and comparison that can be used by existing housing coalitions to support continued advocacy and education related to evictions and foreclosures, as well as existing policies and programs such as Pima County’s robust Emergency Eviction Legal Services program.
Since the dashboards release, Arizona journalists have begun to use it to inform their reporting. The dashboard creators have been invited to present the dashboard to local and statewide audiences, including the Tucson/Pima County Eviction Prevention Collaboration and the Phoenix Community Alliance.
Florida
Despite not having a public FEAT dashboard to display yet, the Shimberg Center has been accessing EF data since at least 2020 and has already seen the impact of this data, some of it processed using FEAT Beta. Shimberg receives two to three requests per quarter from researchers, lawyers, and community advocates who use EF data for various purposes, from studying correlations between natural disasters and evictions to targeting emergency rental assistance funding distribution and legal support.
In Central Florida, an Eviction and Foreclosure Working Group convened by Bright Community Trust has consistently used FEAT-processed data from the Shimberg Center to understand housing loss and allocate rental assistance. State Representative Anna Eskimani has publicly commented on the use of FEAT outputs to target emergency rental assistance in the program’s final days.
Looking ahead, the Shimberg Center is particularly interested in the use of its foreclosure dashboard, as Center staff predict that foreclosures may rise again in the state as a result of high home prices, natural disasters, and other climate impacts.
Indiana
In the first month after its December 2023 launch, the Polis Center dashboard was viewed more than 5,000 times. The dashboard is already being used by legal aid organizations, advocates, journalists, and continuum of care providers across the state. Indianapolis’ largest public hospital is using the dashboard to track evictions as a social determinant of health for its patient population, and one of Indiana’s largest housing developers, Glick Properties, is using the dashboard to understand eviction hotspots in its investment portfolio.
Citations
- We chose to scale at the state level for two reasons. First, we found the state level provides the right balance of efficiency and localization and statewide reach. Second, we believe the benefits of a robust data infrastructure should extend to all cities and counties within a state, and not only those with existing technical capacity, human resources, and political will to build dashboards.
- In Arizona, we brought in a secondary partner, housing organization Wildfire AZ, to supplement the mapping expertise of our scaling partner, Arizona State University’s Knowledge Exchange for Resilience.