
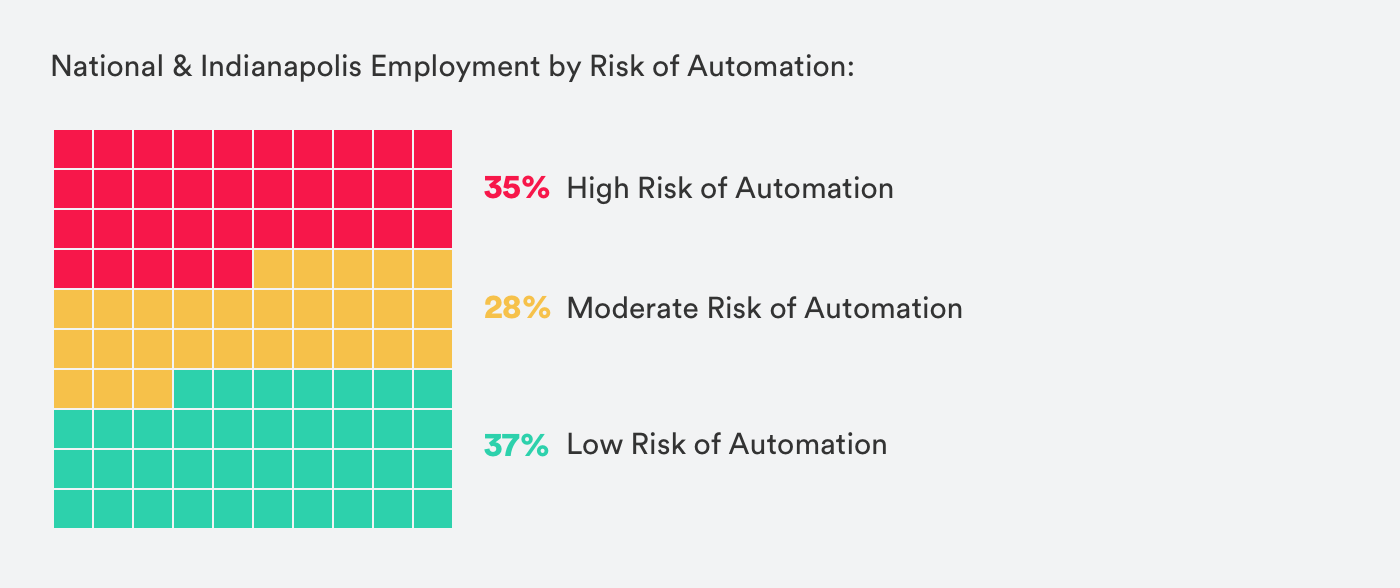
Overview: How Vulnerable are Indianapolis Jobs to Automation?
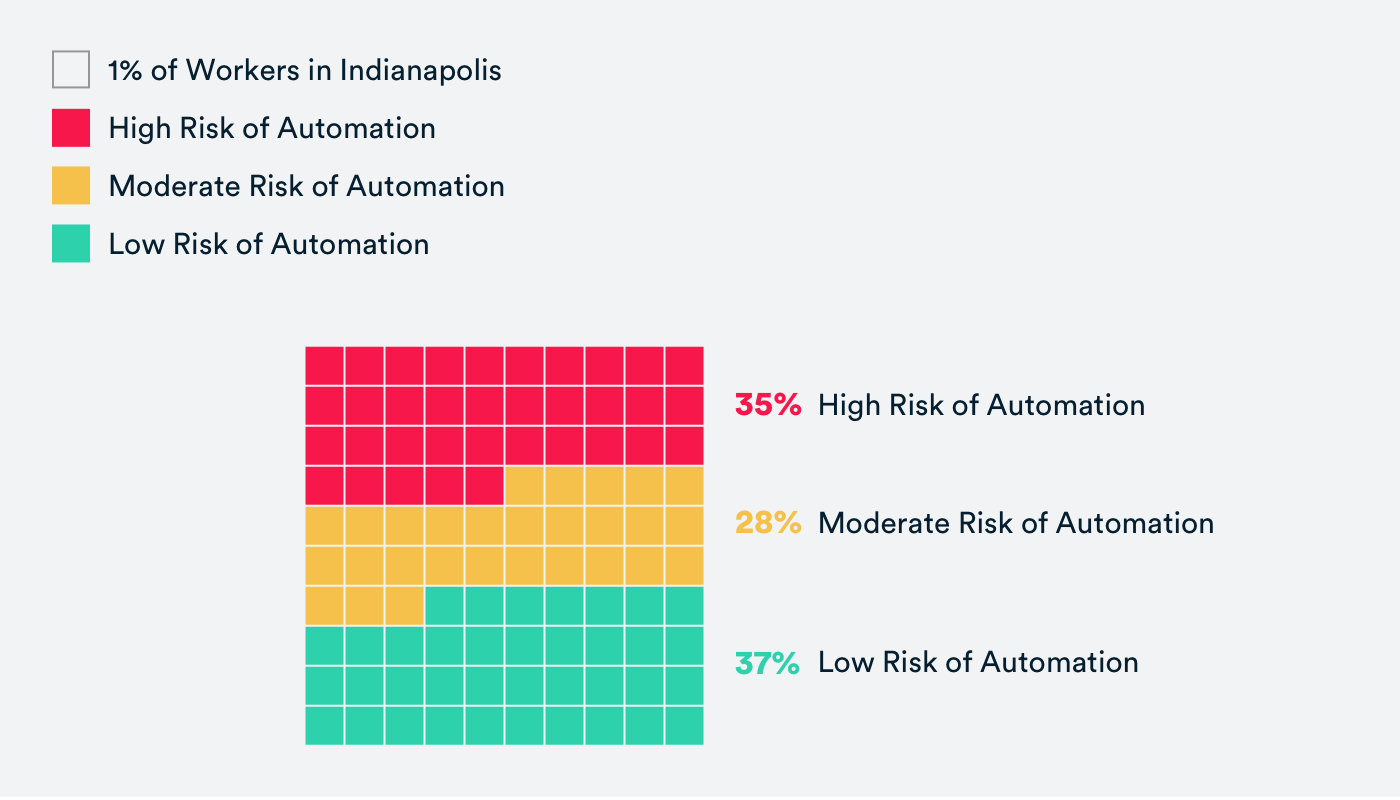
In the Indianapolis-Carmel-Anderson metro area, 337,900 people are employed in occupations that are at high risk of automation—35 percent of total jobs. Another 272,760 jobs (28 percent of total jobs) are at moderate risk of automation. Only a little more than a third (37 percent) are at low risk.
Which Workers in Indianapolis Are Most Vulnerable to Automation?
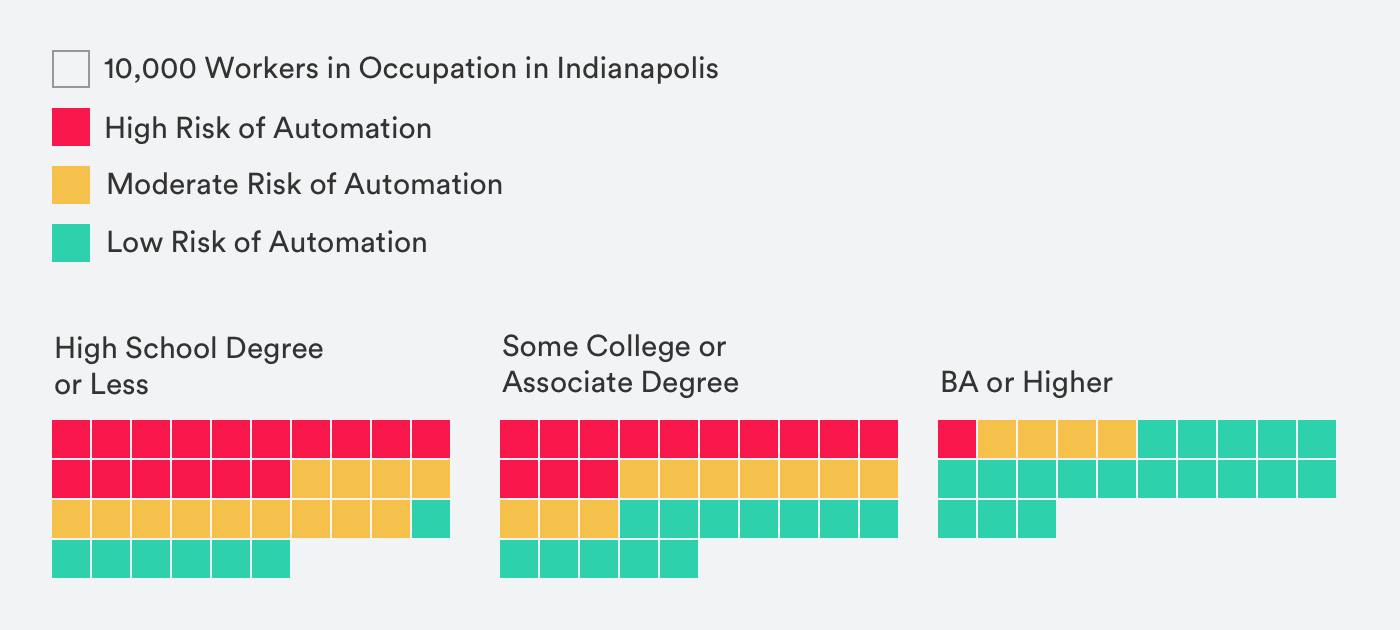
Workers with less education
Among workers, the least educated workers are at greatest risk of automation. This is especially true of workers with a high school degree or less, who comprise 47 percent of the workers at high risk of automation in Indianapolis and just 19 percent of workers at low risk. Those numbers are flipped for low-risk jobs: 49 percent of workers in low-risk occupations have a BA or higher, while just 19 percent have a high school degree or less.
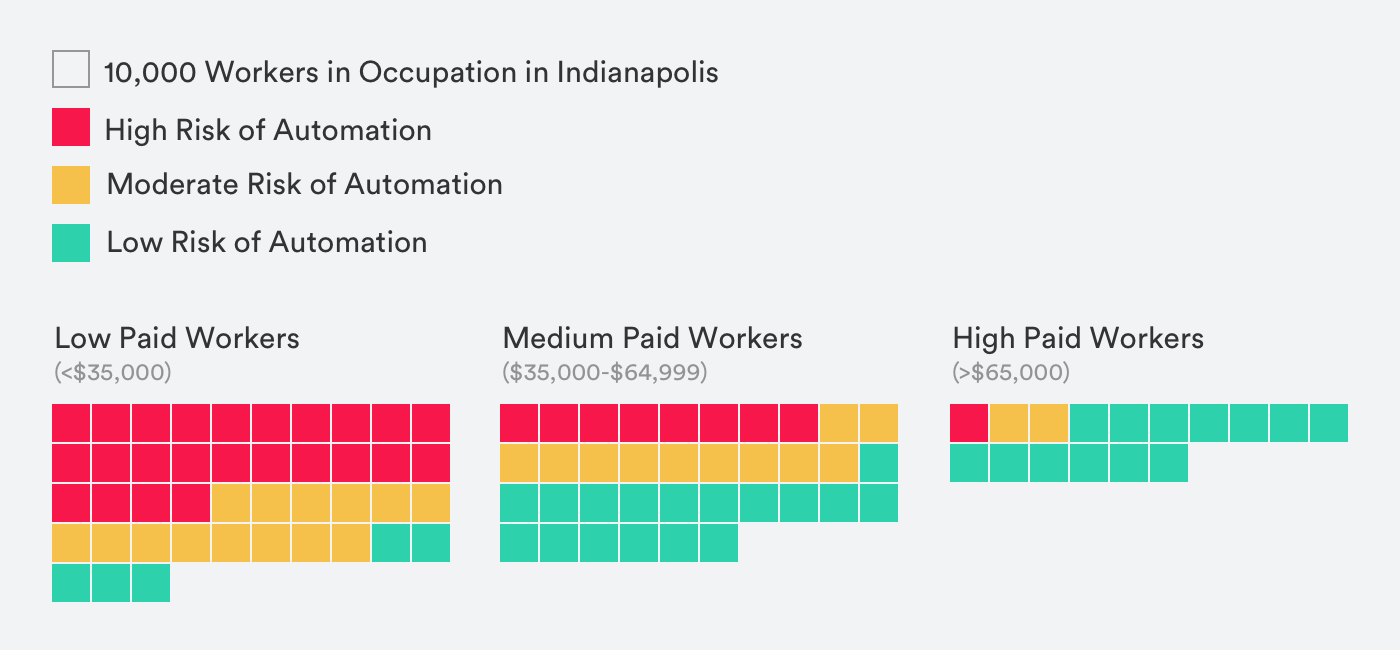
Workers who earn the least money
The jobs at high risk of automation are nearly half as well paid, on average, as the jobs at low risk of automation. The average annual salary of workers in the more than 130 jobs that are at high risk of automation is $31,085. Meanwhile, the average salary of the workers in the more than 250 jobs that are at low risk of automation is $66,803—more than double that of the high-risk workers.
Women
The high risk occupations in Indianapolis disproportionately employ women. Applying national averages of women employed across occupations, women constitute 55 percent of workers in high risk occupations in Indianapolis. When the high risk category includes the occupation “laborers and freight, stock and material movers, hand,” which is the largest occupation in the Indianapolis region and is exactly at the border of high and medium risk (85 percent risk of automation), women still constitute just over half (51 percent) of the workers at high risk of occupation. Women dominate in many food and retail-related industries that are especially high risk. For instance:
- Cashiers: Over 22,000 people in Indianapolis worked as a cashier – a job with a 97 percent risk of automation. Nationally, 73 percent of cashier jobs were held by women.
- Waiters and waitresses. Just under 19,000 people in Indianapolis worked as a waiter or waitress, which has a 94 percent risk of automation. Nationally, 70 percent of those jobs were held by women.
- Office clerks: More than 18,000 people in Indianapolis worked as office clerks – an occupation with a 96 percent risk of automation. Nationally, 83 percent of those positions were held by women.
- Secretaries and administrative assistants: More than 12,000 people worked as secretaries and administrative assistants in Indianapolis, which carry a 96 percent risk of automation. Nationally, 95 percent of those positions were held by women.
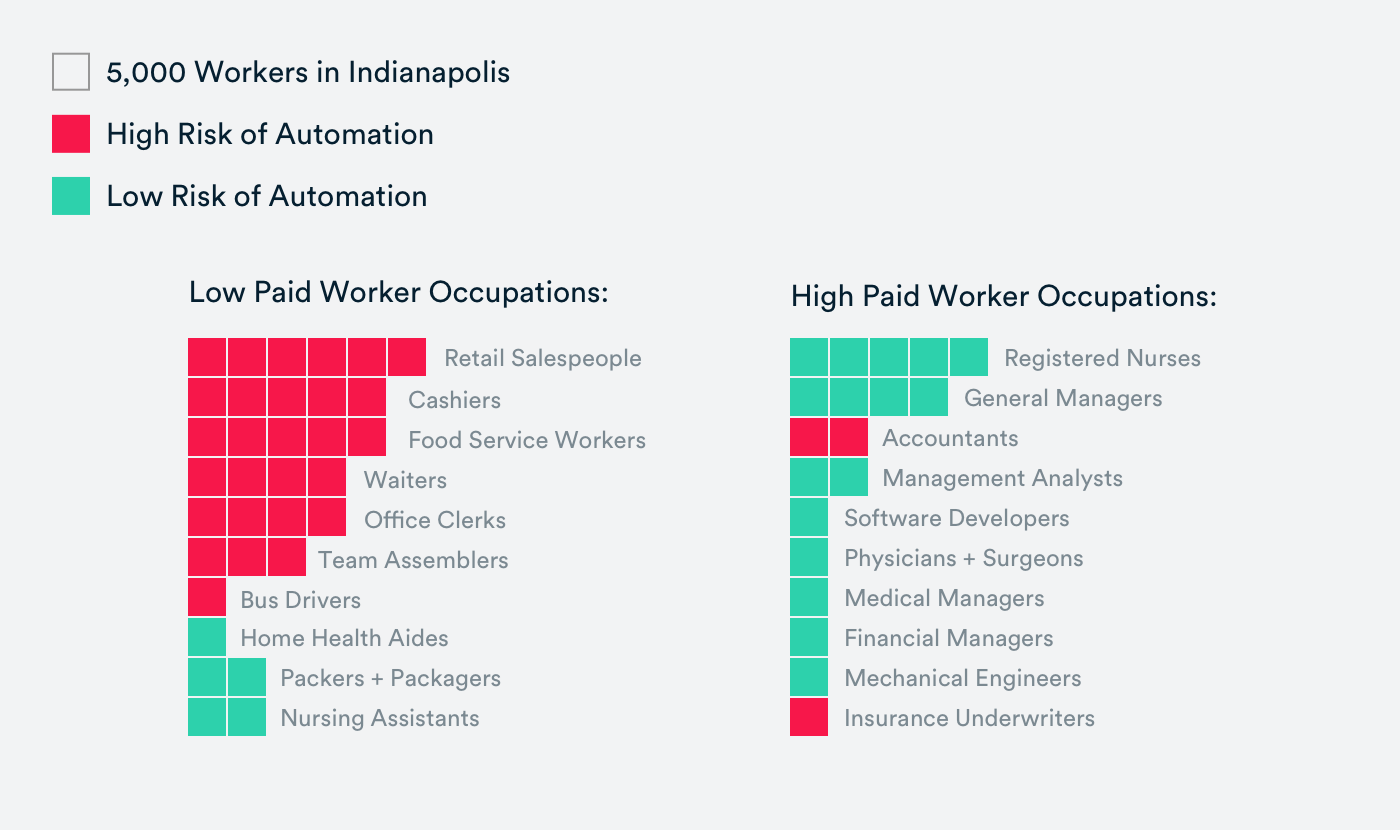
Occupations at Highest and Least Risk
The Largest Occupations Most at Risk
Of the 50 occupations that employ the most people in the Indianapolis metro area (totaling just over half of all workers), the following 18 occupations are the most at risk of automation.
| Pay Scale | OCCUPATION | # of people employed, 2016 | Average salary, 2016 |
|---|---|---|---|
| Retail Salespersons | 30,250 | $24,960 | |
| Combined Food Preparation and Serving Workers, Including Fast Food | 23,890 | $18,530 | |
| Cashiers | 22,760 | $19,670 | |
| Waiters and Waitresses | 18,900 | $22,240 | |
| Low paid <$35k | Office Clerks, General | 18,490 | $32,770 |
| Team Assemblers | 13,100 | $27,770 | |
| Cooks, Restaurant | 8,820 | $23,590 | |
| Shipping, Receiving, and Traffic Clerks | 8,120 | $28,700 | |
| Food Preparation Workers | 8,100 | $20,540 | |
| Industrial Truck and Tractor Operators | 6,090 | $32,740 | |
| Receptionists and Information Clerks | 6,020 | $29,280 | |
| Driver/Sales Workers | 5,460 | $23,790 | |
| Bus Drivers, School or Special Client | 5,410 | $25,530 | |
| Landscaping and Groundskeeping Workers | 5,380 | $26,170 | |
| Construction Laborers | 5,300 | $38,990 | |
| Middle Paid | Secretaries and Administrative Assistants, Except Legal, Medical, and Executive | 12,490 | $35,060 |
| ($35k - $65k) | Bookkeeping, Accounting, and Auditing Clerks | 10,570 | $40,450 |
| High paid > $65k | Accountants and Auditors | 9,200 | $69,420 |
Largest Occupations Least at Risk
Of the 50 occupations that employ the most people in the Indianapolis metro area (or about half of all workers), the following 18 occupations have a low risk of automation.
| Pay Scale | OCCUPATION | # of people employed, 2016 | 2016 average salary |
|---|---|---|---|
| Packers and Packagers, Hand | 9,910 | $22,880 | |
| Low paid (<$35k) | Nursing Assistants | 8,770 | $26,130 |
| Home Health Aides | 5,190 | $23,360 | |
| First-Line Supervisors of Office and Administrative Support Workers | 10,430 | $56,880 | |
| First-Line Supervisors of Retail Sales Workers | 8,390 | $43,130 | |
| Elementary School Teachers, Except Special Education | 8,150 | $50,880 | |
| Middle paid ($35k - $65k) | Sales Representatives, Services, All Other | 7,230 | $58,450 |
| Business Operations Specialists, All Other | 6,690 | $64,360 | |
| Secondary School Teachers, Except Special and Career/Technical Education | 5,760 | $54,560 | |
| Human Resources Specialists | 5,200 | $57,360 | |
| Licensed Practical and Licensed Vocational Nurses | 4,880 | $42,690 | |
| Computer User Support Specialists | 4,850 | $54,400 | |
| Registered Nurses | 23,640 | $63,340 | |
| Management Analysts | 6,740 | $76,030 | |
| High paid ( $65k - $90k) | Managers, All Other | 5,690 | $73,400 |
| Software Developers, Applications | 5,470 | $83,530 | |
| Top paid > $90k | General and Operations Managers | 17,600 | $107,990 |
| Physicians and Surgeons, All Other | 5,250 | $215,140 |
Top 50 Occupations by Number of People Employed
| OCCUPATION | # of people employed, 2016 | Risk level | Mean salary, 2016 |
|---|---|---|---|
| Laborers and Freight, Stock, and Material Movers, Hand | 34,190 | Medium Risk | $28,630 |
| Retail Salespersons | 30,250 | High Risk | $24,960 |
| Combined Food Preparation and Serving Workers, Including Fast Food | 23,890 | High Risk | $18,530 |
| Registered Nurses | 23,640 | Low Risk | $63,340 |
| Cashiers | 22,760 | High Risk | $19,670 |
| Customer Service Representatives | 22,470 | Medium Risk | $37,350 |
| Waiters and Waitresses | 18,900 | High Risk | $22,240 |
| Heavy and Tractor-Trailer Truck Drivers | 18,730 | Medium Risk | $48,970 |
| Office Clerks, General | 18,490 | High Risk | $32,770 |
| General and Operations Managers | 17,600 | Low Risk | $107,990 |
| Janitors and Cleaners, Except Maids and Housekeeping Cleaners | 14,660 | Medium Risk | $24,630 |
| Team Assemblers | 13,100 | High Risk | $27,770 |
| Secretaries and Administrative Assistants, Except Legal, Medical, and Executive | 12,490 | High Risk | $35,060 |
| Stock Clerks and Order Fillers | 12,350 | Medium Risk | $26,400 |
| Sales Representatives, Wholesale and Manufacturing, Except Technical and Scientific Products | 11,370 | Medium Risk | $72,680 |
| Bookkeeping, Accounting, and Auditing Clerks | 10,570 | High Risk | $40,450 |
| First-Line Supervisors of Office and Administrative Support Workers | 10,430 | Low Risk | $56,880 |
| Maintenance and Repair Workers, General | 10,000 | Medium Risk | $39,200 |
| Packers and Packagers, Hand | 9,910 | Low Risk | $22,880 |
| Accountants and Auditors | 9,200 | High Risk | $69,420 |
| Cooks, Restaurant | 8,820 | High Risk | $23,590 |
| Nursing Assistants | 8,770 | Low Risk | $26,130 |
| First-Line Supervisors of Retail Sales Workers | 8,390 | Low Risk | $43,130 |
| Personal Care Aides | 8,250 | Medium Risk | $21,210 |
| Elementary School Teachers, Except Special Education | 8,150 | Low Risk | $50,880 |
| Shipping, Receiving, and Traffic Clerks | 8,120 | High Risk | $28,700 |
| Food Preparation Workers | 8,100 | High Risk | $20,540 |
| Security Guards | 8,060 | Medium Risk | $25,200 |
| First-Line Supervisors of Food Preparation and Serving Workers | 7,240 | Medium Risk | $32,790 |
| Sales Representatives, Services, All Other | 7,230 | Low Risk | $58,450 |
| Teacher Assistants | 6,900 | Medium Risk | $23,940 |
| Management Analysts | 6,740 | Low Risk | $76,030 |
| Business Operations Specialists, All Other | 6,690 | Low Risk | $64,360 |
| Light Truck or Delivery Services Drivers | 6,550 | Medium Risk | $33,410 |
| Industrial Truck and Tractor Operators | 6,090 | High Risk | $32,740 |
| Receptionists and Information Clerks | 6,020 | High Risk | $29,280 |
| Maids and Housekeeping Cleaners | 5,760 | Medium Risk | $21,410 |
| Secondary School Teachers, Except Special and Career/Technical Education | 5,760 | Low Risk | $54,560 |
| Managers, All Other | 5,690 | Low Risk | $73,400 |
| Software Developers, Applications | 5,470 | Low Risk | $83,530 |
| Driver/Sales Workers | 5,460 | High Risk | $23,790 |
| Bus Drivers, School or Special Client | 5,410 | High Risk | $25,530 |
| Landscaping and Groundskeeping Workers | 5,380 | High Risk | $26,170 |
| Construction Laborers | 5,300 | High Risk | $38,990 |
| Physicians and Surgeons, All Other | 5,250 | Low Risk | $215,140 |
| Human Resources Specialists | 5,200 | Low Risk | $57,360 |
| Home Health Aides | 5,190 | Low Risk | $23,360 |
| Carpenters | 4,980 | Medium Risk | $44,490 |
| Licensed Practical and Licensed Vocational Nurses | 4,880 | Low Risk | $42,690 |
| Computer User Support Specialists | 4,850 | Low Risk | $54,400 |
How Does Indianapolis Differ From the U.S. Average?
Overall, the risk of automation facing workers in the Indianapolis region is exactly on par with the rate of risk across the U.S. workforce overall.
Looking more closely at specific occupational groups within the economy, there are some pockets of greater vulnerability and greater resilience.
Ways the Indianapolis area workforce is more resilient to automation than the nation overall
- Management, business and finance have a low risk of automation. As a percent of employment, Indianapolis’s population has 10 percent more workers in management positions than the national average, and 10 percent more workers in business and financial operations, both of which carry a low risk of automation.
- Compared to the national average, Indianapolis has 17 percent more workers in healthcare practitioner and technician positions, such as pediatrician or audiologists. These healthcare positions have a low risk of automation.
Ways the Indianapolis area workforce is more vulnerable to automation than the national overall
A far greater share of Indianapolis’s workforce is employed in transportation and material moving than the rest of the country. Indianapolis has 46 percent more of these jobs compared to the U.S. overall. This overall group of occupations has a medium risk overall, and includes several occupations with a high risk of automation including several types of drivers.
Indianapolis area employees are less well-represented in certain low-risk occupational groups than the national average. For instance, education, training and library occupations are at very low risk of automation. Indianapolis has 34 percent fewer workers in these occupations than the national average. Nationally, 73 percent of those positions are held by women. Thus, compared to the rest of the country, Indianapolis has significantly fewer low-risk jobs in education that overwhelmingly employ women.