Helen Bonnyman
Policy Associate, Future of Land and Housing

This brief analyzing annual eviction trends in Washington, DC, and recent eviction filing data is an updated version of our team’s November 2025 analysis. Here, we add four additional months of data, offering a full analysis of eviction filings from June 2025 through February 2026. For key takeaways, see our two-page summary of this analysis.
Each year, tens of thousands of District of Columbia residents are threatened with eviction. This profoundly destabilizing experience can lead to displacement, homelessness, job loss, adverse health and educational impacts, and downward economic mobility. And in DC, housing insecurity disproportionately affects Black and Latino families, as well as families with young children. As rents continue to climb, and 12 percent of DC residents face housing instability, housing security feels out of reach for many in the District.
In 2025, DC experienced severe economic setbacks—driven by the federal government targeting immigrants and federal workers—while local policy and funding changes reduced tenant protections and rental assistance. Starting in spring 2025 and intensifying last August, aggressive federal immigration enforcement across what is still purportedly a sanctuary city continues to cause trauma and economic pain among migrant communities. Immigration operations remain elevated, and the disruption and fear caused by surveillance, harassment, and detainment have suppressed immigrant communities’ ability to earn a living and pay rent.
Further, the Trump administration’s layoffs and buyouts of thousands of federal workers throughout 2025 have contributed to DC’s spiking unemployment rate. The nation’s longest-ever federal government shutdown in October and November 2025 further contributed to economic pain and uncertainty for DC residents. Lost wages continue to have ripple effects across the District, where residents’ consumer spending has recently declined.
Meanwhile, the local housing policy landscape has shifted to be less favorable for tenants. The Rebalancing Expectations for Neighbors, Tenants, and Landlords (RENTAL) Act, passed by the DC Council last September and in effect since January 1, 2026, reduces the required notice period before most evictions can be filed from 30 days to 10. The RENTAL Act also allows courts to resume adjudicating eviction filings where the tenant has a pending application for rental assistance—cases that had been on pause since 2020. Concurrently, local and federal funding for emergency rental assistance has dwindled. DC’s budget allocated $60 million to the program in 2024, but only $8.6 million in 2026.
The eviction process in DC involves multiple stages. An eviction case formally begins when a landlord files a complaint with the DC Superior Courts’ Landlord and Tenant Branch. This is called an eviction filing. It costs $15 to file an eviction in DC—one of the lowest filing fees in the country.
A subset of eviction filings result in an eviction judgment for the landlord. This means that a judge has determined the tenant violated the lease terms and the landlord can move forward with removing the tenant from that unit. Historically, judgments in favor of a tenant are rare in DC (in 2018 they represented less than 1 percent of non-payment of rent cases). Between a filing and a judgment, eviction cases can be dismissed or settled through an agreement between the tenant and landlord, meaning that not all filings will reach the judgment stage.
If an eviction judgment is rendered in favor of the landlord, the court sends the case to the U.S. Marshals Service, the law enforcement agency that carries out evictions in DC, to schedule the eviction (these are called scheduled evictions).
A completed eviction is recorded once U.S. Marshals visit a tenant’s address on their scheduled eviction date and ensure the tenant has left their home. Not all eviction judgments cause an eviction to be scheduled, and not all scheduled evictions are completed. For example, some tenants may enter into a repayment plan with the landlord that allows them to stay.
The number of cases resulting in a completed eviction does not capture the true volume of families harmed by the eviction process. Since some families move out after receiving an eviction filing or judgment but before their eviction is scheduled, we can assume that more displacements occur than are indicated by the number of completed evictions. Further, although some eviction filings are sealed by DC law, unsealed and even some sealed filings may appear in a tenant’s rental record, which landlords commonly use as a basis for screening out rental applications.
For the past five years, the Future of Land and Housing program (FLH) at New America has supported cities, counties, and states to collect and use eviction data to improve housing stability in their communities. Recognizing a gap in publicly accessible eviction analysis in DC, the FLH team, in partnership with January Advisors, set out to collect and analyze eviction records from the DC Superior Court. Updating our analysis of eviction filings from June 2025 through October 2025 published in November 2025, this brief gives an overview of annual eviction trends in DC and includes a detailed analysis of eviction filings for the nine-month period from June 2025 through February 2026.
In collecting data over this time period, we hope to lay the groundwork for tracking the impacts of these disruptions on DC renters, and surface insights to help city leaders make informed decisions that safeguard renter stability across the District.
The analysis in this brief relies on several eviction data sources to track eviction trends pre- and post-pandemic, as well as pre- and post-RENTAL Act. Table 1 provides additional detail on the data used in this analysis, including the eviction metric, time period, and source.
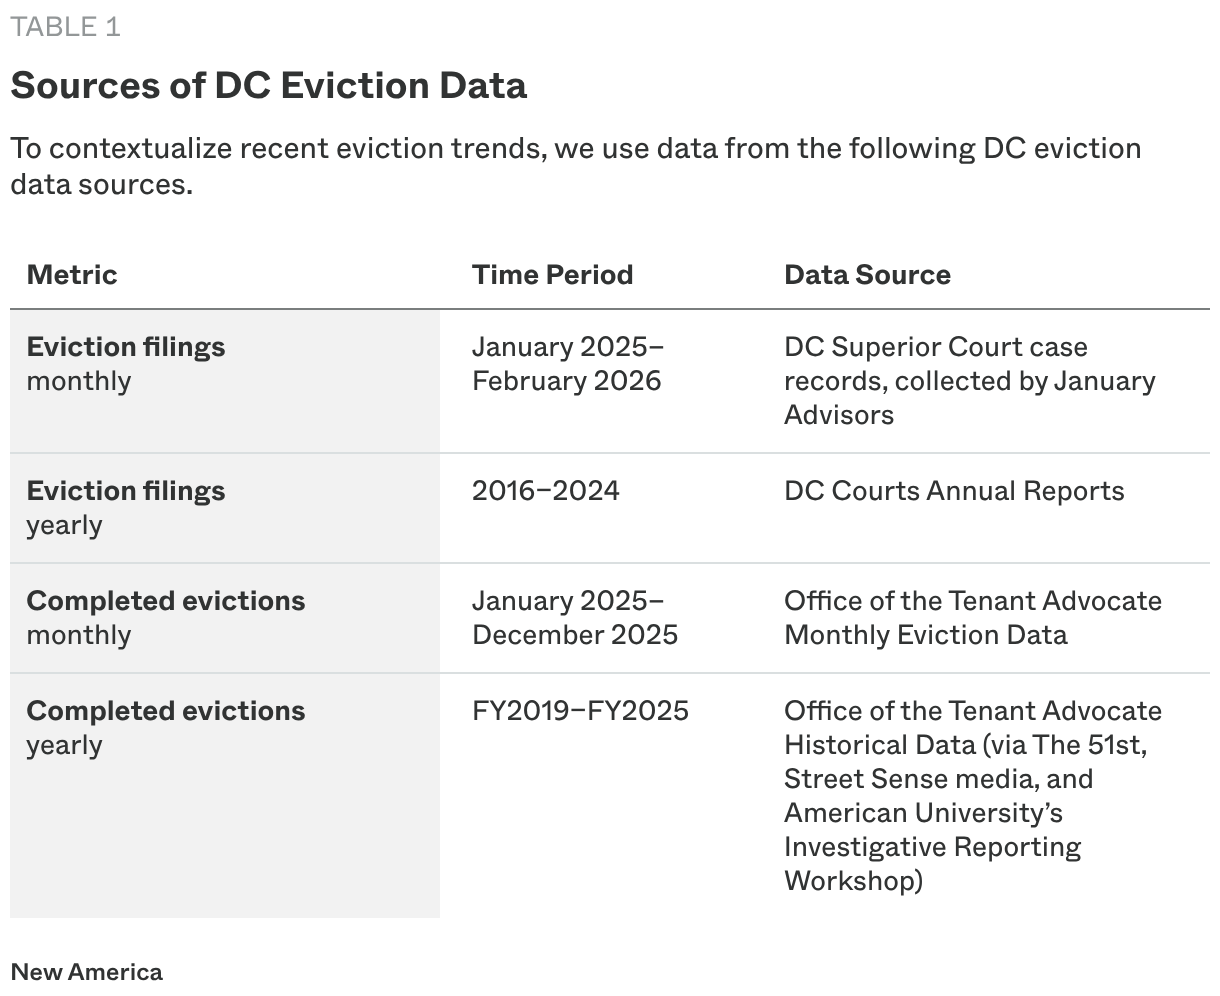
The detailed eviction filing analysis covering June 2025 through February 2026 uses data collected from the DC Superior Court. Starting in June 2025, January Advisors began conducting automated collection of publicly available residential eviction case records from the Superior Court’s online portals, including the names and addresses of plaintiffs, case filing dates, and information related to legal actions taken during the case. Note that the filing data includes all eviction filings, even if repeat filings against the same household. January Advisors extracted key pieces of information embedded within forms that landlords file with the court, including the total amount owed at the time of filing. Underlying data on renter households is from the U.S. Census Bureau’s American Community Survey 5-year estimates, 2019–2023, unless otherwise specified.
For more information on the methods used to collect and analyze filing data, see the methodology section, including details on how we used estimates to account for the projected numbers of sealed records.
In 2025, an estimated 12,780 eviction cases were filed against District renters, as shown in Figure 1. (For more information on estimation methods, see the methodology section.) The 2025 eviction filing rate of 6.8 percent—or about seven filings for every 100 renter households—places DC around the midpoint of the 35 cities Eviction Lab regularly tracks.
Eviction filings fell to a low of 663 in 2021 during DC’s pandemic eviction moratorium, which phased out by the end of 2021. Since filings have resumed, the number of evictions filed annually has held steady the last few years, averaging around 12,700 over the last three years. This represents a 58 percent drop from pre-pandemic to now: Between 2016 and 2019, there were an average of 30,455 evictions filed each year, impacting around 16 of every 100 renter households annually.
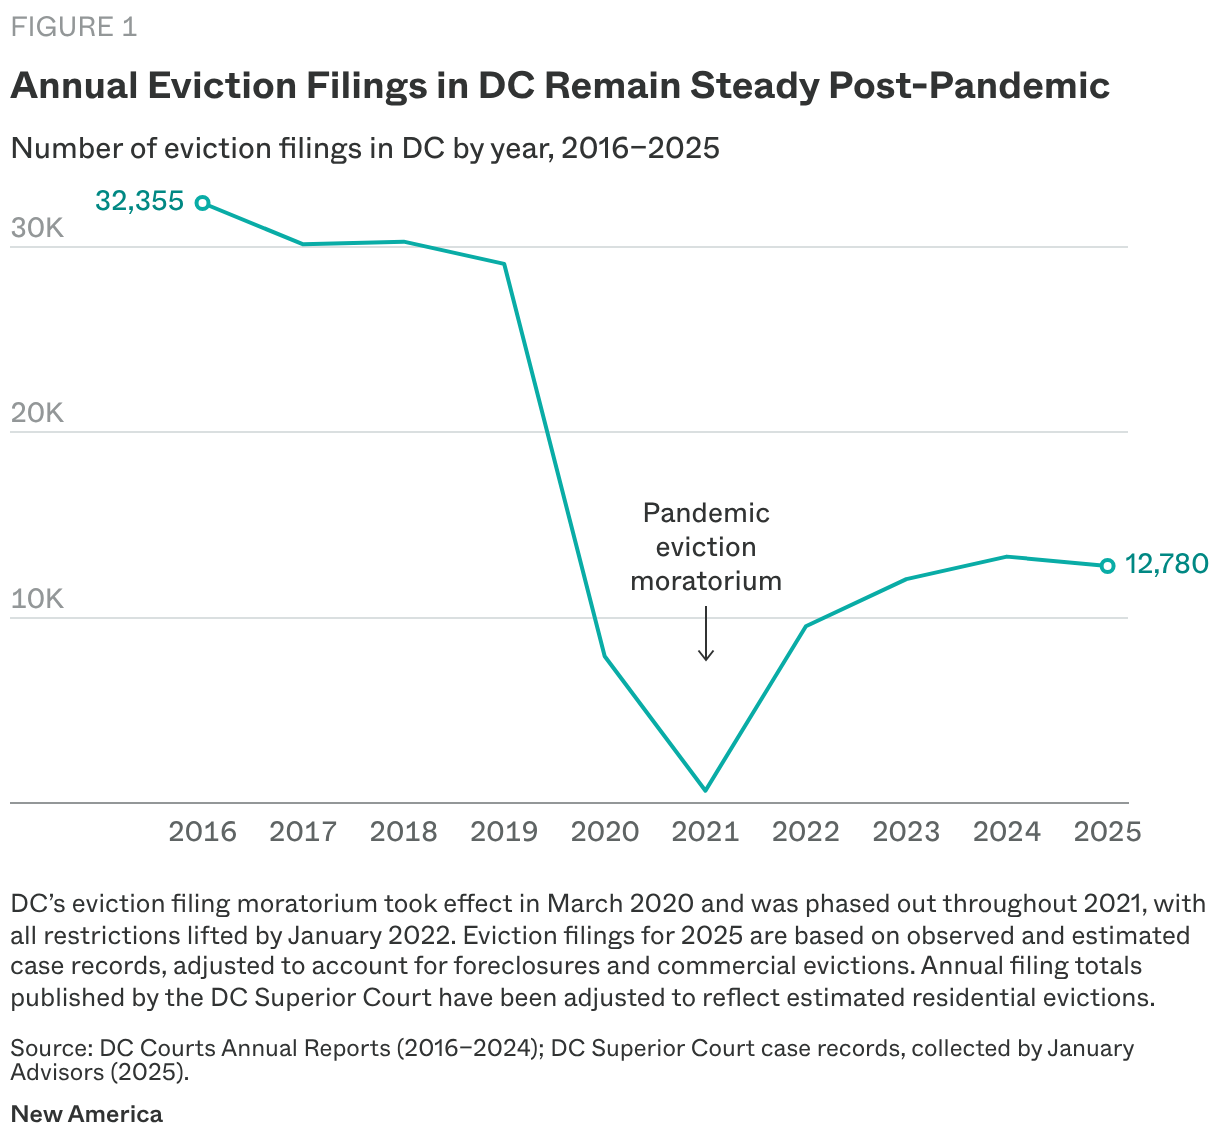
Legal services providers and tenant advocates point to two policies enacted during the pandemic that likely explain the drop in filing levels from pre-pandemic to now: a ban on filings for less than $600 in back rent, and the requirement that DC landlords wait at least 30 days after a missed rent payment before filing for eviction. Advocates and legal aid groups have observed, and research has shown, that prior to these policies, landlords frequently filed cases once rent was only a few days past due as a means of accelerating rent collection. The ban on filings under $600, and the longer notice period, likely allow tenants to catch up on rent after temporary financial setbacks and reduce frivolous filings by landlords.
As shown in Figure 2, in fiscal year (FY) 2025, there were 1,933 completed evictions in DC, representing a seven-year high. In FY 2019—the only pre-pandemic year for which data is available—there were 1,493 completed evictions. From FY2019 to FY2025, completed evictions increased by 23 percent.
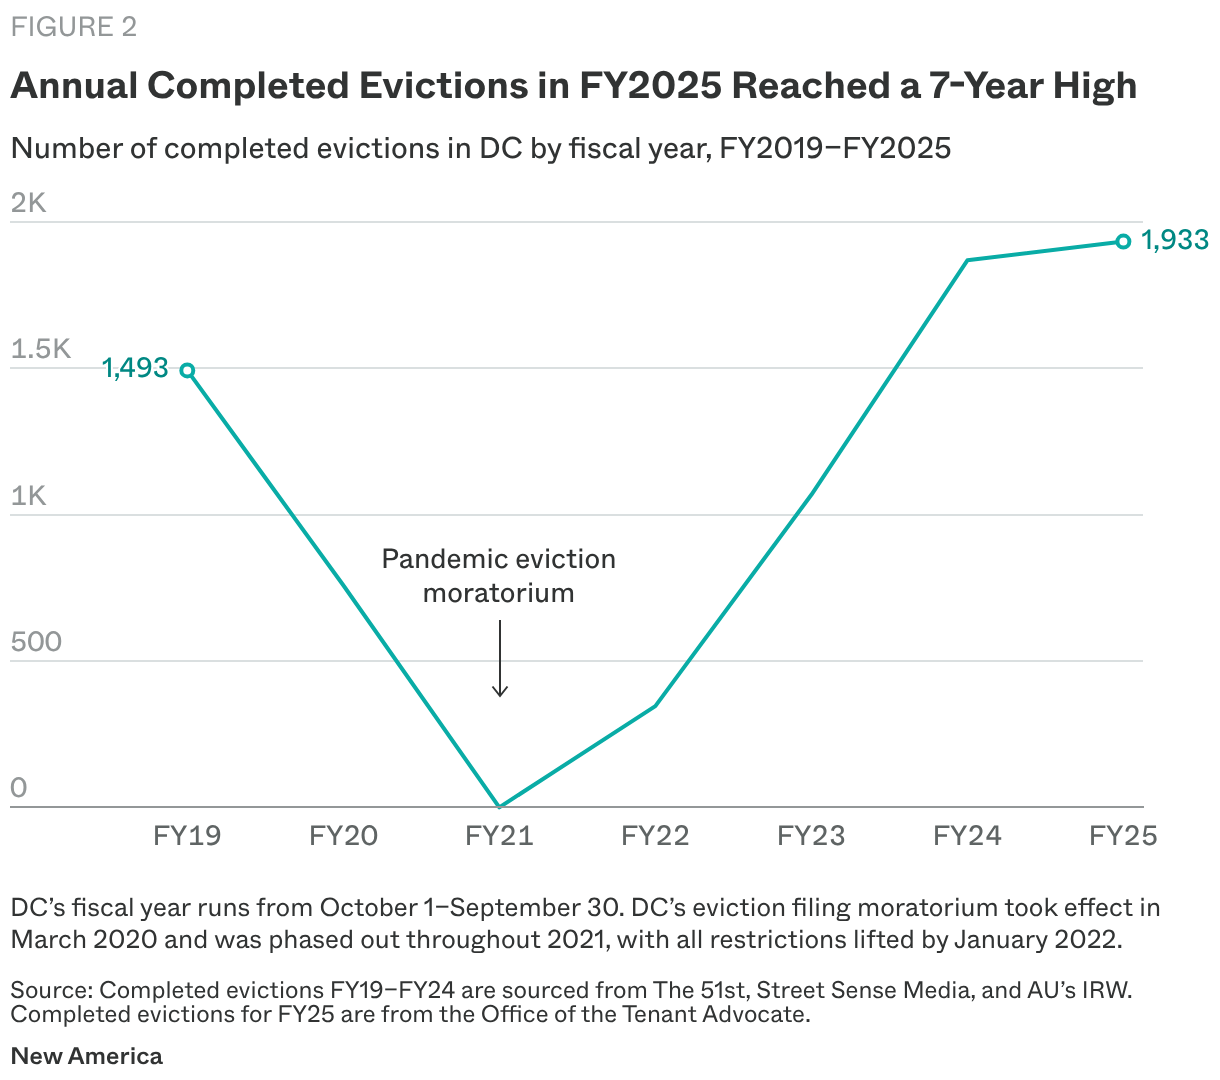
There are several potential explanations for why completed evictions have increased even amidst a 58 percent drop in filings. It is possible we are seeing a temporary spike from the court working through a pandemic-era backlog of eviction cases. The combination of dwindling rental assistance and rising rents may make it harder for landlords and tenants to work out a payment plan post-filing. In some cases, unaffordable rental prices leave fewer tenants with the option to relocate after a filing, causing them to stay in place until a court-ordered eviction has been enforced.
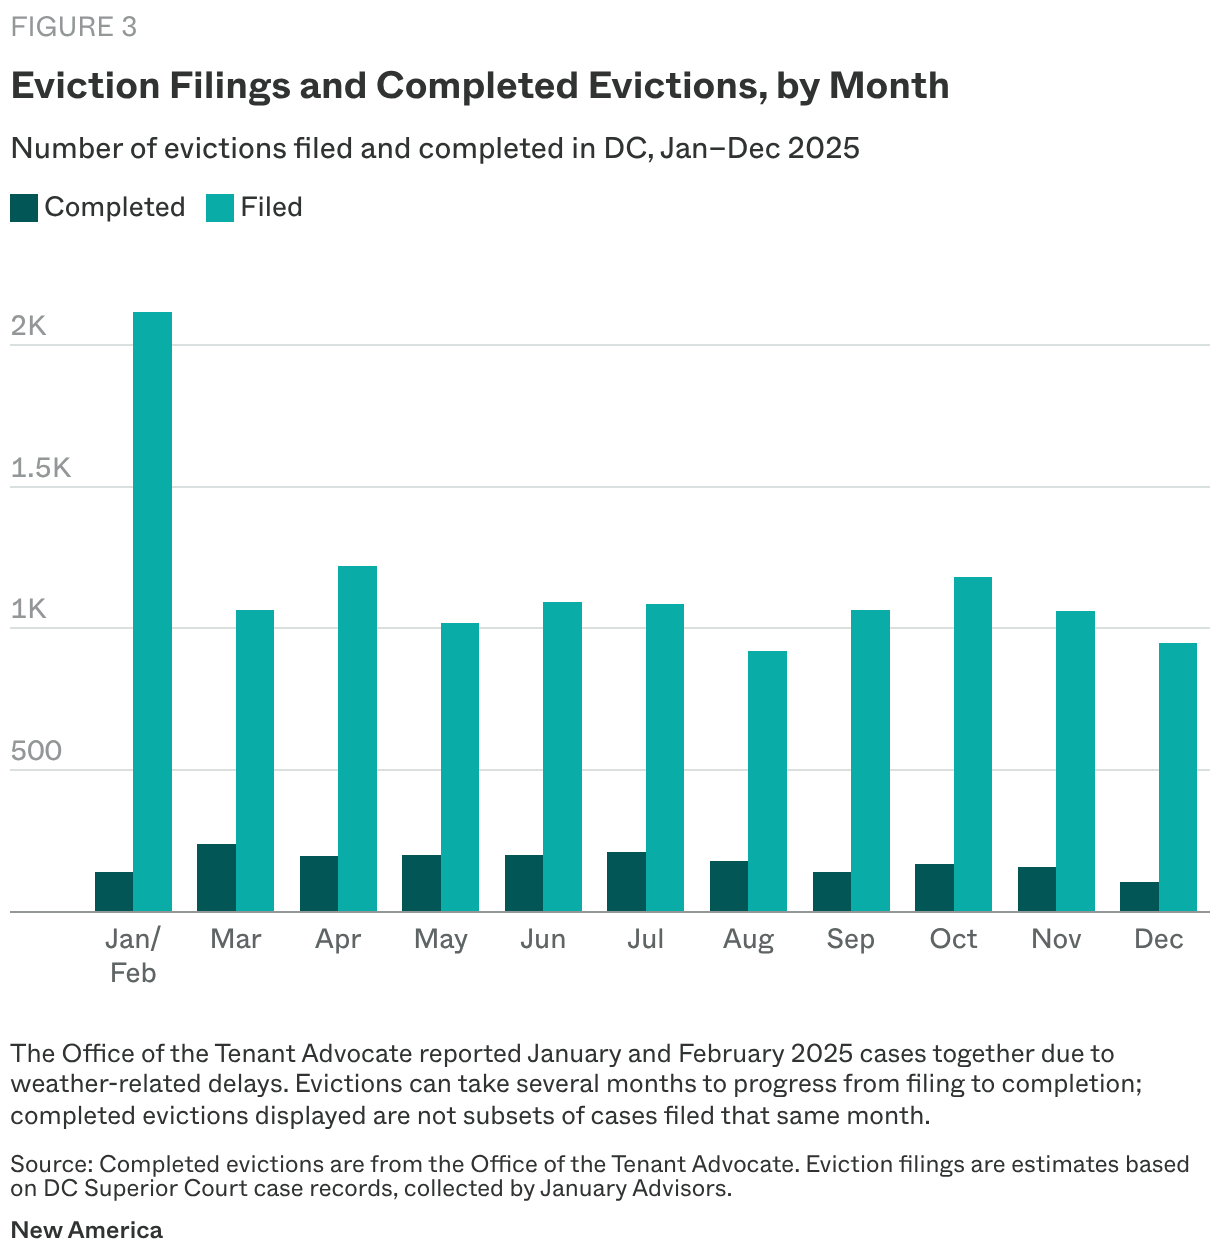
DC saw a monthly average of 1,065 eviction filings and 162 completed evictions in 2025, as shown in Figure 3. April 2025 saw the highest number of eviction filings in 2025 (1,222), while August had the lowest (950). Completed evictions peaked in March 2025 (238)—potentially due to a backlog postponed due to winter weather—and reached their lowest point in December 2025 (104).
Although DC Court records capture eviction case outcomes, including whether cases were dismissed, settled, or decided in favor of the landlord or tenant, the outcomes data we collected had significant limitations that prevented further analysis. Under DC law, eviction cases are sealed within 30 days unless the case is decided in favor of the landlord. Because these cases are not visible in the court records after sealing, we do not have insight into the outcomes of a broad swath of cases. As such, meaningful analysis on case outcomes, including how long cases last or how much tenants owe at time of judgment, is not possible. Eviction record sealing is critical for preserving privacy and protecting tenants’ future housing stability, though figuring out ways to make available de-identified data for research purposes should also be part of court processes.
We began collecting detailed data on eviction filings from the DC Superior Court in June 2025. This section provides a deep dive into what we’ve learned about the 9,701 evictions filed in DC between June 2025 and February 2026, including where in the District filings are happening, who is filing the most evictions, and how much tenants owe at the time of filing.
Hardest-hit wards: Between June 2025 and February 2026, Ward 8 had by far the highest number of eviction filings (2,816 filings), followed by Ward 7 (1,502 filings), Ward 5 (1,500 filings), and Ward 6 (1,476 filings), as shown in Figure 4. Ward 8 saw nearly four times as many filings as Ward 1 over this nine-month period, and about eight times as many filings as Ward 2.
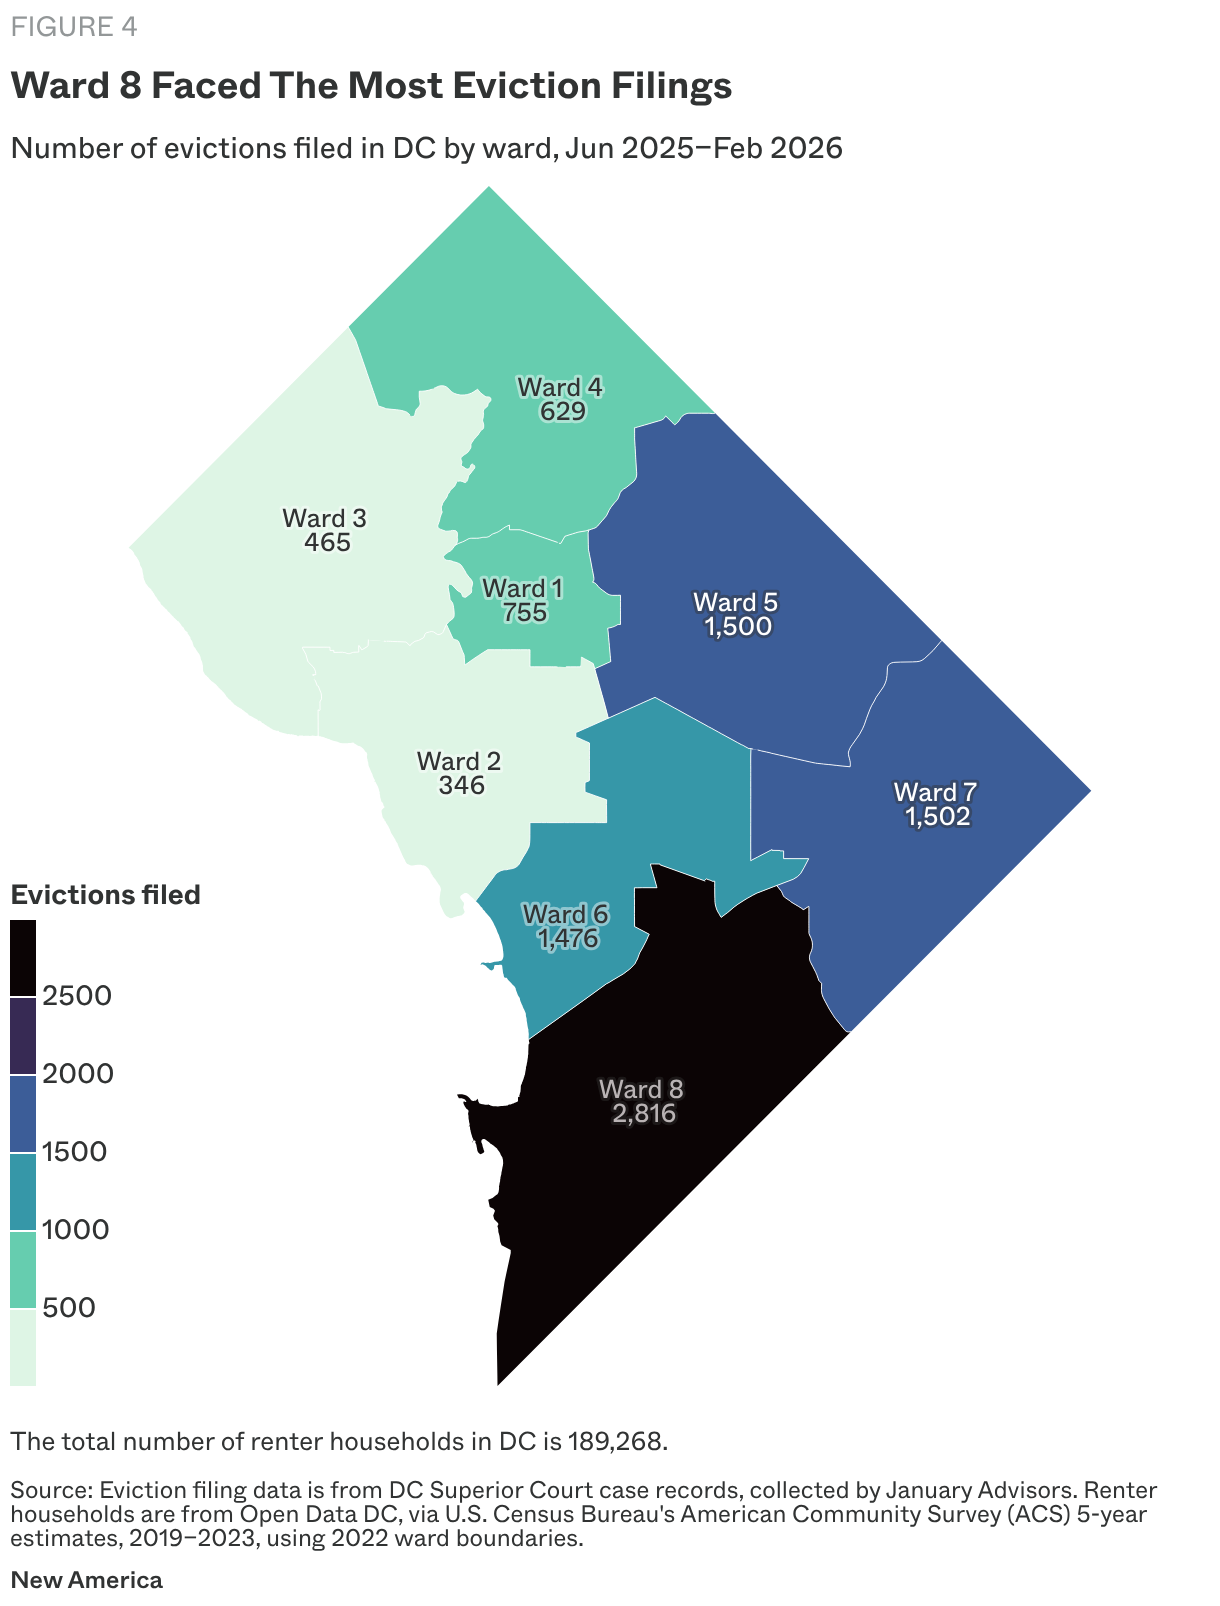
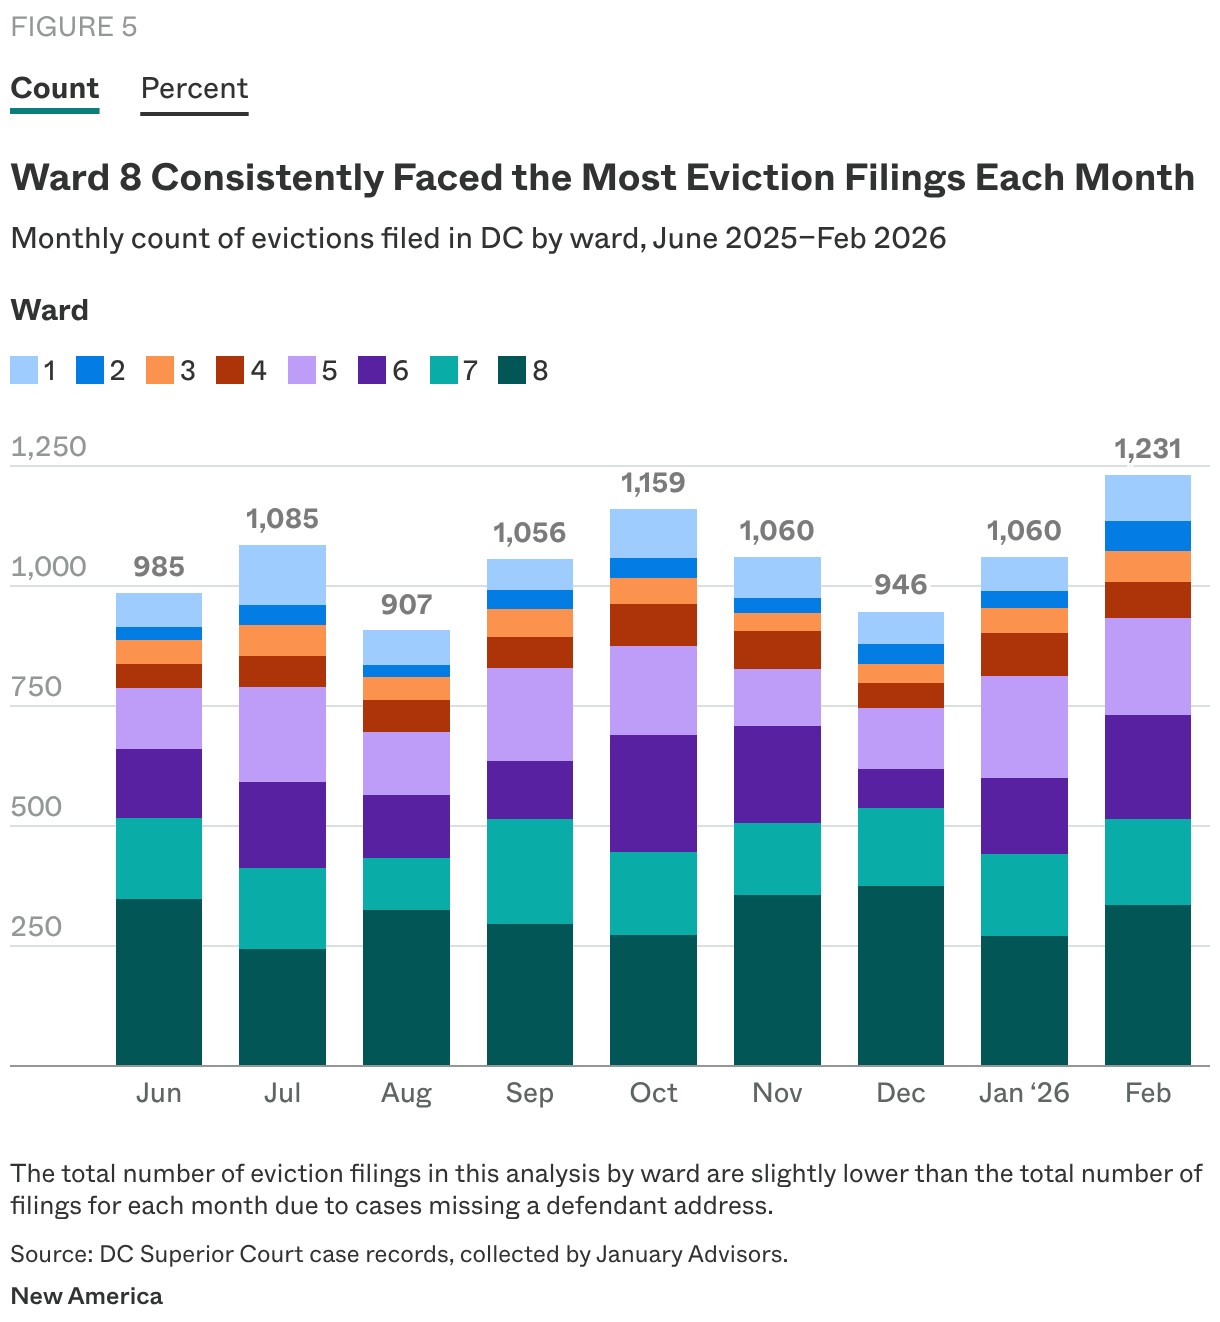
Figure 5 displays the number of eviction filings by ward over this time period, as well as filings in each ward as a percent of the monthly total. The “count” view reveals that 1,231 cases were filed in February 2026—the most monthly filings since June 2025. It’s too soon to identify trends based on the RENTAL Act’s implementation, but monthly filing volume will be a key metric to track going forward.
Comparing each ward’s share of eviction filings with its share of DC’s renter population tells us where renters are disproportionately facing eviction across the District. The shares of eviction filings in Wards 4 and 6 are proportional to their shares of DC’s renter population. Wards 1, 2, and 3 have fewer shares of filings compared to their renter population. Wards 5, 7, and 8 have disproportionately large shares of eviction filings District-wide.
Of particular note, Ward 8 accounted for 30 percent of the District’s eviction filings during this nine-month period, despite only comprising 16 percent of the renter population. As shown in the “percent” view in Figure 5, in December 2025, Ward 8 saw 374 filings—the highest monthly total in any ward during the nine-month period—making up 40 percent of all eviction filings District-wide that month.
Washington, DC, contains more than 130 neighborhoods varying in land mass and population. These individual neighborhoods form the smallest recognizable geographic unit for most DC residents, and they evolve over time with residents’ understanding of their neighborhoods. Neighborhood clusters are larger, more standardized geographic units developed by the DC Office of Planning to conform to census tract boundaries. Individual neighborhood boundaries do not conform neatly to census tract or neighborhood cluster boundaries, and we do not have underlying data on the number of renter households or any other characteristics for individual neighborhoods.
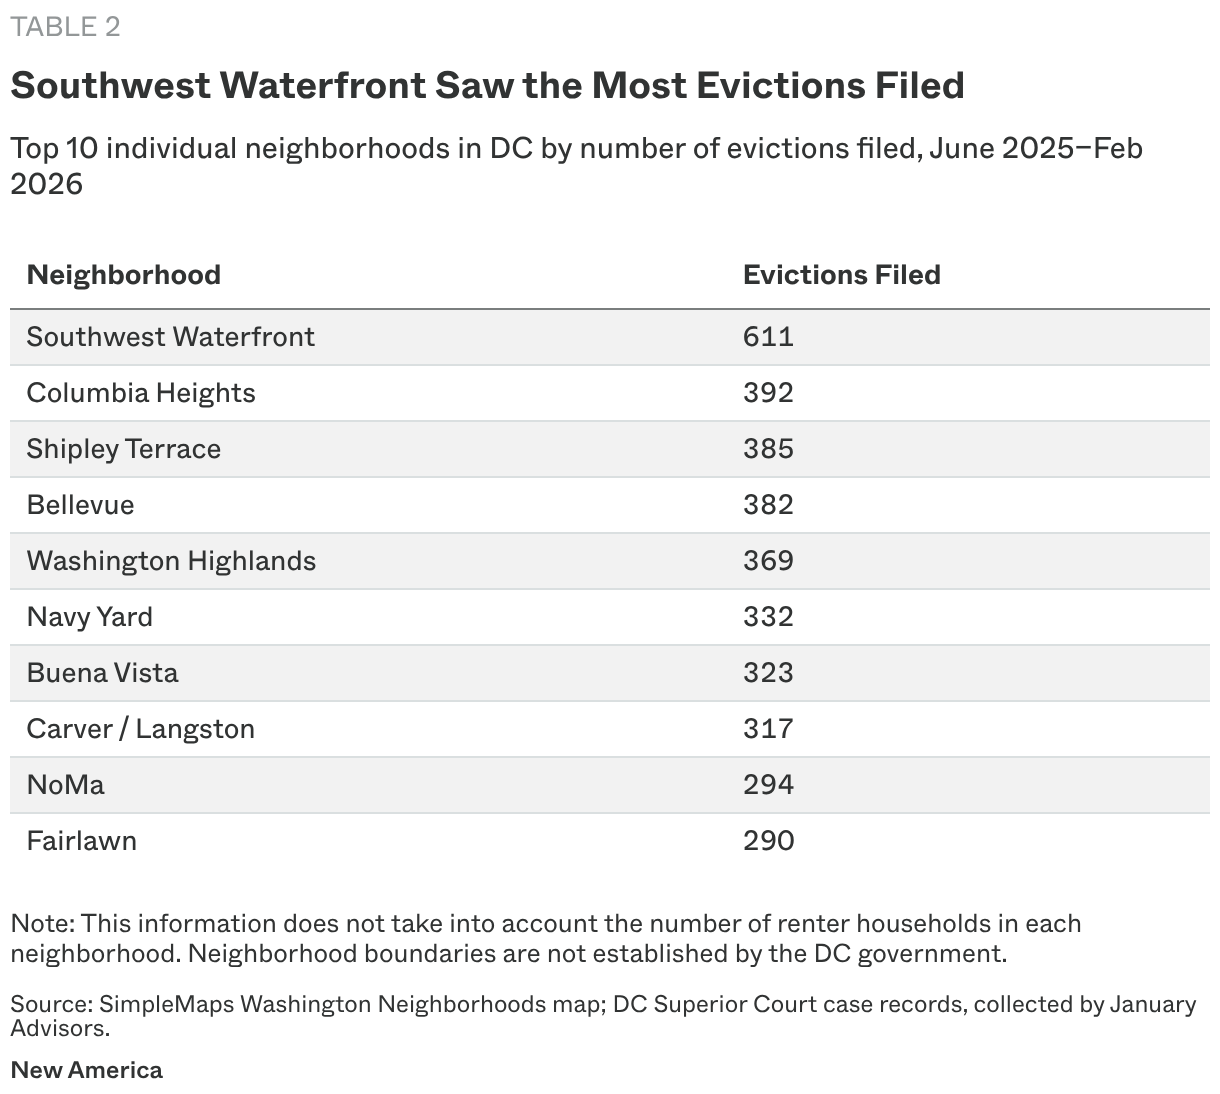
Because individual neighborhoods, while somewhat subjective and fluid over time, are how residents typically identify where they live and who their neighbors are, tracking eviction filings at this level is useful. In Table 2, we present total counts of eviction filings in individual neighborhoods, without taking into account filings per renter household. This individual neighborhood-level list spotlights individual neighborhoods that experience high volumes of filings, which may be useful for tenant outreach and direct service provision.
At the same time, assessing eviction filings at the neighborhood cluster level, as shown in Figure 6, allows us to utilize Census Bureau American Community Survey data tabulated by Urban Institute-Greater DC to track eviction filings per 1,000 renter households, in addition to total filing counts. This lets us meaningfully compare the prevalence of filings across different parts of the District by taking into account the density of renter households within each neighborhood cluster.
For example, dense, renter-heavy Columbia Heights in Ward 1 has the second-highest total filing count as an individual neighborhood, and the neighborhood cluster it largely sits within has the fourth-highest total filing count in this time period. But filings per 1,000 renter households in the Columbia Heights neighborhood cluster are not nearly as high as in neighborhood clusters east of the Anacostia River.
Hardest-hit individual neighborhoods: Between June 2025 and February 2026, Southwest Waterfront (Ward 6) was the individual neighborhood with the most eviction filings in the city, followed by Columbia Heights (Ward 1) and Shipley Terrace (Ward 8). Individual neighborhoods with the highest filing counts cover all four of the city’s quadrants and span Wards 1, 5, 6, and 8. Just five individual neighborhoods accounted for 22.5 percent of the city’s eviction filings over this nine-month period.
Hardest-hit neighborhood clusters: Figure 6 maps eviction filings per 1,000 renter households,1 and the total number of eviction filings, in each neighborhood cluster. The “per 1,000 households” view shows that neighborhood clusters in Wards 7 and 8 have high filing frequencies.
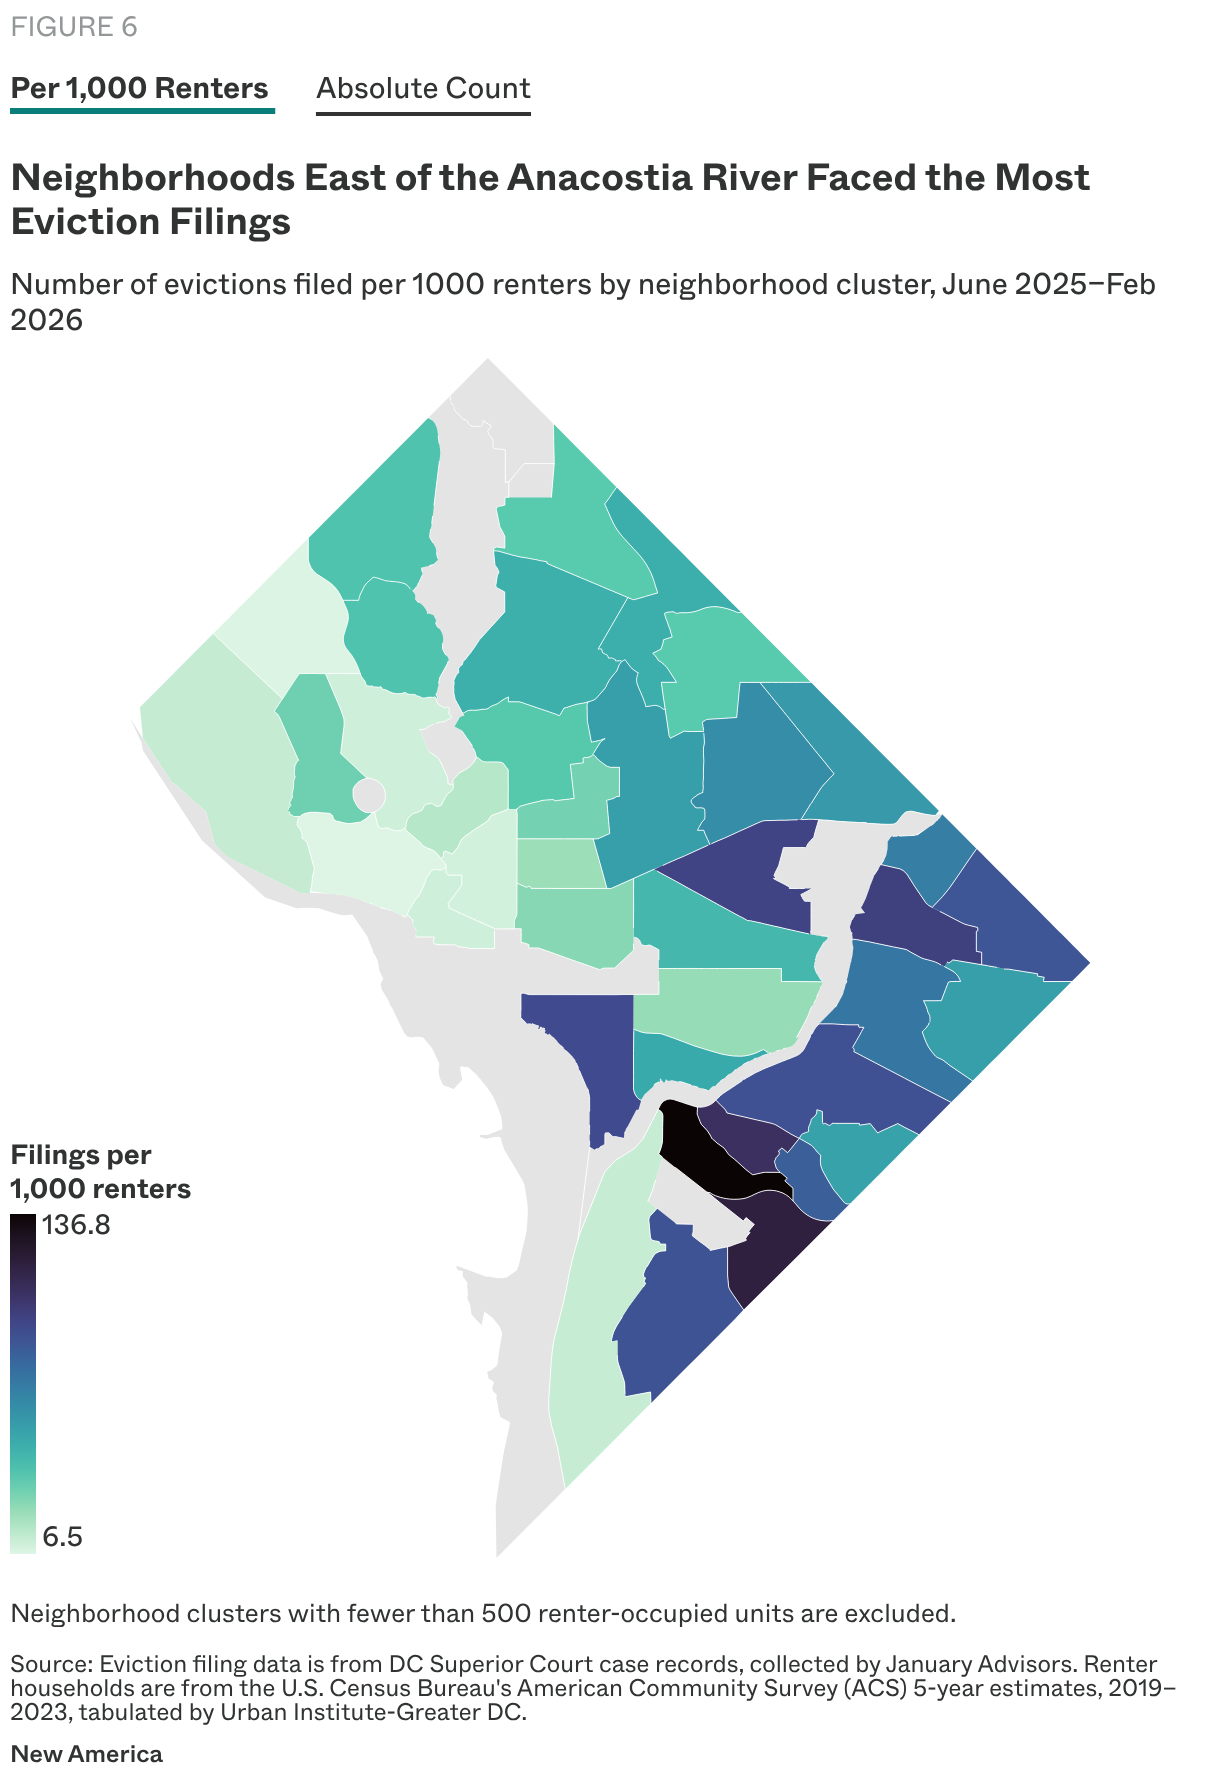
The neighborhood clusters with the highest eviction filings per renter household are all located in Ward 8: Sheridan/Barry Farm/Buena Vista, Douglas/Shipley Terrace, and Historic Anacostia. These three neighborhood clusters are home to 4.4 percent of the District’s renters, but account for 10.4 percent of all eviction filings.
Large disparities exist in the frequency of eviction filings per neighborhood cluster. Renter households in Sheridan/Barry Farm/Buena Vista are 2.7 times more likely to receive an eviction filing than neighbors across the river in Navy Yard/Near Southeast, and 13.3 times more likely than neighbors across the District in Cleveland Park/Woodley Park.2
The neighborhood clusters with some of the highest filings per renter household—which in addition to those mentioned in Ward 8 include Deanwood/Burrville (Ward 7), Mayfair/Hillbrook (Ward 7), and Congress Heights/Bellevue (Ward 8)—are also much more likely to be cost-burdened (paying 30 percent or more of their income towards housing costs) than residents of other clusters, according to 2019–2023 Census Bureau American Community Survey data.3
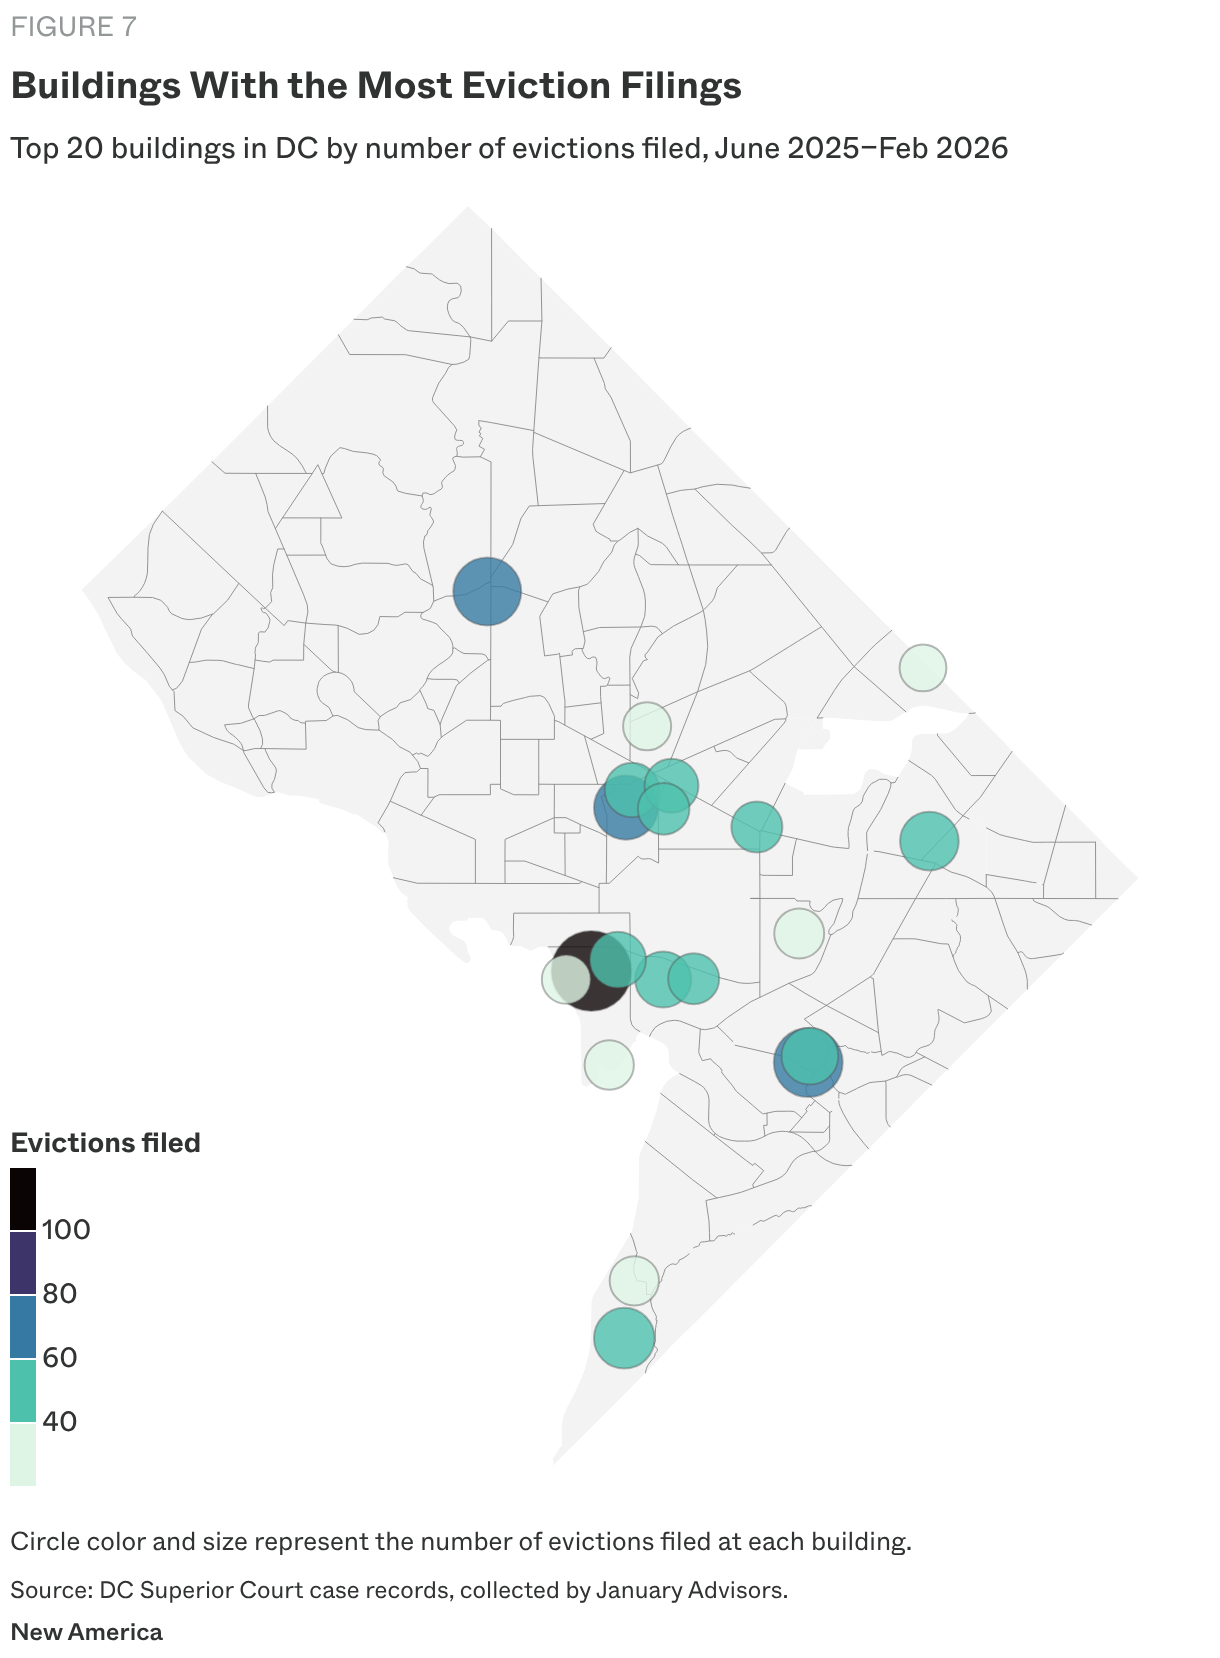
Between June 2025 and February 2026, the top five management companies were responsible for 21 percent of the city’s eviction filings. Several of these companies manage or own multiple large apartment buildings in DC, and the volume of filings in part reflects their large portfolios. Without data on the number of units per property management company or per apartment building, we are not able to assess the frequency of filings per household in their portfolios.
Understanding that just a few property management companies account for a large share of eviction filings city-wide can help service providers and other eviction prevention organizations target outreach and resources to residents living in buildings owned by those companies.
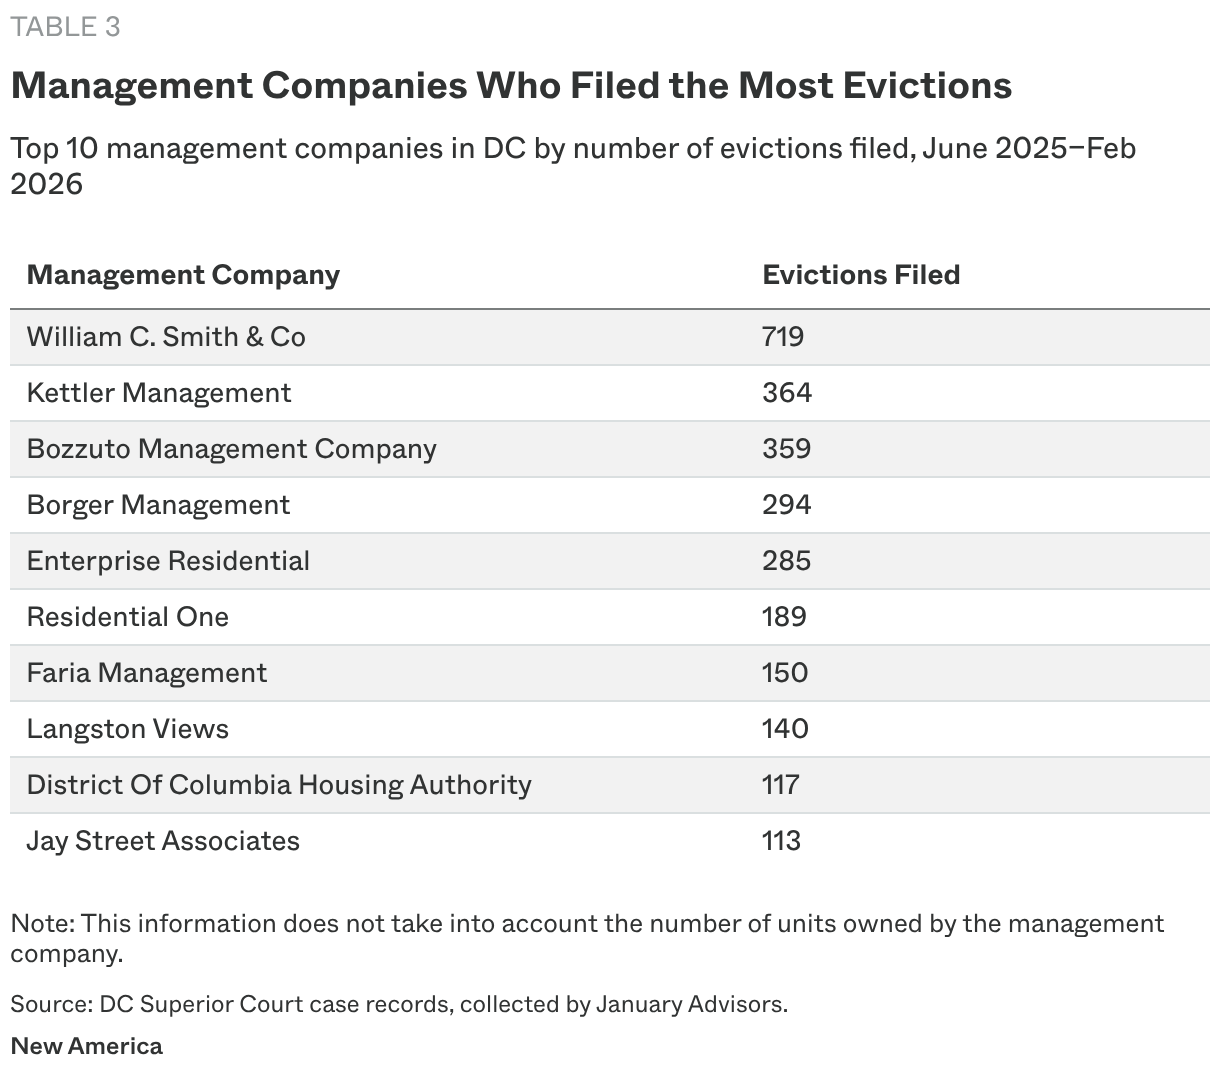
Figure 7 below maps the 20 buildings in DC with the most eviction filings during this time period. Several of these buildings with the most filings are owned by the same management company.
The median amount of back rent owed by tenants at the time of an eviction filing between June 2025 and February 2026 was $4,851. As illustrated by Figure 8, half of tenants with a filing from this time period owed less than $4,851 at the time of filing, and three-quarters owed less than $9,311.
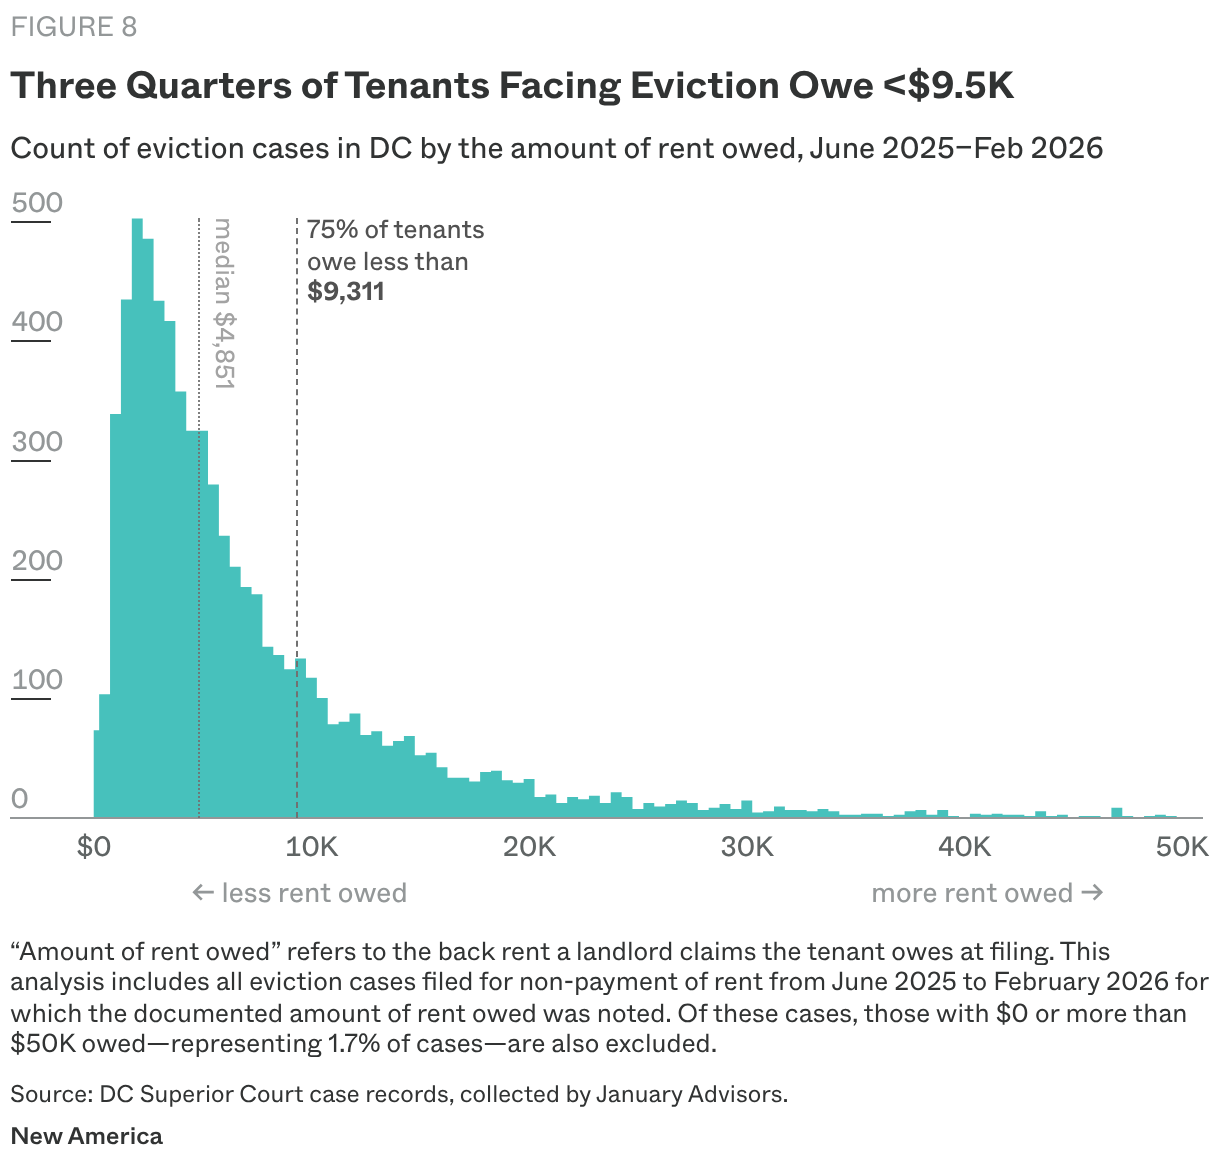
People facing eviction tend to pay lower rents than the average DC renter. Based on a sub-sample of around 1,100 cases that included the tenant’s monthly rent in the court records, the median monthly rent for tenants who received an eviction filing during the nine-month period was $1,445. This is substantially lower than the city’s median rent of $2,600 and suggests that many tenants are about three and a half months behind on rent.
The RENTAL Act, in effect as of January 2026, shortens the notice period from 30 days to 10 days for non-payment of rent cases. Tracking rent owed in case filings throughout 2026 and beyond will help shed light on how landlords adjust their filing timelines once tenants are behind on rent, painting a picture of how the RENTAL Act is changing the eviction landscape in DC.
Evictions are a crucial indicator of a city’s housing stability and of its overall economic and social health. Tracking evictions is always important, but especially as new RENTAL Act policies that directly impact how DC landlords and tenants navigate the eviction process go into effect.
As in many jurisdictions across the country, DC’s court publishes only basic eviction data, and in the aggregate. We worked with January Advisors to build an automated tool to collect this data from tens of thousands of individual court records that are available inside online court dockets. But doing so requires technical expertise and financial resources that may not be widely available across the eviction prevention community. In reality, local leaders cannot access and analyze crucial data that could help them stem evictions, and the public can’t hold city leaders accountable for failing to keep evictions down.
Knowing how much people owe in back rent can inform successful rental assistance programs. Identifying where more eviction activity is happening lets us target resources and assistance to reduce preventable evictions. A lack of comprehensive data prevents more in-depth tracking of who is most at risk of eviction, what actually happens to households that go through the eviction process, how long that process takes, and what these households need to avoid displacement. This allows narratives that are not grounded in comprehensive data analysis to gain traction, impeding the ability of policymakers, advocates, and housing leaders to make informed policy decisions. DC’s Superior Court, mayor, and council should work together to make responsible eviction data sharing a reality in order to monitor and protect housing stability for as many DC residents as possible.
There were three data sources used in this analysis:
DC Courts use the “Landlord Tenant” designation to classify eviction cases. These cases are organized by year, court, and case number (e.g., 2025-LTB-000001). The case numbers are sequential, allowing us to impute sealed cases based on missing case numbers from the DC Courts public portal. In other words, if case number 001 exists, and case number 003 exists, we estimate that case number 002 exists and has been sealed.
In order to project the total number of cases filed in 2025, we used a combination of observed and estimated cases for January through May 2025, and individual observations for June through December 2025.
Our goal in this analysis is to represent residential household eviction trends. In our individual case observations, we found that, on average, approximately 3 percent of cases were commercial evictions or residential foreclosures. Using this as a benchmark, we applied this 3 percent reduction to the filing numbers reported in the 2016–2024 DC Courts annual reports. From January 2025 through February 2026, we removed these cases directly from observed and estimated records. In the months where we did not have complete data, we used that month’s rate of commercial evictions and foreclosures and reduced the count of missing cases accordingly. The monthly rate of commercial evictions or residential foreclosures during this 14-month period ranges from 0.8 percent to 4.4 percent.
Monthly filing estimates reported in New America’s analysis of eviction filings from June through October 2025, published in November 2025, vary slightly from the monthly filing counts reported in this updated analysis. This is because we improved coverage of observed cases and adopted the more nuanced approach to removing commercial evictions and residential foreclosures from the dataset.
All individual case observations represent data that was available on the DC Superior Courts public webpage at the time of observation. This includes information available directly on the website, as well as information contained in the complaints.
Information was parsed from both the website and the complaint PDF (Forms 1A and 1B) to construct the dataset. Each complaint PDF was parsed using a paid Anthropic account, and we used a custom prompt to locate each field. The data was subjected to quality control measures, such as removing duplicate case numbers and unrelated cases, as well as performing random quality checks.
All case filings were geocoded using the defendant address in the court record. Those coordinates were used to determine the property’s neighborhood and ward. Due to limitations in court records, 28 cases out of the 9,701 filings were not able to be geocoded and are not included in the geographic analyses presented here.
Data for top plaintiffs and top addresses were transformed in order to account for variations in the way court documents are filed. For example, “1 Main Street Apartments, LLC” and “One Main Street Apts” undergo text transformation to standardize into “1 MAIN STREET APARTMENTS.” The text standardization process includes data transformations for property names, abbreviations, and suffixes, as well as street numbers, street suffixes, and directionals.
The authors would like to extend their thanks to local and national housing advocates and researchers who helped inform and contextualize this research, including Adam Jacobs, Brian Rohal, Elena Bowers, Catherine Quinn, Peter Tatian, Leah Hendey, Mychal Cohen, and Nancy Drane. Thanks in particular to Urban Institute-Greater DC for making American Community Survey data tabulated at the neighborhood cluster level available.
We would also like to extend our gratitude to our New America colleagues Liz Cory, Elena Gooray, Jodi Narde, and Kelley Gardner for their invaluable data visualization expertise and editorial support.
Policy Associate, Future of Land and Housing

Founder, January Advisors

Deputy Director, Domestic Housing

Senior Fellow and Director, Future of Land and Housing