CORRECTION: Revised Data on Parent PLUS Report

Blog Post
Jan. 10, 2014

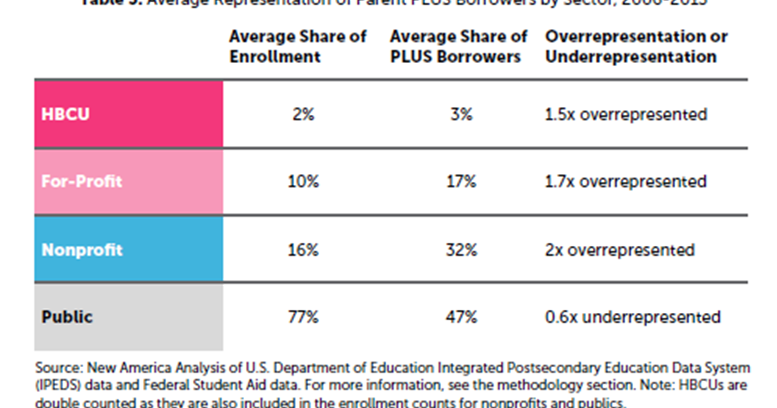
Wednesday, the Education Policy Program hosted a panel event on Parent PLUS loans in conjunction with the release of my paper, The Parent Trap: Parent PLUS Loans and Intergenerational Borrowing. At the event, panelist Steve Gunderson of the Association of Private Sector Colleges and Universities pointed out a data discrepancy in my report. He noted that the share of for-profit undergraduate enrollment should be closer to 10 percent, not around 6 percent as reported. I ran the numbers again and have discovered that there was a data merging issue between U.S. Department of Education IPEDs data and Federal Student Aid data.

In Federal Student Aid data, some institutions with multiple campuses are lumped together under one unique, short identifying number (OPEID). But in IPEDS, institutions with multiple campuses are often represented with separate, longer OPEIDs. When the files were merged, the enrollment numbers didn’t sum, leading to the discrepancy. To fix this problem, we’ve kept the enrollment data separate from FSA data. Although some of the data in the charts and tables have changed, the underlying analysis and conclusions remain the same.

In an effort of full disclosure, here’s what has changed:

  • Most notably, the average share of student enrollment among the sectors has changed. This has resulted in an updated chart 3 and table 3 (see screenshot from the report below). As Steve alluded to, the average share of enrollment of undergraduates at for-profits from 2006 to 2011 was 10, not 6, percent. This means that borrowers at for-profit colleges were 1.7 times overrepresented compared to their share of enrollment, not 2.8 times as previously reported. I’ve  changed the language on page five leading up to chart 3 and table 3, namely removing any indication that the for-profit sector is substantially overrepresented compared to the HBCU sector. There is a significant difference, but the difference is not as substantial as initially reported. It still remains that Parent PLUS borrowers are overrepresented at for-profits.updatedtable3
  • I also made some minor changes to tables 4 and 5. Some of the institutions mentioned as the colleges and universities with the largest declines in recipients and disbursements are actually multi-campus institutions. I’ve indicated in parentheses next to the institutions that represent multiple campuses (i.e. University of Phoenix-Phoenix campus changed to University of Phoenix (All Campuses)). I also changed the narrative on page seven to make sure it reflects multi-campus institutions. For example, I’ve changed ITT-Indianapolis to ITT and subsequently use the average net price for all ITT campuses and not just ITT-Indianapolis.
  • Lastly, I’ve made sure to add a methodology section after the conclusion that better describes the sources of data I used for the various charts and tables.
I want to thank Steve Gunderson again for bringing this to my attention. All digital copies should now be updated. Don’t hesitate to leave a comment if you have any questions or concerns. I can also be reached at fishmanr@newamerica.org."