
Overview: How Vulnerable are Phoenix Jobs to Automation?
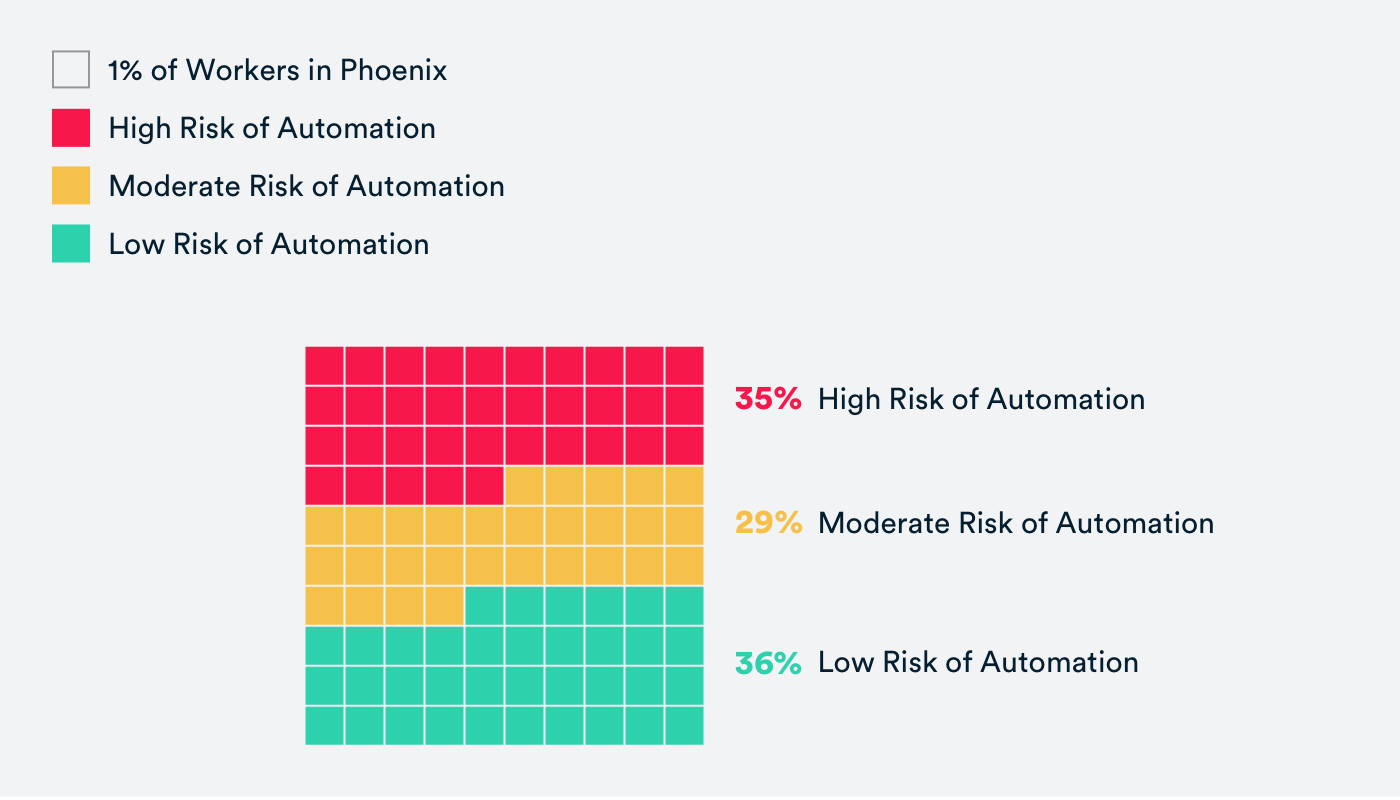
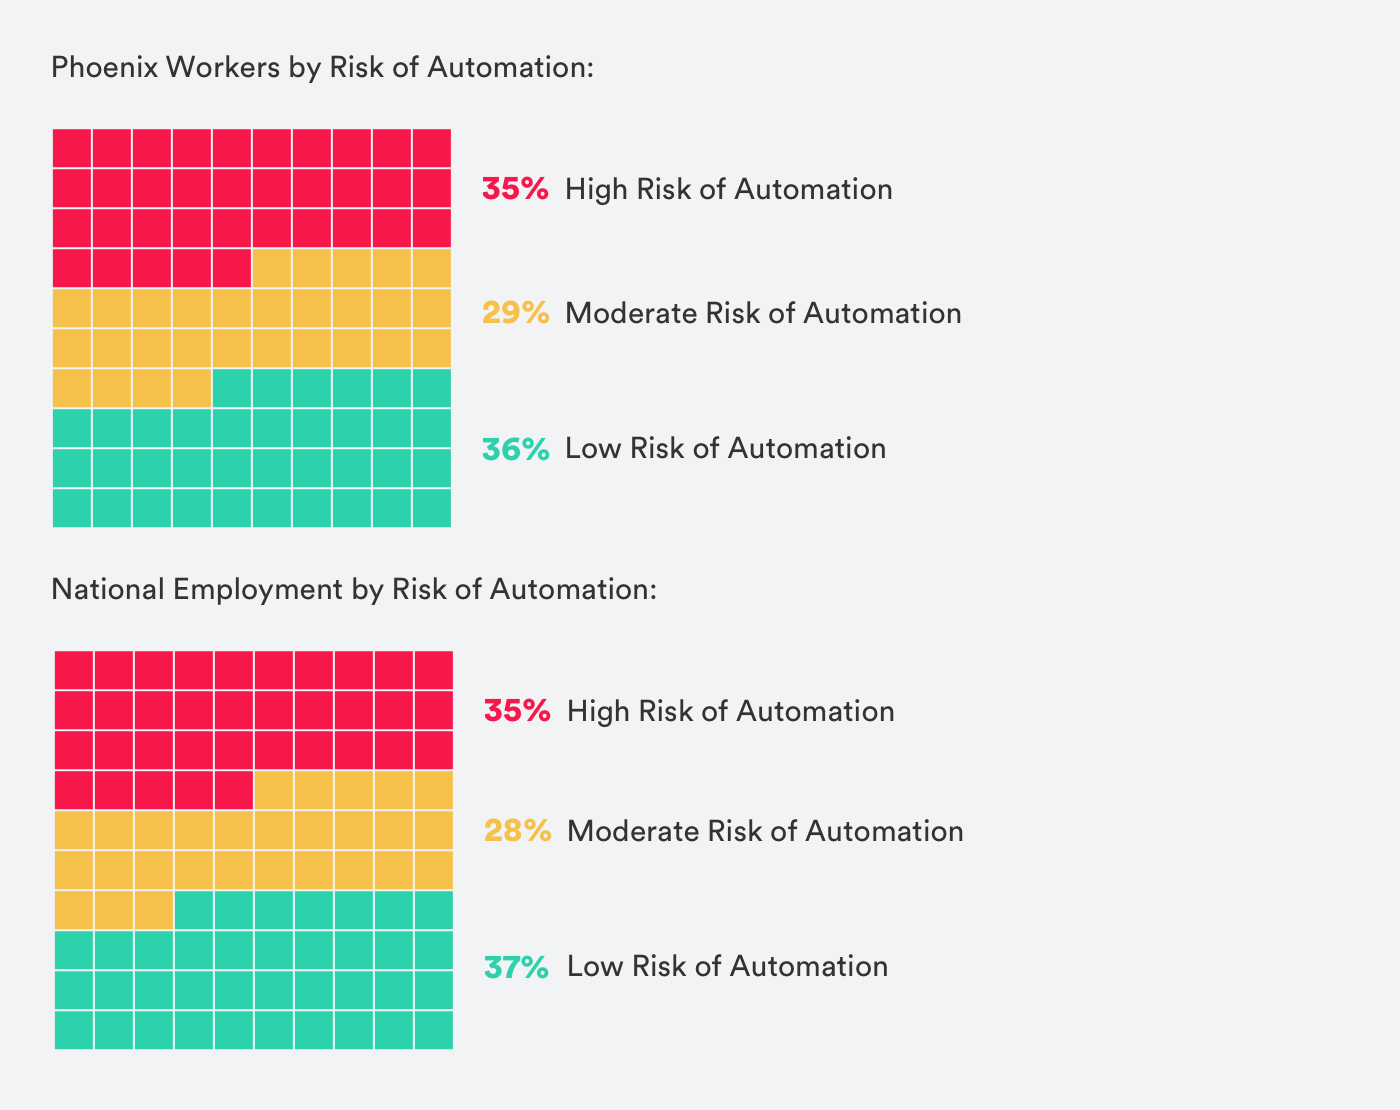
In the Phoenix metro area, 649,040 people are employed in occupations that are at high risk of automation—35 percent of total jobs. Another 537,110 jobs (29 percent of total jobs) are at moderate risk of automation. Only a little more than a third (36 percent) are at low risk.
Which Workers in Phoenix Are Most Vulnerable to Automation?
Workers with less education
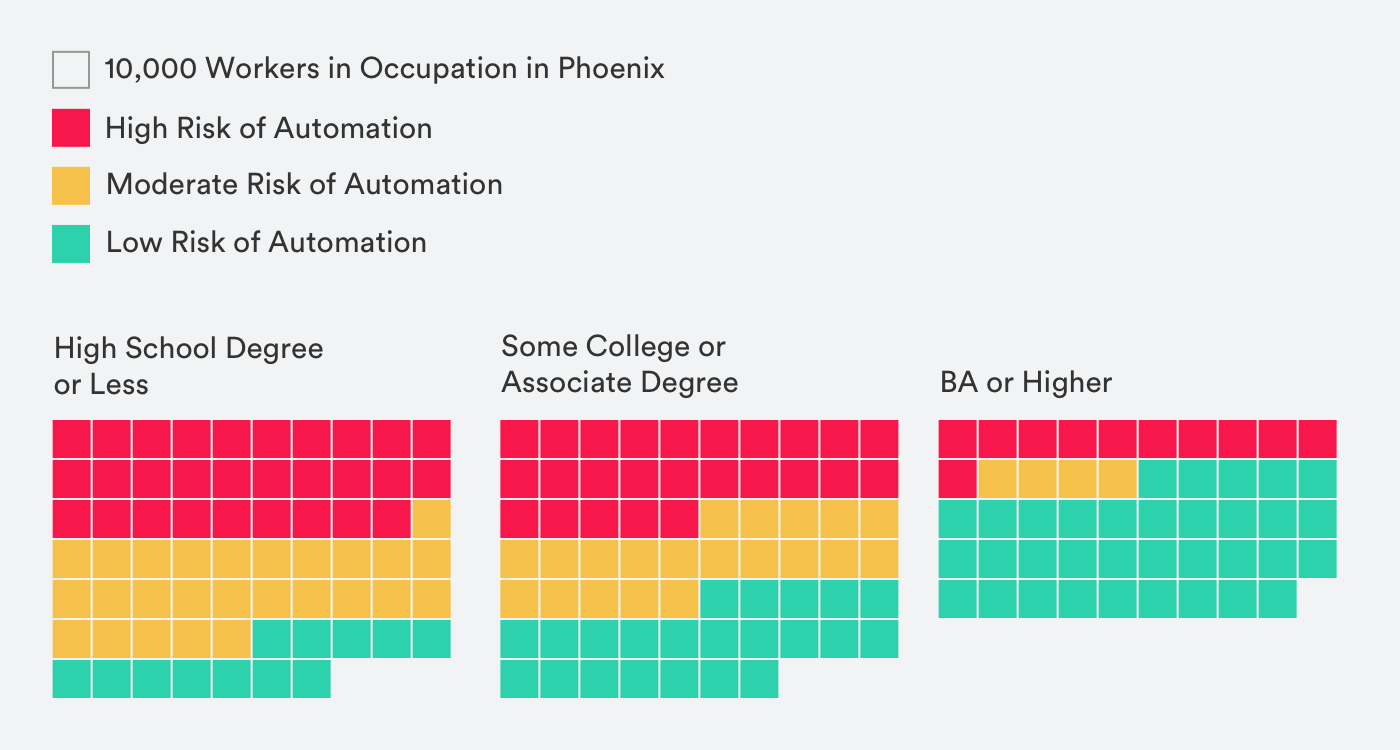
Among workers, the least educated workers are at greatest risk of automation. This is especially true of workers with a high school degree or less, who comprise 45 percent of the workers at high risk of automation in Phoenix and just 18 percent of workers at low risk. Those numbers are flipped for low-risk jobs: Half of workers in low-risk occupations have a BA or higher, while just 18 percent have a high school degree or less.
This vulnerability is further magnified by Phoenix’s lower levels of post-secondary education attainment, compared to the country overall. Across the United States, between 2012 and 2016, 87 percent of people above age 25 had a high school degree or higher and just over 30 percent held a BA or higher. In contrast, in Phoenix, 81 percent had a high school degree or higher and just over 27 percent held a BA or higher.
Workers who earn the least money
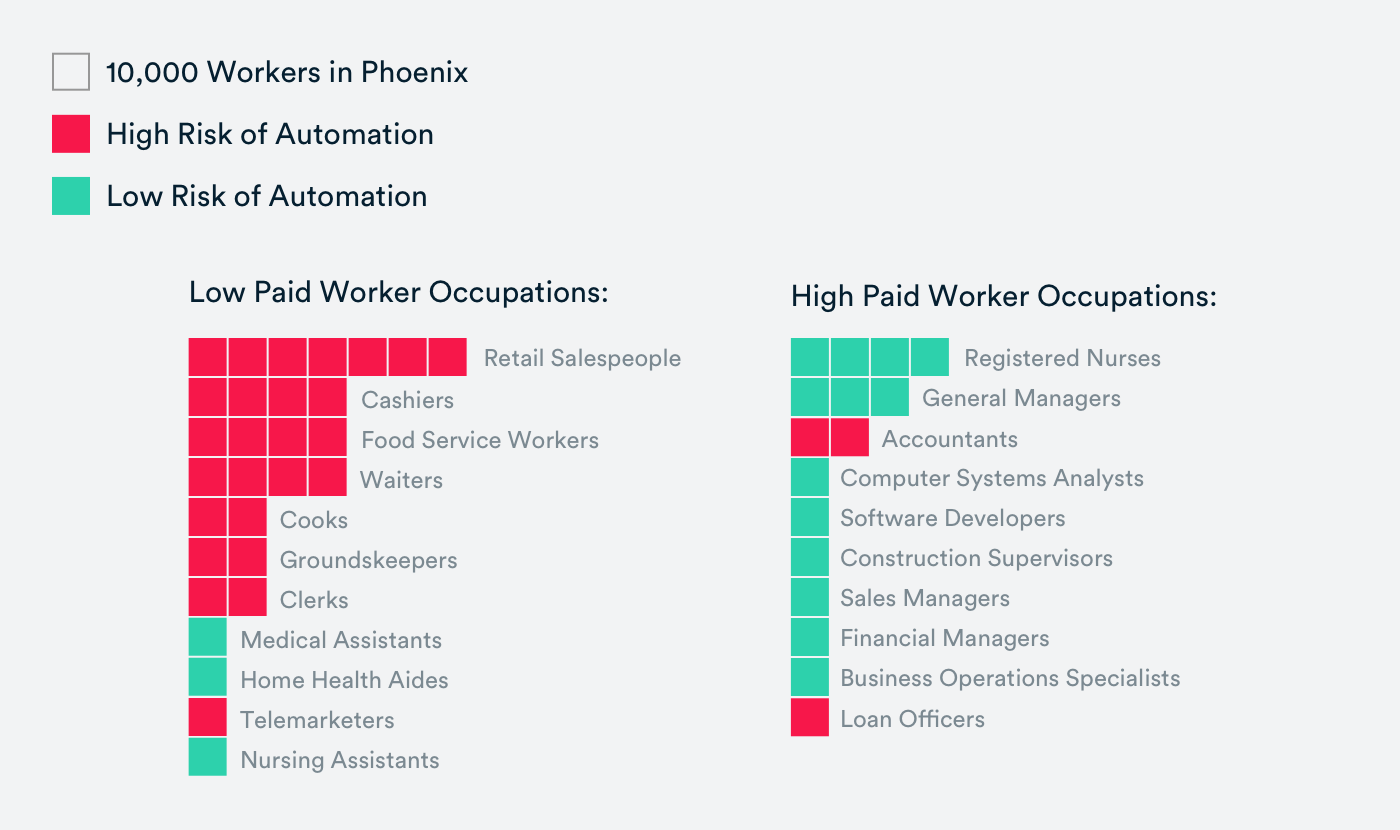
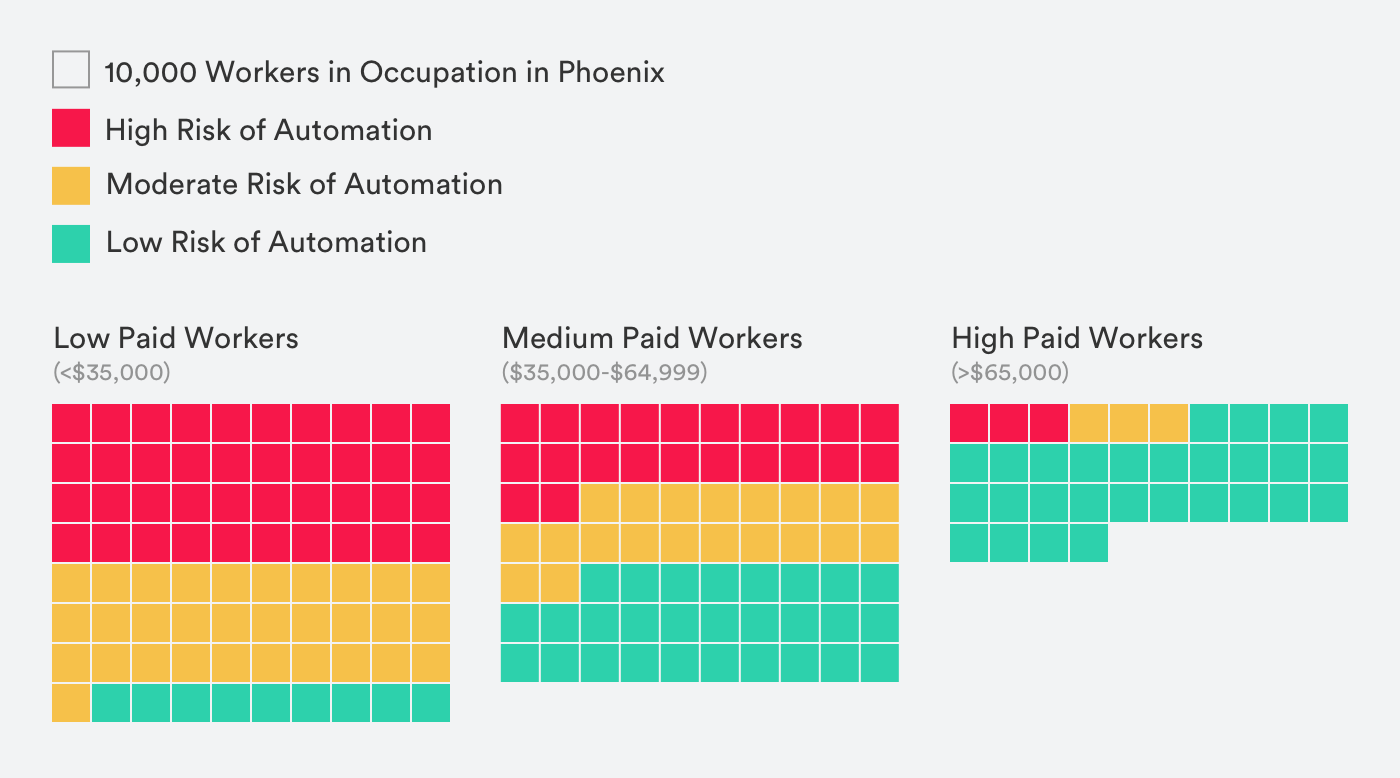
The jobs at high risk of automation are nearly half as well paid, on average, as the jobs at low risk of automation. The average annual salary of workers in the more than 200 jobs that are at high risk of automation is $32,959. Meanwhile, the average salary of the workers in the more than 300 jobs that are at low risk of automation is $67,416—more than double that of the high-risk workers.
Women
The high risk occupations in Phoenix disproportionately employ women. Applying national averages of women employed across occupations,1 women constitute 58 percent of workers in high risk occupations in Phoenix. Women dominate in many food and retail-related industries that are especially high risk. For instance:
- Cashiers: Over 44,000 people in Phoenix worked last year as a cashier – a job with a 97 percent risk of automation. Nationally, 73 percent of cashier jobs were held by women.
- Office clerks: More than 36,000 people in Phoenix worked as office clerks – an occupation with a 96 percent risk of automation. Nationally, 83 percent of those positions were held by women.
- Secretaries and administrative assistants: More than 29,000 people worked as secretaries and administrative assistants in Phoenix, which carry a 96 percent risk of automation. Nationally, 95 percent of those positions were held by women.
Occupations at Highest and Least Risk
The Largest Occupations Most at Risk
Of the 50 occupations that employ the most people in the Phoenix metro area (totalling just over half of all workers), the following 15 occupations are the most at risk of automation.
| Pay scale | Top occupations that are high risk to automation | # employed |
|---|---|---|
| Low paid jobs (< $35k) | Retail Salespersons | 67,450 |
| Cashiers | 44,630 | |
| Combined Food Preparation and Serving Workers, Including Fast Food | 44,930 | |
| Waiters and Waitresses | 36,870 | |
| Cooks, Restaurant | 16,410 | |
| Landscaping and Groundskeeping Workers | 13,380 | |
| Receptionists and Information Clerks | 12,590 | |
| Telemarketers | 10,520 | |
| Middle paid jobs ($35k - $60k) | Office Clerks, General | 36,220 |
| Secretaries and Administrative Assistants, Except Legal, Medical, and Executive | 29,630 | |
| Bookkeeping, Accounting, and Auditing Clerks | 16,650 | |
| Construction Laborers | 12,590 | |
| Billing and Posting Clerks | 9,130 | |
| High paid jobs ($60k-$90k) | Accountants and Auditors | 16,270 |
| Loan officers | 8,510 |
Largest Occupations Least at Risk
Of the 50 occupations that employ the most people in the Phoenix metro area (or about half of all workers), the following 17 occupations have a low risk of automation.
| Pay scale | Top Occupations Least at Risk of Automation | # Employed |
|---|---|---|
| Low paid jobs (<$35k) | Medical Assistants | 12,260 |
| Home Health Aides | 10,770 | |
| Nursing Assistants | 8,950 | |
| Middle paid jobs ($35k-$60k) | First-Line Supervisors of Office and Administrative Support Workers | 28,260 |
| First-Line Supervisors of Retail Sales Workers | 18,810 | |
| Sales Representatives, Services, All Other | 16,120 | |
| Elementary School Teachers, Except Special Education | 15,010 | |
| Computer User Support Specialists | 10,980 | |
| Secondary School Teachers, Except Special and Career/Technical Education | 10,640 | |
| High paid jobs ($60k- $90k) | Registered Nurses | 37,120 |
| First-Line Supervisors of Construction Trades and Extraction Workers | 10,030 | |
| Top paid jobs (>$90k) | General and Operations Managers | 32,210 |
| Computer Systems Analysts | 12,900 | |
| Software Developers, Applications | 12,190 | |
| Business Operations Specialists, All Other | 8,650 | |
| Sales Managers | 8,770 | |
| Financial Managers | 8,730 |
Top 50 Occupations by Number of People Employed
| Top occupations in the Phoenix metro area | Automation risk | # employed | Mean salary |
|---|---|---|---|
| Customer service Representatives | Medium Risk | 69,170 | $33,590 |
| Retail Salespersons | High Risk | 67,450 | $25,570 |
| Cashiers | High Risk | 44,630 | $21,910 |
| Combined Food Preparation and Serving Workers, Including Fast Food | High Risk | 44,930 | $20,120 |
| Registered Nurses | Low Risk | 37,120 | $74,930 |
| Waiters and Waitresses | High Risk | 36,870 | $22,420 |
| Office Clerks, General | High Risk | 36,220 | $35,170 |
| Laborers and Freight, Stock, and Material Movers, Hand | Medium Risk | 33,840 | $29,000 |
| General and Operations Managers | Low Risk | 32,210 | $103,090 |
| Secretaries and Administrative Assistants, Except Legal, Medical, and Executive | High Risk | 29,630 | $35,910 |
| First-Line Supervisors of Office and Administrative Support Workers | Low Risk | 28,260 | $53,900 |
| Stock Clerks and Order Fillers | Medium Risk | 26,720 | $26,490 |
| Janitors and Cleaners, Except Maids and Housekeeping Cleaners | Medium Risk | 26,150 | $24,660 |
| Personal Care Aides | Medium Risk | 25,490 | $22,310 |
| First-Line Supervisors of Retail Sales Workers | Low Risk | 18,810 | $42,340 |
| Security Guards | Medium Risk | 17,830 | $29,580 |
| Heavy and Tractor-Trailer Truck Drivers | Medium Risk | 17,760 | $43,410 |
| Sales Representatives, Wholesale and Manufacturing, Except Technical and Scientific Products | Medium Risk | 17,710 | $62,450 |
| Bookkeeping, Accounting, and Auditing Clerks | High Risk | 16,650 | $39,060 |
| Cooks, Restaurant | High Risk | 16,410 | $25,160 |
| Accountants and Auditors | High Risk | 16,270 | $68,650 |
| Maintenance and Repair Workers, General | Medium Risk | 16,160 | $36,470 |
| Sales Representatives, Services, All Other | Low Risk | 16,120 | $52,410 |
| Teacher Assistants | Medium Risk | 15,290 | $25,200 |
| Elementary School Teachers, Except Special Education | Low Risk | 15,010 | $43,730 |
| Cooks, Fast Food | Medium Risk | 13,660 | $20,350 |
| Landscaping and Groundskeeping Workers | High Risk | 13,380 | $25,970 |
| First-Line Supervisors of Food Preparation and Serving Workers | Medium Risk | 13,230 | $33,590 |
| Computer Systems Analysts | Low Risk | 12,900 | $91,080 |
| Construction Laborers | High Risk | 12,590 | $40,984 |
| Receptionists and Information Clerks | High Risk | 12,590 | $28,790 |
| Medical Assistants | Low Risk | 12,260 | $33,990 |
| Software Developers, Applications | Low Risk | 12,190 | $94,490 |
| Light Truck or Delivery Services Drivers | Medium Risk | 11,460 | $37,230 |
| Computer User Support Specialists | Low Risk | 10,980 | $50,080 |
| Home Health Aides | Low Risk | 10,770 | $24,000 |
| Secondary School Teachers, Except Special and Career/Technical Education | Low Risk | 10,640 | $50,360 |
| Telemarketers | High Risk | 10,520 | $28,190 |
| First-Line Supervisors of Construction Trades and Extraction Workers | Low Risk | 10,030 | $63,320 |
| Medical Secretaries | Medium Risk | 9,930 | $33,530 |
| Correctional Officers and Jailers | Medium Risk | 9,920 | $43,920 |
| Automotive Service Technicians and Mechanics | Medium Risk | 9,240 | $41,300 |
| Billing and Posting Clerks | High Risk | 9,130 | $36,150 |
| Nursing Assistants | Low Risk | 8,950 | $30,400 |
| Sales Managers | Low Risk | 8,770 | $113,110 |
| Maids and Housekeeping Cleaners | Medium Risk | 8,750 | $22,400 |
| Financial Managers | Low Risk | 8,730 | $116,760 |
| Market Research Analysts and Marketing Specialists | Medium Risk | 8,720 | $64,810 |
| Business Operations Specialists, All Other | Low Risk | 8,650 | $68,340 |
| Loan officers | High Risk | 8,510 | $68,060 |
How Does Phoenix Differ From the U.S. Average?
Overall, the risk of automation facing workers in the Phoenix region is just slightly above the risk to all workers nationally. Workers in Phoenix and nationally have the same rate of high risk, but Phoenix is one percentage point higher than the United States on medium risk, and one percentage point less in low risk.
Looking more closely at specific occupational groups within the economy, there are some pockets of greater vulnerability and greater resilience.
The chart below illustrates the occupational groups in Phoenix that differ significantly from the national average.
| Phoenix occupational group | % of total US employment 2016 | % of Phoenix 2017 | % difference from US average | Automation risk |
|---|---|---|---|---|
| Management | 5.1 | 6.4 | +20% | Low |
| Business and financial operations | 5.2 | 5.7 | +9% | Low |
| Computer and mathematical | 3 | 3.8 | +21% | Medium |
| Education, training, and library | 6.2 | 4.7 | -32% | Low |
| Healthcare support | 2.9 | 2.5 | +16% | Medium |
| Sales and related | 10.4 | 11.1 | +6% | Medium |
| Office and administrative support | 15.7 | 17.4 | +10% | Medium |
| Production | 6.5 | 4.3 | -51% | High |
| Transportation and material moving | 6.9 | 6.1 | -13% | Medium |
Ways the Phoenix area workforce is more resilient to automation than the nation overall
- Management, business and finance have a low risk of automation. As a percent of employment, Phoenix’s population has 20 percent more workers in management positions than the national average. As a percent of employment, Phoenix’s population has 9 percent more workers in business and financial operations, which carry a low risk of automation.
- Phoenix also has 21 percent more of its workforce in computers and mathematical positions.
- Compared to the national average, Phoenix has 51 percent fewer workers in manufacturing and 13 percent fewer workers employed in transportation and material moving. Both of these occupations are high risk of automation.
Ways the Phoenix area workforce is more vulnerable to automation than the national overall
Phoenix has a greater share of its workforce than the national average in several big occupational groups that have a medium or high risk of automation. These include:
- Phoenix employs 10 percent more workers in office and administrative support than national average. These occupations have a medium-high risk of automation, and include many high risk jobs.
- Phoenix has 6 percent more workers in sales and related occupations than national average, and many of these jobs (like cashiers) are high risk of automation..
Phoenix area employees are less well-represented in certain low-risk occupational groups than the national average:
- Education, training and library occupations are at very low risk of automation. Phoenix has 32 percent fewer workers in these occupations than the national average. Nationally, 73 percent of those positions are held by women. Thus, compared to the rest of the country, Phoenix has significantly fewer low-risk jobs in education that overwhelmingly employ women.
Citations
- Data from gender makeup of national occupations from the Bureau of Labor statistics.