
Part I: Intergenerational Higher Education Debt
A key question is whether Parent PLUS borrowers are able to pay back their loans. Unfortunately, data on PLUS loans often go unreported or are not even collected. For this reason, little is known about Parent PLUS borrowers and their repayment outcomes. To better understand the demographics of Parent PLUS borrowers, New America analyzed Education Department survey data.1 This includes the National Postsecondary Student Aid Study (NPSAS), a representative survey of students eligible for federal financial aid who are at any point in their academic career, and the Beginning Postsecondary Students Longitudinal Study (BPS), which follows a cohort of students over time to understand their outcomes, starting with their first year of enrollment. The NPSAS survey is useful to understand demographics of the students whose parents borrow PLUS loans, and the BPS survey is useful for understanding characteristics and outcomes over time of students whose parents borrow PLUS loans.2
A Snapshot of PLUS Loan Families in 2011–12
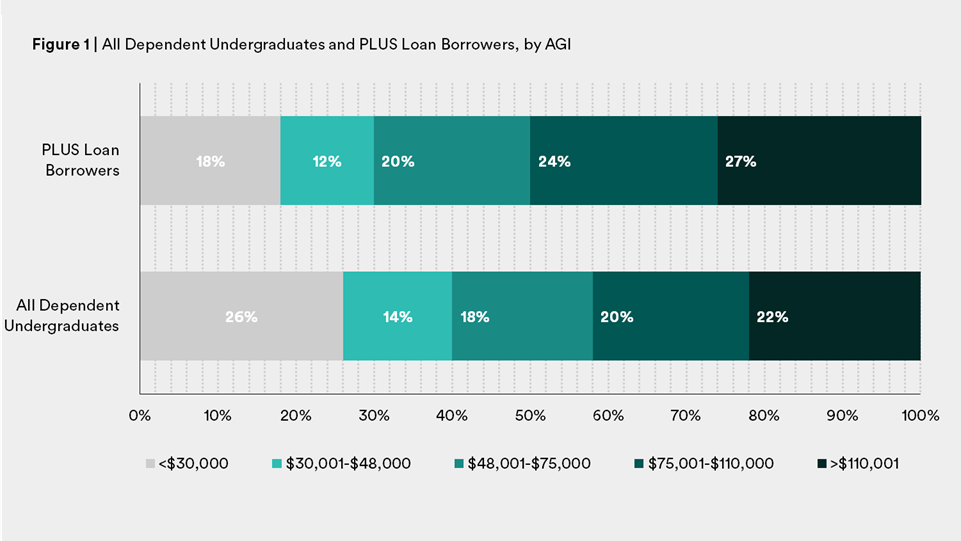
While only a small percentage of dependent students have parents who borrow PLUS loans—only 5 percent in the 2011–12 NPSAS—when the data are analyzed by adjusted gross income (AGI), expected family contribution (EFC), and race/ethnicity, the findings are revealing. For comparison purposes, the data are presented next to that for all dependent undergraduates.
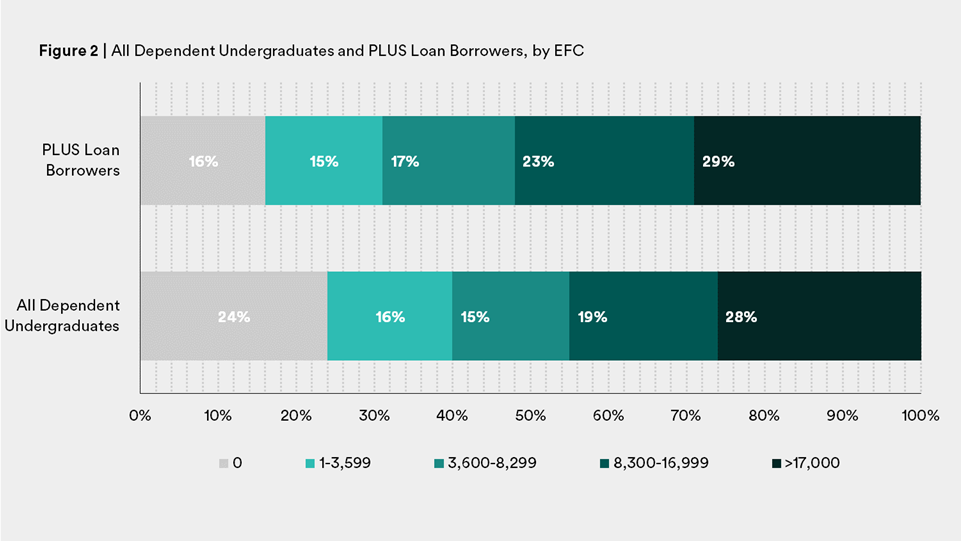
For those who have borrowed PLUS in 2011–12, the data indicate that as AGI increases, so does the proportion of parents who borrow PLUS.3 (See Figure 1.) A majority of Parent PLUS borrowers come from families making more than $75,000. The program was designed to cater to these borrowers, giving middle- and upper-income borrowers access to a fixed-rate loan to pay for college. Looking at EFC, a measure established in law that tries to determine a family’s ability to pay for college and thus one that is correlated with income, shows largely the same story.4 (See Figure 2.)
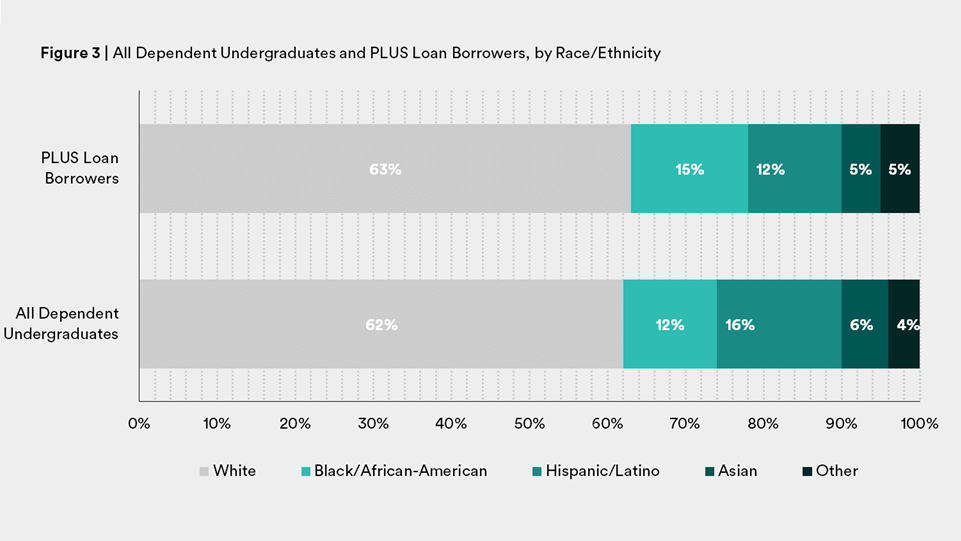
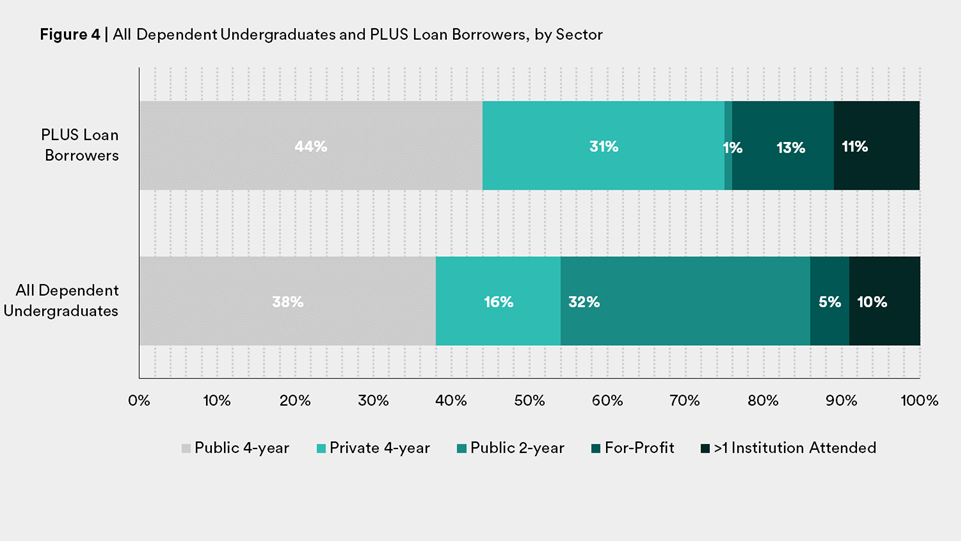
Most PLUS borrowers are white and have children who attend public four-year or private four-year institutions. (See Figures 3 and 4.)
In July 2015, when Martin O’Malley, former governor of Maryland, was running for president, he announced a plan for debt-free college. O’Malley used his own family’s scenario as reasoning for why a debt-free option was needed: for his two children he had borrowed $340,000 in PLUS loans.5 Like many PLUS loan borrowers, O’Malley is upper-income, white, and sent his children to expensive public (out of state) and private four-year institutions. While $340,000 may sound like a lot of debt for most families—indeed, it is more than median home prices in America—O’Malley’s family is wealthy and can afford to repay the loan back.
For O’Malley’s family, higher-education debt is not a crisis in the way it is for other families. When looking at AGI and EFC by race it is clear that some low-income families of color are shouldering a lot of financial responsibility when it comes to sending their children to college.
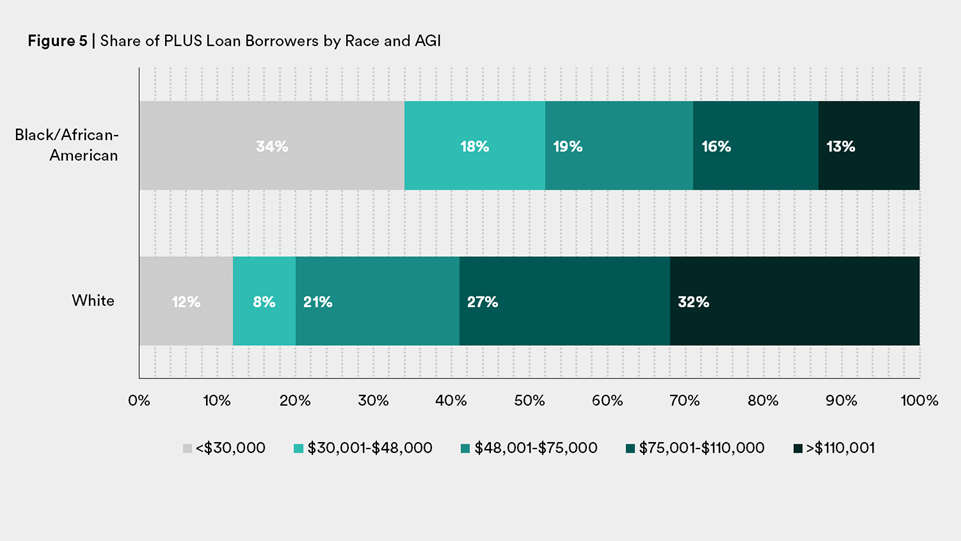
For white families, for the most part as income increases so does the share of PLUS borrowers. For Black families, it is exactly the opposite case. Approximately a third of white PLUS borrowers come from household AGIs of more than $110,001, with about one in 10 coming from families with AGIs less than $30,000. For Black families, about one in 10 have AGIs over $110,001, with approximately one-third having an AGI of less than $30,000. (See Figure 5.)
EFC largely follows the same pattern, with approximately one-tenth of white borrowers with an EFC of zero compared with a third of Black borrowers (See Figure 6). Arguably, no family with a zero EFC should take on a PLUS loan, as EFC is a rough approximation of the ability to repay a loan. The share of Black borrowers with zero EFC paints a stark picture of the inequity of debt burdens when it comes to paying for college.

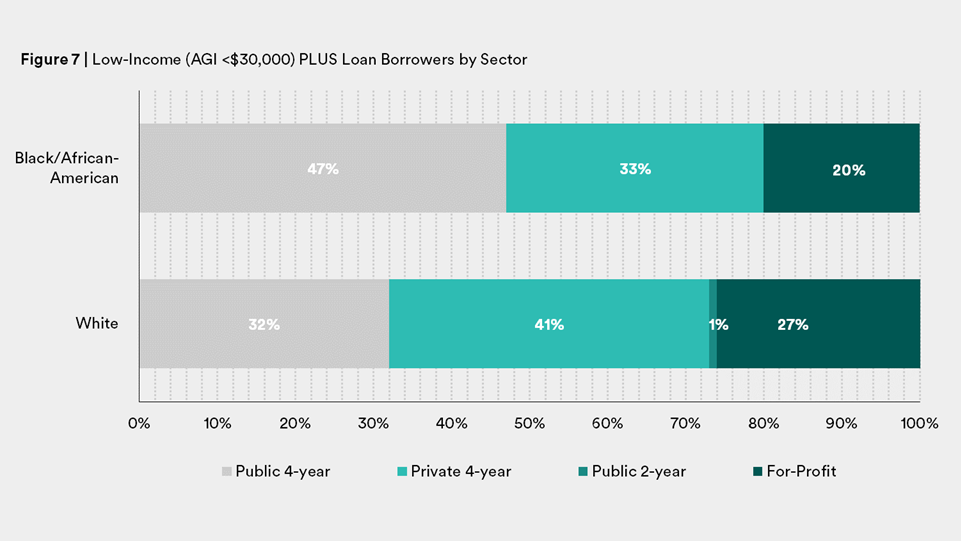
The types of colleges and universities where Black and white students enroll does not explain these patterns away. Low-income Black students whose parents borrowed PLUS are more likely to be enrolled in “affordable” four-year public colleges and universities than more expensive private and for-profit institutions. The share of white low-income borrowers is actually comparatively higher in the private and for-profit sectors.6 (See Figure 7.)
Total Intergenerational Indebtedness
Examining PLUS debt in isolation understates the true debt burden on low-income families. Parent PLUS loans are often borrowed only after students have borrowed the maximum amount of federal student loans, which can add up to $27,000 over four years in college. While hard data are unavailable to quantify this phenomenon, some parents may be taking out PLUS loans with the expectation that their children will be responsible for paying the loans back. The parents at the center of the PLUS controversy were, by definition, low-income borrowers with bad credit outcomes. Because college financial aid offer letters are often deliberately arcane and confusing, it may not be clear to parents and students whose debt is technically whose.7 In any event, the family as a whole is ultimately responsible for the combination of student and parent debt.
"Because college financial aid offer letters are often deliberately arcane and confusing, it may not be clear to parents and students whose debt is technically whose."
While NPSAS data give a snapshot of the demographics of borrowers during the 2011–12 academic year, the BPS data set illuminates the demographics of PLUS borrowers and helps us understand average cumulative indebtedness over 12 years, from 2003–04 to 2015–16.
Often, media and policymakers focus on the debt burdens of graduating undergraduates or outlying graduate borrowers with six-figure debts. The Institution for College Access and Success, for example, publishes a widely-recognized and highly cited yearly report on the average debt for graduating bachelor’s degree candidates.8 Yet for many families, a significant portion of debt in the form of parent loans goes unreported and uncalculated.
Approximately 16 percent of students who began their higher education in 2003–04 had parents who borrowed a PLUS loan at some point by 2015–16.9 Although only a relatively small subset of parents borrow, not including parental debt in total debt calculations understates higher-education debt. The average cumulative amount of PLUS loans over these 12 years was $20,343 per student whose parents borrowed PLUS.10 The average cumulative amount of undergraduate loan debt for these students was $17,307. This means that the average total intergenerational higher education debt for PLUS families, almost one in five dependent undergraduates, was nearly $38,000.
"A significant portion of debt in the form of parent loans goes unreported and uncalculated."
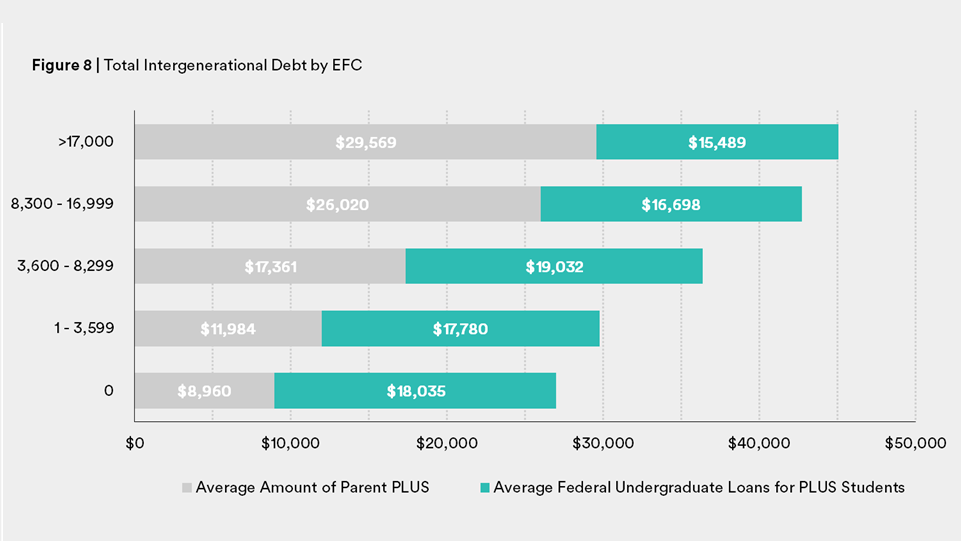
Like other patterns seen with PLUS loans, average intergenerational loan debt increases as EFC increases. The lowest-income families—those who the federal government expect to contribute nothing to their cost of attendance because their need is so high—have an average intergenerational debt of almost $27,000.
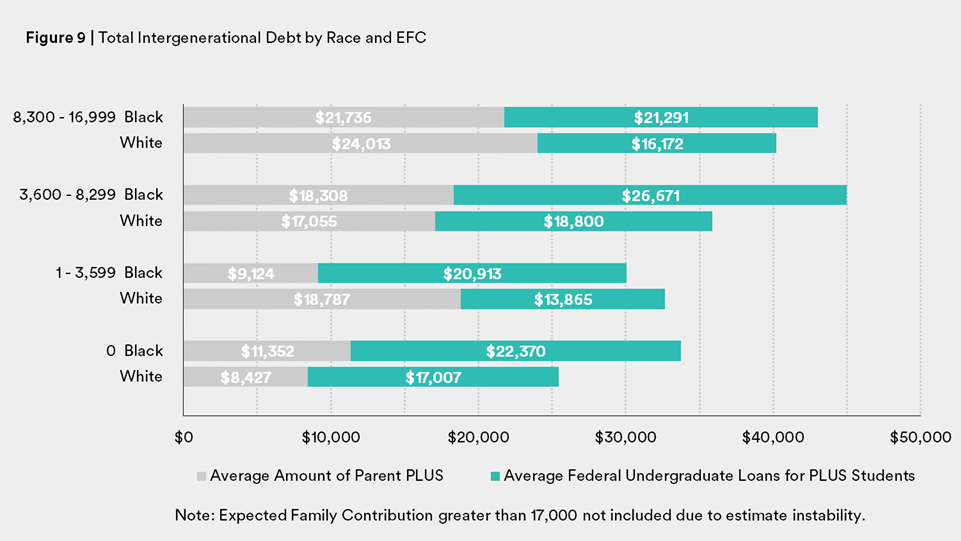
For white families who borrow PLUS and student loans, the average amount of cumulative debt increases as EFC increases (See Figure 9). For Black PLUS families, the story is different. Black families with zero EFC accumulated an average of $33,721 in intergenerational debt, of which $11,352 was in PLUS loans. By contrast, white families with zero EFC accumulated $25,434 in debt, 25 percent less. Even among families that the EFC formula judges equally needy, debt outcomes for white and Black families are very different. And unlike their white counterparts, the average indebtedness for Black families fluctuated as EFC increased, perhaps because even at similar income levels white and Black families have different levels of wealth.
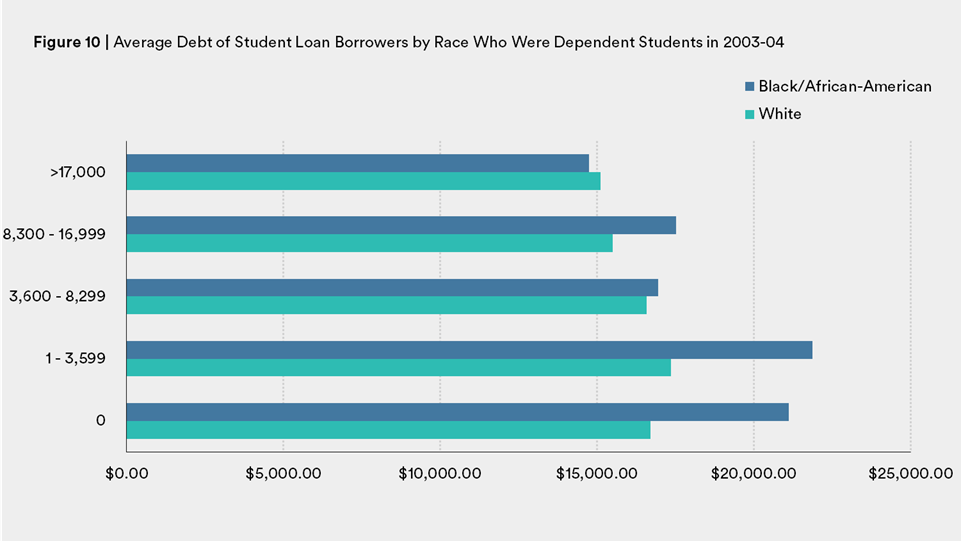
In comparison, dependent student loan borrowers whose parents did not borrow PLUS accumulated slightly less personal debt for their higher education. But low- and moderate-income Black borrowers still had borrowed much more than their white peers. (See Figure 10.)
Student Loan Debt Disparities
Unfortunately, practically nothing is known about Parent PLUS repayment outcomes. There is no consistent or good number on whether parents expect their own children to pay back this loan, how many parents are delinquent, how many are in default, and how many are experiencing the extreme pinch of government collection practices such as wage or Social Security garnishment and tax refund seizure. All there is to go by are repayment trends from undergraduate borrowers. And a growing body of work that looks at these outcomes reveals that Black undergraduates are experiencing a true student loan crisis. Given the disparity in borrowing PLUS loans and accumulating intergenerational debt, it may give hint of the burden Black families take on to get a higher education.
While it is clear from the Education Department survey data that low-income Black parents are borrowing PLUS loans at a higher rate than their low-income white counterparts, differences in debt accumulation do not stop there. Black students are more likely to borrow than their white, Asian, or Latino peers.
Overall, about one in four student loan borrowers is delinquent or in default.11 The previously mentioned BPS data set that followed a cohort of borrowers who entered higher education in 2003–04 highlights problematic repayment trends, especially for Black borrowers. Ben Miller from the Center for American Progress found that 12 years after entering college, the median Black borrower owed more than the original amount borrowed.12 In other words, not only had Black borrowers at the median made no progress towards retiring their debt, their debt situation had actually worsened. This was not the case for median white and Latino borrowers, who had made progress in paying down their debt.13
What is even more worrisome is that a bachelor’s degree, normally thought to protect borrowers in a bad labor market and help ensure they are able to repay their debts, does not insulate Black borrowers in the same way. While only 9 percent of borrowers with a bachelor’s degree default on a student loan, the number jumps to one in four for Black borrowers.14
"Not only had Black borrowers at the median made no progress towards retiring their debt, their debt situation had actually worsened. This was not the case for median white and Latino borrowers, who had made progress in paying down their debt"
Not only are Black borrowers with bachelor’s degrees less protected from repayment problems, for those who drop out the outlook is horrific, especially in the for-profit sector. Approximately three out of four Black students who attended for-profit institutions and dropped out went on to default on their loans.
Judith Scott-Clayton, in an analysis for the Brookings Institution, looked not only at the 2003–04 cohort of borrowers, but also an earlier cohort who entered higher education in 1995–96. By applying the trends of the earlier cohort to the later one, she finds that nearly two in five borrowers are projected to default on their loans by 2023.15 Like trends seen in Miller’s analysis, Scott-Clayton finds that Black borrowers are especially vulnerable to delinquency and default. Black borrowers who earn a bachelor’s degree are more likely to default than white borrowers who dropped out of college. She projects that approximately 70 percent of Black borrowers may end up in default.16
Yet even these sobering numbers do not include the additional burden of intergenerational debt and the repayment outcomes of various demographics of parent borrowers. It is hard to know for sure, but it is likely that repayment outcomes of student borrowers are correlated with parent repayment outcomes, especially given that some parents expect their children to repay PLUS loans. Given the debt crisis for Black student borrowers, there is likely a debt crisis for Black parent borrowers as well.
Box 2
Large Debt Burdens of Grad and Parent PLUS Loan Borrowers
Recently, Adam Looney from the Brookings Institute and Constantine Yannelis from New York University reviewed National Student Loan Data System (NSLDS) data and found that, increasingly, more higher education loan borrowers (17 percent) have debt balances over $50,000 and this debt accounts for the majority of federal higher education loan debt owed to the government.17 The growth in loan balances is partly explained through the growth of lending to graduate students through a program known as the Grad PLUS program, but Parent PLUS borrowers are also a driving factor.18
According to their analysis, in 2000, the share of Parent PLUS borrowers with debt over $50,000 was approximately 3 percent, but by 2014 the share was up to 13 percent. In 2000, the share of parents accumulating PLUS debt over $100,000 was only 0.4 percent, but by 2014 the proportion had grown to nearly 4 percent.19 Nearly a third of all dollars in default are held by borrowers with balances over $50,000.20
A previous version of this section stated that almost two in five undergraduates' intergenerational debt is $38,000, it has been updated to reflect one in five dependent undergraduates' intergenerational debt is $38,000.
Citations
- Awilda Rodriguez, a professor at the University of Michigan’s School of Education, also has used NPSAS and BPS data to look at racial differences, particularly for Black families, in PLUS loan borrowing from 2000. Her analysis looks at borrowing rates within specific race/ethnicities and by a variety of other demographics including income and marital status. While the New America analysis focuses on the demographics of children of PLUS loan borrowers themselves, Rodriguez’s analysis is an important piece of the small body of work done on PLUS loans. To read Rodriguez’s analysis in full see Awilda Rodriguez, “Understanding the Parent PLUS Loan Debate in the Context of Black Families,” Research in Race and Ethnic Relations 19 (2015): 147–170.
- For full methodology and related tables, see Appendices A and B.
- Adjusted Gross Income is used as opposed to gross income because AGI is used on the Free Application for Federal Student Aid (FAFSA) to determine federal financial aid receipt. It is always difficult to determine where exactly to make income cuts, as there is no true definition for low-, middle-, and upper-income families. For this reason, income bands are the same ones used in the U.S. Department of Education’s College Navigator tool to report net price, the price of college after grants are taken into account. The bands are meant to help distinguish among low-, moderate-, middle-, upper-middle-, and upper-income borrowers.
- EFC is a measure established in law that tries to determine a family’s ability to pay for college. While imperfect, it takes into account a family’s taxed and untaxed income, some assets, and government benefits such as Social Security and receipt of food stamps. It is adjusted based on family size and how many children are currently in college. If a family has a zero EFC, for example, the government has determined that the family should not be expected to pay for higher education and the child is eligible for a full Pell Grant, the largest financial aid program for low-income students. The bands chosen for this analysis were suggested by the U.S. Department of Education’s PowerStats tool. For more see source.
- Andy Thomasson, “Martin O’Malley has $340,000 in Parent PLUS Loans,” Chronicle of Higher Education, July 8, 2015, source.
- For more analysis of sector by lower- and upper-income and race see tables in Appendix A.
- An analysis of award letters by New America and the nonprofit uAspire that explores this notion further will be released in June 2018. For now, see Rachel Fishman, Kim Dancy, Ben Barrett, and Sophie Nguyen, “Shining a Light on Award Letters that Keep Students in the Dark,” Ed Central (blog), New America, January 18, 2018, source.
- Diane Cheng, Debbie Cochrane, and Veronica Gonzalez, Student Debt and the Class of 2016 (Washington, DC: The Institute for College Access and Success, 2017).
- For methodology and tables please see Appendix B.
- Since NPSAS contains student-level data, the intergenerational debt may be understated because there could be mulitple children within a household whose parent has borrowed PLUS.
- Aissa Canchola and Seth Frontman, “The Significant Impact of Student Debt on Communities of Color,” CFPB (blog), September 15, 2016, source.
- Ben Miller, New Federal Data Show a Student Loan Crisis for African American Borrowers (Washington, DC: Center for American Progress, 2017).
- Ibid.
- Ibid.
- Judith Scott-Clayton, The Looming Student Loan Default Crisis is Worse Than We Thought. (Washington: DC: Brookings Institution, January 10, 2018).
- Ibid.
- Adam Looney and Constantine Yannelis, Borrowers with Large Balances: Rising Student Debt and Falling Repayment Rates (Washington, DC: The Brookings Institution, 2018).
- Ibid.
- Ibid.
- Ibid.