Table of Contents
The Hyper-Networked and the Rest
New research shows that efforts to create innovation and empower communities through networks may leave some communities behind
By Tara McGuinness
Citizens organized through networks or groups have always been part of how progress is made in the US. While data show an upward trend in the use of networks for social change, networks have influenced the development of the United States for hundreds of years. In 1835, the power of American networks and associations caught Alexis de Tocqueville’s eye:
“In America I encountered sorts of associations . . . and I often admired the infinite art with which the inhabitants of the United States managed to fix a common goal to the efforts of many men and to get them to advance to it freely.”
In Democracy in America he observed the power of organized citizens in networks to make progress outside the constructs of a powerful authority, institution, or mandate.
This work is alive and well today.
Citizens are driving progress in places as varied as Spartanville, S.C. and Lancaster, Pa. Citizen-led innovation taking place from Ajo, N.M. to Eastport, Maine fills the pages of Jim and Deb Fallows’ book, Our Towns, and was at the center of an expanse of efforts under the Obama administration aimed at empowering local leaders (the Promise Zones, Choice Neighborhoods, and My Brother’s Keeper initiatives, to name a few).
But the socio-economic map of the United States has transformed in the nearly 200 years since de Tocqueville’s visit, particularly in the last three or four decades. For the first time in history, Americans are less likely to be better off than their parents. While the traditional pattern has been growth in economic integration across the country with a more even distribution of those with college degrees, since the 1970s there has been a shift: communities are becoming more and more homogenous, and wealthy and well-educated Americans are living in certain geographic pockets.
Networks like the ones de Tocqueville observed, and their modern incarnations, offer an opportunity to aid problem-solving and innovation to address common goals. Unchecked, however, they can also exacerbate growing U.S. trends of economic and social capital inequity.
Networks: The Hyper-Connected and Everyone Else
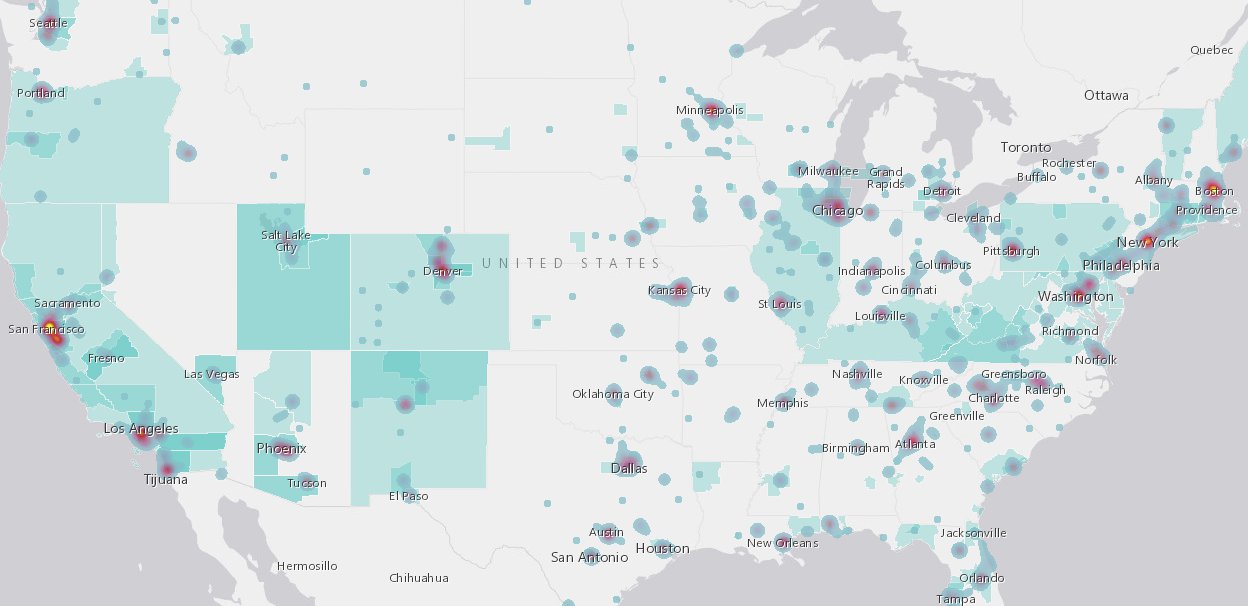
We mapped and collected data about 25 networks that are helping cities and counties solve a wide-range of social challenges. These networks are working in over 270 U.S. metro- and micropolitan areas to advance solutions in criminal justice, climate change, open government, and economic opportunity. The networks include efforts like the What Works Cities program, developed to improve public sector innovation and use of data, and others like Code for America’s brigades, which run civic tech efforts in a breadth of communities, and StriveTogether, a network helping to improve educational outcomes for all kids. This data has lessons for people building networks. It also revealed patterns about the kinds of communities that ask for and receive support in addressing local challenges.
While the networks in our research reflect communities of different sizes engaged in fixing a range of challenges in innovative ways, a closer look at the data reveals trends in connectivity (or lack thereof) across places. While some communities are hyper-connected, others are off the map entirely—and those are often the places that are struggling the most with typical challenges.
Big cities have an outsized presence in the network connections that we studied. Of the more than 270 metro- and micropolitan areas connected by the 25 networks we studied, the top 10 most connected metro areas account for fully one quarter of the nearly 2,000 total connections. The most connected places—San Francisco, Boston, Chicago, Los Angeles, Washington D.C., New York City, Miami, Seattle, Minneapolis-St. Paul, and Phoenix—are cities that typically fit the narrative of economically competitive, growing, high capacity places. Meanwhile, 97 metro- and micropolitan areas, including places like Zanesville, Ohio, Tuscaloosa, Ala., and Waco, Texas, only account for one connection each, while another nearly 700 metro- and micropolitan areas have no connections to the networks in our research. In the sample of networks we studied, there was a clear correlation between a metro area’s population and its participation in networks.
In interviewing network managers and organizations using networks as a tool in public problem-solving, two very clear trend lines emerged. First, as discussed above, some places (mostly cities) were very connected and engaged in national networks (from ending homelessness, to using data for public sector innovation, curbing climate change, and dozens of other issues simultaneously). These cities, including Boston, San Francisco, and Philadelphia, are using new tools and approaches to solve problems and are connected to organizations building capacity and sharing knowledge. Chicago is one of these extremely connected cities and is linked to national resources to tackle local challenges as varied as curbing police officer involved shootings and increasing bike lanes.
The second trend we heard from leaders running networks was that communities that were in need of capacity didn’t always make the cut for membership in these innovation networks. Sometimes the communities themselves didn’t apply or raise their hands to engage. In other instances, the barriers involved in joining a network and the capacity it took to participate were more than some communities had to give. Communities with little municipal capacity or in the midst of crises were unable to take on the task of filling out an application or drafting a plan, which are the requirements of many, though not all, of the networks.
One network leader said it is a real strategic question: “Should we work with smaller cities that need our help more, or work with larger places and hope the case studies trickle down?” They, like the majority of networks we interviewed, chose the latter strategy: partner with places that want to lead and build a model that can be shared. Multiple organizations running these networks articulated their interest in working in lower capacity geographies, but cited multiple barriers to engagement. One network leader said they had interest in working in an economically struggling city and pursued ways to engage but backed off after finding the city “didn’t have the capacity to engage with the outside world.”
Networks—and usually their philanthropic backers—engage and select communities that they believe will succeed in making progress on their issue. Those we interviewed cited a need to show progress, and found capacity-rich cities to be better bets to demonstrate outcomes. However, that choice produces unintended consequences across the map: the places with higher capacity gain more capacity, while the places with lower capacity continue to struggle.
A National Map: Uneven Economic Mobility and Connectivity
Our data on city networks sits on top of a larger landscape of uneven economic growth and disconnectedness across American communities. New data from several sources provide a more granular picture of the geography of declining absolute mobility, and the power of geography in determining economic mobility and social capital.
The same fast-growing connected metros like San Francisco, New York, and Chicago that are at the center of network connectivity (as of September 2018) on our map also account for 72 percent of the nation’s employment growth, according to research from the Brookings Institution.
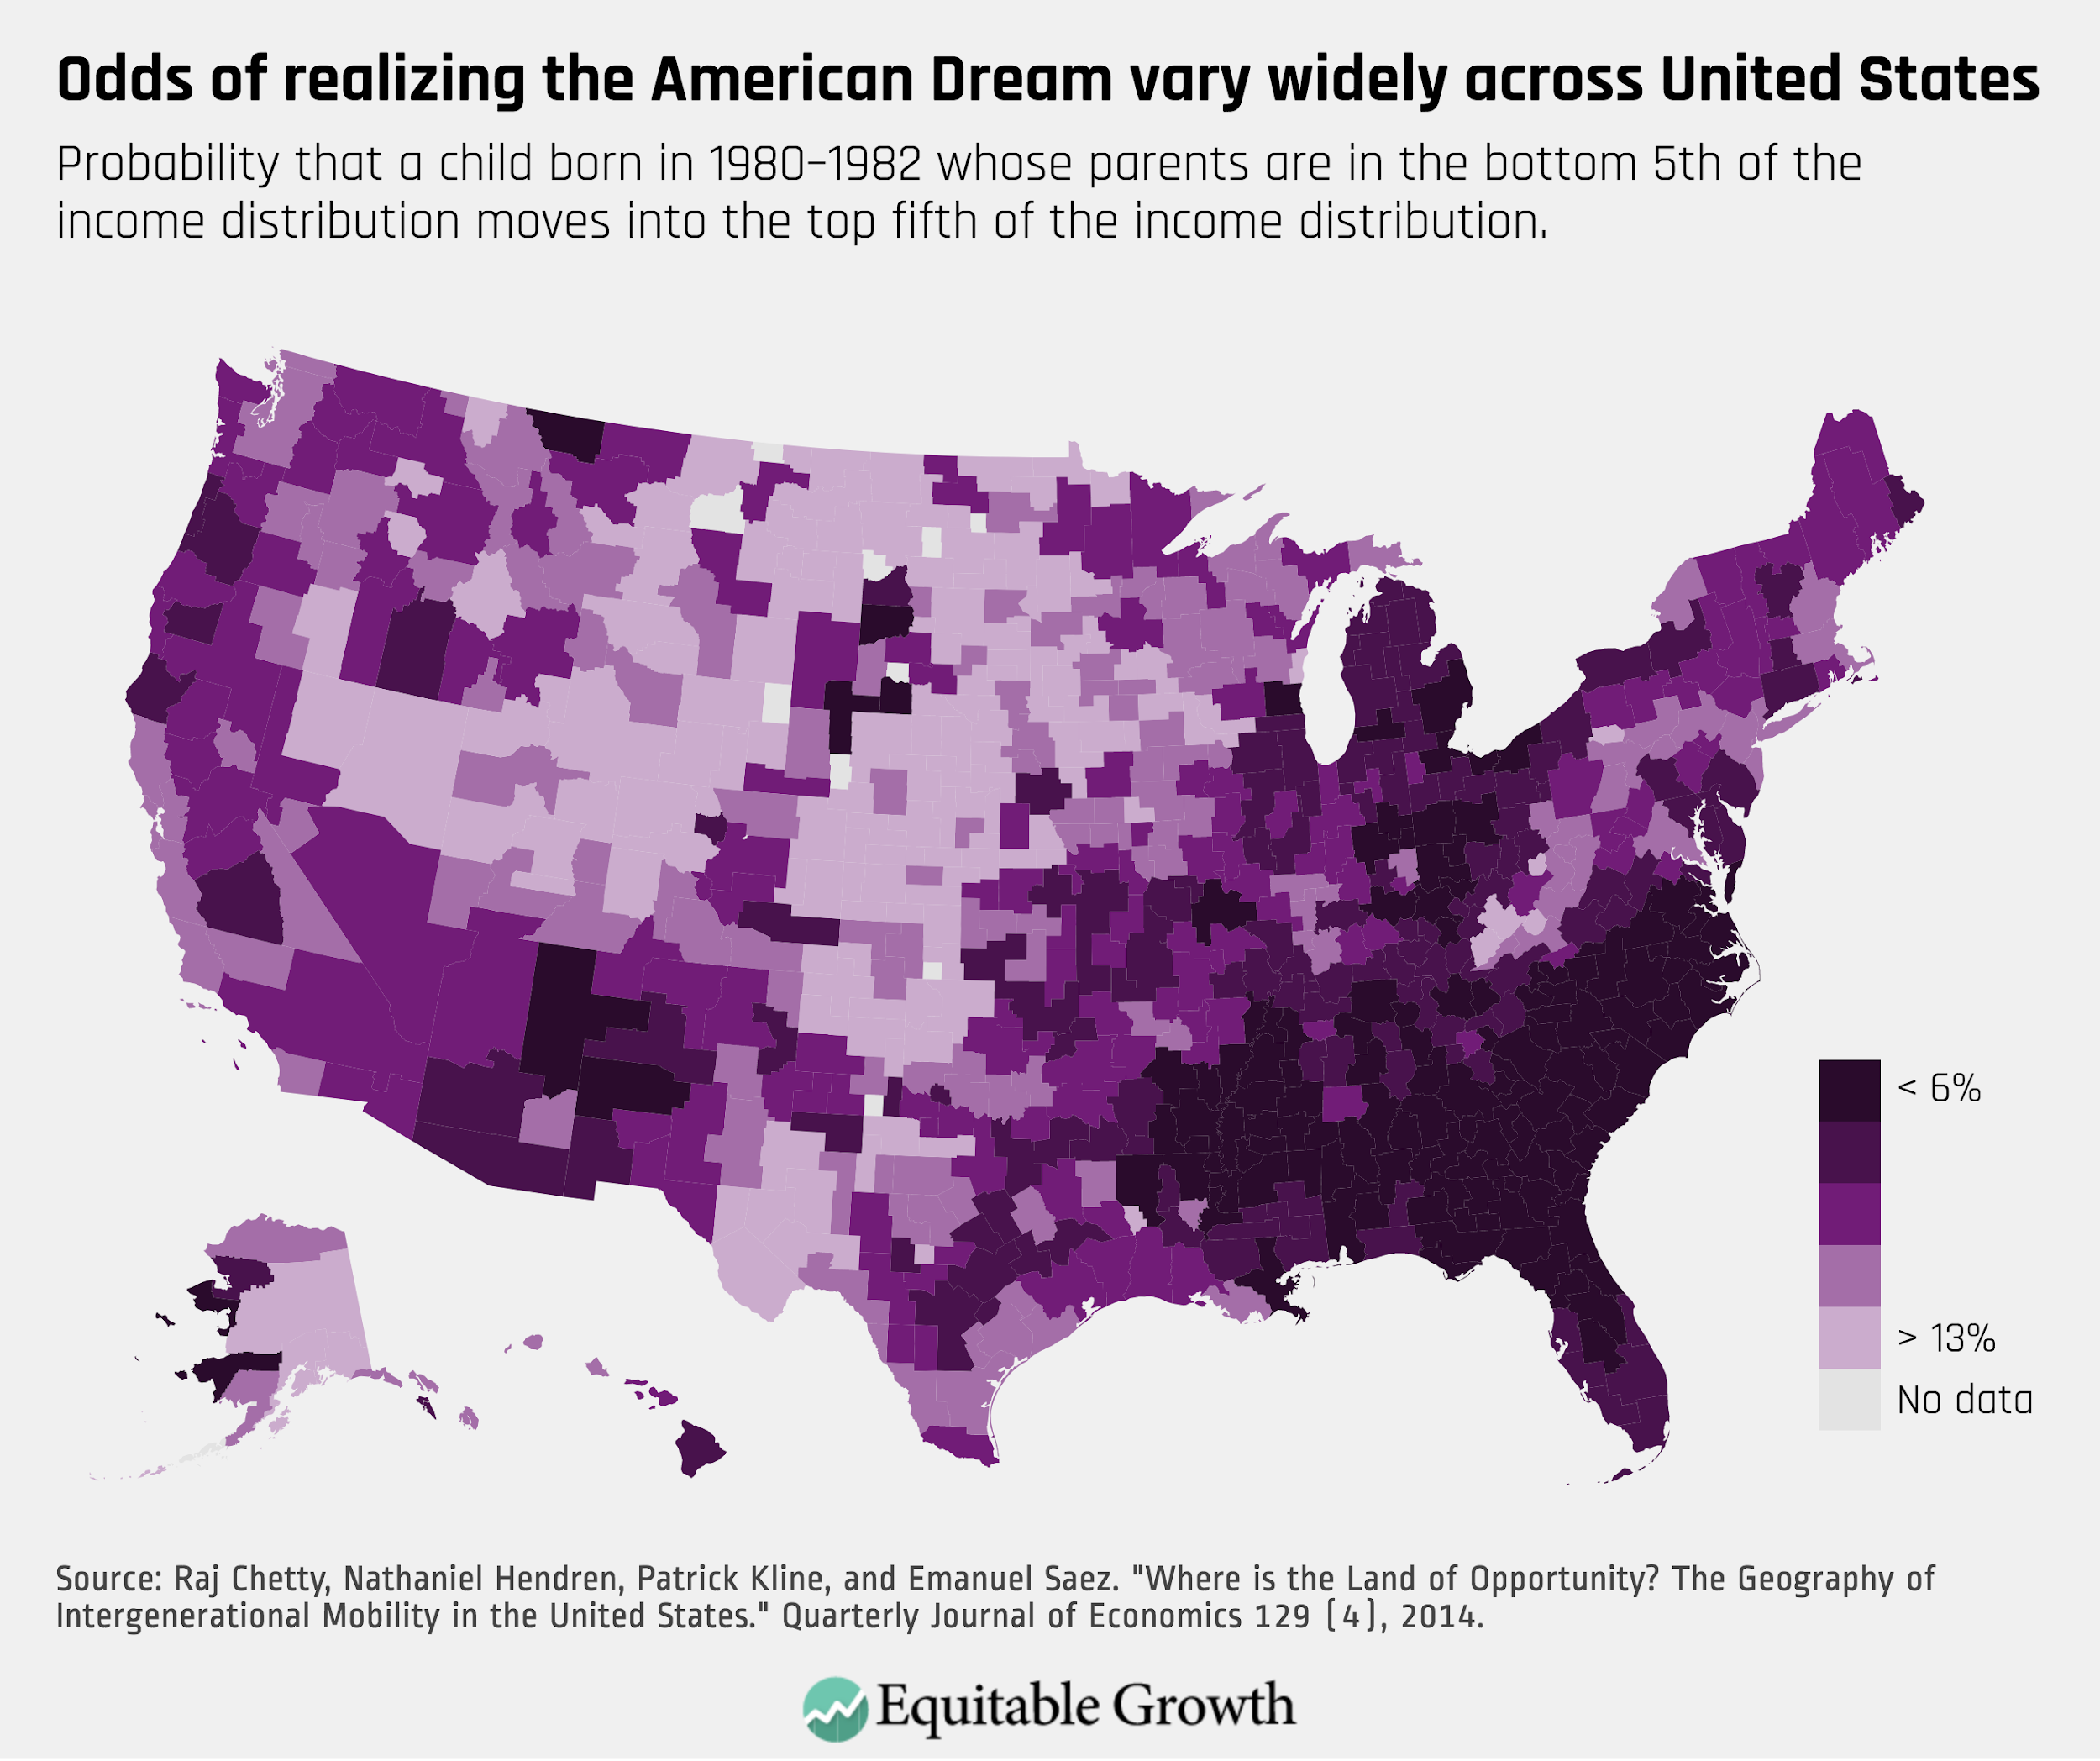
Raj Chetty, Nathaniel Hendren, Patrick Kline, and Emmanuel Saez also found dramatic variance in social mobility across different US geographies. Their data reveal that where you live weighs heavily on your chances of economic mobility.
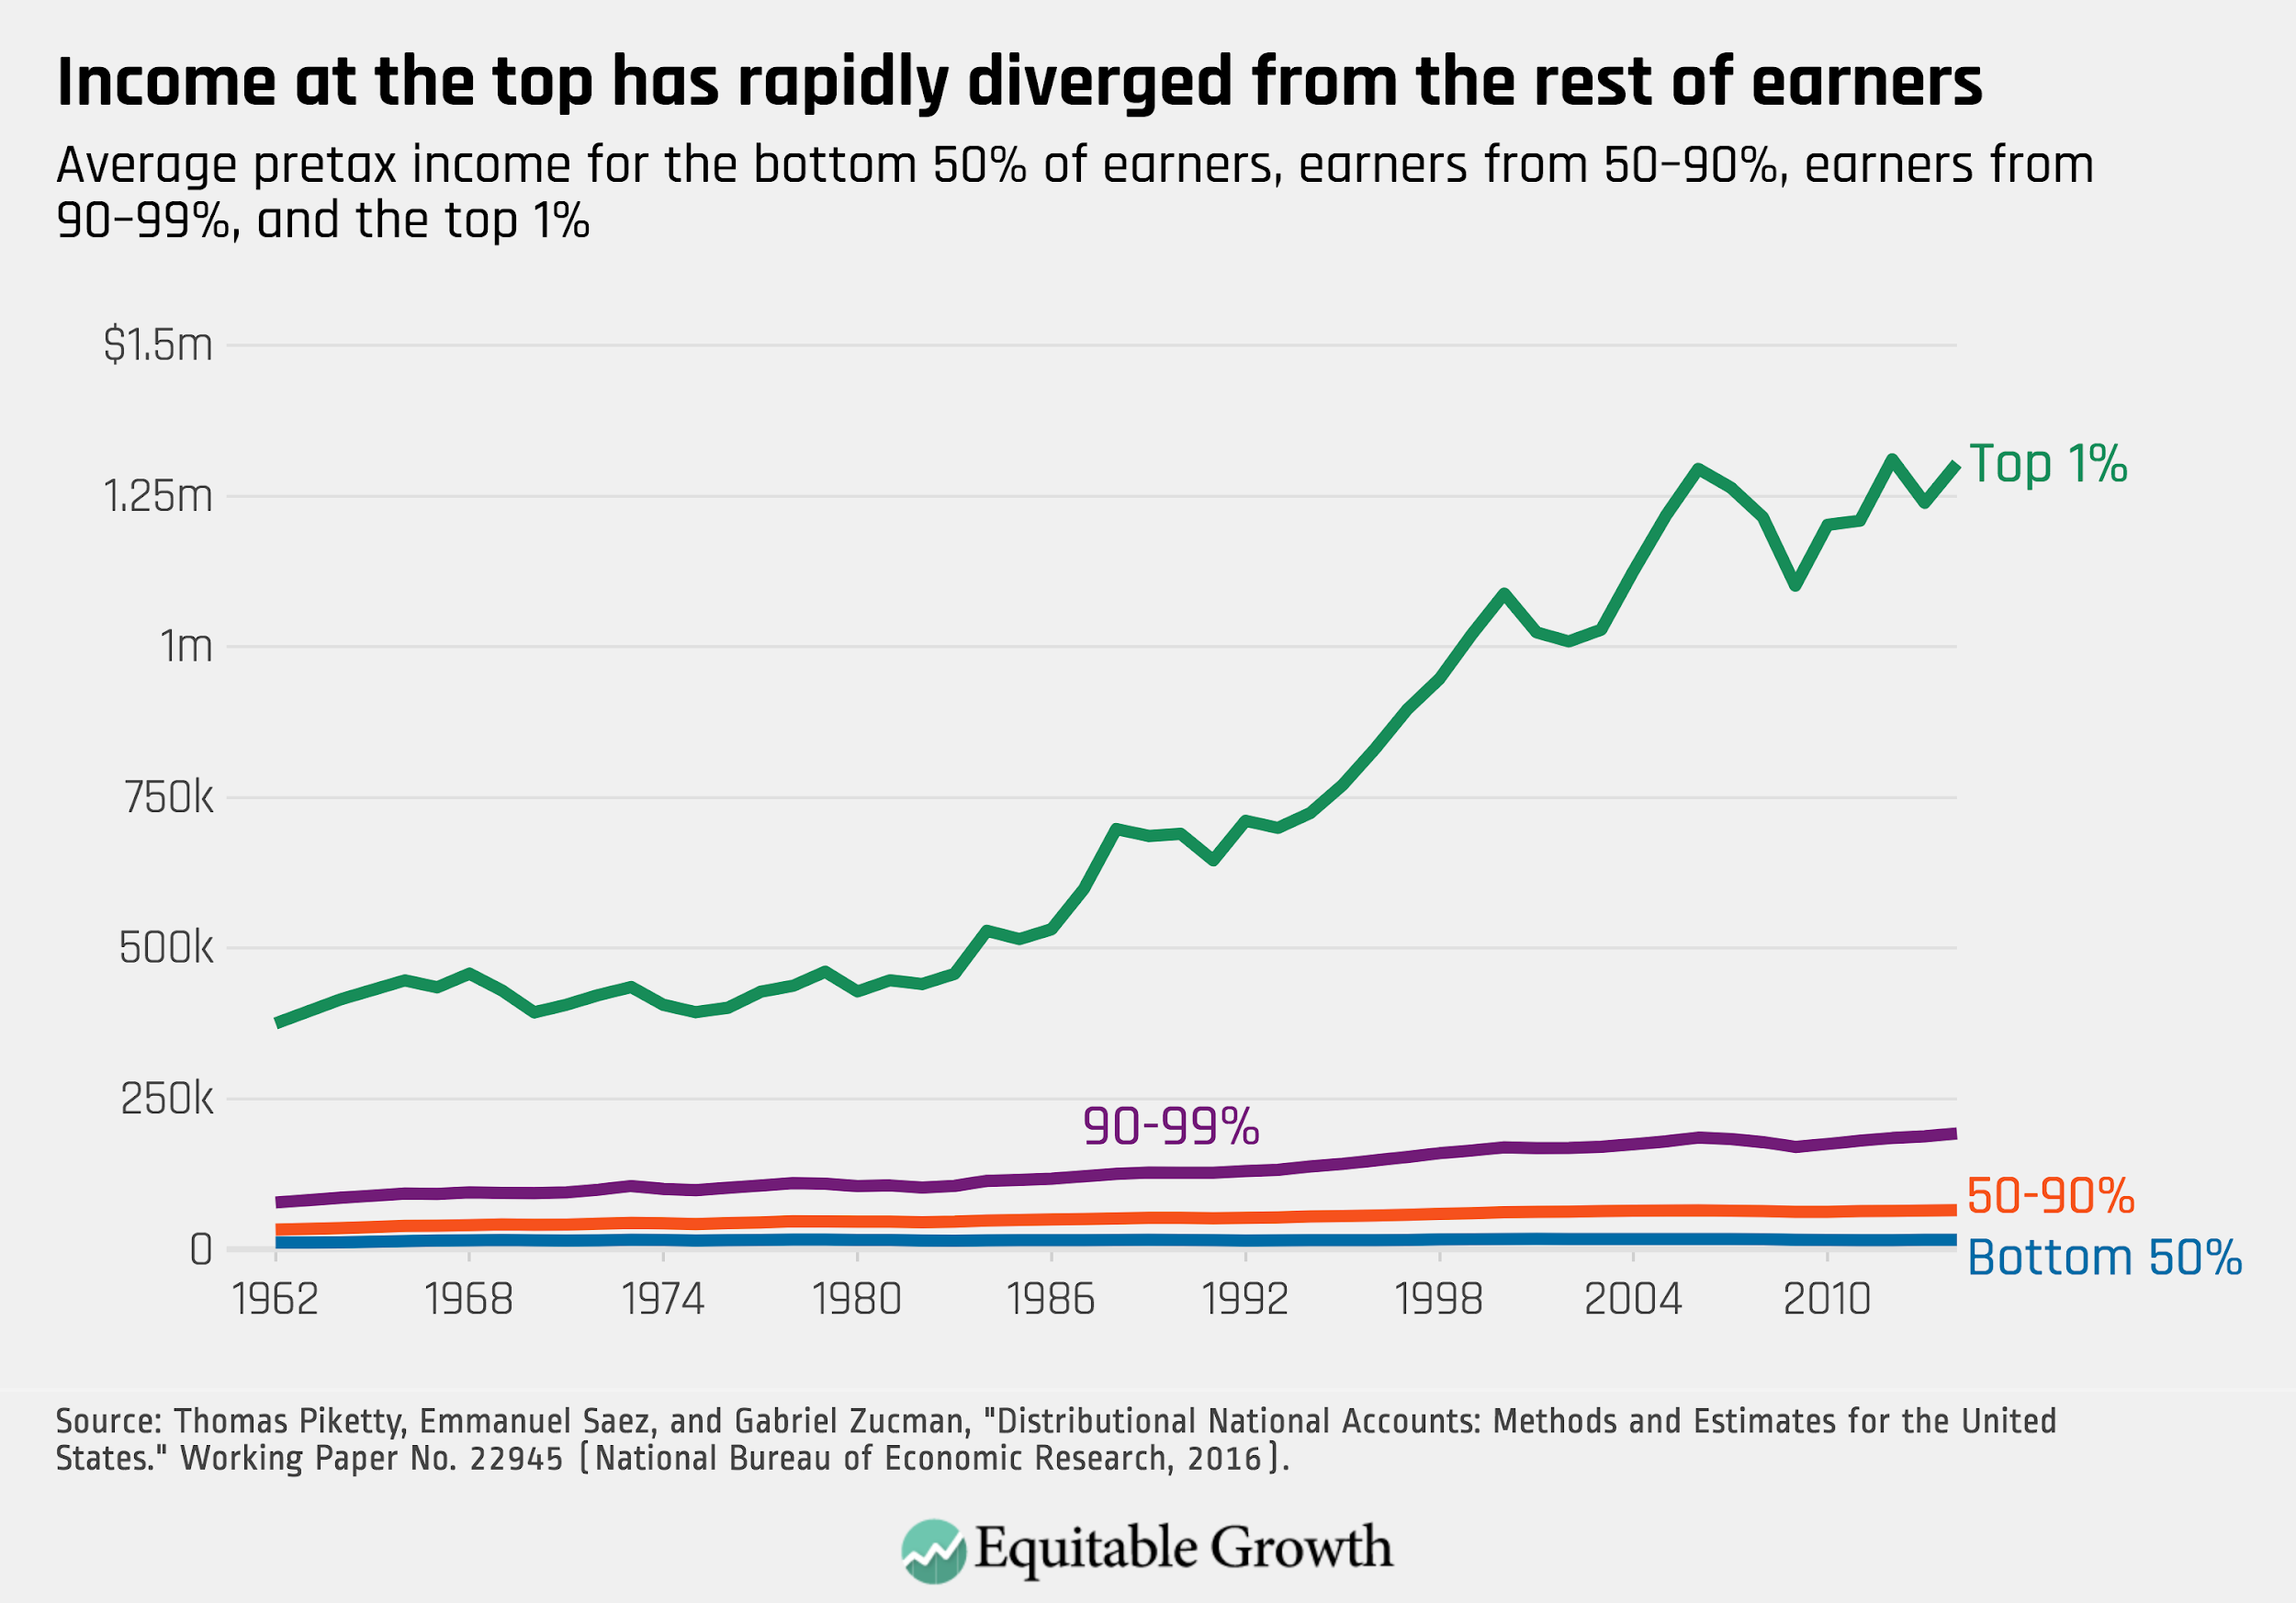
These data, and other work from Thomas Piketty, Emmanuel Saez, and Gabriel Zucman, depict the relationship between inequity and mobility, and a widening gap between the super rich and everyone else.
The research from Chetty, Hendren, Kline, and Saez also singles out five factors that have high correlation with economic mobility. Not surprisingly, one of the five drivers of mobility is social capital—essentially, connectedness. They use social capital indices (a measure for civic connectedness through religious and community institutions) and found a strong correlation with economic mobility. Tim Carney, in his upcoming book Alienated America also makes a powerful case that disconnectedness, not simply economics, is at play in the variance of vibrancy and economic well-being of some American communities versus others. Rupasingha, Goetz, and Freshwater also document a strong correlation between greater amounts of social capital and enhanced economic mobility.
Taken together, these trends of declining mobility and the power of place in predicting the economic prosperity, mobility, and connectedness of individuals are important context for the landscape in which innovation networks operate.
Sorting by Likeness in Networks
In addition to new data about geography as a predictor of economic mobility, there is another emerging trend about place: more and more Americans are living and working near people like them. Well-educated and well-off people are living with other well-educated and well-off people. People are also living close to those who share their political outlook, more so than a generation ago.
This phenomenon, coined the “the Big Sort” by journalist Bill Bishop, forms a thread in research by Richard Florida and Ed Glaeser in their work about the creative classes and about human capital segregation. Bishop and others use different sets of data to map trendlines of Americans living and working with people similar to themselves. This true more today than it was one generation ago. Bishop puts it more plainly in his book, “some cities were sucking up people and income … Others were flinging them out with what appeared to be a centrifugal force.”
While the data on increased sorting across communities in the United States is relatively recent, the idea of sorting by likeness has been documented in the network sciences for hundreds of years. Across disciplines—biology, network science, and the social sciences—there is evidence backing the theory that people and organizations tend to form connections and attractions to others who share similar characteristics, best simplified through the old adage, ‘birds of a feather flock together’. There is name for the phenomenon: homophily. In their article in Annual Review of Sociology, Miller McPherson, Lynn Smith-Lovin, and James M. Cook, describe it this way: “Similarity breeds connection. This principle—the homophily principle—structures network ties of every type.” They also go on to state that homophily limits individuals’ social worlds and has powerful implications.
Our observations about hyper-connected and under-connected city networks could reflect larger trends of economic and social capital sorting. It is also possible they reflect the longstanding principle and property of networks in nature to connect similar people, places, and cohorts, like to like. While they are often thought of as less hierarchical or institutional that other civil society structures, networks are predisposed to sort by type, presenting equity challenges for those seeking to make change across divided geographies.
Closing the Gap
As the ‘big sort’ plays out across a landscape of stratifying economic mobility and social capital, communities become more homogenous: either very rich or very poor, very connected or very disconnected. Networks can either help cross these divides or they can amplify existing fault lines of geographical inequality. For this reason, it matters that some places are networked and others are not. The distribution of networks and other assets to advance the quality of life in place is worth further scrutiny. Our research suggests that networks, without deliberate design plans, run the risk of amplifying the disconnected landscape of declining economic mobility, and polarization of social capital. The spatial data on how communities are divided along racial, economic, educational, social capital, and income lines suggests that network designers need a deliberate plan to bring innovation to all communities, especially if they seek to build solutions that can scale and reach the residents of counties and neighborhoods who are most in need.
There is good news for change-makers and philanthropies who want networks to ameliorate national trends of social capital or economic mobility sorting: our research suggests that this is possible, but only with a design plan for this purpose. Our research found a few cases of networks cutting across these trends. We interviewed numerous network managers who were thinking clearly about the challenges of bringing their networks to more disconnected communities and many who had tried to build capacity and work in communities off the map.
Several networks that we interviewed had experimented with including a network member that had less capacity with varying degrees of success. They often were able to pay for additional staff, or, with the support of a local or national philanthropy, provide resources to build capacity to allow a place to participate in a national network. FUSE Corps is a great example of how capacity can be bolstered for a city or place through additional talent: FUSE places mid-career leaders on the ground in governments they work with, adding staff and capacity on-site. We also found examples of outlier places with smaller populations and resources making enormous progress on thorny challenges. For example, through the Built for Zero Network, Rockford, Ill. was the first U.S. community to reach functional zero in ending veteran homelessness. There are plenty of examples where innovation and capacity building is happening in lesser networked communities.
Networks are being built to tackle challenges from ending police violence to reducing inequity in early education. But they are built on an uneven playing field: the stratified economic and social capital landscape of the U.S. Both the trends on inequity and properties of networks in other contexts indicate network builders and backers should be deliberate about design, in order to combat, not amplify, the larger forces driving inequity across geographies. Our research suggests, if change-makers and philanthropies want networks to address the ‘big sort’, they will need to tackle it head on.