Varying Degrees 2019
Abstract
Americans’ opinions about higher education are complex. Understanding this complexity is important for learning how to talk about the value of educational pathways after high school and crafting thoughtful policy solutions to meet the needs of today’s students. This is the reason we engage Americans every year, asking questions other surveys do not delve into, and digging deep to reveal the sentiments and nuance of people’s thoughts about higher education, its value, who should fund it, and what the government’s role should be.
This report marks the third year of New America's groundbreaking Varying Degrees survey, and represents a complete overhaul. Given the great strides online survey research has made, we transitioned to an online/telephone design using AmeriSpeak, a representative panel developed by NORC at the University of Chicago. AmeriSpeak allows us to capture better representation of harder-to-reach populations such as young adults, current students enrolled in higher education programs, and oversamples of African American, Latinx, and Asian American populations.
This report is published as New America commemorates its 20th anniversary. This year, New America celebrates 20 years of creating and incubating the next big ideas that address some of the nation's and the world’s toughest problems. We are thinkers, researchers, problem-solvers, and storytellers, united by our goal to hold our nation to its highest ideals. We recognize the challenges presented by rapid technological and social change, and work to ensure that the solutions made possible by those changes lead to greater opportunity for all. As we reach forward toward the next 20 years of New America, we will strive to be an engine of American renewal, at home and abroad. Read more about our 20th anniversary.
Acknowledgments
The authors would like to thank the practitioners who graciously shared their stories, particularly Dr. Pam Eddinger from Bunker Hill Community College, Dr. Yu-Wei Wang from University of Maryland College Park, Kate Kinder and Marc Goldberg from Portland Community College.
Varying Degrees was funded by the Bill & Melinda Gates Foundation. New America thanks the Foundation for its support.
Foreword
When we first conceptualized Varying Degrees in 2016, we were seeking to investigate what Americans know about higher education, how they value it, and what they believe the roles of various stakeholders should be. We wanted to create a body of high-quality public opinion data about higher education in order to help illuminate preferences and beliefs about educational opportunities beyond high school along with specific concerns by demographic.
Over the three years we have administered Varying Degrees, we have seen shifts in America’s political climate. It has been clear from all the focus groups that we conduct annually that people are feeling deeply cynical about the direction our country is going, and there is skepticism about some of America’s most vaunted institutions, including colleges and universities. A longitudinal survey conducted by Pew Research, for example, found that Republicans’ views of colleges and universities have turned sharply negative over time.1
It is no wonder there is a fair amount of pessimism about higher education simmering among Americans. With college costs soaring, students and families are increasingly on the hook to finance their own educations through earnings, savings, and loans. It is understandable that people have felt frustrated with their options for an affordable and high-quality education after high school. Several recent high-profile scandals surrounding free speech, campus climate, and admissions to some of America’s most elite institutions may be contributing to this frustration too.2
But Americans’ opinions about higher education are complex. Understanding this complexity is important for learning how to talk about the value of educational pathways after high school and crafting thoughtful policy solutions to meet the needs of today’s students. This is the reason we engage Americans every year, asking questions other surveys do not delve into, and digging deep to reveal the sentiments and nuance of people’s thoughts about higher education, its value, who should fund it, and what the government’s role should be.
This year, we completely revamped Varying Degrees. Given the great strides online survey research has made, we transitioned to an online/telephone design using AmeriSpeak, a representative panel developed by NORC at the University of Chicago. AmeriSpeak allows us to capture better representation of harder-to-reach populations such as young adults, current students enrolled in higher education programs, and oversamples of African American, Latinx, and Asian American populations.
Along with moving our survey to a new platform, we have also taken a thorough look at our questionnaire and made several changes and additions. We examined the terminology we use in our questions to make sure it encompasses all experiences in higher education. For example, we adopted the phrase “education after high school” to describe all postsecondary opportunities. Because of these changes, we have lost the ability to track several questions over time. We believe that this was a necessary adjustment to make sure the questionnaire is as encompassing of peoples’ experiences with our higher education system as possible.
Finally, moving to the AmeriSpeak panel has allowed us to ask several more questions than we have in previous years since underlying demographic data are already recorded and respondents can answer online questions faster, nearly tripling the number of questions. This year, for example, we focus on who should fund education after high school, how we should hold institutions accountable, and whether selective colleges and universities should have certain admissions preferences. AmeriSpeak has also given us the capability to ask about food insecurity among a national sample of today’s students.
We will continue to improve our data collection methods and survey questionnaire as we move forward, to ensure that we understand the nuances of people’s opinions about education after high school and that we are reaching a nationally representative population. The methodology for this year’s survey can be found in Appendix A of this report.
Citations
- Kim Parker, The Growing Partisan Divide in Views of Higher Education (Washington, DC: Pew Research Center, August 2019).
- Dana Goldstein, “Reporting on a Very Bad Year for the College Admissions Industry,” New York Times, August 2, 2019.
Executive Summary
New America began Varying Degrees as an annual effort to gauge opinions about and knowledge of higher education over time. In the three years since New America began to publish this survey, the United States has seen massive economic growth that has included lower unemployment rates, modest wage increases after a long period of stagnation, and greater consumer spending. But Americans cannot escape the feeling that their economic fortunes are on shaky ground due to a struggling global economy and fears of the next recession. And many feel cynical when it comes to the foundational institutions of this country—from the media, to government, to higher education.1
As the country begins its next presidential election cycle—one in which the 2018 midterm election referendum on President Trump was mixed, with Democrats winning back the majority in the House but losing ground in the Senate—there is a question of whether trust in these foundational institutions can be restored. When it comes to higher education in America, there is an increasing questioning of whether college is worth the cost as prices continue to grow and higher-education debt balloons.
Against this backdrop, Varying Degrees 2019: New America’s Third Annual Survey on Higher Education surveyed 2,029 Americans ages 18 and older to better understand their perceptions of education after high school, its contribution to economic mobility, how state and federal government should prioritize its funding, and what role it plays in the 2020 presidential election. As in previous years, the survey shows unifying themes, as well as differences among various demographics when it comes to questions about the value of and funding for education opportunities after high school. Since the United States is gearing up for a presidential election, special attention is paid to the opinions of Republicans, Democrats, and independents.2
Our top findings this year include:
- Americans think that well-paying jobs may not require education after high school, but they believe that education after high school creates better opportunities. Many (62 percent) agreed that there are lots of well-paying, stable jobs that people can find with only a high school diploma or GED. Despite this, 78 percent said that education beyond high school offers a good return on investment for students, and 90 percent said that education beyond high school offers pathways for upward economic mobility.
- Americans want change in higher education. Only one-third of Americans think higher education is fine the way it is.
- Only half of Americans think education after high school Is affordable and they believe government funding should be increased. Approximately half (49 percent) believe that Americans can receive a high-quality education after high school that is also affordable. Over four out of five Americans believe that federal and state government should spend more taxpayer dollars on education after high school to make it more affordable.
- Americans think we need to hold colleges and universities accountable. Nine out of 10 (91 percent) Americans think it is important for colleges and universities to be transparent and provide publicly available data on key indicators of quality. Most Americans support the idea that colleges and universities should lose access to taxpayer dollars if they fail to meet several indicators of quality, such as having low graduation rates or student loan repayment rates.
- Americans want admissions at elite colleges and universities to change. In general, Americans do not like any admission preference that considers legacy status (63 percent opposed), athletic recruitment (57 percent opposed), or race/ethnicity (74 percent opposed).
- Americans value various educational pathways after high school. Whether it is an apprenticeship, technical degree, associate degree, or bachelor's degree, almost all Americans said that they felt comfortable recommending that their children or close family members enroll in these programs (90 percent or more for all programs except for associate degree programs, 84 percent).
- Americans believe public colleges and universities are worth the cost. Meanwhile, a slight majority (52 percent) think for-profit institutions are not worth the cost.
- Americans feel positively about their local colleges and universities. Nearly four out of five Americans feel positively about their local colleges and universities.
- Voters slightly support free college in the 2020 election. While 67 percent say a candidate’s stance on free college is important for their voting decision, a smaller percentage (56 percent) say they are more likely to support a candidate that favors free college tuition with 31 percent actively opposing and 12 percent who said it would not impact their vote.
Citations
- Along with data New America has collected through several focus groups conducted from 2016 through 2018, see Carroll Doherty, Jocelyn Kiley, and Bridget Johnson, Sharp Partisan Divisions in Views of National Institutions: Republicans Increasingly Say Colleges Have Negative Impact on U.S. (Washington, DC: Pew Research Center, July 2017).
- Underlying demographic information on political party identification is collected in AmeriSpeak Panel Profile surveys and in individual specific client surveys and then back-filled into the profile data.
Explore the Data
Error: Data visualization bundle URL missing.
Findings
Americans Think that Well-Paying Jobs May Not Require Education after High School, but they Believe that Education after High School Creates Better Opportunities.
A majority of Americans (62 percent) agree that people can find lots of well-paying, stable jobs with only a high school diploma or GED. Compared to last year, the data this year show a higher number of people who believe in the availability of well-paying and stable jobs that do not require education after high school. In 2018, only about half agreed when asked if there are lots of well-paying jobs that do not require education after high school. While we cannot entirely explain the increase in the belief that there are well-paying jobs that do not require education after high school (which could be due to the new survey mode and the way the question was asked, or the improvement of the economy, or both), the number shows that Americans across the board believe that education after high school is not necessarily a must-have for a well-paying and stable job.
Error: Data visualization bundle URL missing.
At the same time, Americans still value higher education as providing more access to opportunity and economic stability: 78 and 90 percent, respectively, believe that education beyond high school offers a good return on investment for students, and that education beyond high school offers pathways for upward economic mobility.
Error: Data visualization bundle URL missing.
Error: Data visualization bundle URL missing.
And even though a majority of Americans say that there are plenty of well-paying jobs for those who have only a high school diploma, four out of five Americans (82 percent) think that people who pursue education after high school have more job opportunities compared to those who work right after graduating from high school. They also think that lacking education after high school can affect an individual’s career mobility: Nearly three in four (73 percent) agree that people who did not seek education beyond high school are limited in how much they can grow in their careers.
Error: Data visualization bundle URL missing.
Error: Data visualization bundle URL missing.
This year’s survey goes further to explore public perceptions of the value that different levels of education after high school can bring. In general, Americans almost unanimously agree that no matter the level, having any higher education credential makes an individual better off than not having one at all, and that the higher the level of education, the greater the return.
When asked if they think people with certain higher education credentials earn more, less, or about the same as those who did not receive education after high school, the majority say more, regardless of the credential earned. Overall, only around half (52 percent) agree that people with some technical education or college but no degree will earn more than those with only a high school diploma. But the number rises to more than 70 percent when the question is about those with a technical degree/certificate and those with an associate degree, and then to 86 percent for a bachelor's degree, and more than 90 percent for advanced and professional degrees. The same pattern holds across almost all demographic groups.
Error: Data visualization bundle URL missing.
In terms of job stability and overall economic security, 70 percent agree that it is easier to find a well-paying and stable career if an individual has some technical education or college (even without a degree) compared to just having a high school diploma. Nearly nine out of 10 (87 percent) agree that those with technical degrees or certificates have an easier time finding a well-paying and stable career, 81 percent think so for associate degree earners and more than 90 percent for bachelor's, advanced, and professional degrees.
Error: Data visualization bundle URL missing.
Findings by Party ID
It seems these days that there is not a lot that Democrats and Republicans can agree on, but our survey shows that they are fairly aligned when it comes to the value of education after high school. Where they differ is their belief in whether or not education after high school is necessary to secure a well-paying and stable job. Only half of Democrats think that there are lots of well-paying, stable jobs that only require a high school diploma or GED. Many more Republicans (76 percent) believe this to be the case.
Error: Data visualization bundle URL missing.
However, when asked if education beyond high school offers a good return on investment for the student, 80 percent of Democrats and 78 percent of Republicans agree. When the question is about whether education beyond high school offers pathways for upward economic mobility, rates of agreement for Democrats and Republicans are 93 and 91 percent, respectively. When we asked if people who did not receive an education beyond high school are limited in how much they can grow in their careers, 81 percent of Democrats and 65 percent of Republicans agree.
Error: Data visualization bundle URL missing.
Error: Data visualization bundle URL missing.
Error: Data visualization bundle URL missing.
When it comes to questions about the returns on different levels of education after high school, again, Democrats and Republicans are aligned. Democrats and Republicans both agree that people with higher credential will earn more and find it easier to have a well-paying and stable career than someone who did not receive any education beyond high school.
Error: Data visualization bundle URL missing.
Error: Data visualization bundle URL missing.
Other Findings
By Generation
The survey results show a generational gap in perception of the opportunities that education after high school can provide. Only half of Generation Z, those born between the mid-1990s to early 2000s (the youngest group in our sample), think that there are lots of well-paying, stable jobs for people with only a high school diploma or GED. In contrast, nearly three in four people in the Silent Generation, those aged 74 and above ( the oldest group in our sample), believe that individuals can find lots of well-paying and stable jobs without any education after high school.1
Error: Data visualization bundle URL missing.
Millennials, those who are between 25 and 39 years old, seem to be dubious of the value of education after high school. Two in three (66 percent) Millennials do not think that one needs some sort of education after high school to get a good job. And even though the numbers show that a high majority of Millennials still believe in the value of education after high school, they believe at much lower rates compared to all other generations. In particular, 71 percent of them agree that education after high school offers a good return on investment for students, compared to 78 percent of Generation Z, 76 percent of Generation X, 83 percent of Baby Boomers, and 90 percent of the Silent Generation.
Error: Data visualization bundle URL missing.
The lower agreeing rate among Millennials compared to other generations makes sense. Many of them came of age during the height of the economic crisis in 2008 and left high school just when public higher education in many states was faced with huge funding cuts. They were more reliant on student loans to fund higher education than previous generations and they also entered a much rockier labor market. Among all generations, they make up the largest group of current student loan borrowers, accumulating more than half a trillion dollars in federal student loan debt.2
Americans Want Change with Higher Education
As in previous years, satisfaction with higher education is low. This year, about a third (33 percent) of Americans believe higher education is fine the way it is, up from one-quarter (25 percent) in 2017 and 2018.3
Error: Data visualization bundle URL missing.
In contrast to their low satisfaction with higher education, Americans are split in terms of how satisfied they are when the question is broadened to include any educational opportunities beyond high school. Almost half (49 percent) of all Americans think that education opportunities beyond high school are fine the way they are, while the other half (50 percent) disagree.
Error: Data visualization bundle URL missing.
When it comes to what colleges and universities should do for students, the three most important capabilities Americans select are: (A) supporting learning and development towards lifelong careers (36 percent); (B) preparing students for entering the job market or graduate school (28 percent); (C) teaching work-related skills and knowledge (22 percent). When ranking what is the least important for colleges and universities to do, Americans say promoting an engaged citizenry (53 percent) and assisting students with personal and intellectual growth (21 percent) are the least important.
Error: Data visualization bundle URL missing.
Error: Data visualization bundle URL missing.
Findings by Party ID
Americans’ satisfaction with higher education varies by party. Democrats are the least satisfied with higher education, with only one out of four (26 percent) believing that higher education is fine the way it is. Meanwhile, approximately 41 percent of both Republicans and independents believe higher education is fine the way it is.
Error: Data visualization bundle URL missing.
Similarly, Democrats are the least satisfied with education opportunities after high school. Only four out of 10 Democrats agree (41 percent) that education opportunities beyond high school are fine the way they currently exist. In contrast, a majority of Republicans (55 percent) and independents (53 percent) are satisfied with education opportunities after high school as they are.
Error: Data visualization bundle URL missing.
Across party lines, Americans agree on what is most important for colleges and universities to do. A little over one in three Democrats, Republicans, and independents feel that supporting learning and development towards lifelong careers is most important (35, 36, and 35 percent, respectively).
Error: Data visualization bundle URL missing.
Promoting an engaged citizenry is the least important across party lines (Democrats 52 percent, Republicans 57 percent, and independents 52 percent), followed by assisting students with their personal and intellectual growth (18 percent, 28 percent, and 17 percent, respectively).
Error: Data visualization bundle URL missing.
Other Findings
By Generation
Regardless of age, Americans do not think that higher education is fine the way it is. Only 27 percent of Generation Z, 33 percent of Millennials, 33 percent of Generation X, 34 percent of Baby Boomers, and 38 percent of the Silent Generation are satisfied with higher education the way it is.
Error: Data visualization bundle URL missing.
However, Americans across generations are more mixed about education opportunities after high school being fine the way they currently exist. Interestingly, Millennials and the Silent Generation agree that educational opportunities after high school are fine at greater numbers (54 and 57 percent, respectively), while just under half of all other generations agreed.
Error: Data visualization bundle URL missing.
By Race
Satisfaction with higher education across racial groups varied. Only 31 percent of white Americans and 26 percent of those who are two or more races were satisfied with higher education. Latinx, Black Americans, and Asian Americans say that higher education is fine how it is at lesser numbers (38, 40, and 46 percent, respectively).
Error: Data visualization bundle URL missing.
When it comes to whether educational opportunities beyond high school are fine the way they currently exist, responses are more mixed. Black, Latinx, and those who are two or more races are satisfied with educational opportunities after high school (56 percent, 57 percent, and 56 percent, respectively). Meanwhile, 45 percent of white Americans and 48 percent of Asian Americans think educational opportunities beyond high school are fine the way they are.
Error: Data visualization bundle URL missing.
What Americans thought was most and least important for colleges and universities to do varies by race, but two categories were most noticeable. White (36 percent), Latinx (36 percent), and Asian Americans (43 percent) felt that supporting students’ learning and development toward lifelong careers is their most important job. Black Americans (38 percent) and those who are two or more races (35 percent), however, felt that it is most important for colleges and universities to prepare students for entering the job market or graduate school.
Error: Data visualization bundle URL missing.
Error: Data visualization bundle URL missing.
Only Half of Americans Think Education after High School Is Affordable and They Believe Government Funding Should Be Increased.
Americans are split almost 50/50 on whether people have access to a high-quality education after high school that is also affordable, with about one in five either strongly agreeing or disagreeing.
Error: Data visualization bundle URL missing.
Mixed opinions about whether Americans have access to high-quality and affordable education after high school aside, six in 10 Americans, like last year, believe that government should fund educational opportunities after high school because it is good for society. Only 35 percent believe that students should fund their own education because it is a personal benefit.
Error: Data visualization bundle URL missing.
When it comes to who should pay what share of education beyond high school, Americans vary on where the money should come from, depending on whether a student and her family is low-income (making less than $45,000), middle-income (making between $45,001–$135,000), or high-income (making more than $135,000). For students from low-income families, 41 percent of those polled believe the largest funding source should be the federal government and 48 percent think the smallest source should be the student and family.
Error: Data visualization bundle URL missing.
Error: Data visualization bundle URL missing.
While Americans overall believe that low-income families should shoulder less cost for their higher education, their opinions about middle-income students are more muddled. For students from middle-income families, 38 percent think the largest funding source should be students and their families, followed by federal funds (28 percent). As an indication that people are relatively split on who should pay what share for middle-income families, 35 percent think the smallest funding source should also be students and families, followed by federal funds (22 percent). Basically, people split their answers on these two questions.
Error: Data visualization bundle URL missing.
Error: Data visualization bundle URL missing.
There is a general sense, however, that high-income families should shoulder more responsibility when it comes to paying for college. Close to seven out of 10 Americans believe students from high-income families should be the largest source of funding for their higher education, and the smallest funding source should be federal (34 percent) and state (26 percent) dollars.
Error: Data visualization bundle URL missing.
Error: Data visualization bundle URL missing.
Regardless of how Americans feel about who should pay what share of higher education, overall there is a strong belief that federal and state government should spend more taxpayer dollars to make education after high school more affordable. Just over eight in 10 believe both governments should spend more, including just over half who strongly agree.
Error: Data visualization bundle URL missing.
Error: Data visualization bundle URL missing.
When it comes to state spending priorities, Americans believe that state governments spend the most on public welfare programs (32 percent believe this is the largest source of government spending) and the least on higher education (26 percent believe this is the smallest source of spending). According to budget data analyzed by the Urban Institute, Americans are correct that the largest share of state spending goes to public welfare, but wrong in that the smallest share goes to highways and roads.4
Error: Data visualization bundle URL missing.
Error: Data visualization bundle URL missing.
When asked what states should prioritize when spending taxpayer dollars, 30 percent of Americans believe that the most funding should be focused on K–12 education. And 33 percent of Americans think the least state funding should be focused on public welfare. When it comes to higher education specifically, even though it does not rise to the level of K–12 education, 18 percent of Americans say that states should be spending the most on funding it compared to 14 percent who say the least taxpayer dollars should be spent on it.
Error: Data visualization bundle URL missing.
Error: Data visualization bundle URL missing.
Findings by Party ID
Just over half (55 percent) of Republicans believe that Americans can find a high-quality education after high school that is also affordable. This is a significant difference when compared to Democrats and independents, who believe at lower rates that an affordable pathway is still open to individuals pursuing education after high school (45 percent for both groups).
Error: Data visualization bundle URL missing.
Perhaps because Republicans believe that Americans can pursue an affordable and high-quality education after high school, they also believe that it is more of the student’s responsibility to shoulder the cost. Nearly three in five Republicans believe that the individual should fund her own education because it is a personal benefit. Meanwhile, 80 percent of Democrats say that it is the government’s responsibility to fund higher education because it is good for society.
Error: Data visualization bundle URL missing.
Republicans, however, have mixed feelings about who should be the biggest funding source for low-income families and who should be the smallest. Around the same number of Republicans feel that students should either pay the least (36 percent) or the most (34 percent). Meanwhile, Democrats think the federal government should pick up the largest share of cost (54 percent say the federal government should pay the most), with 57 percent saying that students and their families should pick up the least.
Error: Data visualization bundle URL missing.
Error: Data visualization bundle URL missing.
Republicans more squarely believe (52 percent) that middle-income students should be the primary funders of their education and that the federal government should spend the least (33 percent). Democrats, on the other hand, believe that the federal government should pick up the largest share of the tab for middle-income students (37 percent), and that the student and his family should pick up the smallest share (42 percent).
Error: Data visualization bundle URL missing.
Error: Data visualization bundle URL missing.
Regardless of party identification, when it comes to high-income students and families, there is widespread agreement that the student and his family should pick up the largest share of the cost (74 percent of Republicans, 66 percent of Democrats). There is also agreement that the smallest share should be paid by the federal government (41 percent of Republicans, 30 percent of Democrats).
Error: Data visualization bundle URL missing.
Error: Data visualization bundle URL missing.
Yet even though there is some disagreement by party over who should be the primary funder of higher education, Republicans still agree that both state (71 percent) and federal (64 percent) government should spend more taxpayer dollars to make higher education affordable. Democrats and independents, agree at even higher levels than Republicans that states should spend more on higher education affordability (95 and 87 percent, respectively) as well as the federal government (95 and 89 percent, respectively).
Error: Data visualization bundle URL missing.
Error: Data visualization bundle URL missing.
In terms of how states prioritize funding for various budgetary items including higher education, Republicans think states currently spend the most on public welfare (47 percent) and the least on highways and roads (28 percent). Democrats, on the other hand, think that the least amount is spent on higher education (29 percent), while the most is spent on police and correctional facilities (31 percent).
Error: Data visualization bundle URL missing.
Error: Data visualization bundle URL missing.
When it comes to how states should prioritize spending, Democrats and Republicans both believe most should be going to K–12 education (32 and 29 percent, respectively). There is divergence, however, in what the two parties believe state governments should spend the least on: Republicans believe it should be public welfare programs (49 percent) and Democrats believe the least should be spent on police and corrections (37 percent).
Error: Data visualization bundle URL missing.
Error: Data visualization bundle URL missing.
Other Findings
By Generation
Younger Americans agree at lower rates that there are affordable and high-quality educational options after high school. Only 36 percent of Generation Z and 44 percent of Millennials agree with this statement, compared to around half of Generation X (51 percent) and Baby Boomers (50 percent). The Silent Generation are the only ones who agree at higher numbers, at 63 percent.
Error: Data visualization bundle URL missing.
Perhaps as a reflection that younger generations agree less that Americans have access to an affordable higher education, they also believe at higher numbers that the government should fund higher education because it is good for society. A majority of Generation Z (82 percent), Millennials (68 percent), and Generation X (70 percent) believe the responsibility falls to the government. Just over half of Baby Boomers (55 percent) believe it falls to the government. The Silent Generation thinks that the individual should be more responsible because it is a personal benefit (58 percent).
Error: Data visualization bundle URL missing.
Not only does the Silent Generation believe that Americans have access to an affordable higher education, and that education after high school is a personal benefit, they also believe (42 percent) that low-income students and families should pay the largest share of education costs. All other generations believe the largest funding source should be federal funds. In opposition to the Silent Generation’s views, all generations believe low-income students should pay the smallest share of costs. Interestingly, the Silent Generation also believes the student should bear the smallest share but at a much lower numbers (39 percent). The Silent Generation said in greater numbers that they do not know who should bear what costs for low-income families (11 percent).
Error: Data visualization bundle URL missing.
Error: Data visualization bundle URL missing.
When it comes to middle-income families, groups are mixed. Generation Z still believes that the federal government should pick up the largest share of the tab (42 percent). A plurality of Millennials (35 percent), Generation X (34 percent), and Baby Boomers (43 percent) believe it should be the student and his family. Only the Silent Generation (56 percent) lists a student and his family as the primary funding source. Given the contradiction of Millennials, Generation X, and Baby Boomers who say that students should be the primary funders, they also list students and families as the smallest funding source.
Error: Data visualization bundle URL missing.
Error: Data visualization bundle URL missing.
Regardless of age, all generations believe that for high-income families, students and their families should pay the largest share of the cost for their higher education (65 percent of Generation Z, 62 percent of Millennials, 63 percent of Generation X, 73 percent of Baby Boomers, and 83 percent of the Silent Generation). They also all believe that the smallest share should be paid by the federal government (34 percent of Generation Z, 30 percent of Millennials, 36 percent of Generation X, 34 percent of Baby Boomers, and 45 percent of the Silent Generation).
Error: Data visualization bundle URL missing.
Error: Data visualization bundle URL missing.
There is a strong sense, regardless of age, that states and the federal government should be spending more taxpayer dollars to make education after high school affordable. Over four out of five across every generation, for example, believe states should be spending more (91 percent of Generation Z, 83 percent of Millennials, 84 percent of Generation X, 87 percent of Baby Boomers, and 91 percent of the Silent Generation).
Error: Data visualization bundle URL missing.
Similarly, all generations also believe that the federal government should be spending more taxpayer dollars to make higher education affordable (91 percent of Generation Z, 82 percent of Millennials, 84 percent of Generation X, 84 percent of Baby Boomers, and 74 percent of the Silent Generation). The one generational difference: One in four of the Silent Generation actually disagrees with the federal government spending more money on higher education.
Error: Data visualization bundle URL missing.
When it comes to prioritizing how states should spend their money, interesting differences emerge. Generation Z is fairly split, believing state governments should equally prioritize K–12 education (22 percent) and health and hospitals (22 percent), followed by higher education (20 percent), and highways (18 percent). All other generations believe more strongly that states should prioritize K–12 education (32 percent of Millennials, 31 percent of Generation X, 30 percent of Baby Boomers, and 30 percent of the Silent Generation).
Error: Data visualization bundle URL missing.
Error: Data visualization bundle URL missing.
By Race
While every American, regardless of race and ethnicity, believes that the responsibility for funding higher education should rest more with the government because it is good for society, those who identify as Asian (80 percent), Black (79 percent), Latinx (75 percent), and two or more races (67 percent) believe so in greater numbers than white Americans (55 percent).
Error: Data visualization bundle URL missing.
Given the intensity of the beliefs of groups other than white Americans when it comes to government funding educational opportunities after high school, they believe in greater numbers that federal money should be the largest funding source for higher education for low-income families (54 percent of Black respondents, 49 percent of Latinx, and 50 percent of those who are two or more races, compared to only 35 percent of white respondents).5 Regardless of race/ethnicity, all respondents believe that low-income students should bear the smallest share of the cost.
Error: Data visualization bundle URL missing.
Error: Data visualization bundle URL missing.
Compared to white and Asian Americans, who believe the largest source of funding for middle-income families should be the student (43 and 36 percent, respectively), Black Americans believe in greater numbers that the largest funding source should come from the federal government (35 percent). When it comes to who should pay the smallest share, Americans, regardless of race and ethnicity, think it should be the student, though with much smaller pluralities (34 percent of white respondents, 34 percent of Black respondents, 35 percent of Latinx, and 35 percent of Asian American). Those who are two or more races feel at a higher intensity that middle-income students and families should pay the smallest share (44 percent).
Error: Data visualization bundle URL missing.
Error: Data visualization bundle URL missing.
For those students coming from the highest-income families, Americans, regardless of race and ethnicity, believe the largest source should be the student and family (74 percent of white, 46 percent of Black, 59 percent of Latinx, 66 percent of Asian, and 65 percent of those who are two or more races). Meanwhile, white (37 percent), Latinx (31 percent), Asian (33 percent), and those who are two or more races (31 percent) feel the smallest source should be the federal government. Black Americans believe the smallest funder should be the state, at 29 percent, but other sources such as the federal government (25 percent), institution (22 percent), and student (22 percent) are close behind, making this demographic split on who should pay the smallest share.
Error: Data visualization bundle URL missing.
Error: Data visualization bundle URL missing.
In general, all Americans, regardless of race and ethnicity, believe that states and the federal government should spend more to make education opportunities after high school more affordable. Black and Asian Americans believe this at a much stronger intensity for the federal government (95 and 91 percent, respectively) and state governments (95 and 94 percent, respectively) compared to other racial and ethnic groups.
Error: Data visualization bundle URL missing.
Error: Data visualization bundle URL missing.
White Americans believe that the most money in state budgets should be spent on K–12 education (33 percent). Black Americans believe that the most money should be spent on higher education (32 percent), followed closely by health and hospitals (29 percent). Latinx Americans are also fairly split, with 27 percent wanting the most spent on K–12 education, and 26 percent saying it should be spent on higher education. Asian Americans believe the most should be spent on health and hospitals (33 percent), followed by K–12 education (27 percent). Those who are two or more races believe the most money should be spent on K–12 education (37 percent), followed by health and hospitals (19 percent).
Error: Data visualization bundle URL missing.
Error: Data visualization bundle URL missing.
Americans Think We Need to Hold Colleges and Universities Accountable
Americans feel strongly about making sure colleges and universities are transparent and held accountable for student outcomes. Nine out of 10 (91 percent) Americans think it is important for colleges and universities to be transparent and provide publicly available data on key indicators of quality, such as graduation rates or employment rates.
Error: Data visualization bundle URL missing.
Most Americans support the idea that colleges and universities should lose some access to taxpayer dollars if several indicators of quality are missing, evident in low graduation rates, high default rates for student loans, low rates of student loan repayment, and low incidence of jobs with a living wage for graduates.
Four out of 10 Americans support the idea of institutions losing some access to taxpayer dollars if they have low graduation rates.
Error: Data visualization bundle URL missing.
About two-thirds (64 percent) of Americans support the idea of institutions losing some access to taxpayer dollars if they have a high student loan default rate.
Error: Data visualization bundle URL missing.
Two-thirds (65 percent) of Americans support the idea of institutions losing some access to taxpayer dollars if they have low rates of student loan repayment.
Error: Data visualization bundle URL missing.
And just over three in four Americans (77 percent) support the idea of institutions losing some access to taxpayer dollars if graduates have low rates of jobs with a living wage.
Error: Data visualization bundle URL missing.
Findings by Party ID
There is widespread support across party lines for having colleges and universities provide data on indicators of quality: 94 percent of Democrats, 90 percent of Republicans, and 87 percent of independents believe this is important.
Error: Data visualization bundle URL missing.
When it comes to holding institutions accountable, about eight in 10 Americans are in support of removing some access to taxpayer dollars if colleges or universities have low graduation rates (80 percent of Democrats, 80 percent of Republicans, 79 percent of independents).
Error: Data visualization bundle URL missing.
Similarly, two-thirds of Republicans and independents support the idea of institutions losing some access to taxpayer dollars if they have high student loan default rates; Democrats support the idea slightly less (62 percent).
Error: Data visualization bundle URL missing.
Republicans support the idea of colleges and universities losing some access to taxpayer money if they have low rates of student loan repayment (71 percent) in the highest numbers across party lines. Independents are the group second most in support (65 percent), followed by Democrats (60 percent).
Error: Data visualization bundle URL missing.
Holding institutions accountable for ensuring their graduates earn a living wage proved to be very important to Americans. Independents are most in support of institutions losing some taxpayer money if rates of post-graduation jobs with a living wage were low (83 percent). But about three-quarters of Democrats and Republicans (76 and 73 percent, respectively) are also in support of this idea.
Error: Data visualization bundle URL missing.
Other Findings
By Generation
Americans of all generations strongly support having colleges and universities provide data on indicators of quality. Generation Z and Baby Boomers favor the idea the most, at 96 and 94 percent, respectively. Millennials, Generation X, and the Silent Generation are all similarly in favor of having institutions provide data on indicators of quality, but slightly less so (89 percent).
Error: Data visualization bundle URL missing.
Regardless of generation, Americans are in support of having institutions lose some access to taxpayer dollars if they fail to meet indicators of quality. Doing so for institutions with low graduation rates is overwhelmingly supported across generations, with some variation. Generation Z and Baby Boomers support this idea at greater numbers (81 and 84 percent, respectively). Millennials and Generation X are similarly in support (78 and 79 percent, respectively). The Silent Generation, while still mostly in support, was less so. About seven in 10 Americans in the Silent Generation support this idea.
Error: Data visualization bundle URL missing.
Americans across generations also support the idea of institutions losing some access to taxpayer money if they have high default rates for student loans. Although around two-thirds of Americans across generations support this (64 percent of Generation Z, 65 percent of Millennials, 63 percent of Generation X, 66 percent of Baby Boomers, and 65 percent of the Silent Generation), they do so less than if institutions have low graduation rates.
Error: Data visualization bundle URL missing.
Similar levels of support are indicated across generations for the idea of institutions losing some access to taxpayer dollars if they have low rates of student loan repayment. Around two-thirds of Americans in each generation support the idea (68 percent of Generation Z, 64 percent of Millennials, 65 percent of Generation X, 68 percent of Baby Boomers, and 61 percent of the Silent Generation).
Error: Data visualization bundle URL missing.
Support for institutions losing some access to taxpayer money if they have low rates of graduates earning a living wage is also strong, but varies more across generations. Again, Generation Z (81 percent) and Baby Boomers (80 percent) are most in agreement with the idea. Three out of every four Millennials and Generation Xers support this idea. The Silent Generation are slightly less in favor (69 percent).
Error: Data visualization bundle URL missing.
Americans Want Admissions at Elite Colleges and Universities to Change
This year, New America gauged public opinion about admissions preferences at elite colleges and universities. Data were collected after the Varsity Blues scandal, in which well-known, wealthy parents allegedly committed fraud to secure a place for their children at some of the nation’s most prestigious colleges.6 Meanwhile, the Supreme Court is deciding the future of affirmative action at selective colleges and universities. How do Americans feel about any sort of preference besides academic and test scores at selective colleges and universities? As it turns out, most of them do not believe in legacy, athletic, or affirmative action admissions policies.
Approximately three out of five do not think it should be easier for students to get into college if they are descended from alumni at that institution, with only 16 percent saying it should be easier for legacy applicants to get in if they are members of an underrepresented group. Over half (57 percent) do not think it should be easier for recruited varsity student-athletes to gain admittance, with only 22 percent saying that it should be easier for those athletes who are from underrepresented groups or play high-profile sports. And nearly three-quarters (74 percent) do not think race should be considered in admissions. Though the question did not specify whether race and ethnicity would impact an admissions decision positively or negatively.
Error: Data visualization bundle URL missing.
Error: Data visualization bundle URL missing.
Error: Data visualization bundle URL missing.
Findings by Party ID
Regardless of party identification, all Americans believe that legacy status, athletic recruitment, and race/ethnicity should not be given special treatment in the college admissions process. Approximately 62 percent of Democrats and 69 percent of Republicans think it should not be easier for legacy candidates to gain admission. Over half of Democrats (54 percent) and three out of five Republicans (61 percent) think it should not be easier for recruited athletes to gain admission.
Error: Data visualization bundle URL missing.
Error: Data visualization bundle URL missing.
Although neither Republicans nor Democrats think race should be considered in admissions, Republicans feel more strongly in their beliefs than Democrats. Nearly nine out of 10 of them (89 percent) think race should not factor into admissions decisions, compared with 61 percent of Democrats.
Error: Data visualization bundle URL missing.
Other Findings
By Race
Interesting patterns begin to emerge when it comes to the beliefs of different racial and ethnic groups about admissions preferences at elite universities. A majority of white Americans (73 percent), for example, do not believe it should be easier for legacy candidates to gain admission. And around half of Asian Americans (59 percent) and those who are two or more races (53 percent) also do not think legacy status should be considered in the admissions process. A quarter of Black Americans do believe that it should be easier for legacy admits who come from underrepresented groups (26 percent) and another quarter believe it should be easier for legacy admits overall (26 percent), meaning approximately 52 percent believe legacy status should be a consideration in some way. Similarly, a quarter of Latinx Americans believe that it should be easier for legacy admits from underrepresented groups, and nearly a third (30 percent) believe it should be easier overall, meaning 55 percent believe legacy status should be considered.
Error: Data visualization bundle URL missing.
White Americans do not believe any admissions preference should be given for recruited varsity student athletes (65 percent). Meanwhile, just over half of Black Americans (53 percent), Latinx Americans (53 percent), and Asian Americans (51 percent) believe it should be easier for recruited athletes to gain admission either just generally or because they are from an underrepresented group or play a high-profile sport.
Error: Data visualization bundle URL missing.
Like other admissions preferences, white Americans (79 percent) are also soundly against considering race and ethnicity in the admissions process. But Americans who identify as Black (61 percent), Latinx (71 percent), those who are two or more races (75 percent), and Asian (though at much less intensity at 59 percent) all believe that race should not be a factor.
Error: Data visualization bundle URL missing.
Americans Value Different Educational Pathways After High School
Americans think positively of different pathways for education after high school. Whether it is an apprenticeship, technical degree, or bachelor's degree program, up to 90 percent of Americans feel comfortable recommending any of these programs to their children or close family members. And for an associate degree, 84 percent say so.
Error: Data visualization bundle URL missing.
Apprenticeship—a workforce training model that combines in-classroom learning and on-the-job training—is particularly favored by Americans. Most apprenticeships provide training that is equivalent to post-secondary education; however, not all of them currently lead to a higher education degree, such as an associate or bachelor's degree. Support for apprenticeship does not change when it is mentioned on its own, or when the possibility of earning an associate or bachelor's degree is added. In particular, 92 percent say that they feel comfortable recommending apprenticeship to their children or close family members: 94 percent say so when the phrase “if it also leads to an associate or bachelor’s degree” is added. When asked if apprenticeships and technical training programs provide students with the knowledge and skills necessary for a good standard of living, 94 percent agree.
Error: Data visualization bundle URL missing.
Findings by Party ID
Support is similarly high among Democrats and Republicans for all educational pathways after high school. Both groups would recommend that their children or close family members enroll in an apprenticeship program (91 percent of Democrats and 94 percent of Republicans); a technical degree/certificate (91 and 91 percent, respectively); an associate degree program (85 and 84 percent, respectively); and a bachelor's degree program (96 and 92 percent, respectively).
Error: Data visualization bundle URL missing.
Error: Data visualization bundle URL missing.
Americans Believe Public Colleges and Universities Are Worth the Cost
Cynicism about higher education and its cost aside, support remains strong for America’s public colleges and universities, especially for community colleges. Overall, 85 percent of Americans think that public community colleges are worth the cost, a similar finding to previous years, and 78 percent are comfortable contributing their tax dollars to them. Over half (62 percent) believe community colleges run efficiently and spend money wisely. Seventy-seven percent of Americans agree that community colleges are for people like them, and 86 percent think these institutions contribute to a strong American workforce.
Error: Data visualization bundle URL missing.
Support for America’s public four-year colleges and universities is also high, but less so than for community colleges. Around two-thirds of Americans think public four-year colleges and universities are worth the cost (68 percent) and are comfortable contributing their tax dollars to these institutions (67 percent). Americans think public four-year institutions are for people like them (74 percent), and agree that these institutions contribute to a strong American workforce (82 percent). But only 47 percent believe public four-year colleges spend their money wisely and 55 percent agree that they run efficiently.
Error: Data visualization bundle URL missing.
About 57 percent of Americans think that private, non-profit four-year colleges and universities are worth the cost. However, fewer than half (49 percent) are comfortable contributing their tax dollars to them. Only 48 percent agree that private non-profit institutions spend their money wisely, but 55 percent agree that they run efficiently. Some 58 percent believe that these institutions are for people like them. Americans feel strongly (80 percent) that private non-profit institutions contribute to a strong American workforce.
Error: Data visualization bundle URL missing.
For-profit four-year colleges and universities received the least support from Americans. Fewer than half of Americans (46 percent) think for-profit four-year institutions are worth the cost, and only 35 percent are comfortable contributing their tax dollars to them. Similarly, 39 percent think these institutions spend their money wisely. Only 47 percent think they run efficiently and that for-profit four-year colleges and universities are for people like them, but 64 percent agree that they contribute to a strong American workforce.
Error: Data visualization bundle URL missing.
Findings by Party ID
The belief that certain institution types are worth the cost varies with party identification.
Community Colleges
Democrats (87 percent) and Republicans (85 percent) believe that community college is worth the cost.
Error: Data visualization bundle URL missing.
Where Republicans felt similar to Democrats about the cost of community colleges, they differed in the intensity of their opinion on whether taxpayer dollars should support community colleges. Approximately 87 percent of Democrats supported giving taxpayer dollars to community colleges, compared to 69 percent of Republicans. Similarly, the percent of Democrats and Republicans that believe community colleges spend their money wisely and run efficiently varies: 66 percent of Democrats and 59 percent of Republicans agree that community colleges use their money wisely, and 66 percent of Democrats and 57 percent of Republicans agree that these institutions run efficiently.
Error: Data visualization bundle URL missing.
Error: Data visualization bundle URL missing.
Error: Data visualization bundle URL missing.
Most Americans (77 percent of Democrats, 68 percent of Republicans) think community colleges are for people like them and that these schools contribute to a strong workforce (88 and 86 percent, respectively).
Error: Data visualization bundle URL missing.
Error: Data visualization bundle URL missing.
Public Four-Year Colleges and Universities
As with community colleges, Democrats think that public four-year colleges and universities are worth the cost at greater numbers, at a rate of about two out of three Democrats (68 percent). A solid majority of Democrats are comfortable contributing their tax dollars to public four-year colleges and universities (79 percent). Most Republicans also think that public four-year institutions are worth the cost, but less so than Democrats (58 percent); 63 percent of them are comfortable contributing their tax dollars to these institutions.
Error: Data visualization bundle URL missing.
Error: Data visualization bundle URL missing.
Thoughts on whether these institutions use their money wisely and run efficiently vary by party; our survey showed that 58 percent of Democrats think public four-year institutions use their money wisely, but only 35 percent of Republicans do. Similarly, 64 percent of Democrats think these institutions run efficiently, while only 43 percent of Republicans do.
Error: Data visualization bundle URL missing.
Error: Data visualization bundle URL missing.
When it comes to feeling that a public four-year institution is for people like them, 82 percent of Democrats feel this way, and Republicans do so less strongly, at 68 percent. Both parties think these institutions contribute to a strong American workforce, but at varying intensities (89 percent of Democrats, 78 percent of Republicans).
Error: Data visualization bundle URL missing.
Error: Data visualization bundle URL missing.
Private Non-Profit Colleges and Universities
Democrats think private non-profit colleges and universities are worth the cost (62 percent), but less so than community colleges or public four-year institutions. Fifty-seven percent are comfortable contributing their tax dollars to them. Interestingly, support for private non-profit institutions is lowest among Republicans. Only a little under half of Republicans (49 percent) think private non-profit four-year colleges and universities are worth the cost. Most Republicans are not comfortable contributing their tax dollars to these institutions (61 percent).
Error: Data visualization bundle URL missing.
Error: Data visualization bundle URL missing.
Democrats and Republicans vary on how they think private non-profit institutions spend their money. These institutions spend their money wisely for 52 percent of Democrats and 42 percent of Republicans: 58 percent of Democrats and 49 percent of Republicans think they run efficiently.
Error: Data visualization bundle URL missing.
Error: Data visualization bundle URL missing.
There is less variation on whether Americans think private non-profit institutions are for them (60 percent of Democrats, 55 percent of Republicans) and whether they contribute to a strong American workforce (81 percent of Democrats, 78 percent of Republicans).
Error: Data visualization bundle URL missing.
Error: Data visualization bundle URL missing.
For-Profit Four-Year Colleges and Universities
The slight majority of Democrats (52 percent) do not think that for-profit four-year institutions are worth the cost, and only 35 percent are comfortable with their taxpayer dollars going to support these institutions.
Republicans also do not feel that for-profit colleges and universities are worth the cost (54 percent). They are also the most averse to contributing their taxes to for-profit institutions. Only 26 percent of Republicans are comfortable with tax dollars going to for-profit institutions.
Error: Data visualization bundle URL missing.
Error: Data visualization bundle URL missing.
Fewer Americans think for-profit institutions spend their money wisely. Only 40 percent of Democrats and 34 percent of Republicans think so, and only 48 percent of Democrats and 43 percent of Republicans think for-profit institutions run efficiently. While fewer than half of Democrats (48 percent) and Republicans (46 percent) think for-profit four-year institutions are for them, 63 percent of Democrats and 64 percent of Republicans think these institutions contribute to a strong American workforce.
Error: Data visualization bundle URL missing.
Error: Data visualization bundle URL missing.
Error: Data visualization bundle URL missing.
Error: Data visualization bundle URL missing.
Other Findings
By Educational Attainment
Public Community Colleges
Support for the country’s public community colleges is strong across all education levels among Americans, but there are some surprising variations. Most Americans with graduate degrees (94 percent) think that community colleges are worth the cost, more than any other group. Unsurprisingly, nearly nine in 10 Americans with an associate degree feel this way (88 percent), along with 85 percent of those with some college or a bachelor's degree and 82 percent of Americans with a high school diploma or less.
Error: Data visualization bundle URL missing.
Similar patterns emerge when it comes to supporting community colleges with tax dollars. Americans with graduate degrees (89 percent) and associate degrees (80 percent) were most comfortable contributing their tax dollars to public community colleges. Americans with some college or a high school diploma or less are comfortable with this (77 percent), and Americans with bachelor's degrees, while still overwhelmingly supportive, do so slightly less than other groups (73 percent).
Error: Data visualization bundle URL missing.
Public Four-Year Colleges and Universities
While the majority of Americans across education levels believe public four-year institutions are worth the cost, there is much more variation in opinion. Unsurprisingly, 75 percent of Americans with bachelor's degrees and 72 percent of those with graduate degrees think that these institutions are worth it. Americans with a high school diploma or less are the next largest group to think that public four-year institutions are worth it, at 69 percent. Two-thirds of Americans with some college agree, while just over half (51 percent) of Americans with associate degrees agree.
Error: Data visualization bundle URL missing.
Comfort with contributing tax dollars to these institutions also varies by education level, and again, is higher among Americans with more advanced degrees. Americans with bachelor's degrees (69 percent) and graduate degrees (78 percent) feel comfortable contributing their tax dollars to public four-year colleges and universities in greater numbers. About two-thirds of Americans with a high school diploma or less (65 percent) and Americans with some college (67 percent) are comfortable supporting these institutions with their tax dollars. Americans with associate degrees feel comfortable with this idea in lesser numbers, but most still supported the idea (61 percent).
Error: Data visualization bundle URL missing.
Private Non-Profit Four-Year Colleges and Universities
Americans think that private, non-profit four-year colleges and universities are less worth the cost than public institutions, and their opinions vary by education level. Surprisingly, Americans with a high school diploma or less think that private four-year institutions are worth it more than other groups—nearly two out of three (64 percent) think so. Americans with some college, a bachelor's degree, or a graduate degree feel similarly about whether these institutions are worth it (54, 53, and 55 percent, respectively). Most Americans with an associate degree do not think that private non-profit colleges and universities are worth it.
Error: Data visualization bundle URL missing.
It is less frequent that Americans feel comfortable contributing their tax dollars to private, non-profit four-year colleges and universities. The only group in which the majority feel comfortable with this idea is Americans with a high school diploma or less (54 percent). Those with some college but no degree and those with a graduate degree are split on whether they feel comfortable with this. However, the majority of people with an associate (53 percent) or bachelor's degree (62 percent) do not feel comfortable contributing their tax dollars to these institutions.
Error: Data visualization bundle URL missing.
For-Profit Four-Year Colleges and Universities
Fewer Americans across educational attainment believe that for-profit institutions are worth the cost. Americans with a high school diploma or less were the only group where a majority, six in 10, feel these institutions are worth the cost. Across all other attainment groups, however, the majority of Americans do not think these institutions are worth the cost: 54 percent of those with some college but no degree do not think these institutions are worth the cost, as do six in 10 Americans with an associate degree, 63 percent of Americans with bachelor's degrees, and 67 percent with graduate degrees.
Error: Data visualization bundle URL missing.
The majority of Americans across educational statuses do not feel comfortable contributing their tax dollars to for-profit four-year institutions. Americans with a high school diploma or less oppose contributing their taxes to these institutions in lesser numbers, but are nearly split on the issue (51 percent disagree). Two of every three Americans with some college but no degree (67 percent) or an associate degree (63 percent) do not feel comfortable with this idea, as do three of every four Americans with a bachelor's degree. Americans with graduate degrees oppose contributing tax dollars to for-profit four-year colleges and universities the most (81 percent).
Error: Data visualization bundle URL missing.
Findings by Race
For-Profit Four-Year Colleges and Universities
For-profit institutions were found to be the least worth the cost across racial groups, but interesting patterns emerged among people of color. A slight majority of white Americans (56 percent) and Americans who are two or more races (56 percent) do not agree that for-profit four-year colleges and universities are worth the cost. Asian Americans felt so at a rate of 57 percent. Interestingly, 59 percent of Black Americans and 53 percent of Latinx Americans believe that for-profit institutions are worth the cost.
Error: Data visualization bundle URL missing.
Similar patterns emerged for groups’ comfort levels with having their tax dollars support for-profit institutions. The majority of white (71 percent), Asian (60 percent), and Americans who are two or more races (59 percent) are not comfortable with their tax dollars supporting for-profit institutions. Fifty-five percent of Latinx Americans are uncomfortable with contributing tax-dollars to these institutions. However, 59 percent of all Black Americans are comfortable with their tax dollars supporting for-profit four-year colleges and universities.
Error: Data visualization bundle URL missing.
When it comes to how private, for-profit four-year colleges and universities run financially, Black Americans and Latinx Americans have the most positive view. When asked how much they agreed that these institutions used their money wisely, 56 percent of Black Americans and 47 percent of Latinx Americans say yes. This is more than white Americans, Asian Americans, and Americans of two or more races (34, 36, and 40 percent, respectively). Around half of Black Americans (57 percent) and Latinx Americans (54 percent) agree that private, for-profit four-year institutions run efficiently, slightly more than white Americans (42 percent) and Asian Americans (48 percent).
Error: Data visualization bundle URL missing.
Error: Data visualization bundle URL missing.
The majority of Americans across race think for-profit institutions contribute to a strong American workforce: 63 percent of white Americans, 70 percent of Black Americans, 68 percent of Latinx Americans, 61 percent of Asian Americans, and 62 percent of Americans of two or more races agree.
However, there is discrepancy across these groups as to whether for-profit four-year institutions are for people like them. Only 41 percent of white Americans and 48 percent of Asian Americans agree, but 62 percent of Black Americans, 60 percent of Latinx Americans, and 54 percent of Americans of two or more races think these institutions are for people like them.
Error: Data visualization bundle URL missing.
Error: Data visualization bundle URL missing.
Americans Feel Positively about Their Local Colleges and Universities
Perhaps reflecting the fact that Americans feel more positively about public two- and four-year colleges and universities, like last year, a strong majority (79 percent) of Americans have a positive view of the colleges and universities located near them.
Error: Data visualization bundle URL missing.
When widening the scope and asking about colleges and universities across the United States, a majority maintain their positive view (72 percent).
Error: Data visualization bundle URL missing.
In general, a majority of Americans (69 percent) believe colleges and universities have a positive effect on the way things are going in the country.
Error: Data visualization bundle URL missing.
Findings by Party ID
More Democrats (86 percent) than Republicans (74 percent) and independents (75 percent) have a positive view of their local colleges and universities, though regardless of political affiliation everyone feels generally positive about their local higher education options.
Error: Data visualization bundle URL missing.
When asked how they feel about colleges and universities across the U.S., Democrats have a stronger positive opinion (81 percent) than Republicans (63 percent) and independents (68 percent).
Error: Data visualization bundle URL missing.
Democrats also believe in greater numbers that colleges and universities have a positive effect on the way things are going in this country (79 percent) compared to Republicans (56 percent) and independents (69 percent). Though notably, everyone agrees that colleges and universities have a positive effect on the way things are going. This is in contradiction to findings from the Pew Research Center in 2019 that said 59 percent of Republicans believed that colleges and universities have a negative impact on the way things are going in this country compared to only 18 percent of Democrats who believed so.7
Error: Data visualization bundle URL missing.
Other Findings
By Region
People in the South have more positive views of their local colleges and universities (85 percent) compared to the Northeast (73 percent), Midwest (77 percent), and West (78 percent).
Error: Data visualization bundle URL missing.
However, when asked about colleges and universities across the United States, people from the South have a similar positive view (75 percent) compared with the Northeast (64 percent), Midwest (68 percent), and the West (76 percent).
Error: Data visualization bundle URL missing.
Similarly, regardless of region, Americans believe colleges and universities have a positive effect on the way things are going in this country, with those from the Midwest (63 percent) feeling slightly less favorable than those from the Northeast (70 percent), South (71 percent), and West (71 percent).
Error: Data visualization bundle URL missing.
Voters Slightly Support Free College in the 2020 Election
Free college or debt-free college has become one plank in a major platform for many of the Democratic presidential primary candidates, such as senators Warren and Sanders. When asked how important a candidate’s stance on free college options for students will be for their vote, 67 percent of voters said important, with 31 percent indicating it will be very important.
Error: Data visualization bundle URL missing.
A slight majority of Americans (56 percent) support a candidate who favors free college tuition, with 31 percent actively opposing and 12 percent who said it would not impact their vote.
Error: Data visualization bundle URL missing.
Findings by Party ID
Four out of five Democratic voters say free college options will be important for their vote in the 2020 presidential election. This is no surprise, given that access to low-cost higher education has become a signature issue for the party. Approximately 46 percent of Republican voters say a candidate’s stance on free college will be important for their vote. A majority (65 percent) of independent voters say it will be important.
Error: Data visualization bundle URL missing.
Approximately three-quarters of Democrats and over half (56 percent) of independents support candidates who favor free college, compared with over half of Republicans who oppose it (58 percent, 40 percent strongly so).
Error: Data visualization bundle URL missing.
Other Findings
By Educational Attainment
Voters with a high school education or less (70 percent) or some college but no degree (70 percent) say at greater numbers that a presidential candidate’s stance of free college will be important for their vote than those who hold associate degrees (62 percent), bachelor's degrees (60 percent), or graduate degrees (67 percent).
Error: Data visualization bundle URL missing.
Voters with a high school education or less and those with some college but no degree both say they will support candidates who favor free tuition policies (62 and 55 percent, respectively). Those with associate degrees or bachelor's degrees feel more mixed, with slightly less than half supporting candidates who favor free college (49 and 46 percent, respectively). Those with graduate degrees, however, are more likely to vote for a candidate who supports free college (61 percent).
Error: Data visualization bundle URL missing.
Race and Ethnicity
Black voters say in greater numbers that a presidential candidate’s stance on free college will be important to secure their vote (83 percent) compared to Latinx Americans (75 percent), Asian Americans (74 percent), those who are two or more races (66 percent), and white Americans (61 percent).
Error: Data visualization bundle URL missing.
Black, Latinx, Asian, and voters who are two or more races all support candidates who favor free college proposals (77, 66, 64, and 64 percent, respectively). White Americans, however, are more mixed, with 48 percent saying they would support a candidate who has free college in his or her platform.
Error: Data visualization bundle URL missing.
Citations
- For the purposes of this analysis, the age breakdown by generation is as follows: Generation Z includes 18- to 24-year-olds, Millennials include 25- to 39-year-olds, Generation X includes 40- to 54-year-olds, Baby Boomers include 55- to 73-year-olds, and the Silent Generation includes those over 74.
- Data analysis by New America of U.S. Department of Education, Federal Student Aid (website), “Federal Student Loan Portfolio: Federal Student Loan Portfolio by Age,” source
- This difference could be a result of differences (either in demographics or in conducting the survey) during the switchover to predominantly online survey implementation.
- Urban Institute, State and Local Expenditures (Washington, DC: The Urban Institute, 2019).
- Due to the margin of error, it is difficult to determine whether Asian Americans are more aligned in their beliefs with white respondents or respondents of other races.
- Dana Goldstein, “Reporting on a Very Bad Year for the College Admissions Industry,” New York Times, August 2, 2019.
- Kim Parker, The Growing Partisan Divide in Views of Higher Education (Washington, DC: Pew Research Center, August 2019).
Perceptions versus Reality
Student Outcomes
Error: Data visualization bundle URL missing.
Error: Data visualization bundle URL missing.
Perception
A majority of Americans (55 percent) think that one-half or fewer students who begin an associate degree program can finish within three years. More specifically, 41 percent think that the proportion of those who finish in three years lies between one-quarter and one-half. Still, 35 percent of Americans estimate that the proportion is between one-half and three-quarters.
When it comes to the graduation rate for bachelor's degree programs, half of Americans think that only one-half or fewer students who begin a program can finish within four years. More than a third (36 percent) think that the graduation rate lies between one-quarter and one-half, while another third (37 percent) think that it is one-half and three-quarters.
Reality
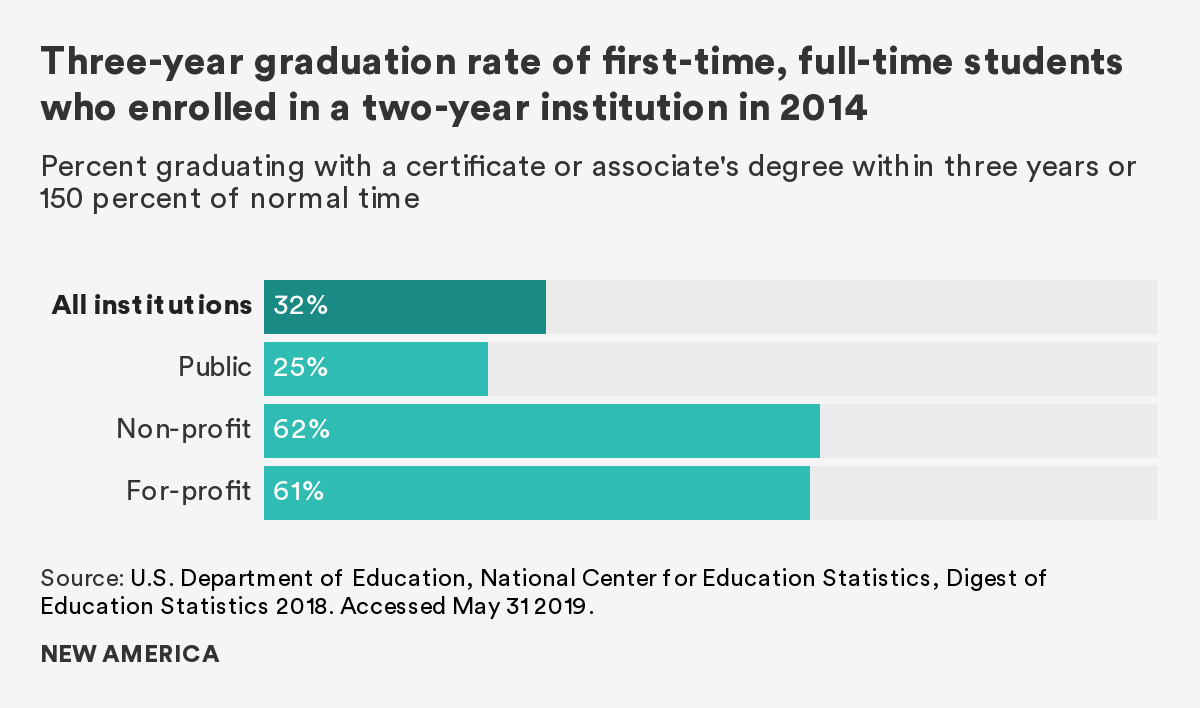
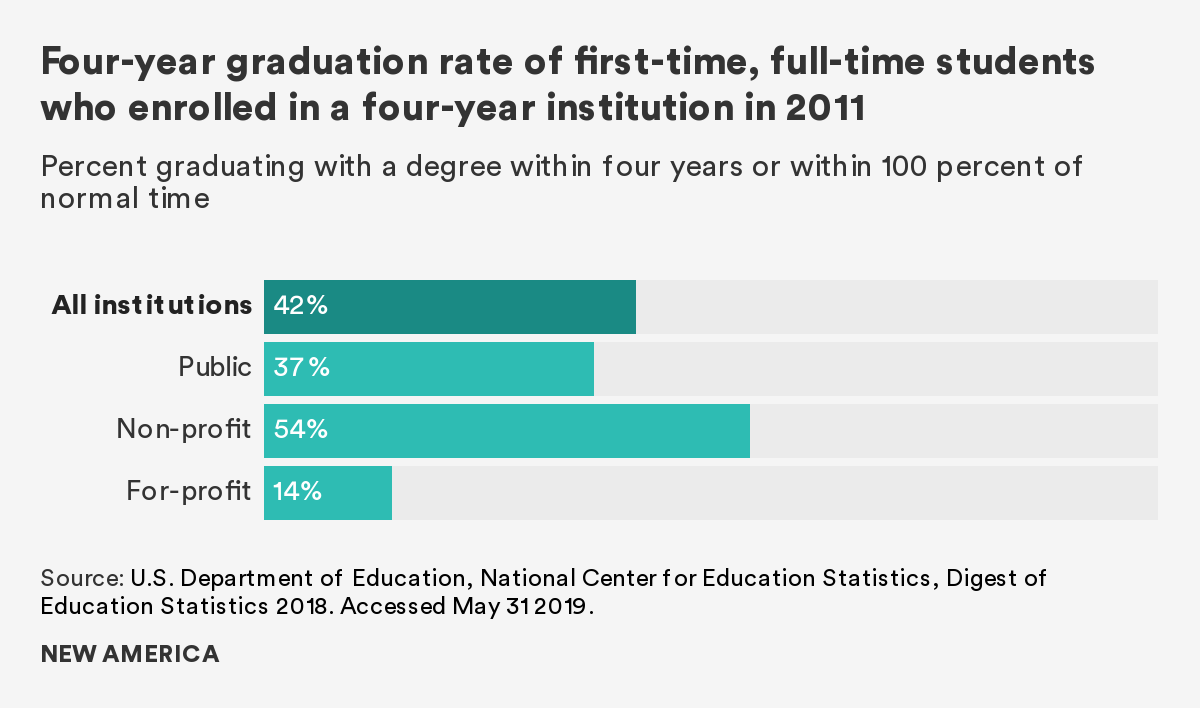
Unfortunately, it is difficult to definitively say what the graduation rate is. We do know that 32 percent of first-time, full-time students graduate with an associate degree or certificate within three years and 42 percent of first-time, full-time students graduate with a bachelor's degree within four years.1
It is difficult to form a clear picture of national graduation rates due to the current ban on collecting student level data and an antiquated federal definition of graduation rate. The Department of Education’s official graduation rate, for example, only reflects the share of first-time, full-time students who graduate within 150 percent of the expected time to completion, which means part-time and transfer students are excluded from the number of students who graduate.2 In other words, this measurement does not capture a large share of today’s students: Nearly 59 percent of students transfer at least once and 40 percent attend part time.3 The College Transparency Act, a recently reintroduced bipartisan, bicameral piece of legislation, would create a secure, privacy-protected data network to answer this college completion question, among many other unanswered questions about students’ outcomes in higher education.4
Based on the available data, we know that graduation rates at both four-year and two-year schools vary significantly across institutions and institution types. Four-year graduation rates can range from an average 54 percent at a non-profit four-year institution to 15 percent at a for-profit institution—a sign that academic quality and student supports are not the same at all schools.5 College completion critically affects economic outcomes: Adults with a degree have higher wages and lower rates of unemployment, and students who borrow but do not graduate have an increased risk of student loan default.6 Given how important graduation rates are for post-college success, students and policymakers need access to accurate graduation rate data.
Today’s Students
Perception
Error: Data visualization bundle URL missing.
For 62 percent of respondents, more individuals enroll in an associate or certificate program than in a bachelor's degree program.
Reality
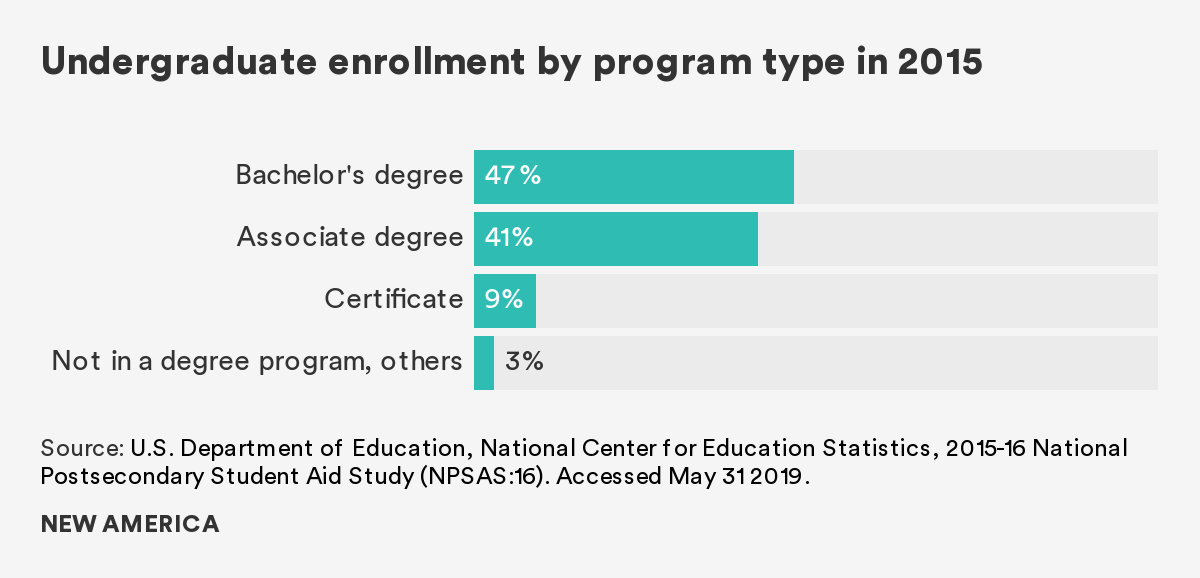
According to data from the 2016 National Postsecondary Student Aid Survey, 47 percent of undergraduates were enrolled in a bachelor's degree program, 41 percent in an associate degree program and 9 percent in a certificate program in 2015–2016.7
Different credentials vary not only in program length, but also in the students who choose them, and the type of institutions they attend. The majority of students in bachelor's degree programs are dependent (i.e., they are less than 24 years old, not married, and not caring for dependents) and attend school full time. Nearly 30 percent of them live in a residence hall on campus, and most do not have a full-time job. On the other hand, students in associate degree and certificate programs are more likely to be independent, attend part time while working full time, and live off campus.8
Additionally, 94 percent of students in a bachelor's degree program attend either a public four-year or a private non-profit institution, and 80 percent of students in an associate degree program attend a public two-year institution, more commonly known as community or technical college. For students in certificate programs, while 45 percent of them study at community colleges, roughly the same number choose for-profit institutions, which are known to have poorer graduation, employment, and student loan repayment outcomes.9
The data paint a diverse picture of the undergraduate population. Interventions to improve access and student success in higher education, therefore, should not treat this group as monolithic. Rather, they should be program-specific and student-focused, so that students are protected from enrolling in poor-performing programs with no or very little return on investment.
Perception
Error: Data visualization bundle URL missing.
More than nine in 10 (94 percent) Americans think that an undergraduate student is 29 or younger: Specifically, 65 percent of Americans think that the average age is between 19 and 23.
Reality
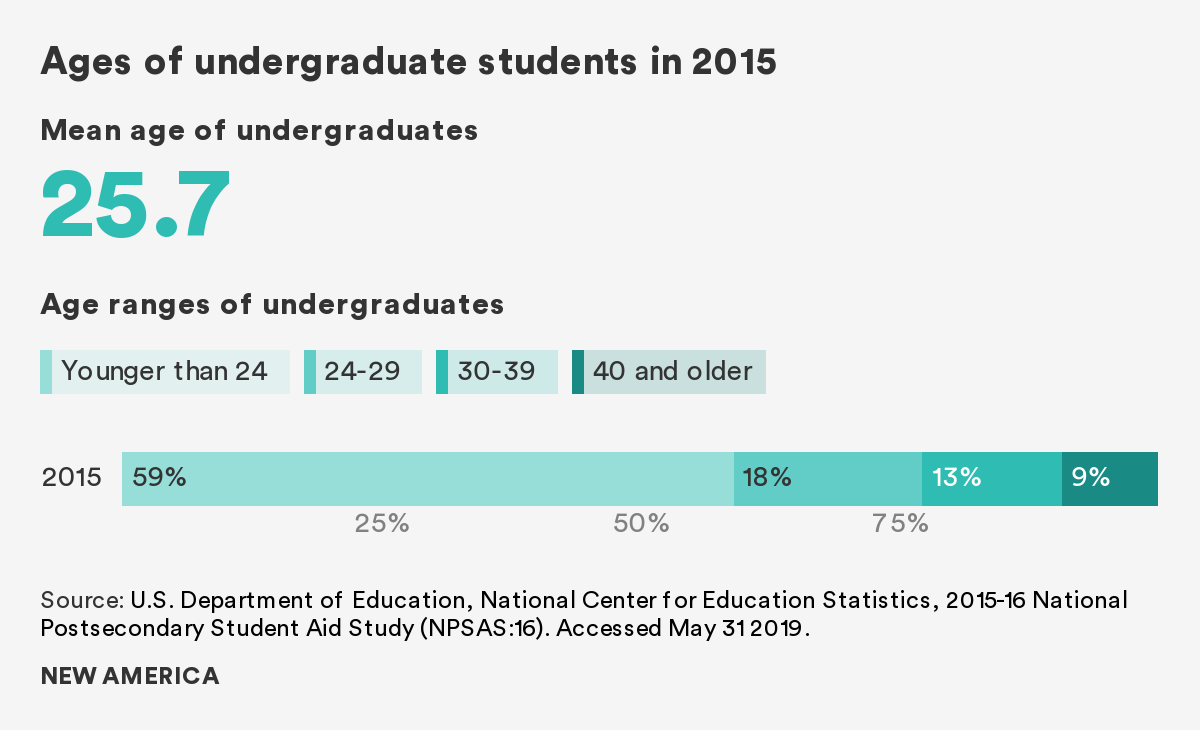
While most Americans picture a young student who enrolled in education directly after high school, the average undergraduate student is actually older than what they envision. As of 2015–2016, the average age of an undergraduate student was 26. A majority of undergraduates (59 percent) are under the age of 24. However, a significant proportion of undergraduates—41 percent—are 24 or older. In fact, nearly one in 10 undergrads is over 40. While America’s system of education after high school was built to cater to the needs of young adults, older students often have very different lives. They are more likely to work, attend part time, commute to school, and care for dependent children.10 The demographics of today’s undergraduates require colleges and universities to rethink how to target academic and financial support and how to meet the needs of students with complex lives and schedules outside the classroom.
Perception
Error: Data visualization bundle URL missing.
Many Americans (42 percent) think that those who just completed an apprenticeship would earn, on average, somewhere between $25,000 and $45,000 a year. Approximately one-third (34 percent) think that the average annual salary for these individuals is somewhere between $45,000 and $65,000.
Reality
According to the U.S. Department of Labor, people who complete an apprenticeship on average earn $60,000 annually.11
Learning from experienced mentors on the job, getting paid while receiving job training, and receiving technical instruction in a classroom setting—this is what a typical apprenticeship offers its participants. Apprentices (participants of apprenticeship programs) often graduate with jobs in a related field, credentials that can help them move up the career ladder, and little to no student debt.
Efforts to expand apprenticeship have received bipartisan support since the Obama administration.12 As of 2018, there are more than 580,000 apprentices in more than 20,000 registered apprenticeship programs across the nation.13 Even though this is still a tiny number compared to the more than 20 million students in higher education, the number of new apprentices has generally followed an upward trend since 2010.
Apprenticeship is not only a workforce strategy; it is also an educational strategy. Apprenticeship can be a viable pathway to postsecondary degrees and credentials. The job-related classroom instruction, an important component of apprenticeship, usually takes place at a nearby community college, which can later lead to a certificate or an associate degree that students can “stack” on the pathway to further education.
Higher education and apprenticeship also serve overlapping populations. The average age of apprentices in the United States is 28, while the average age of today’s undergraduate is 26, which means apprentices are only slightly older than the average undergraduate student.14 With potential expansion of youth apprenticeship programs that target high school students, the age gap could narrow in the future.15
Even though apprenticeship and traditional higher education have many similarities, they are largely operated as two separate systems, with different traditions and cultures. As efforts to expand apprenticeship gain traction, it is worthwhile to direct these efforts in a way that would connect apprenticeship and degree programs at colleges and universities to improve access to both for today’s students.16
Perception
Error: Data visualization bundle URL missing.
Error: Data visualization bundle URL missing.
Americans are a little bit mixed about how much individuals with only an associate degree will earn. While half of them (49 percent) think that the median annual salary for such individuals ranges between $25,000 and $45,000, a third (34 percent) estimate that the number is higher, from $45,000 to $65,000.
Meanwhile, about 80 percent of Americans think that the median annual salary for those with only a bachelor's degree is $45,000 or higher: 47 percent think that the number is within the range of $45,000 and $65,000 and 32 percent think that it is higher than $65,000.
Reality
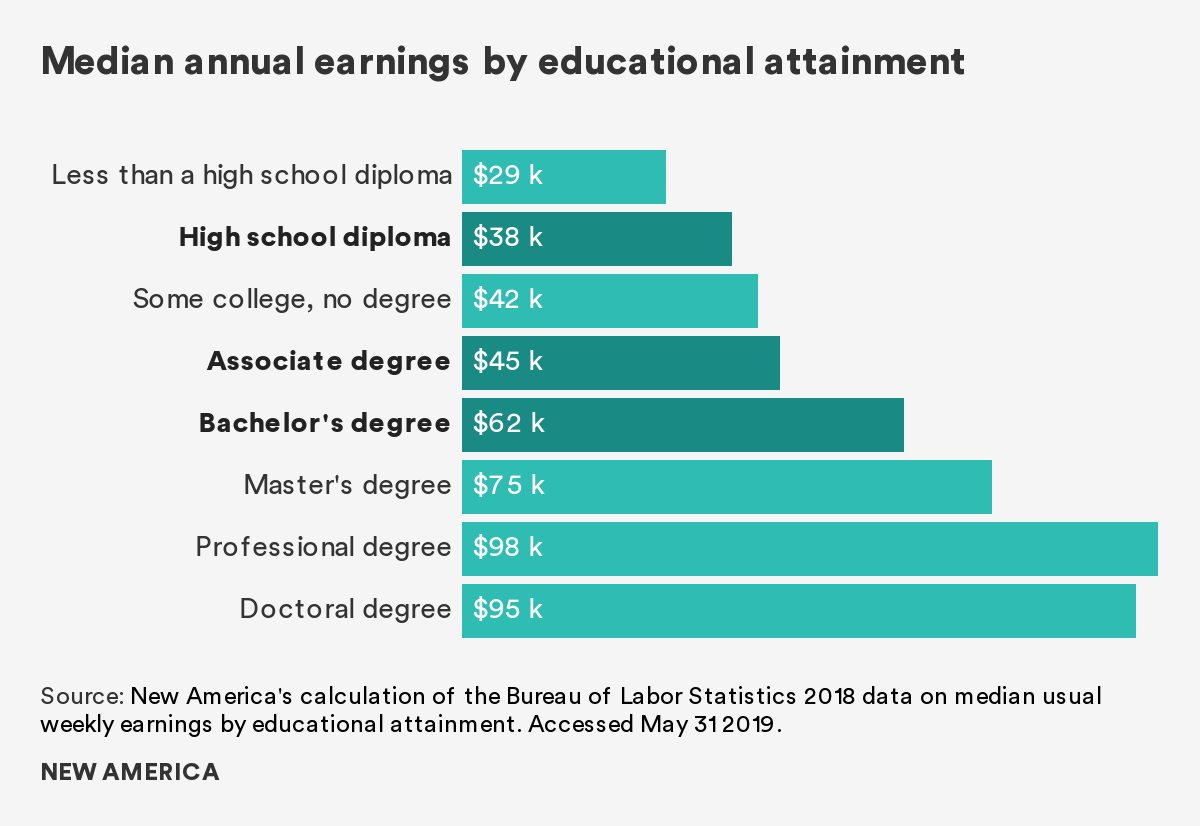
Bachelor's degrees and higher continue to offer the largest payout. According to the Bureau of Labor Statistics, in 2018 the median annual earnings of someone with an associate degree was approximately $45,000.17 However, those who had earned a bachelor's degree (with no postgraduate education) earned approximately $62,000. And someone who received a high school diploma or equivalency, and did not pursue further college education, earned about $38,000.
The payoff from a degree is clear, and, for the most part, people are better off going to college and graduating than not going at all. When exploring wage data further, however, there is a noticeably large racial and gender wage gap that persists despite education level.18 For women, Black individuals, and Latinx individuals, it is deeply important to earn a degree, but a bachelor's degree or more does not financially pay off as well as it does for men, whites, and Asian Americans. The magnitude of the wage gap between whites and Asian Americans and their Black and Latinx counterparts grows larger for those who have a bachelor’s degree or above.
The reasons behind the racial and gender wealth gaps are complex, but the disparity exists, in part, because of labor market discrimination and institutionalized racism.19 Another part of the equation, however, is that not all degrees are created equal. Data have shown that labor-market outcomes vary widely based on the specific programs and institutions students attend, to an extent due to the quality of the college or program. Unfortunately, many of those programmatic and institutional disparities are masked by national data. Better data on the outcomes of program and college alumni, particularly in post-college earnings, could offer students a clearer, more accurate look at college outcomes before they decide whether and where to enroll in school and what to major in. And it would provide policymakers with the information they need about how institutions are performing with taxpayer investment.
Student Debt
Perception
Error: Data visualization bundle URL missing.
Error: Data visualization bundle URL missing.
The perception that student loans make up the largest source of consumer debt dominates, no matter how we asked the question.
When asked what they think is the largest source of consumer debt, a majority of Americans (47 percent) think that is student loan debt, followed by credit card debt (27 percent), mortgages/home equity loans (24 percent), and auto loans (2 percent).
When the question was asked in the opposite direction—what the smallest source of consumer debt is—61 percent say auto loans, 18 percent say credit cards, 13 percent say mortgages/home equity loans, and only 6 percent say student loans.
Reality
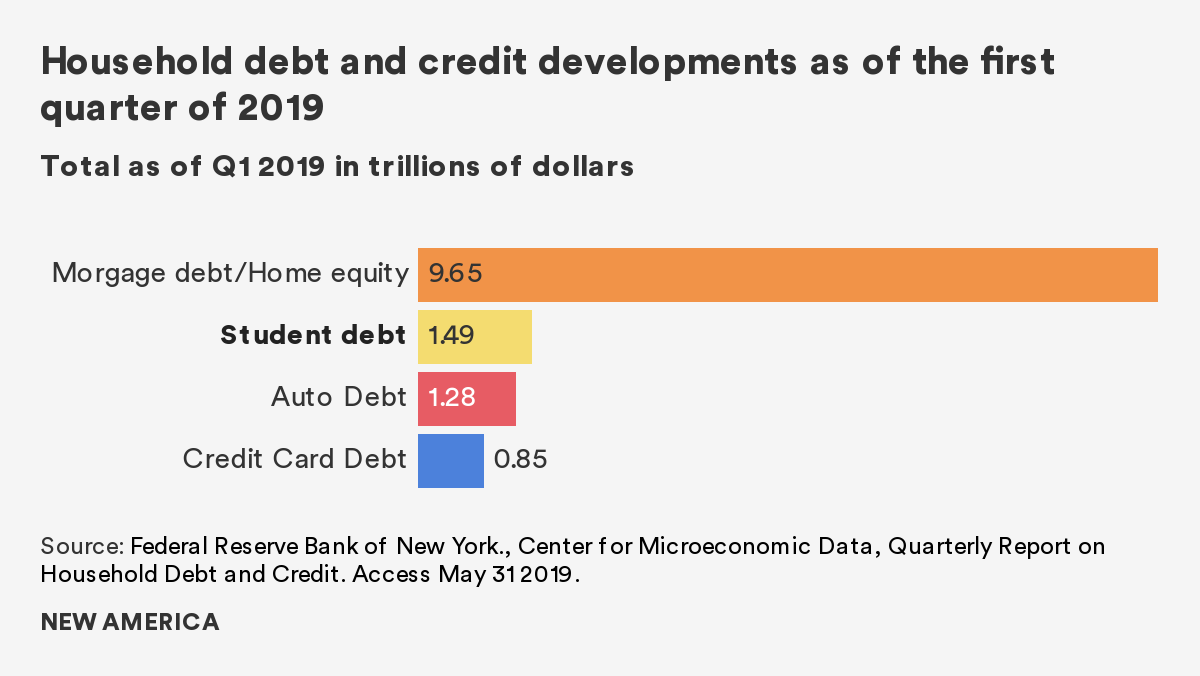
In fact, the largest source of consumer debt, by far, are mortgages/home equity loans, which account for approximately $9.7 trillion, distantly followed by student loans ($1.5 trillion), auto loans ($1.3 trillion), and credit cards ($848 billion).20
The growth of student loan debt over the past decade has been ringing alarm bells, spurring multiple headlines about a student debt crisis, and causing 2020 Democratic presidential hopefuls, such as Sen. Elizabeth Warren (D-Mass.), to propose canceling existing student loan debt and refinancing loans at lower rates. Unfortunately, calls for debt cancellation and loan refinancing have been found to be regressive, since those who borrow for their education tend to be middle- and upper-income. Research from Adam Looney at the Brookings Institute, for example, showed that Senator Warren’s debt cancellation plan would result in 65 percent of the benefit accruing to Americans in the top two income quintiles.21 Our own research has shown that student loan refinancing would only save households, on average, $8 on monthly payments, and those in the highest income quintile would receive the largest savings ($10/month) compared with those in the lowest quintile ($6/month).22 Given that many states cannot easily raise revenue and must balance their budgets, it is important to target the benefit to the neediest families.
In the aggregate, student loans are not a crisis, per se. Those who graduate tend to accrue the most debt, especially those who go on for graduate education, but they also tend to reap the economic rewards from these degrees and can pay their debt back. For those unable to afford their current monthly payment, there are several income-driven repayment options that allow borrowers of federal student loans to only pay based on a fraction of their discretionary incomes (usually 10 to 15 percent) and receive forgiveness after 20 to 25 years.
But a few demographics are experiencing a true student loan crisis: Black borrowers and those who borrow but do not complete their degree. Judith Scott-Clayton of Brookings has projected that up to 70 percent of Black borrowers may default on their student loans.23 For those who borrow but do not complete a degree, the Federal Reserve found around 44 percent fell delinquent, compared to just 11 percent of bachelor's degree earners.24 Any approach to reforming student loans and repayment should target these borrowers, including improving higher education financing so they are less reliant on borrowing for education in the first place.
Perception
Error: Data visualization bundle URL missing.
Overall, Americans think that most undergraduate students in associate or bachelor's degree programs borrow, but they are mixed about the exact borrowing rate. A majority (56 percent) think that more than 50 percent borrow, with nearly 40 percent that say the borrowing rate is between 50 and 75 percent. At the same time, a significant number (43 percent) think that the borrowing rate is less than 50 percent, with more than 30 percent who say between 25 and 50 percent of undergraduate students borrow.
Reality
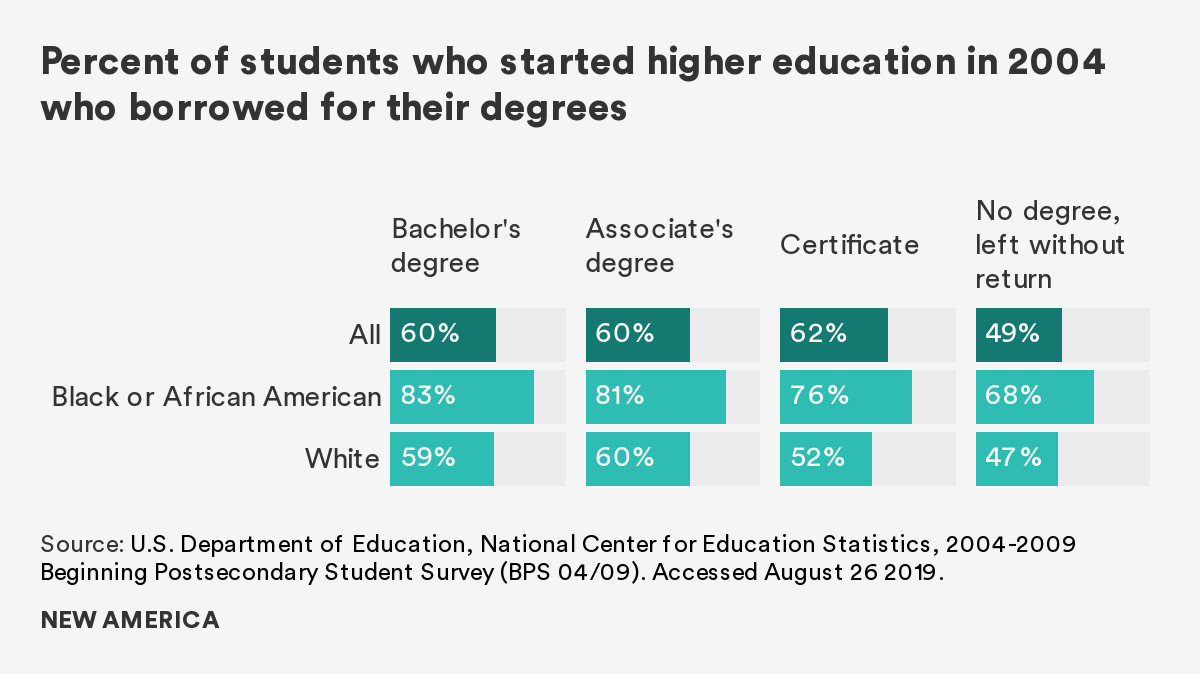
The number of undergraduate students financing their degrees with loans has grown since 1996 and only recently began to level off.25 A majority of students (60 percent) who started higher education in 2003-2004 borrowed for their associate or bachelor’s degrees.26 Additionally, 30 percent of those who started in 2003-2004 dropped out without a degree, and half of those who dropped out borrowed.27 For Black students who started in 2003-2004, approximately 80 percent borrowed for their associate and bachelor’s degrees, compared to around 60 percent of white students.28 An outcome that will likely perpetuate the wealth gap between white families and Black families.29
Perception
Error: Data visualization bundle URL missing.
A large share of Americans (44 percent) think that the average student loan debt of a recent graduate from a bachelor's degree program exceeds $40,000. Only 11 percent think that the number is $20,000 or less, 20 percent think that it is between $20,000 and $30,000, and 25 percent say between $30,000 and $40,000.
Reality
The average student debt at graduation for the class of 2017 at public and private non-profit institutions was $28,650, compared to $39,900 for graduates of for-profit institutions, considering both federal and private sources of debt.30
Although the Department of Education does not track student loan amounts by race, other research has found stark differences in the amount that students borrow by race. Studies have found, for example, that Black students, on average, graduate with higher levels of debt, even when they have similar family income levels as white students.31 This disparity grows dramatically after graduation: Four years after graduation, Black students, on average, owe $25,000 more than white students.32 Initiatives to help student loan borrowers must prioritize supporting borrowers of color, particularly Black students, who typically bear the greatest burden.33
Perception
Error: Data visualization bundle URL missing.
Many Americans (46 percent) think that more than 30 percent of student loans will end up in default. Only 23 percent think that the default rate is less than 20 percent, and 27 percent think that it is between 20 and 30 percent.
Reality
Student loans are classified as “in default” when a student fails to make a minimum payment for 270 days. Over one million students every year default on their loans:34 27 percent of borrowers who started higher education in 2004 defaulted on their loans 12 years later, and this rate is projected to increase to nearly 40 percent by 2023.35 These rates vary significantly across students and institutions: Black students who graduate with a bachelor's degree are five times more likely to default than white graduates, and nearly half of students who attend a for-profit institution defaulted within 12 years.36
When borrowers default, a multitude of financially devastating consequences can happen. Two of the most common consequences include wage garnishment and treasury offset, where the federal government applies the borrower’s tax return to the loan balance. Additionally, when a loan enters default, it drops the borrower’s credit score, resulting in difficulties obtaining other loans, getting a credit card, or being approved to rent a house or apartment. Although automatic payroll deductions should be carefully designed to avoid further harming distressed borrowers, automatically enrolling delinquent borrowers in an income-based repayment plan could greatly lower their payments and help protect students from the long-term harm of defaulting.37
Citations
- See: “Table 326.10. Graduation rate from first institution attended for first-time, full-time bachelor's degree- seeking students at 4-year postsecondary institutions, by race/ethnicity, time to completion, sex, control of institution, and acceptance rate: Selected cohort entry years, 1996 through 2011,” U.S. Department or Education, National Center for Education Statistics, accessed August 11, 2019, source; and “Table 326.20. Graduation rate from first institution attended within 150 percent of normal time for first-time, full-time degree/certificate-seeking students at 2-year postsecondary institutions, by race/ethnicity, sex, and control of institution: Selected cohort entry years, 2000 through 2014,” U.S. Department of Education, National Center for Education Statistics, accessed August 11, 2019, source
- Clare McCann and Amy Laitinen, College Blackout: How the Higher Education Lobby Fought to Keep Students in the Dark (Washington, DC: New America, 2014.
- Amy Laitinen, “Defending a College with a 0 Percent Graduation Rate,” EdCentral (Blog), March 31, 2013, source
- Clare McCann and Amanda Janice Roberson, “New Legislation Would Provide Students Key Information About College Outcomes,” EdCentral (Blog), March 15, 2019, source
- “Table 326.10.Graduation rate from first institution attended for first-time, full-time bachelor's degree- seeking students at 4-year postsecondary institutions, by race/ethnicity, time to completion, sex, control of institution, and acceptance rate: Selected cohort entry years, 1996 through 2011,” U.S. Department of Education, National Center for Education Statistics, accessed August 11, 2019, source
- U.S. Department of Education, “Focusing Higher Education on Student Success,” July 27, 2017, source
- New America analysis of U.S. Department of Education NPSAS: 16 data, source
- New America analysis of U.S. Department of Education NPSAS: 16 data, source
- New America analysis of U.S. Department of Education NPSAS: 16 data, source
- Jovita M. Ross-Gordon, Research on Adult Learners: Supporting the Needs of an Adult Population that is No Longer Nontraditional (Washington, DC: Association of American Colleges and Universities, 2011).
- U.S. Department of Labor, Workforce System and Apprenticeship Partners (Washington, DC: U.S. Department of Labor, ND).
- Robert I. Lerman, “Bipartisan Support Emerges for Expanding Apprenticeship,” UrbanWire (blog), February 26, 2015, source
- “Registered Apprenticeship National Results Fiscal Year (FY) 2018 (10/01/2018 to 9/30/2018),” U.S. Department of Labor, accessed August 11, 2019, source
- Keith L. Rolland, “Apprenticeships and Their Potential in the U.S.,” Cascade 90 (Winter 2016), source
- Brent Parton, Youth Apprenticeship in America Today: Connecting High School Students to Apprenticeship (Washington, DC: New America, 2017).
- Mary Alice McCarthy, Iris Palmer, and Michael Prebil, Eight Recommendations for Connecting Apprenticeship to Higher Education (Washington, DC: New America, 2017).
- “Unemployment Rates and Earnings by Educational Attainment,” U.S. Department of Labor, Bureau of Labor Statistics, accessed August 11, 2019, source
- “Median Weekly Earnings by Educational Attainment in 2014,” U.S. Department of Labor, Bureau of Labor Statistics, accessed August 11, 2019, source
- Rachel Fishman, The Wealth Gap PLUS Debt: How Federal Loans Exacerbate Inequality (Washington, DC: New America, 2018).
- Federal Reserve Bank of New York, “Total Household Debt Rises for 19th Straight Quarter, Now Nearly $1 Trillion Above Previous Peak,” May 14, 2019, source
- Adam Looney, How Progressive is Senator Warren’s Loan Forgiveness Proposal? (Washington, DC: Brookings Institute, 2019).
- Kim Dancy and Alexander Holt, In the Interest of Few: The Regressive Benefits of Student Loan Refinancing (Washington, DC: New America, 2017).
- Judith Scott-Clayton, The Looming Student Default Crisis is Worse Than We Thought (Washington, DC: Brookings Institute, 2018).
- Alvaro Mezza and Kamila Sommer, A Trillion Dollar Question: What Predicts Student Loan Default? (Washington, DC: Board of Governors of the Federal Reserve System, 2015).
- Sandy Baum, Jennifer Ma, Matea Pender, and CJ Libassi, Trends in Student Aid 2018 (Washington, DC: The College Board, 2018).
- New America analysis of U.S. Department of Education BPS: 2004/2009 data, source
- Ibid.
- Ibid.
- Jason N. Houle and Fenaba R. Addo, “Racial Disparities in Student Debt and the Reproduction of the Fragile Black Middle Class,” Sociology of Race and Ethnicity (August 2, 2018).
- Diane Cheng and Veronica Gonzalez, Student Debt and the Class of 2017 (Oakland, CA: The Institute for College Access and Success, 2018).
- Michal Grinstein-Weiss, Dana C. Perantie, Samuel H. Taylor, Shenyang Guo, and Ramesh Raghaven, “Racial Disparities in Education Debt Burden Among Low- and Moderate-Income Households,” Children and Youth Services Review 65 (June 2016), 166-174.
- Judith Scott-Clayton and Jing Li, Black-White Disparity in Student Loan Debt Nearly Triples After Graduation (Washington, DC: Brookings Institute, 2016).
- Amy Laitinen, Rachel Fishman, and Clare McCann, Recommendations to Support Borrowers of Color (Washington, DC: New America, 2019).
- Kristin Blagg, Underwater on Student Debt: Understanding Consumer Credit and Student Loan Default (Washington, DC: The Urban Institute, 2018).
- Judith Scott-Clayton, The Looming Student Loan Default Crisis is Worse Than We Thought (Washington, DC: Brookings Institute, 2018).
- Judith Scott-Clayton, The Looming Student Loan Default Crisis is Worse Than We Thought (Washington, DC: Brookings Institute, 2018).
- New America, Young Invincibles, and the National Association of Student Financial Aid Administrators, The Case for Payroll Withholding: Preventing Student Loan Defaults with Automatic Income-Based Repayment (Washington, DC: New America, 2014).
Focus Feature: Experiencing Food Insecurity on Campus
Many who work closely with college students have known for a while that hunger is a serious problem facing them. Although recent headlines over the past few years have called food insecurity a “hidden” or “surprising” problem on college campuses, it is not new.1 Researchers affiliated with the Hope Center for College, Community, and Justice began tracking college student food insecurity in Wisconsin over a decade ago. And a study on food insecurity at the University of Hawaii from 2009 showed that 21 percent of students were dealing with the issue. In response, the Michigan State Student Food Bank and the Oregon State University Food Pantry established the College and University Food Bank Alliance in 2012 to help provide food for students in need.2 The Alliance has grown to 700 members nationwide.
The stereotype that students only eat ramen, cereal, or the free food they get from events on campus makes light of the staggering number of students who are forced to make difficult choices between buying food or paying for school fees, books, diapers for their children, or transportation to campus. It also has made light of the burdens of making these choices on students’ mental and physical health and academic performance.3 Pam Eddinger, president of Bunker Hill Community College (BHCC), an institution in Boston, explained that, “This isn’t just about feeding people; it’s also about student success and completion.”
Until now, we have not known the definite number of how many students nationwide struggle to afford adequate food, but a Government Accountability Office (GAO) review of existing studies on food insecurity on college campuses found that the biggest risk factor for food insecurity is low income.4 On top of that, 29 percent of all undergraduate students and 75 percent of all low-income undergraduate students had at least one additional risk factor, like disability, homelessness, or status as a first-generation college student or a former foster youth. In our survey, 46 percent of current college students report that often, or at least sometimes, in the last 12 months, the food they bought just did not last and they did not have money to buy more.
Error: Data visualization bundle URL missing.
Current data available on the issue suggest that community college students are more likely than other students to have higher levels of food insecurity. This is because community colleges tend to have larger percentages of first-generation and low-income students and fewer resources to meet their needs: About 39 percent of the student body at public two-year institutions have a family income below $35,000, compared to 28 percent of students at public four-year institutions.5
To document how many students were facing hunger at BHCC, the institution participated in the Hope Lab’s basic needs insecurity survey. The survey found that over half of respondents ran out of food and could not afford to buy more in the previous month, and nearly half reported skipping meals or eating less because they could not afford enough food.6 Eddinger explained that when she presents these data, people sometimes have a hard time believing it. “This tells me that poverty and hunger and homelessness has so much stigma attached to it,” she says, “that even with the numbers in front of them, it’s really hard for people to see someone in college and think of someone who doesn’t have enough money to buy food.”
Even at well-resourced universities, students still grapple with hunger. The University of Maryland, College Park (UMD) has the second lowest percentage of low-income students of all public higher education institutions in the state.7 Even with all this wealth, a 2017 study revealed that one in five students at UMD are food insecure. In an interview with The Diamondback, a student-run newspaper that has worked to highlight this issue, , the leading researcher of the study, Yu-Wei Wang, reported that students had a lot to say about their struggles: “In my 20 years of doing research, I’ve never seen something like this,” she said. “We have students who wrote paragraphs describing their experiences.” 8 One student wrote, “Early in my graduate school experience, I went through incredible financial difficulty, a brief period of homelessness escaping domestic violence and limited access to food. … I cried most nights because I didn’t have enough money to make ends meet.”
To help students meet their immediate needs, many schools have a food pantry on campus. But pantries are not a perfect solution. The Hope Lab’s survey of campus pantries found that students may not be aware that their school has a pantry, and 5 percent of the pantries require proof of financial need.9 Most pantries are only open during the day, making them less accessible to students who are only on campus in the evenings. Even when students have access to this resource, social stigma around food insecurity makes them hesitant to visit. Another common problem that pantries face is that perishable food is often unavailable or limited due to storage constraints, and the food supply, in general, is not enough to meet demand. “Usually the campus pantry would run out of food every week,” said Wang. Bunker Hill encounters similar supply challenges. In an interview, President Eddinger explained: “We have a monthly mobile market that brings 8,000 pounds of food to our campus. It is gone within two hours.”10
The Supplemental Nutrition Assistance Program (SNAP),11 a program that provides federal assistance to help low-income individuals afford food, does not apply to many college students. If students attend college at least half time, they generally cannot receive benefits unless they participate in a federal work-study program or work at least 20 hours a week. Even when eligible, many students neither realize that they could get food stamps nor know how to apply. The GAO’s study found that two million potentially eligible students did not report receiving benefits in 2016. And even if students do use SNAP, like the 1,000 students at Bunker Hill who are enrolled in this program, they still often run out of food before the end of the month.
Despite all of these challenges, Bunker Hill and UMD have rallied to support students. President Eddinger has been outspoken about food insecurity’s toll on her students, and was one of three community college presidents who advocated for Sen. Elizabeth Warren (D-Mass.) to ask the GAO to study food insecurity.12 When asked why she has been so involved with this issue, she replied, “I think it’s the history of who we are at Bunker Hill. I was incredibly touched when I came on campus and realized what the last president, President Mary Fifield, had done in setting the example of helping the student in whatever area the students need help in.” BHCC was one of the first campuses to adopt Single Stop, a nationwide program to help students file taxes, apply for health care, find child care, locate housing, and access other benefits like legal aid.13 Single Stop helps students apply for food stamps and also houses Bunker Hill’s food pantry. Panera Bread also does a daily bread donation through the office, but the food disappears quickly. President Eddinger estimates that approximately 2,500 students use this resource per year.
UMD has undertaken a number of initiatives this academic year in response to the results of its food insecurity study. The campus pantry is working to raise enough money to move to a larger facility that has more storage space for perishable food. Dining services is hiring for an Americorps position to coordinate a hunger-free campus work group. The Department of Transportation renamed one of its free weekend shuttle routes a grocery shopping route, which Wang said students mentioned as particularly helpful in the follow-up interviews she conducted last fall. The shuttle takes students to grocery stores, like Giant and Safeway, which is crucial, given the fact that the USDA designated College Park a food desert in 2015, and the on-campus grocery options are more expensive and tend to have less produce.14
Wang’s presentations at UMD about food insecurity on campus also sparked students to take action. After hearing the study’s findings in October, the Student Government Association voted to allocate its unused budget from the previous year to create the Emergency Meal Fund for students who need food.15 This program gives students who need emergency support 10 meal swipes on a dining card. The pilot program paid for 1,660 meal swipes this academic year. The pantry at UMD has also seen a spike in donations. Wang explained that both student groups and academic departments have been collecting more food for the pantry this year, and “we’ve been getting more donations from the Capital Area Food Bank and different food drives on campus.” The study’s findings also inspired seven business school scholars to spend the fall studying food insecurity on campus.16 They presented recommendations on how the university can better support hungry students to the Department of Student Affairs at the conclusion of the semester.
The interim challenge remains making students aware of and helping them take advantage of available supports. The Campus Pantry at UMD is partnering with freshmen orientation this summer to let students know, before class even begins, about on-campus resources for those who experience difficulties affording food. Additionally, Brian Watkins, the director of the Office of Parent and Family Affairs at UMD, is encouraging professors to include a section about basic needs and campus resources in their syllabi.17 He hopes this will help both faculty and students become more informed about resources and make students feel more comfortable reaching out for help. Wang emphasized the need to facilitate faculty-student conversations about hunger to remove much of the stigma around the issue. “A lot of time students don’t feel comfortable to tell faculty that they are struggling to find food to eat, but faculty are who the students see every day,” she points out.
Institutions alone cannot ensure that basic needs are met; policies must change to reflect the reality that student demographics and student needs are changing. Federal and state governments need to ensure that social support programs, like SNAP and shelters, do not exclude students. Eddinger told the story of a student who was homeless: “we were trying to place him in a shelter, but he couldn’t stay there because he was a full-time student. To stay at the shelter, he would have had to have dropped some of his classes.”
There is growing awareness and momentum behind changing policies to meet students’ basic needs, and lawmakers have a once-in-a-decade opportunity to make meaningful policy changes for a substantial number of students in the reauthorization of the Higher Education Act. Congress has the opportunity to address the rising overall cost of college, which includes living expenses, by allocating more funds to grants for students with financial needs.
Citations
- Caitlin Dewey, “The hidden crisis on college campuses: Many students don’t have enough to eat,” The Washington Post, accessed August 9, 2019, source; Laura McKenna, “The Hidden Hunger on College Campuses,” The Atlantic Monthly, accessed August 9, 2019, source; Jillian Berman, “You may be surprised by how many college students are going hungry,” Market Watch, accessed August 9, 2019, source
- College and University Food Bank Alliance, accessed August 9, 2019. source
- Suzanna M. Martinez et al. “No food for thought: Food insecurity is related to poor mental health and lower academic performance among students in California’s public university system,” Journal of Health Psychology, (June 2018), doi:10.1177/1359105318783028.
- U.S. Government Accountability Office, Food Insecurity: Better Information Could Help Eligible College Students Access Federal Food Assistance Benefits, GAO-19-95 (Washington, DC, 2018), accessed August 9, 2019, source
- National Postsecondary Student Aid Study: 2016 Undergraduates, accessed August 9, 2019, source
- “Hunger/Homelessness Eradication Applied Research Tools (HEART) Survey,” Bunker Hill Community College, accessed August 9, 2019, source
- “2018 Data Book,” Maryland Higher Education Commission, accessed August 9, 2019, source
- Matt Perez, “About 20 percent of UMD students struggle with food insecurity, study finds,” The Diamond Back, accessed August 9, 2019, source; “Search: ‘food insecurity,’” The Diamond Back, accessed August 9, 2019, source
- Sarah Goldrick-Rab et al. “Campus Food Pantries: Insights from a National Survey,” the Hope Center for College, Community, and Justice, published September 28, 2018, accessed August 9, 2019, source
- “President Eddinger Discusses Food Insecurity on NECN-TV’s ‘The Take with Sue O’Connell,’” Bunker Hill Community College, accessed August 9, 2019, source
- “Supplemental Nutrition Assistance Program,” U.S. Department of Agriculture: Food and Nutrition Service, accessed August 9, 2019, source
- Meghna Chakrabarti and Alison Bruzek, “President Of Largest Community College In Mass. On Student Hunger,” October 28, 2016, in Radio Boston, produced WBUR, podcast, 16:30, accessed August 9, 2019, source
- “Single Stop,” Bunker Hill Community College, accessed August 9, 2019, source
- Samantha Subin, “Lidl aims to make grocery shopping affordable in College Park,” The Diamond Back, accessed August 9, 2019, source
- Rachel S. Hunt, “UMD’s food pantry is fundraising for a $1 million upgrade,” The Diamond Back, accessed August 9, 2019, source
- Sarah D’Souza, “One in five UMD students are food insecure. These students want to fix that,” The Diamond Back, accessed August 9, 2019, source
- Sarah D’Souza, “A UMD official wants to expand the resources listed on course syllabi,” The Diamond Back, accessed August 9, 2019, source
Focus Feature: Career Pathways at Portland Community College
“In less than one year, you can create your career.” This bold statement, right at the top of the Career Pathways program’s website at Portland Community College (PCC), evokes both doubt and curiosity.1 Doubt, because it sounds too good to be true. Curiosity, because it sounds too good to be true: Create your career in less than a year, how? But staff members at the program know that they mean every word in that statement.
The Career Pathways program at PCC offers short-term certificates that can prepare students for entry-level jobs in multiple fields. These short-term certificates follow a specific pathway that lays out how students can move from low to high skill level and build a career in a certain field. After completing the certificate, students can stay on and earn more certificates that can eventually lead to an associate degree at PCC or a bachelor’s degree at another institution. Those who want to leave the program after completion and work right away can come back and continue with the pathway at a later time.
Figure 1 visualizes how a typical career pathway works. Following the road map, students who are interested in the manufacturing technician program at PCC can learn about the different options available for them once enrolled in the program. After finishing a short-term manufacturing technician program, followed by a one-year certificate program in different machining areas that will qualify them for an operator job, students can leave the program at that point, or they can stay on and earn an associate’s degree in machine manufacturing technology to qualify for a job as a machinist. If they would like to pursue further education, the program suggests some colleges in the area where they can get their credits transferred for an eventual bachelor’s degree. As Marc Goldberg, the associate vice president of the Workforce Development and Continuing Education at PCC, told us, career pathways “is really moving individuals from lower skills to more advanced skills, and it can be from high school to a community college certificate; it can be from a community college degree to a four-year degree.”
To make sure a certificate program that is as short as three or four months can lead to a meaningful job requires an understanding of what skills employers need. Program staff work with employers to identify which jobs require less than a bachelor’s or associate degree, or even less than a one-year certificate. Kate Kinder, the director of the Career Pathways and Skills Training at PCC, explained to us that, “When developing stackable credentials, absolutely the employers do have a very key role in that.” After identifying the job, program staff work backwards to determine which skills are necessary, aligning the skills with the curriculum. If current courses do not teach the right skills, a new course can be created if necessary. The important thing is to make sure that the skills learned in class will lead to a job that can assure economic mobility. “We look at labor market data; not only what the employers say to us,” said Kinder, “but also what the data are telling us, both through the state’s labor market data but also real-time tools such as Burning Glass.” 2
The program originated from an initiative that helped dislocated workers in the ‘90s. Soon, staff realized how the program could benefit not only dislocated working adults, but other low-income youth in the area, and how beneficial it would be for students to have the ability to build up their learning, eventually leading to higher education credentials and opening doors to greater job opportunities. Career Pathways at PCC now serves 300-500 students per year, offering programs in multiple industry sectors, from manufacturing to child and family studies.3 Students in the Career Pathways program are more likely to be adults without a college degree than other programs at PCC. Kinder said, “We offer stackable credentials to individuals with bachelor’s or master‘s degree, giving them [the] opportunity to reskill, but we’ve been very intentional about focusing on access, so really teaching those who don’t have a degree or postsecondary credential yet.” They are also more likely to be students of color and/or low-income: more than half of the Career Pathway participants overall are low-income. In one cohort, as high as 90 percent of them were low-income.
Indeed, the program has been thoughtful in its efforts to promote access and success for participants. Apart from intensive outreach efforts to underserved communities to encourage them to apply, the program makes sure students have the tools they need to engage with and complete their studies. “There was an understanding [in the field] that the role of the career coach, or the career navigator, is critical for many of our students,” said Goldberg. Students in the program can reach out to the navigators for advice with any issue they are facing, be it academic or job-related (i.e., choosing courses or improving resumes), or non-academic or non-job-related (i.e., finding child care or extra financial support). “Integrated, holistic student support is a critical element of a high-quality career pathway,” said Kinder.
Students who have joined the program have finished with very positive outcomes. Data from a comprehensive analysis of academic years 2012-2016 by PCC show that more than 94 percent of students completed their programs of study; for students of color, the number is 88 percent. Other statistics in the analysis include 72 percent pursue additional education and 75 percent were employed after completion, with an average wage of $16/hour. “If you look at a comparable population of low-income students, our numbers are definitely higher,” said Kinder.
Reaching the level of implementation and impact that this program has takes buy-in and support from different levels: the system, the institution, and the faculty. Collaboration across colleges in Oregon makes the program even stronger. “Through various statewide initiatives and alliances in Oregon, we have the opportunity to create a community of practice among the various leaders and faculty and staff involved in implementing career pathways across the state,” said Kinder. She appreciates the opportunity to learn and leverage other schools’ expertise. According to Kinder, that learning opportunity is essential, since “we can really open up about who can benefit from the career pathways approach, and also make sure we are innovative and responsive to the needs of our community and our students.”
So, what’s the next step for Career Pathways at PCC? According to Goldberg, the program aims to raise funding to be able to provide more financial support and other resources to better serve low-income students. Applying a comprehensive and thoughtful approach, the program staff at PCC seems determined to make the statement “In less than one year, you can create your career” possible for their students.
Figure 1. Career Road Map for the Manufacturing Technician Program at PCC.4
Source: Portland Community College’s website
Citations
- “Career Pathways,” Portland Community College, accessed August 8, 2019, source
- Burning Glass Technologies, accessed August 8, 2019, source
- “Career Pathway: Career Pathway Options,” Portland Community College, accessed August 8, 2019, source
- “Road Map: Manufacturing Technician,” Portland Community College, accessed August 8, 2019, source
Appendix A
Methodology
Survey Population and Response Rate
Varying Degrees was administered using NORC’s AmeriSpeak Panel for the sample source. Funded and operated by NORC, AmeriSpeak is a probability-based panel designed to be representative of the U.S. household population.1 A general population sample of adults 18 years of age and older was selected from NORC’s AmeriSpeak Panel for this study. Additional African Americans,2 Hispanics/Latinos,3 and Asian Americans were also selected from NORC’s AmeriSpeak Panel for three specific race-ethnicity oversamples. College students—those currently enrolled in an associate or bachelor's degree program—were selected from the AmeriSpeak Panel to create an oversample of current college students.
The screening and main interview stages of data collection were conducted during a single survey session. There was a screening stage to identify qualified and eligible panelists for the college student oversample; these are the respondents qualified to participate in the second stage, which is the main study interview.
Respondents who answered the screener, regardless of eligibility, were considered a screener complete. Respondents who were determined to be eligible for the study, based on the screener, then completed the survey were considered a survey completer. The screener completion rate was 29.51 percent. The incidence rate was 11.49 percent. Among those cases that qualified for the main study interview, the interview completion rate was 93.24 percent. The summary statistics on sample performance are shown in Table 1 below.4
Table 1. Sample Performance Summary—College Student Oversample
| Sampled / Invited Panelists | # Screening Interviews Completed | Screener Completion Rate | # Panelists Eligible for Interview | Incidence / Eligibility Rate | # Survey Interviews Completed | Interview Completion Rate |
|---|---|---|---|---|---|---|
| 14,393 | 4,247 | 29.51% | 488 | 11.49% | 455 | 93.24% |
Data Collection Procedures
To administer the phone survey, NORC dialed the sampled phone-mode panelists throughout the field period. In addition, starting on May 16, AmeriSpeak web-mode panelists for whom AmeriSpeak had a phone number also were called to encourage response. These web panelists were allowed to complete the survey via phone if convenient. Panelists were offered the cash equivalent of $3. In the middle of the field period, incentives for African Americans and college student oversamples were increased to $6. At the end of the field period, a final increase to $10 for the college students was implemented.
Margin of Error and Design Effect
The margin of error and design effect for the general population and each oversampled group are as follows:
| Samples | Sample Size | Margin of Error | Design Effect |
|---|---|---|---|
| General Population | 2,029 | 3.35% | 2.38 |
| African American | 414 | 7.30% | 2.30 |
| Asian American | 233 | 9.38% | 2.14 |
| Latino/Hispanic | 410 | 8.01% | 2.74 |
| College Student | 513 | 6.00% | 1.92 |
Citations
- For more detailed information on the AmeriSpeak panel recruitment and management methodology, see Appendix B.
- We refer to African Americans as Black Americans in this report.
- We refer to Hispanic/Latino Americans as Latinx Americans in this report.
- Please download NORC Card for the AAPOR response rate located here: website TK.
Appendix B
About AmeriSpeak recruitment:
Randomly selected U.S. households are sampled using area probability and address-based sampling, with a known, non-zero probability of selection from the NORC National Sample Frame. These sampled households are then contacted by U.S. mail, telephone, and field interviewers. The panel provides sample coverage of approximately 97 percent of the U.S. household population. Those excluded from the sample include people with P.O. Box-only addresses, some addresses not listed in the USPS Delivery Sequence File, and some newly constructed dwellings. While most AmeriSpeak households participate in surveys by web, non-internet households can participate in them by telephone. Households without conventional internet access but web access via smartphones are allowed to participate in AmeriSpeak surveys by web. AmeriSpeak panelists participate in NORC studies or studies conducted by NORC on behalf of governmental agencies, academic researchers, and media and commercial organizations.
Appendix C
About NORC and AmeriSpeak for Varying Degrees
NORC at the University of Chicago is an objective, nonpartisan research institution that delivers reliable data and rigorous analysis to guide critical programmatic, business, and policy decisions. Our founding principles include a mandate to carefully preserve and protect the scientific integrity and objectivity of our research.
NORC at the University of Chicago was contracted by New America for the 2019 Varying Degrees project to work on: survey instrument development, analysis and data collection using the AmeriSpeak Household Panel, and results dissemination.
Researchers from NORC’s Higher Education Analytics Center (HEAC) worked with New America to review and update the preexisting survey instrument to ensure that the resulting data and analysis fully supports the research aims of New America. At the conclusion of survey data collection via the AmeriSpeak panel, NORC cleaned, weighted, and shared data with New America. Additionally, the HEAC team analyzed and summarized the results in a topline summary report. Any opinions, conclusions, and/or recommendations presented in Varying Degrees are those of the authors (New America) and do not necessarily reflect the views of NORC.
More About the Authors

Ashley Clark
Intern, Higher Education
Alejandra Acosta
Policy Analyst, Higher Education

Sophie Nguyen
Senior Policy Manager, Higher Education
Rachel Fishman
Director, Higher Education
Issues
Programs/Projects/Initiatives
Related