
Table of Contents
- The Emerging Millennial Wealth Gap: Opening Note
- Building Ladders of Success for the Rising Millennial Generation: An Initiative Funded by the Citi Foundation
- Part 1: Generational Wealth and Financial Health
- Framing the Millennial Wealth Gap: Demographic Realities and Divergent Trajectories
- Trends, Origins, and Implications of the Millennial Wealth Gap
- The Millennial Racial Wealth Gap
- The Young and (Economically) Restless: The Nature of Work for American Millennials
- The Financial Lives of Millennials: Evidence from the U.S. Financial Health Pulse
- Part 2: Components of the Millennial Balance Sheet: Assets and Liabilities
- Wealth and the Credit Health of Young Millennials
- Millennials and Student Loans: Rising Debts and Disparities
- Young Adults and Consumer Debt: The Quiet Crisis Next Time
- Homeownership and Living Arrangements among Millennials: New Sources of Wealth Inequality and What to Do about It
- Part 3: Implications for Social Policy
- Public Policy Implications of the Millennial Wealth Gap
- Addressing the $1.5 Trillion in Federal Student Loan Debt
- Policy Responses to the Millennial Wealth Gap: Repairing the Balance Sheet and Creating New Pathways to Progress
Wealth and the Credit Health of Young Millennials
Signe-Mary McKernan, Caroline Ratcliffe, and Trina Shanks1
As Millennials age and become a higher percentage of the workforce, their overall financial health is increasingly consequential for the economy as a whole. With fewer career pathways to progress and expectations that they will be less well off financially than their parents, Millennials are feeling financially insecure. Such prevailing realities of their finances are raising questions about the economic future of the Millennial generation. What is their current wealth position?2 Are they on track to be financially secure as they age, and how does this trajectory compare with previous generations? Are there natural points of intervention that could improve their circumstances?
To address these questions, it is instructive not only to examine the collective balance sheet of Millennials, but also to dig deeper among collateral evidence provided by private-sector credit agencies that track consumers’ borrowing and payment behaviors and score their worthiness as borrowers. Accordingly, this chapter describes the wealth and credit health of young Millennials, as reflected in recent data from the Survey of Consumer Finances and a major credit bureau. We define “young Millennials” as families headed by people ages 18 (or 20) to age 29 in the Survey of Consumer Finances and people with a credit report ages 18 to 29 in the credit bureau data.
Millennial Family Wealth is Stagnating
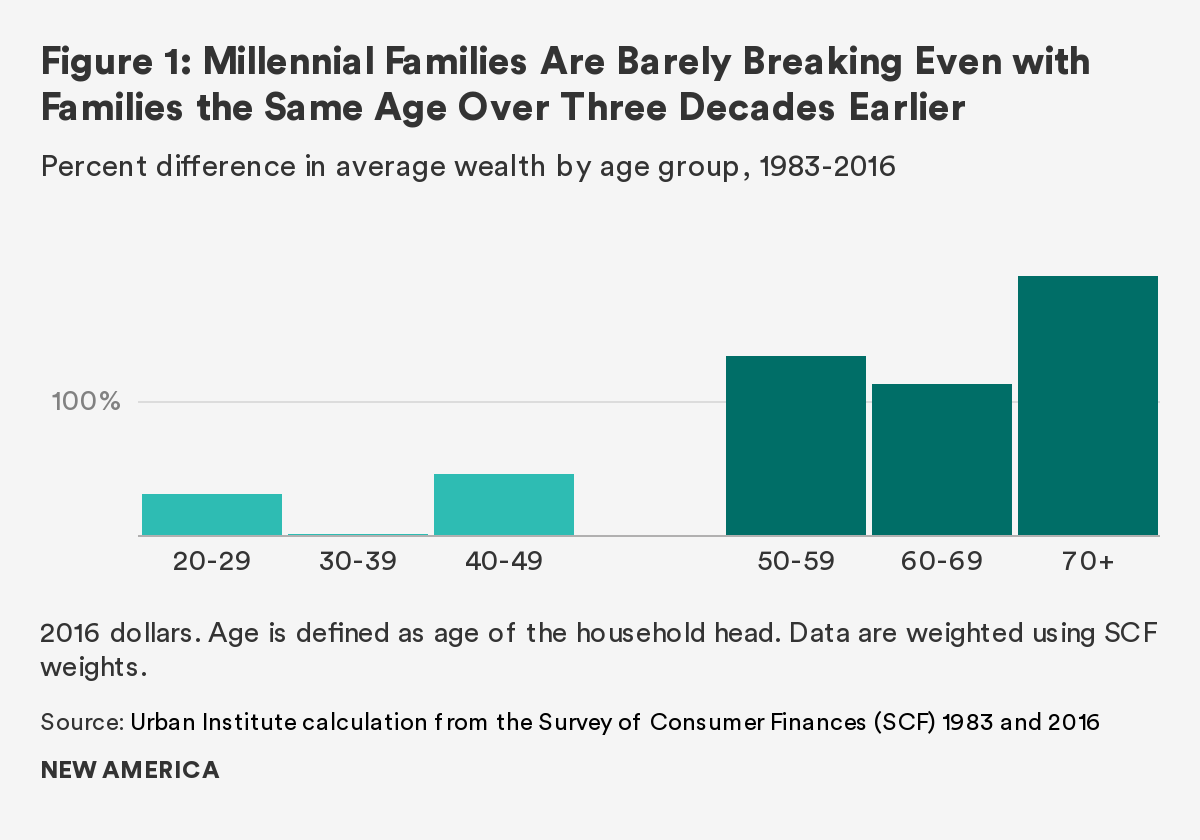
While there is more wealth in the country since the 1980s, the increases have not been evenly distributed generationally. Millennial family wealth has stagnated. Looking at the more than 30 years between 1983 and 2016, young and older Millennial families (ages 20 to 39 in 2016) experienced only small increases in wealth compared with earlier generations (Figure 1). Our comparisons show that Millennials are barely breaking even with the wealth their parents’ generation had back in the early 1980s. Young Millennial families have 31 percent more wealth than young families the same age in 1983, and older Millennial families have only 2 percent more. Baby boomers and the Silent Generation families, by comparison, have far more wealth (135 percent to 195 percent more) on average than families at their age roughly three decades earlier.
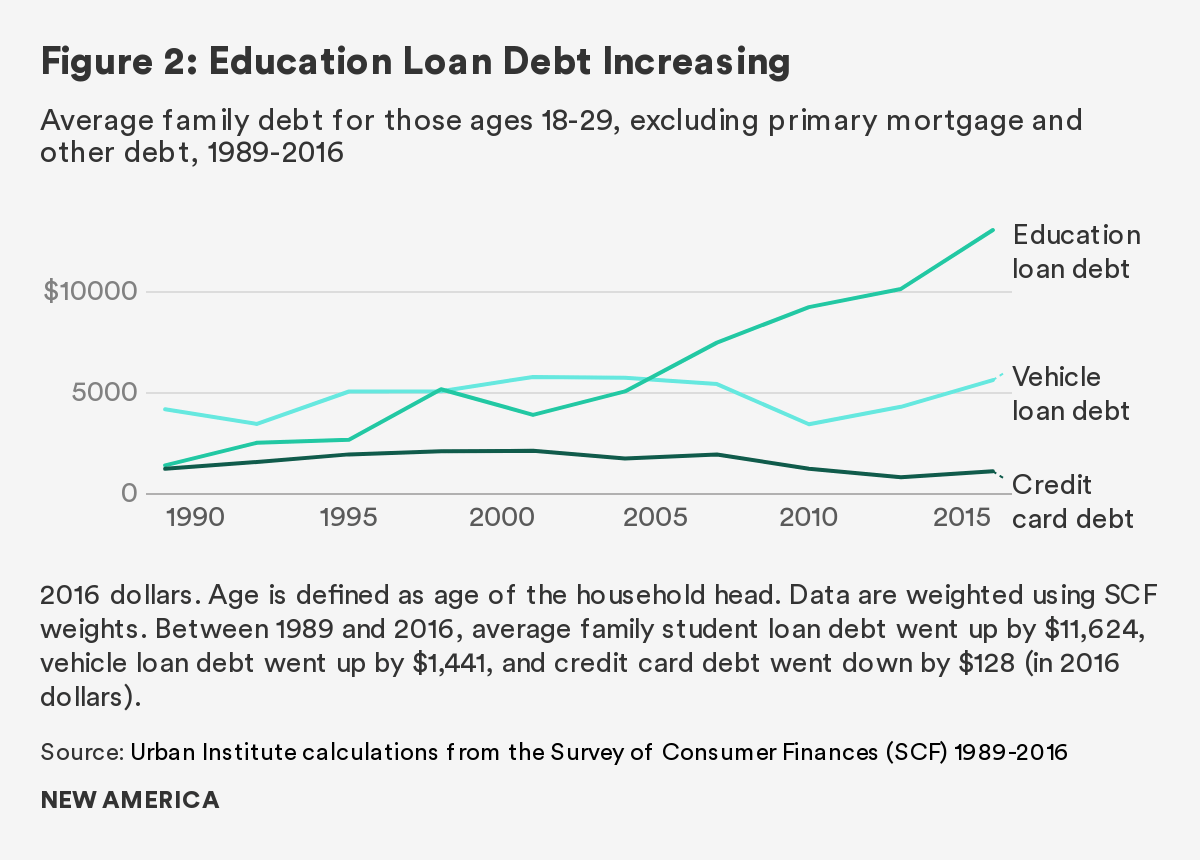
A lower Millennial homeownership rate may be one explanation (Choi et al. 2018), but a closer look at the debt side of the balance sheet provides additional insight into the phenomenon of Millennial wealth stagnation. While other types of debt, including car loans and credit card debt, fell in the aftermath of the Great Recession and remained relatively low, student loan debt increased sharply (Figure 2)—the result of more people taking out student loans and of people borrowing more money. By 2016, the average young Millennial family had $11,624 more in student loans than the average young family had in 1989, adjusted for inflation.
A Picture of Young Millennials’ Assets and Debts
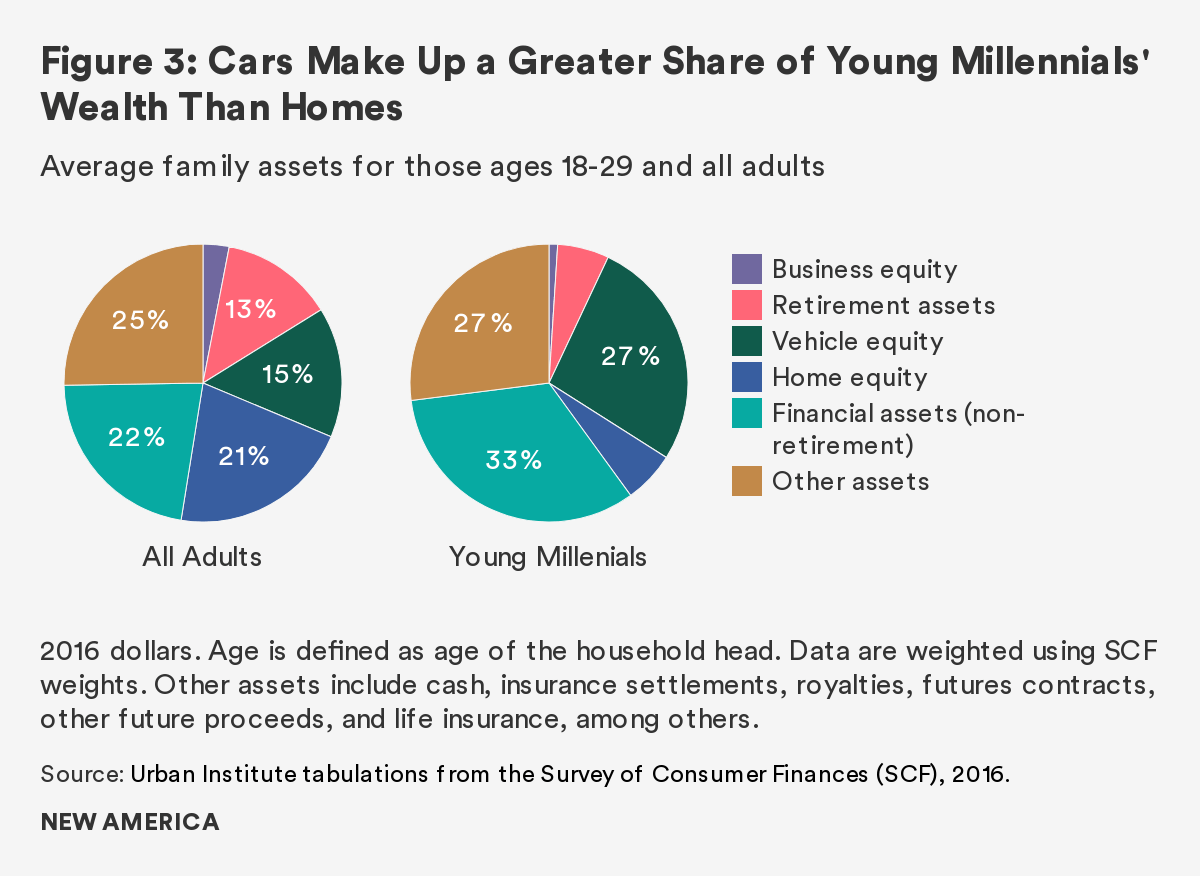
Shifting focus to 2016 (away from differences across generations) reveals important differences in the asset and debt portfolios of typical young Millennial families compared with all families. For example, vehicle equity makes up a relatively large share of young Millennial families’ assets (27 percent versus 15 percent for all families) and home equity a relatively small share (6 percent versus 21 percent for all families, Figure 3). That vehicle equity is important to young Millennial families may come as a surprise, as not everyone thinks of vehicles when thinking of wealth holdings. That home equity is a relatively small share is likely consistent with expectations. Even if young Millennial families do own homes, initial down payments can be small and it takes time to build equity.
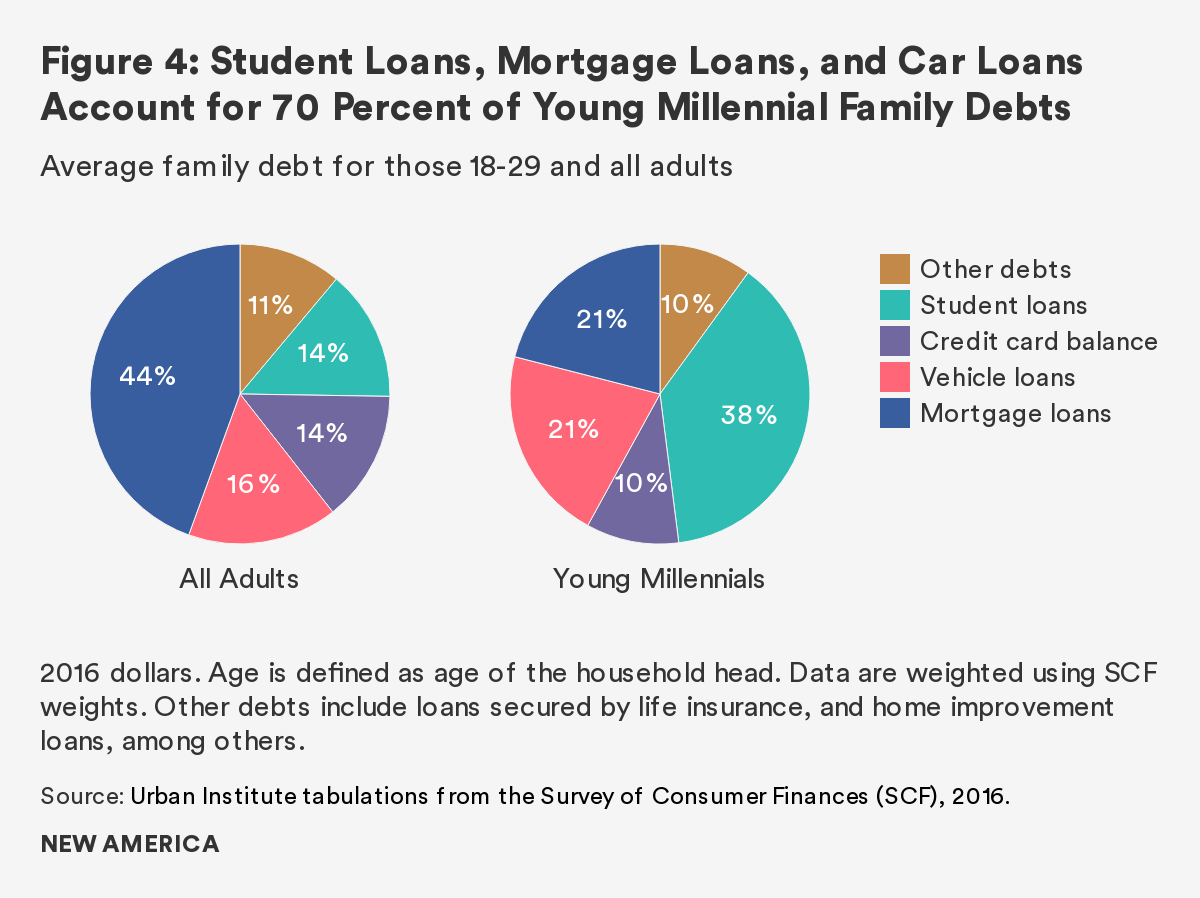
When considering the full range of debts incurred, several categories of debt dominate the Millennial balance sheet. Specifically, young Millennials hold the largest share of their debt in student loans (38 percent), car loans (21 percent), and mortgage loans (21 percent). We expect student loans and car loans to be a large share of young Millennial family debt. That mortgage loans are equally important is somewhat surprising. This finding is likely because mortgage loans tend to be large relative to student loans and car loans, so even if fewer people have them, they account for a larger share of debt. In contrast to young Millennial families, all families hold the largest share of their debt in mortgage loans (44 percent) and the smallest share in student loans (8 percent; Figure 4).
A Fuller Picture of Young Millennials’ Credit Health
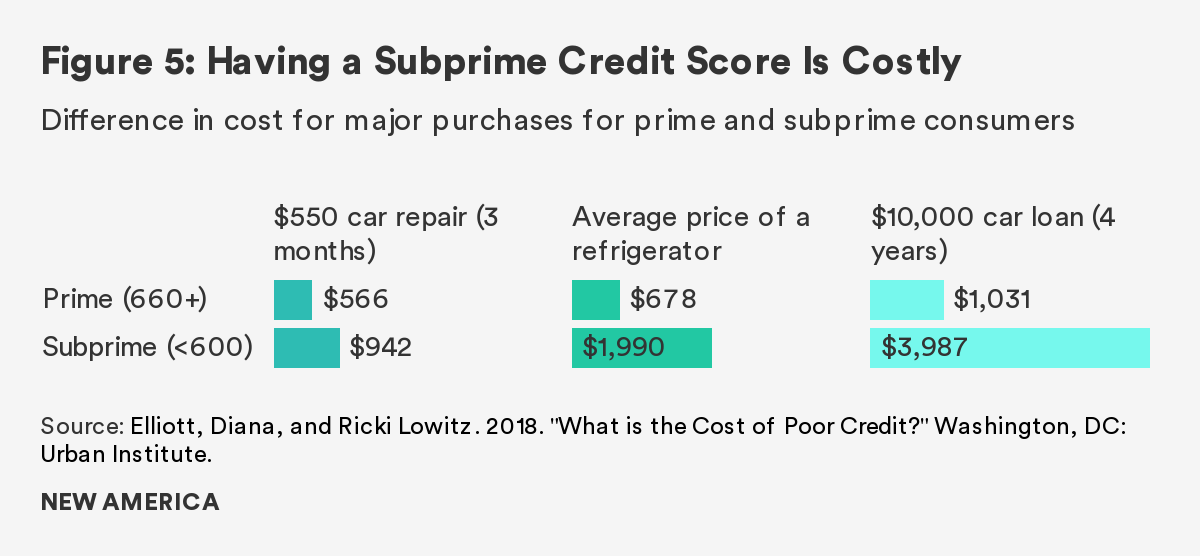
Establishing a credit record and a prime credit score is an important foundation for building wealth and economic security. A consumer’s credit score is a three-digit number (generally between 300 and 850) that is designed to capture his or her creditworthiness (i.e., the likelihood of repaying or becoming delinquent on a loan). Having a subprime score is costly, as it brings higher interest rates that make the purchase of common items much more expensive. A consumer with a subprime (versus prime) credit score can pay three times more for a four-year car loan, almost three times as much for a refrigerator, and almost twice as much for a $550 car repair (Figure 5; Elliott and Lowitz 2018). This can also impact the cost of mortgages, as consumers with subprime credit could pay almost 50 percent more ($268,943 versus $182,324) over a 30-year mortgage than consumers with prime credit (Braga, McKernan, and Hassani 2019).
Using 2017 data from a major credit bureau, we examine the credit scores of young Millennials ages 18–29 (born 1988 to 1999) to provide evidence on how credit health evolves during the stages of young adulthood—ages 18–20, 21–24, and 25–29. We examine the Vantage credit score, where a score at or below 600 is “subprime,” between 601 and 660 is “near-prime,” and above 660 is “prime.” With these data, our analysis is restricted to people with a credit bureau record. Estimates suggest that 11 percent of U.S. adults—or 26 million people—do not have a credit record (Brevoort, Grimm, and Kambara 2015). Consumers acquire a credit record when they get some type of loan or credit access (e.g., student loan, credit card) or have a severely delinquent bill (e.g., medical or utility bill in collection status). A larger share of people have credit records as they move from their late teens into their 20s. While 65 percent of 18- to 19-year-olds do not have a credit record, the share falls to 20 percent for 20- to 24-year-olds and 9 percent for 25- to 29-year-olds (Brevoort, Grimm, and Kambara 2015). Thus, in the analyses that follow, there is a larger share of U.S. consumers in the older versus young age groups.
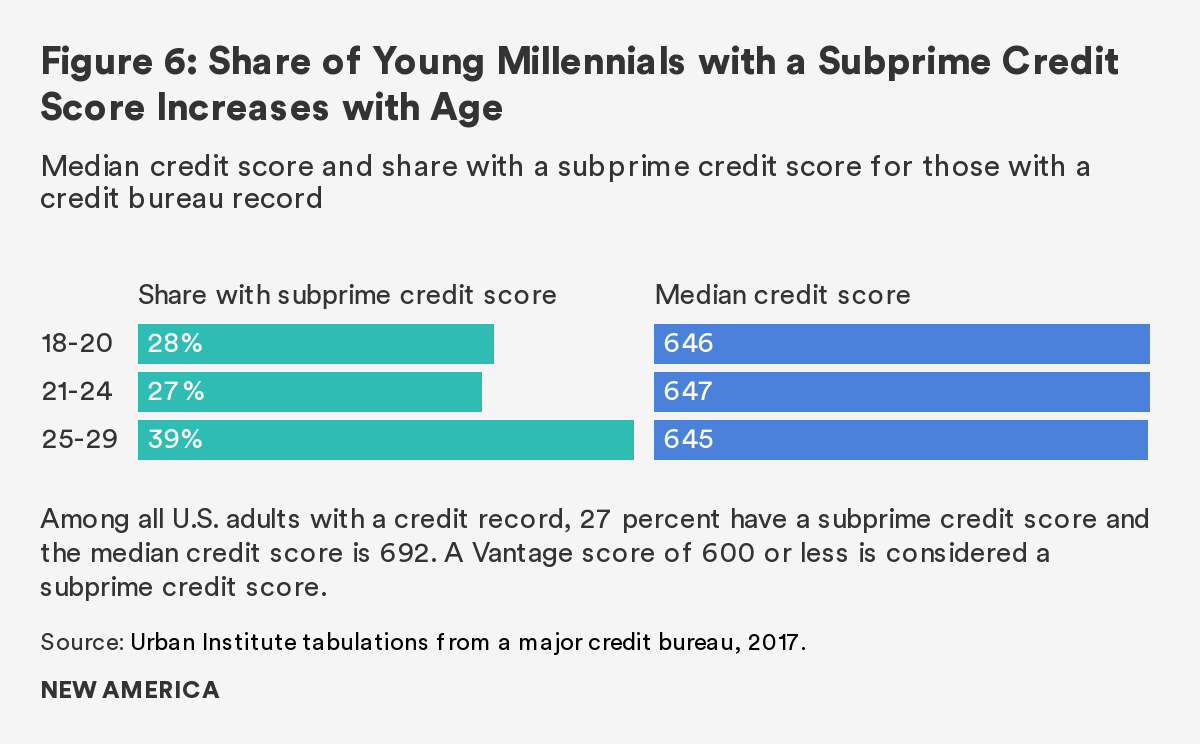
Among young Millennials with a credit record, the share of people with a subprime credit score increases with age (Figure 6). While 27 percent of 21- to 24-year-olds with a credit record have a subprime credit score, the share increases to 39 percent for those ages 25 to 29—a 12 percentage-point increase. The median credit score is similar and in the near-prime range for the three age groups, however (645–647; Figure 6). Taken together, these data suggest a worsening of credit health for a group of consumers at the bottom but not for the typical (median) young consumer.
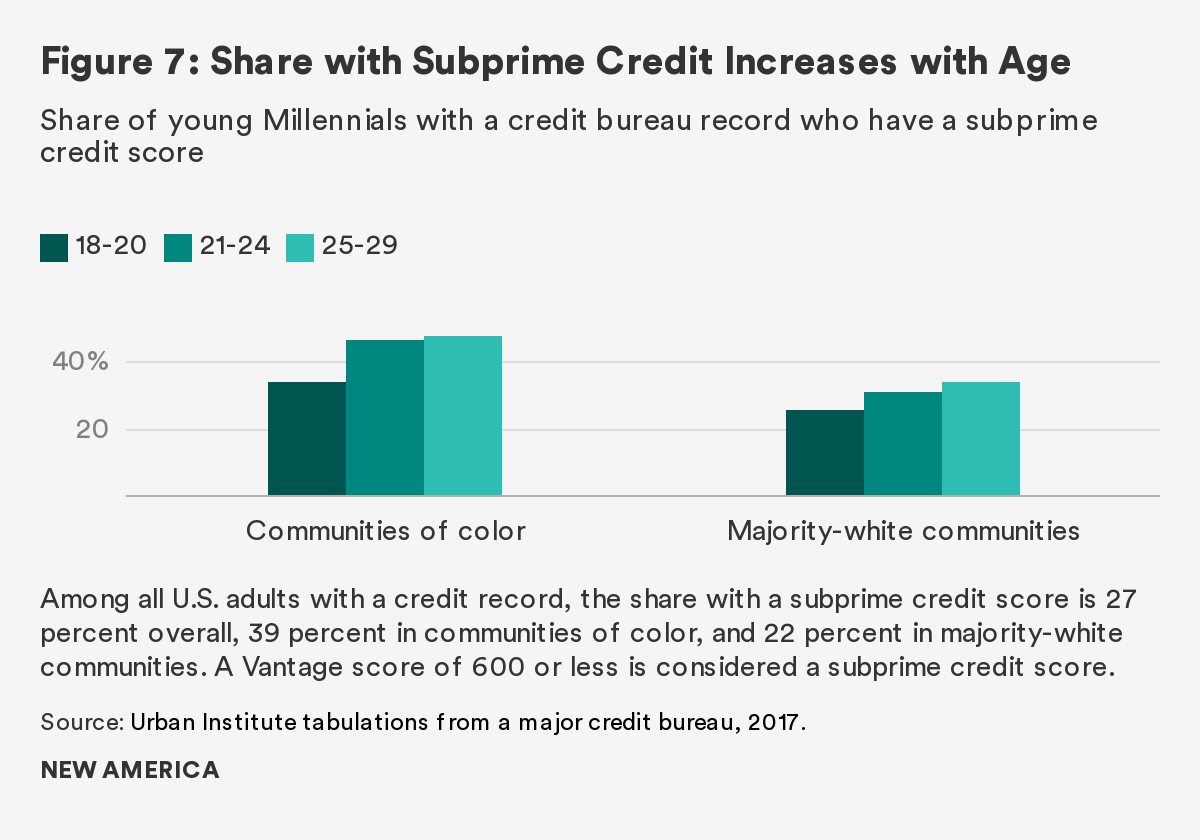
To further examine which young consumers are struggling to get on firm financial footing, we separately examine the credit scores of young adults who live in majority-white communities (i.e., ZIP codes) and those who live in communities of color.3 We find that, among people with a credit record, the share of people with a subprime credit score increases with age for both groups, but increases more for Millennials in communities of color.
Among people in majority-white communities who have a credit bureau record, 26 percent of 18- to 20-year-olds and 34 percent of 25- to 29-year-olds have a subprime credit score—a difference of 8 percentage points (Figure7). Among people in communities of color, the shares of people with subprime scores are significantly higher at 34 percent and 48 percent, respectively—a difference of 14 percentage points. These numbers highlight the different patterns that prevail depending upon the racial and ethnic makeup of the communities where people live.4
Digging in deeper, we find that the median credit score increases with age in majority-white communities (from 651 to 662), while it declines with age for those in communities of color (from 623 to 603; Figure 8). This means that the typical (or middle) youth with a credit record who lives in a community of color experiences a declining credit score as she moves into her early 20s. The generally lower incomes and greater financial fragility of families in communities of color suggests that these youth are less likely to have a personal financial safety net (e.g., parents who can help as they work to meet financial obligations). The fact that youth in communities of color are more likely to struggle with credit and debt is consistent with the large racial wealth gap in the U.S. (e.g., the median White family has 10 times the wealth of the median Black family; McKernan et al. 2017) and the more limited intergenerational transfers Black families receive (e.g., White families are five times more likely than Black families to receive a large gift or inheritance; McKernan et al. 2014).

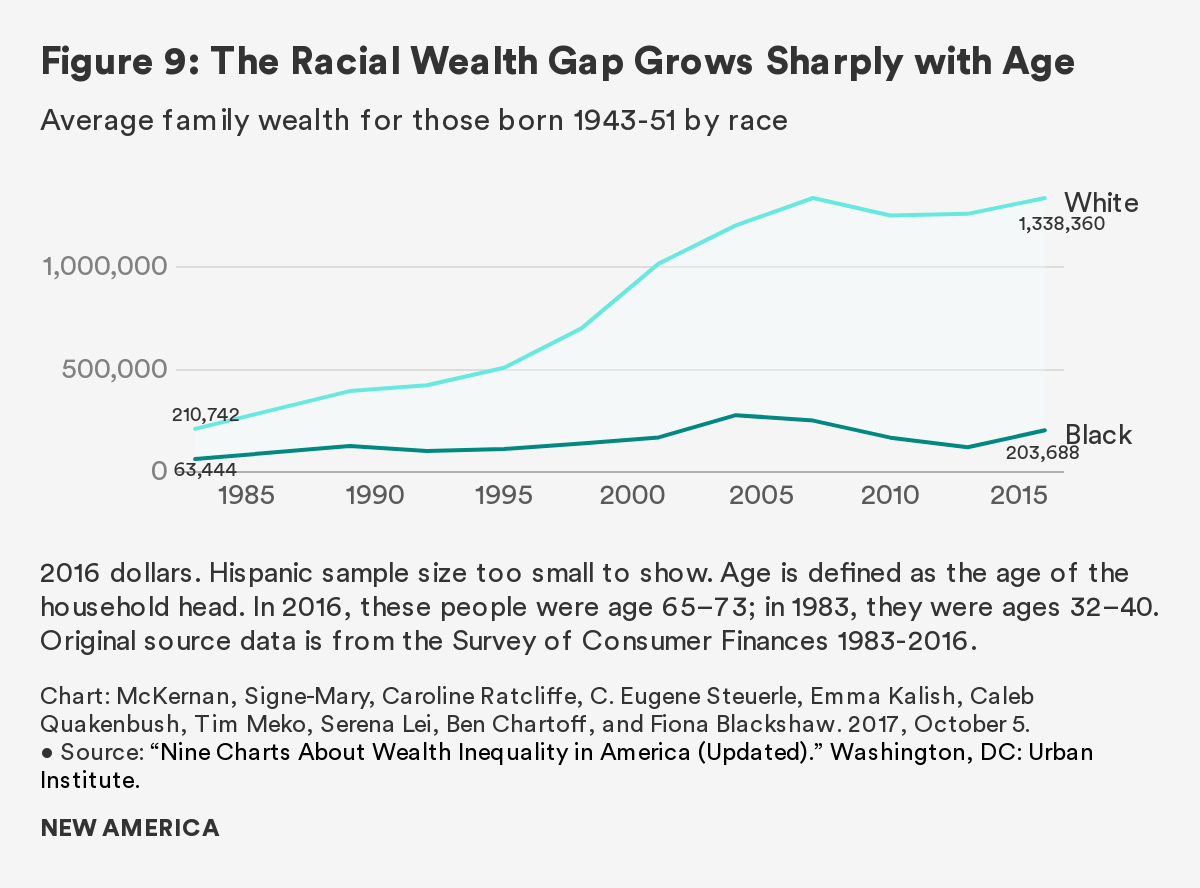
Importantly, nearly half of Millennials ages 21 to 29 with a credit record who live in a community of color have a subprime credit score. This subprime score leaves them vulnerable to high-cost predatory lending and can severely limit their ability to build wealth as they move into their 30s and beyond. In fact, examining average family wealth back to the early 1980s shows that racial disparities are already apparent for people in their early 30s but then continue to grow sharply with age (McKernan et al. 2017). Specifically, looking at people from an earlier generation (those born between 1943 and 1951), the average White family had three times more wealth than the average Black family in their 30s ($210,742 versus $63,444), but the gap grew to seven times higher by their 60s and 70s ($1,338,360 versus $203,688; Figure 9). The racial wealth gap has been growing over time (McKernan et al. 2017), and if such trends hold true for Millennials, then Black children and households will continue to face increasing economic insecurity and have fewer resources to pursue their dreams and aspirations.
Patterns of Young Millennials’ Delinquent Debt
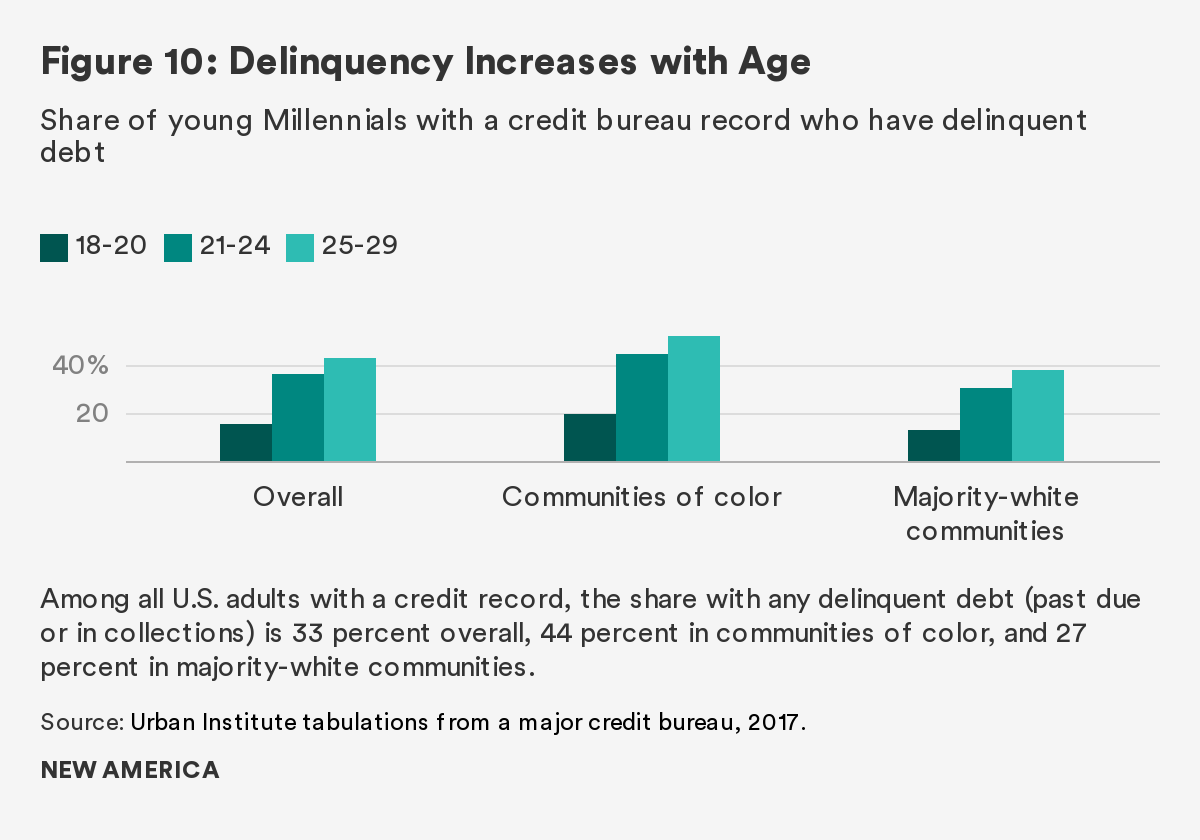
Another measure of financial distress reflected in the credit bureau data is the prevalence of debt in delinquency, where someone is behind on paying off their loan obligations or has not paid a bill (e.g., medical, phone, utility). Among Millennials with a credit record, the share with delinquent debt (past due or in collections) increases with age (Figure 10). The majority of delinquencies on people’s credit bureau records are for unpaid medical, phone, and utility bills (Consumer Financial Protection Bureau 2019),5 which suggests that young adults are primarily struggling to pay their bills (versus making payments on a credit card or loan).
The higher share of delinquent debt among Millennials in their late 20s holds overall and for those in both majority-white communities and communities of color. We also see higher rates of delinquency for young adults in communities of color than in majority-white communities, which is consistent with lower credit scores for young adults in communities of color. The rates, however, are high for both groups. For example, among 25- to 29-year-olds who have a credit bureau record, nearly four in 10 (38 percent) of those in majority-white communities have debt in collections and roughly half (52 percent) of people in communities of color do so. This shows that young adults across different communities are struggling to meet their financial obligations. This suggests that targeting financial-health interventions to teens and young adults could be an important step in improving Americans’ long-term financial well-being.
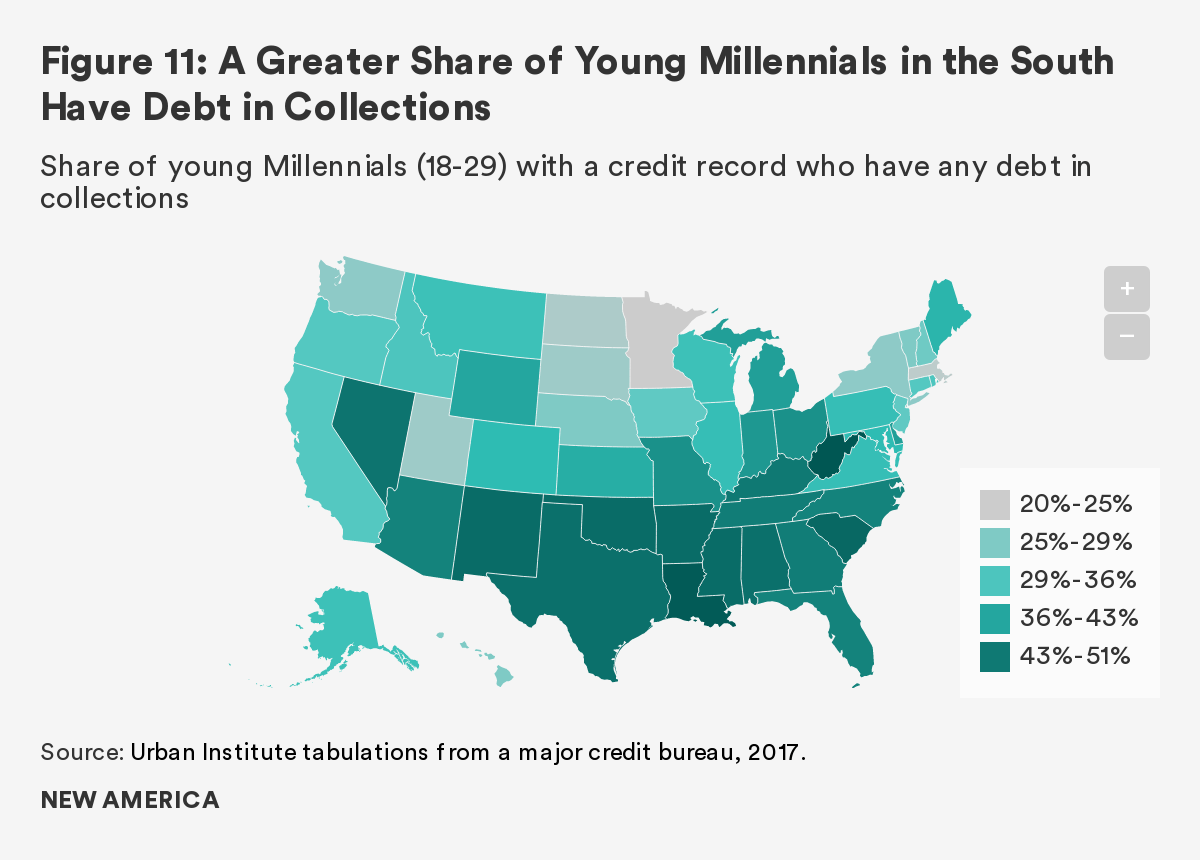
Examining geographical patterns, we find that youth debt in collections is concentrated in the South (Figure 11). This pattern is consistent with the general patterns of lower incomes and greater financial distress in the South (Ratcliffe et al. 2018) and suggests that interventions could be particularly beneficial in Southern communities.
Peeling back the layers to look at the types of delinquent debt, we see that Millennials are struggling with both medical and student loan debt. Contrary to popular belief, Millennials are more likely than people ages 65 and older (Silent Generation and older Baby Boomers) to have past-due medical debt. While 10 percent of people ages 65 and older report having past-due medical debt, 25 percent of Millennials ages 18 to 34 do so. Millennials are also less likely to have health insurance, which leaves them financially exposed to unexpected illnesses (McKernan, Kenney, and Abare 2017).6
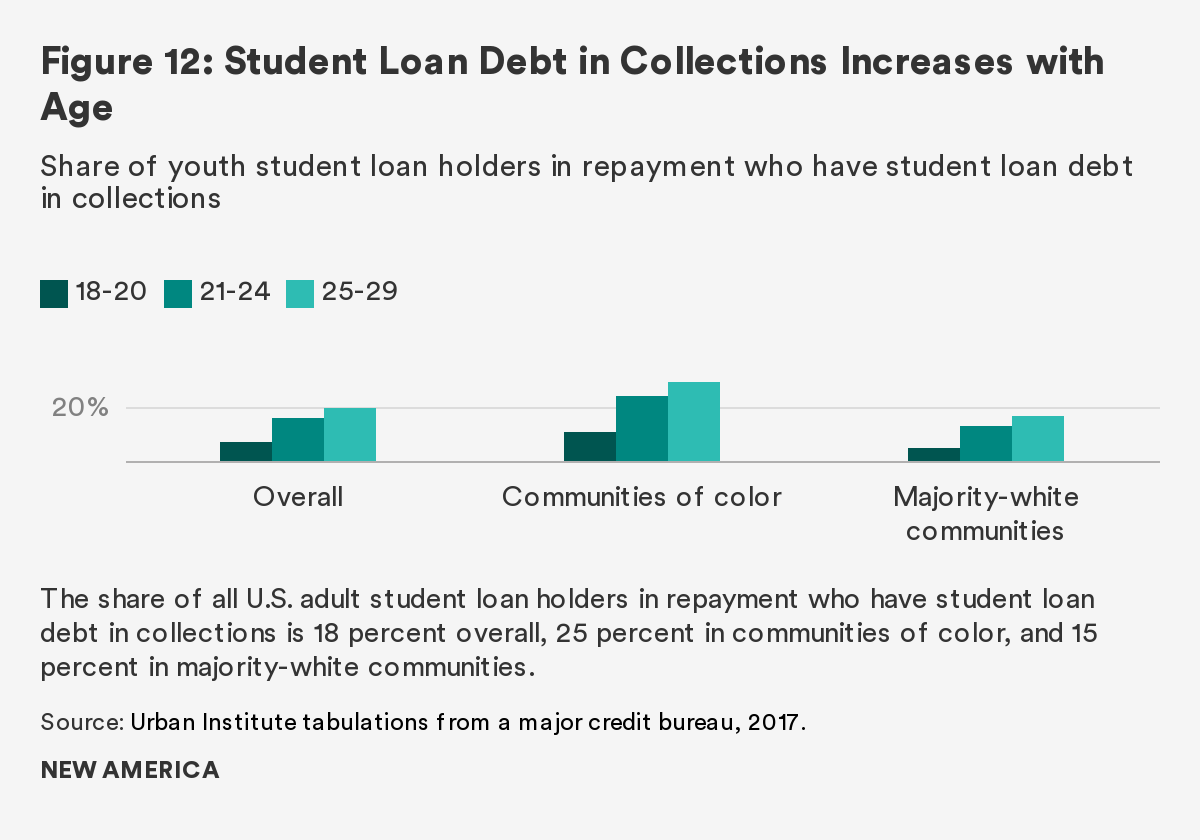
The data clearly reflect that Millennials are struggling to repay their student loans. Among student loan holders ages 25 to 29, one in five (20 percent) have student loan debt that is in collections (Figure 12).7 Again we see that student loan holders in communities of color are having more difficulty repaying these loans. Student loan repayment is particularly problematic for students who have student debt but have not finished their degrees (Baum et al. 2017), which tends to be those who have lower student debt balances but are more economically disadvantaged (Blagg 2018).
Millennial Wealth and Credit Health Have Broad Ramifications
Our survey of the Millennial balance sheet shows that this generation is on a very different trajectory for wealth building. Not only are young Millennials accumulating less wealth, but their debt holdings look fundamentally different. Specifically, the financial profile of Millennials generally includes less home equity and more student debt than those before them. This reflects a broadly distinct set of financial experiences for young Millennials that are very different both from their parents’ generation and from all adults in 2016. Examining credit bureau data from a private-sector credit bureau reveals additional insights, such as how Millennials’ credit health worsens as they move into their late 20s and that young Millennials in the South are more likely to have poor credit health.
Initial interactions with the financial and credit system can either set young Millennials up for success or place them in a precarious position later in life. This chapter’s findings suggest that age 21 to 24 is a critical period for potential interventions and that targeting resources to youth in the South could have a particularly meaningful impact. Credit health—especially debt in collections—has significant ramifications and is an important indicator for young adults to monitor because it can lower their credit scores. This, in turn, can make qualifying for a mortgage or other type of small business loan more difficult, and certainly more expensive. When people with poor credit do borrow, they are charged a higher interest rate and their purchases end up costing more. And poor credit doesn’t only affect one’s ability to borrow, but it can also have an impact on other areas of life. Credit report information can be used to determine eligibility for jobs, access to rental housing, and insurance premiums.
If the financial struggles of today’s Millennials lead to increases in wealth inequality down the line, it is an issue for everyone, since a strong, vibrant, and thriving middle class is a key ingredient for sustained economic growth (Stiglitz 2012). Inequality can weaken the economy, increase crime (Demombynes and Özler 2005), and result in a less educated population and more people needing help from the safety net. Wealth inequality is also a barrier to education and social mobility. Young people from high-wealth families are more than 1.5 times as likely to complete at least two or four years of college by age 25 as those in low-wealth families (Braga, McKernan, Ratcliffe, and Baum 2017). Among families in which parents did not graduate from college, young people from high-wealth families are roughly twice as likely to be upwardly mobile as those from low-wealth families (Braga et al. 2017).
If current trends continue, coming generations will be on shaky footing economically. A combination of policy, workplace programming, higher-education reform, and regulation targeting teens and young adults is warranted. One possible option is to offer child savings accounts or a variant, such as baby bonds, so that every young person starts out in life with assets and financial literacy associated with them (Huang et al. 2017; Sherraden, Clancy, and Beverly 2018; Berlin 2019). Progressive benefits targeted to low-wealth families could help reduce wealth inequality and relieve current disparities by geography, race, and ethnicity. In addition, proposals to make higher education more affordable, along with better advice and counseling as young people make postsecondary education decisions and take on student debt, would be helpful.
Another strategy is offering financial supports to young adults as they start their first jobs. This could include health insurance, automatic enrollment in savings plans, support in paying off student loan debt, and professional advice when making significant purchases, such as for a car or home. Identifying ways to intervene at key moments of financial transactions would make a difference, including real-time consultation and term negotiation with lenders when employees face serious life events, such as illness or job loss.
Although financial decisions are typically made at the individual or household level, recent disturbing trends among young Millennials offer evidence that more collective attention may be necessary. Lower wealth, rising student loan debt, and poor credit health make starting out in life more economically precarious. If a stronger foundation for economic security were institutionalized for all, it could make life better for young Millennials, future generations, and the country as a whole.
Acknowledgements
This research was funded in part by the Annie E. Casey Foundation. The views expressed are those of the authors and should not be attributed to the Urban Institute, its trustees, or its funders.
The authors thank Hannah Hassani and Kassandra Martinchek for their assistance in creating figures and providing helpful comments, and Reid Cramer for helpful edits and suggestions.
References
Baum, Sandy, Martha Johnson, Victoria Lee, Alexandra Tilsley, Elizabeth Forney, Daniel Matos, Hannah Recht, Vivian Hou, Ben Chartoff, and Jerry Ta. 2017. “Understanding College Affordability.” Washington, DC: Urban Institute.
Berlin, Loren. 2019, March 26. “Shrinking the Racial Wealth Gap without Focusing on Race: An Interview with the Kirwan Institute’s Darrick Hamilton.” Next50 (blog). Washington, DC: Urban Institute.
Brevoort, Kenneth, Philipp Grimm, and Michelle Kambara. 2015. “Data Point: Credit Invisibles.” Washington, DC: Consumer Financial Protection Bureau.
Brevoort, Kenneth and Michelle Kambara. 2017. “Data Point: Becoming Credit Visible.” Washington, DC: Consumer Financial Protection Bureau.
Blagg, Kristin. 2018. “Underwater on Student Debt: Understanding Consumer Credit and Student Loan Default.” Washington, DC: Urban Institute.
Braga, Breno, Signe-Mary McKernan, and Hannah Hassani. 2019. “Delinquent Debt Decisions and Their Consequences Over Time.” Washington, DC: Urban Institute.
Braga, Breno, Signe-Mary McKernan, Caroline Ratcliffe, and Sandy Baum. 2017. “Wealth Inequality Is a Barrier to Education and Social Mobility.” Washington, DC: Urban Institute.
Choi, Jung Hyun, Jun Zhu, Laurie Goodman, Bhargavi Ganesh, and Sarah Strochak. 2018. “Millennial Homeownership: Why Is It So Low, and How Can We Increase It?” Washington, DC: Urban Institute.
Consumer Financial Protection Bureau. 2019. “Market Snapshot: Third-Party Debt Collections Tradeline Reporting.” Washington, DC: CFPB.
Demombynes, Gabriel and Berk Özler. 2005. “Crime and Local Inequality in South Africa.” Journal of Development Economics, 76(2): 265-292.
Elliott, Diana, and Ricki Granetz Lowitz. 2018. “What Is the Cost of Poor Credit?” Washington, DC: Urban Institute.
Huang, Jin, Margaret S. Sherraden, Margaret M. Clancy, Michael Sherraden, and Trina Shanks. 2017. “Start Lifelong Asset Building with Universal and Progressive Child Development Accounts.” Cleveland, OH: American Academy of Social Work & Social Welfare, Grand Challenges for Social Work Initiative.
McKernan, Signe-Mary, Caroline Ratcliffe, Margaret Simms, and Sisi Zhang. 2014. “Do Racial Disparities in Private Transfers Help Explain the Racial Wealth Gap? New Evidence from Longitudinal Data.” Demography, 51(3).
McKernan, Signe-Mary, Caroline Ratcliffe, C. Eugene Steuerle, Emma Kalish, Caleb Quakenbush, Tim Meko, Serena Lei, Ben Chartoff, and Fiona Blackshaw. 2017, October 5. “Nine Charts About Wealth Inequality in America (Updated).” Washington, DC: Urban Institute.
McKernan, Signe-Mary, Genevieve M. Kenney, and Robert Abare. 2017, March 1. “Why do a Larger Share of Millennials and Gen X Have Past-due Medical Debt than Older Americans?” Urban Wire (blog). Urban Institute.
Ratcliffe, Caroline, Signe-Mary McKernan, Cary Lou, Hannah Hassani, and Caleb Quakenbush. 2018, December 13. “Debt in America: An Interactive Map.” Washington, DC: Urban Institute.
Sherraden, Michael, Margaret M. Clancy, and Sondra G. Beverly. 2018. “Taking Child Development Accounts to Scale: Ten Key Policy Design Elements.” St. Louis, MO: Washington University, Center for Social Development.
Stiglitz, Joseph E. 2012. The Price of Inequality: How Today’s Divided Society Endangers Our Future. New York: W.W. Norton & Co.
Citations
- The views expressed are those of the authors and do not necessarily reflect those of their affiliated institutions: the Urban Institute (Signe-Mary McKernan), Consumer Financial Protection Bureau (Caroline Ratcliffe), and the University of Michigan (Trina Shanks).
- Wealth is what you own (the sum of all your assets) minus what you owe (the sum of all your debts).
- The credit bureau data do not have information on consumers’ race. The racial makeup of the individuals’ communities of residence provides information about the characteristics of where they live, but it can also be viewed as a proxy for the person’s race. Communities of color are defined as those where at least half of the residents are people of color.
- Analyses also show differences by the economic status of communities. People in low-income (versus higher-income) neighborhoods are less likely to enter the credit system from an account that someone else is responsible for (e.g., as an authorized user on a parent’s credit card) and more likely to enter because of unpaid bills that are sent to collections (Brevoort and Kambara 2017).
- The Consumer Financial Protection Bureau report finds that 78 percent of third-party debt collections trade lines were for medical, phone, or utility bills.
- The shares for people in Generation X (ages 35–50) and the Baby Boom generation (ages 51–64) are 26 percent and 20 percent, respectively (McKernan, Kenney, and Abare 2017).
- Student loan debt that is in collections is also in default by definition, but not all student loans in default are in collections.