Table of Contents
How the Model Works
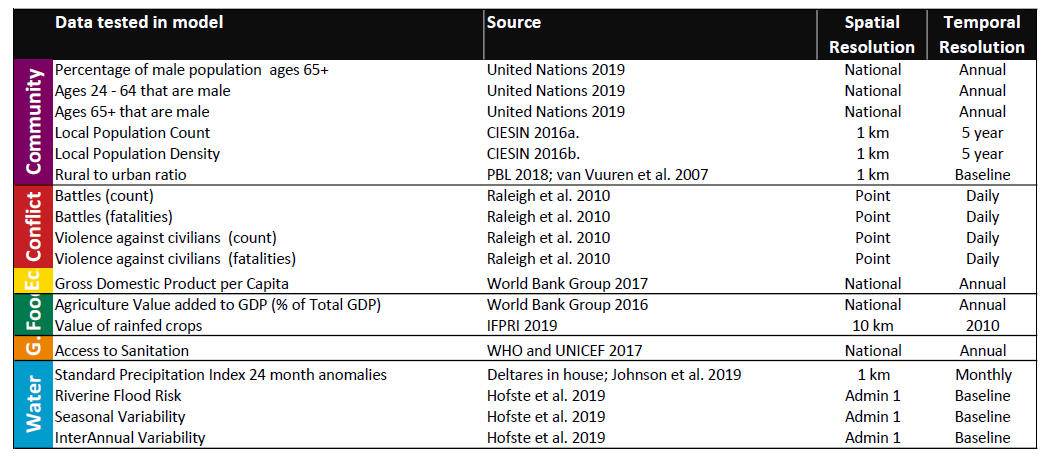
As noted, the Water, Peace and Security research team collected and reconciled a large number of indicator datasets across a wide range of topics, all reaching back to at least the early 2000s. For every month in each administrative district, we paired indicator values at that place and time with the absence or presence of conflict events over the following year, as recorded in ACLED: the Armed Conflict Location Event Database.1 In this way, the data explicitly link conditions with outcomes.
We then used these samples—each corresponding to a single month in a single district—to train predictive models, in a process known as supervised machine learning.2 In such a process, a model "learns" from training samples by comparing its predictions with actual outcomes and then adjusting itself slightly whenever a prediction is wrong. With enough samples and iterations, the model can come to recognize and replicate the underlying patterns between inputs and outputs. A successful model can then make useful predictions, such as forecasting future outcomes based on present conditions, where only the input values are known.
A key step was selecting which of the available datasets to actually utilize for making predictions because, for both technical and practical reasons, using all of the available indicators was undesirable. But since a guiding philosophy of the project was to let the data speak for themselves, we did not want to simply impute importance to certain selected indicators. Accordingly, we used a strictly quantitative process known as recursive feature elimination3 to identify the datasets that were most effective for predicting the absence or presence of conflict, without any regard for or knowledge of which datasets represented which indicators or what societal dynamics.
The results support the notion that conflict is linked to a broad range of factors and dynamics. There is wide acknowledgement that a history of conflict in an area is strongly correlated with conflict in the future, but much weaker consensus beyond that. The impact of factors like agricultural practices or population distribution and, most saliently for this project, the role of water have not been adequately investigated. Our algorithm identified several water-related indicators as highly predictive of conflict (though note that our research is looking only at correlation, not causation).
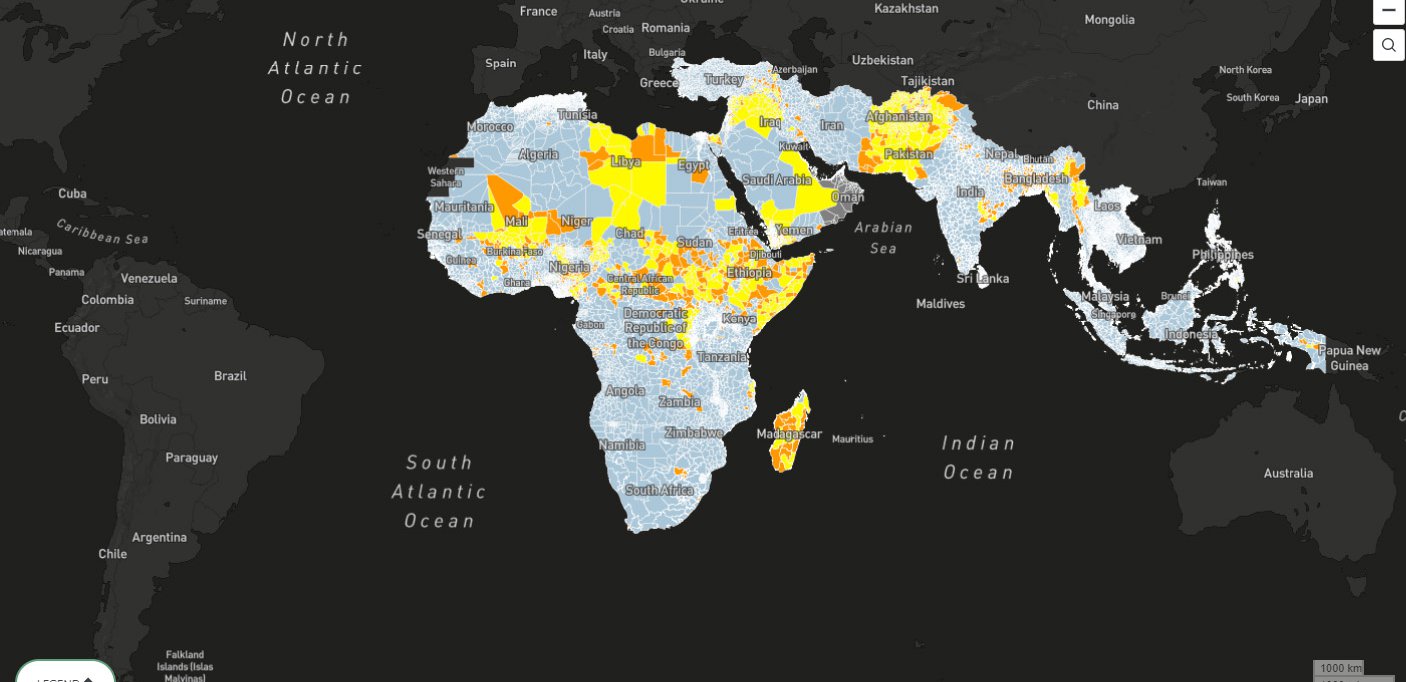
The tool provides the opportunity to explore the full range of datasets and topics, independently or in combination, in conjunction with both model predictions and historical conflict events. The select inputs to the model are available, as well as all of the quantitative indicators and various contextual geospatial datasets, from roadways to surface reservoirs.
Citations
- Clionadh Raleigh, Andrew Linke, Håvard Hegre, and Joakim Karlsen, “Introducing ACLED-Armed Conflict Location and Event Data,” Journal of Peace Research 47, no. 5 (2010): 651–60. All data, as well as extensive documentation, are publicly available at source.
- For a simple description of supervised machine learning and how it differs from other types of machine learning, see source.
- To learn a bit more about recursive feature elimination, see source. Note that we did not utilize cross-validation because of the time series-like nature of the data.