
Chapter 3: The Harm Done
In the 2000–2001 school year, the 339 schools examined in this paper met, on average, nearly three-quarters of the financial need of student aid recipients on their campuses. By 2016–2017, they met only about two-thirds, with a number of schools meeting far less (see Figure 21). The overall pattern generally follows the chronology set out in the last chapter, when comparing the growth of need-based and non–need-based aid year to year and over the time period.

Before the Financial Crisis: 2001–2006
As need-based aid grew faster than merit aid for relatively affluent students in the early years of this period, public universities met an average of 70 percent or more of the financial need of their student-aid recipients from 2001–2004. But as the momentum shifted to helping non-needy students, the percentage dipped slightly to 68 percent by 2005–2006.
During the Financial Crisis and Flagging Recovery, 2007–2013
In the face of the financial crisis, the schools’ spending on need-based aid increased and the average share of financial need met trended back up, showing that the shift was not entirely illusory. But non–need-based aid began to make a comeback by the end of the period, and the average share of financial need met dipped again.
The New Reality, 2014–2017
With non–need-based aid growing faster than need-based aid for much of this period, the average share of financial need met stayed stuck at its lowest point of 66 percent. The only surprising thing is that it did not drop further.
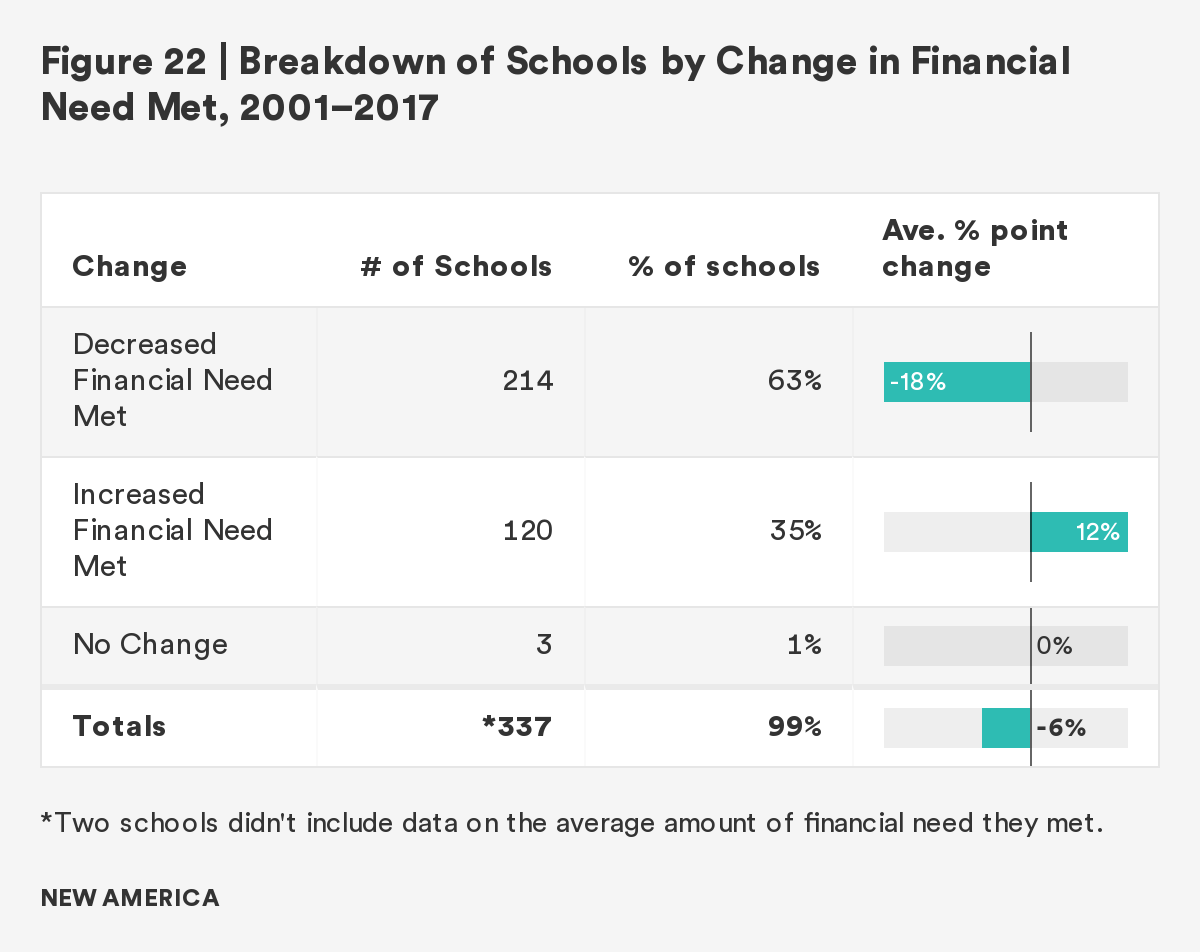
At the institution-level, the analysis found that 214 schools, or 63 percent of the institutions, reduced the share of financial need they met by an average of 18 percentage points during the 17-year period (see Figure 22).
The Financial Need Met Measure
In the data they provide to college guidebook and rankings publishers like Peterson’s and U.S. News & World Report, colleges annually disclose the average percentage of financial need they meet of their student aid recipients. While some of the richest and most elite schools meet students’ full need, the overwhelming majority meet a smaller share. In 2016–2017, only four public universities—Minot State University in North Dakota, the State University of New York Polytechnic Institute, the University of North Carolina at Chapel Hill, and the University of Virginia—reported meeting 100 percent of need.
But how is a student’s financial need at a given college determined?
A student must first fill out the Free Application for Federal Student Aid, known as the FAFSA. The federal government uses the financial information that the student and his or her family provide to calculate that student’s “expected family contribution.” The EFC is the amount of money that the federal government believes that the family can afford to pay for college.
The next important variable is the annual cost of attendance (COA) at the college the student wants to attend. The cost of attendance includes tuition, fees, room and board, books, and other expenses.
The student’s financial need equals the COA minus the EFC. For example, if the cost of attendance is $40,000 and the student’s EFC is $10,000, then that student’s need is $30,000. If the school meets the student’s full financial need, it will cover that amount with federal, state, and institutional grants and loans. Most, however, will leave students with some unmet need.
In 2016–2017, the public universities included in this report met an average of 66 percent of the financial need of their student aid recipients. Using the example above, they would cover approximately $19,800 of the student’s need, leaving that individual with a financial gap of $10,200. The student could cover that shortfall by using his or her earnings from working while enrolled, by taking out additional debt, or by doing both. There are two options for taking out additional debt: either the student can have his or her parents secure an expensive federal PLUS loan or can borrow a private loan, which typically comes with worse terms than a federal loan and with fewer consumer protections.
Neither option is ideal for students coming from families annually earning $40,000 or less. For these students and their families, taking on this additional debt is a very risky proposition.
The downward shift in the average share of financial need that public universities met from 2000-01 to 2016-17 has been substantial (see Figure 23).
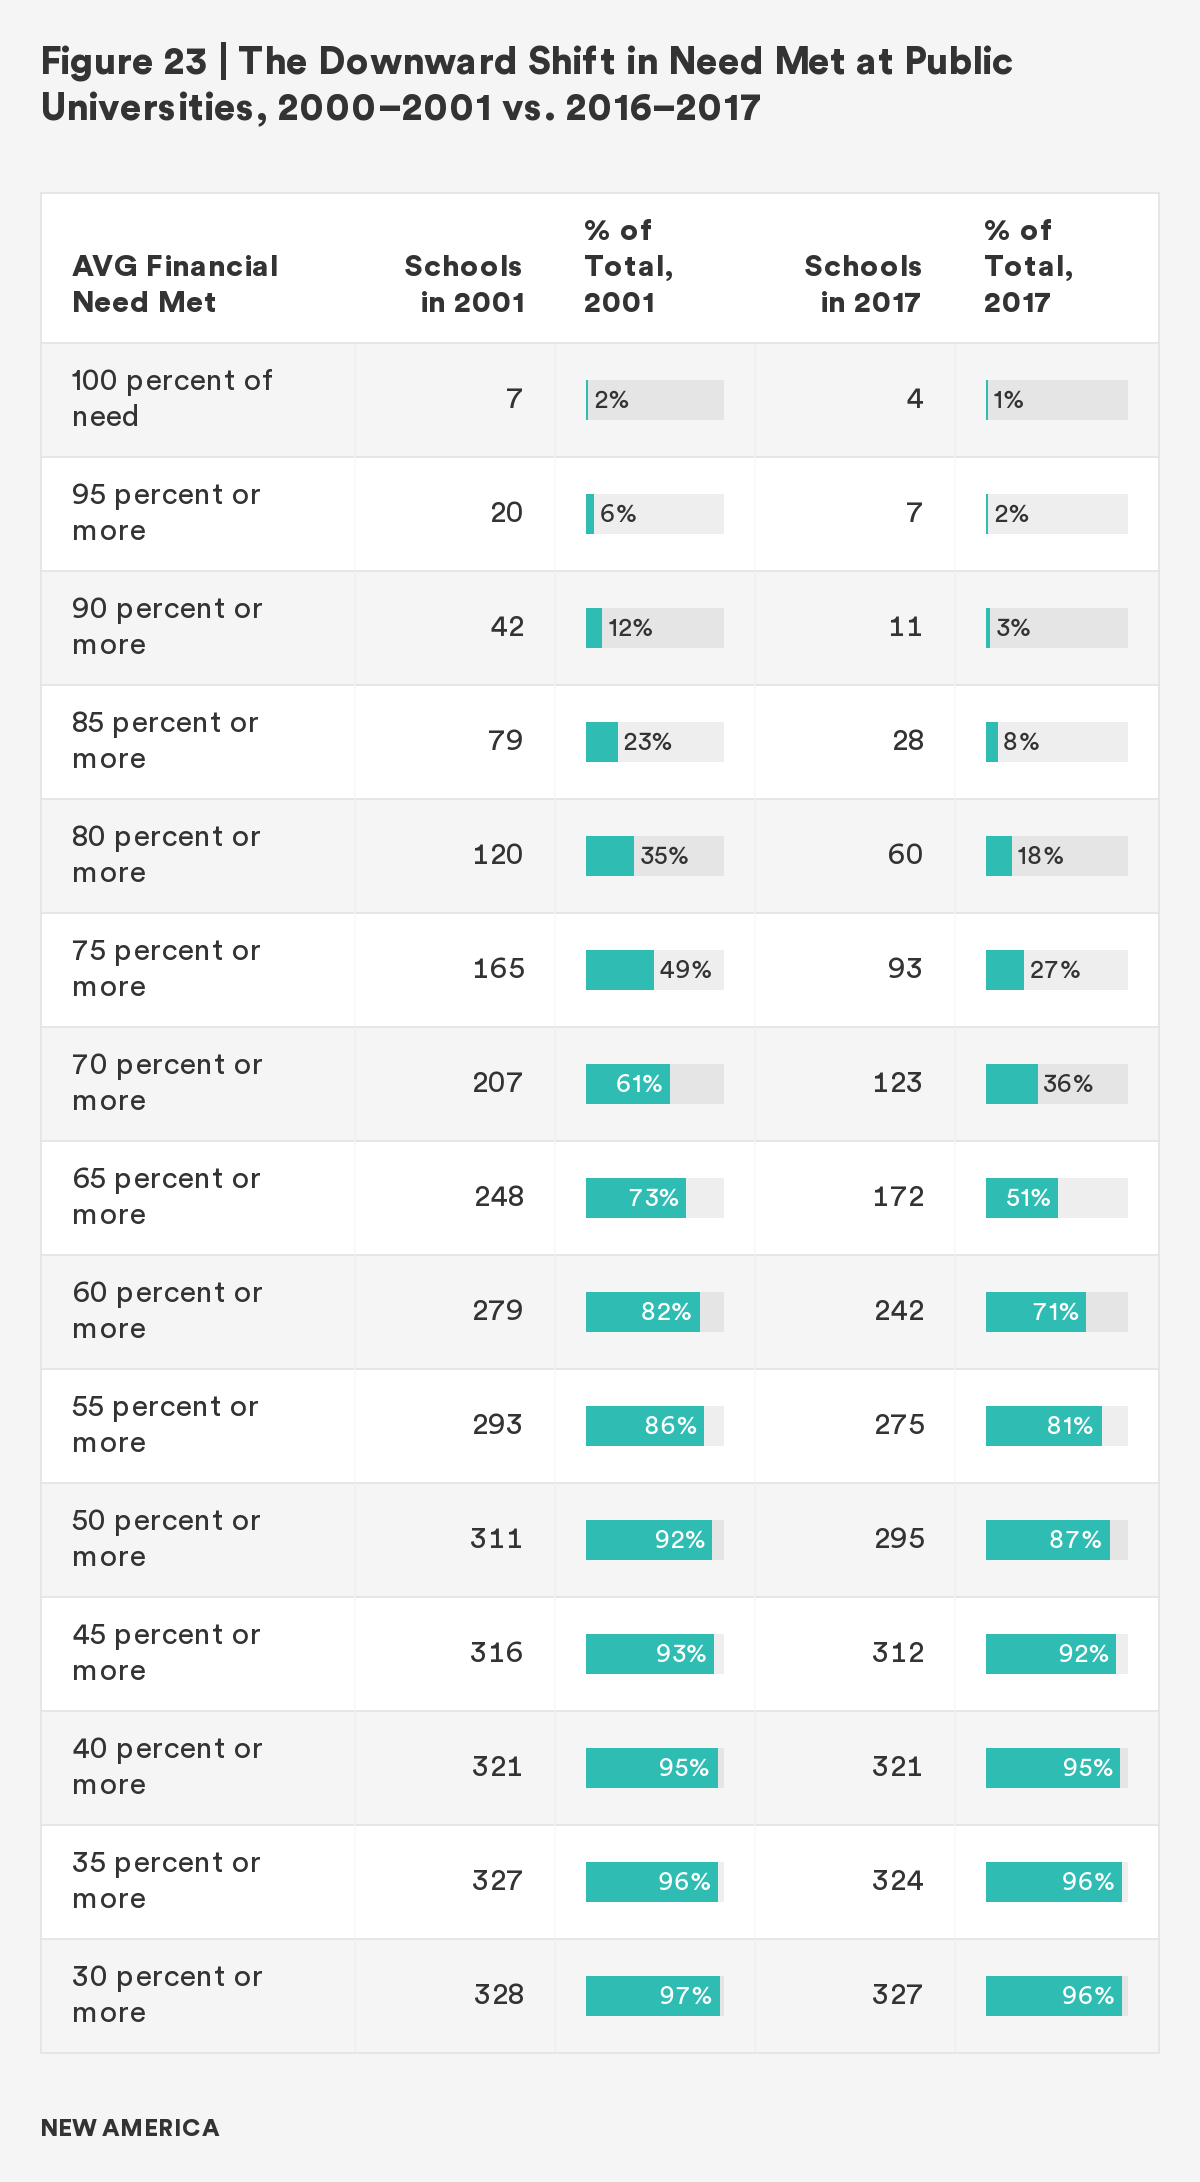
Between 2000-2001 and 2016-2017:
- The number of public universities meeting at least 85 percent of their student-aid recipients’ financial dropped from 79, or nearly one-quarter of the institutions, to 28, or just 8 percent.
- The number meeting at least 75 percent fell from 165, or nearly half of the schools, to 93, or just over one-quarter.
- The number meeting at least 65 percent fell from 248, or nearly three-quarters of the schools, to 172, or just over half.
It is very likely that the spread of enrollment management and the merit-aid arms race played a big part in driving those numbers down so dramatically. However, these data on their own do not provide enough information to make that conclusion. With state disinvestment pushing schools to increase their prices, and family income in decline, it is not surprising that many schools were not able to cover as much of their students’ financial need as they had previously.
And in fact, when looking at the financial need met data more closely, the analysis found that it did not matter whether individual schools increased or decreased the amount of non–need-based aid they spent from 2000-2001 to 2016-2017. Both sets of schools reduced the share of financial need that they met (see Figure 24).
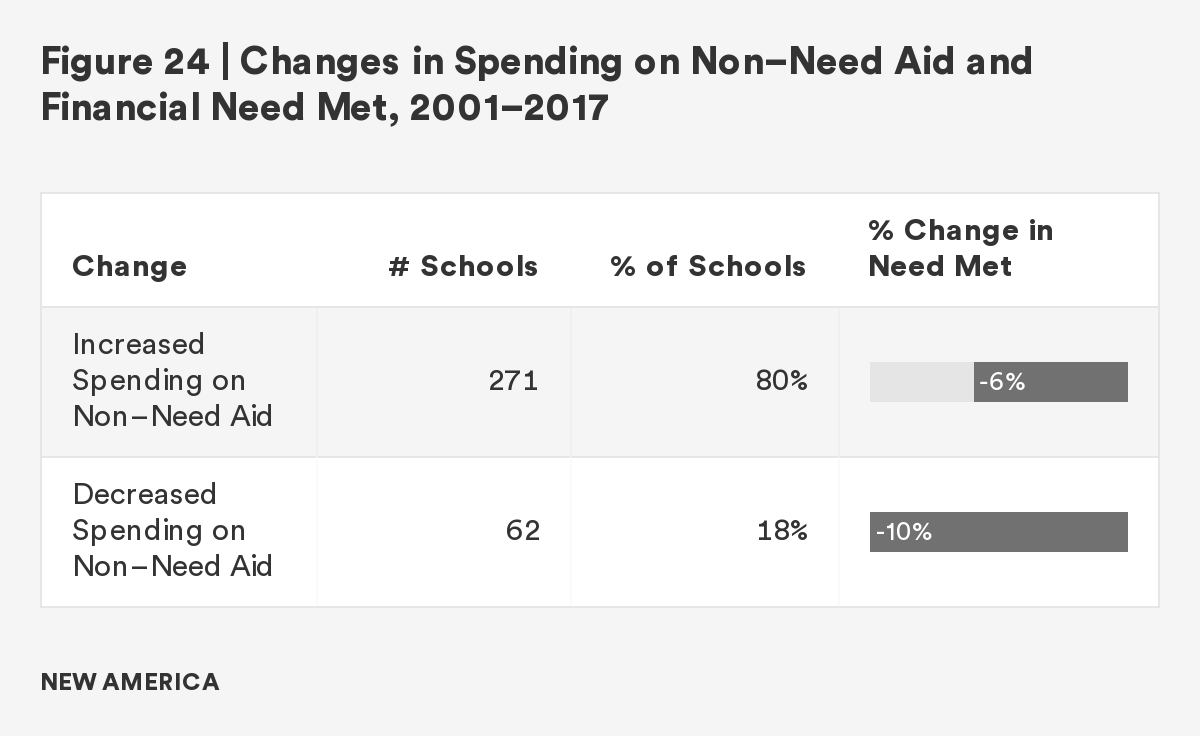
Clearly, there was not a direct relationship between the two variables. Schools that increased their spending on non–need-based aid did not automatically reduce the share of financial need they met. Other factors were at work.
What the analysis did find, however, was that schools that predominantly used their institutional aid to provide scholarships or discounts to relatively affluent students in 2016–2017 appeared to leave financially needy students with larger funding gaps than those that primarily used their aid to meet need. In looking for a relationship with the financial need met figures, the key element was not the amount of money that schools spent on non–need-based aid or whether that amount went up or down, but how big a share of the school’s aid budget that spending represented (see Figure 25).

For example, in 2016–2017:
- Schools that spent more than half of their aid on non-needy students met, on average, 62 percent of the financial need of their student aid recipients, while schools that spent less than half met, on average, 68 percent.
- Schools that spent three-quarters or more of their aid on non-needy students met, on average, 59 percent of the financial need of their student aid recipients, while schools that spent one-quarter or less met, on average, 68 percent.
- Schools that spent 90 percent or more of their aid on non-needy students met, on average, 58 percent of the financial need of their student aid recipients, while schools that spent 10 percent or less met, on average, 70 percent.
Enrollment management has encouraged more and more public universities to adopt the high-tuition, high-aid policies of their private college counterparts. By raising their sticker prices, the schools can provide larger non–need-based discounts and scholarships to enroll the students they most desire. As a result, low-income and other financially needy students are left with larger funding gaps.
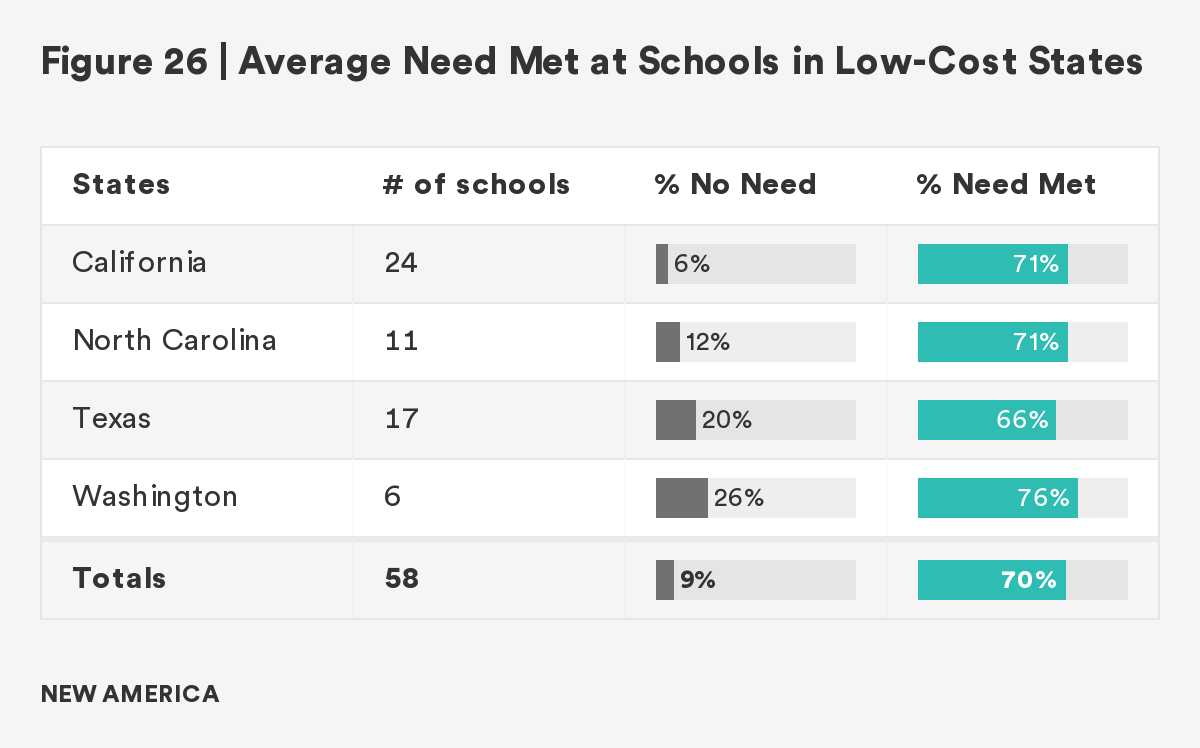
To test out this theory, the analysis looked again at the 58 public universities and state colleges in the four states—California, North Carolina, Texas, and Washington—that have kept their prices relatively low for in-state students, and generally do not participate in the merit-aid arms race. As a group, these schools met a higher level of the financial need (70 percent) of their student aid recipients in 2016–17 than those in the other 46 states combined (65 percent) met (see Figures 26 and 27).

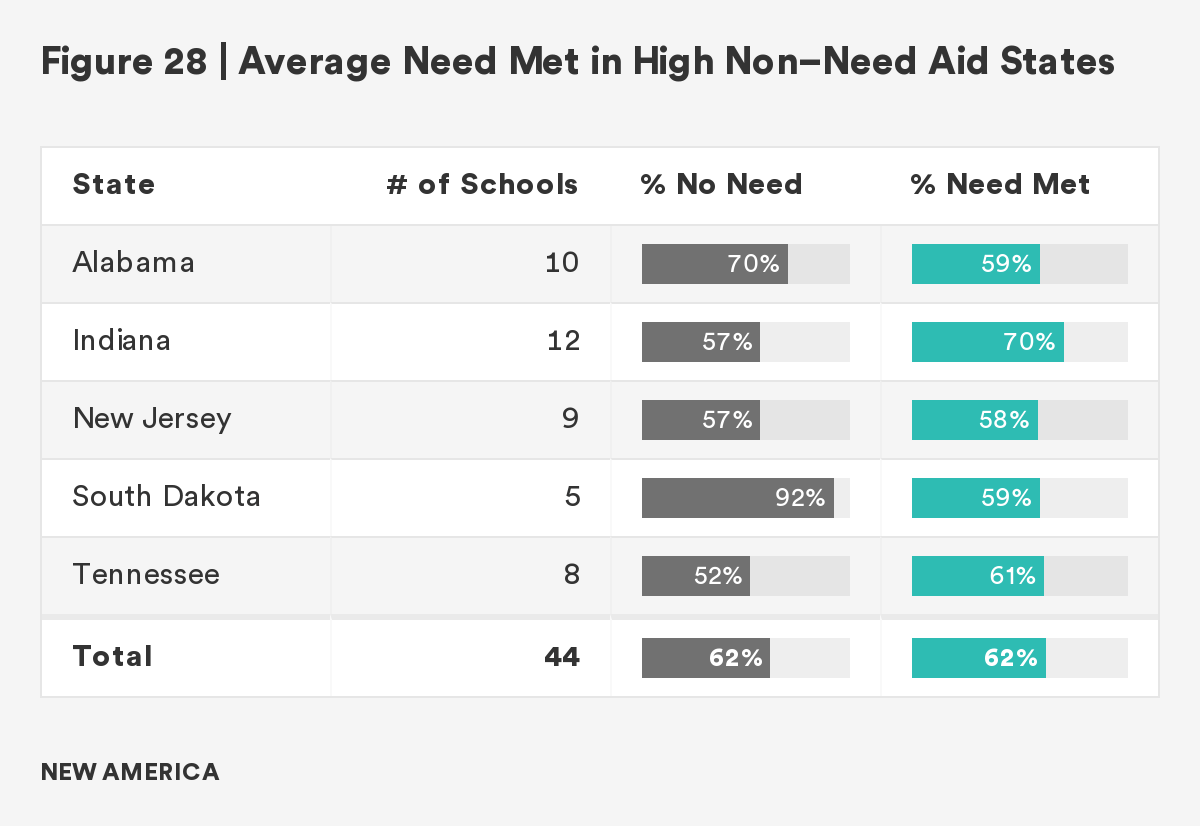
In contrast, there are 44 schools in five states—Alabama, Indiana, New Jersey, South Dakota, Tennessee—that are especially heavily involved in the merit-aid arms race. As a group, these schools spent an average of 62 percent of their aid funds on students who lacked financial need and they met just 62 percent of the financial need of their student aid recipients (see Figure 28). (Indiana was an exception, meeting 70 percent of need.)
Colleges that leave low-income and working-class students with large funding gaps add hurdles that could stymie the educational progress of these students. Many students feel they have no choice but to work long hours at jobs off campus, making it more difficult for them to complete assignments. Some choose to attend part-time, and others may “stop out,” leaving school with the hope they will return at some future point. Most who remain in school have to take on large amounts of debt to fill the gaps, including risky private loans that tend to come with higher interest rates and fewer consumer protections than federal loans.
That certainly seems to be the case here, as the data suggests that among college seniors at public universities, a larger share graduated with debt and took on heavier debt loads at schools that primarily spent their aid on non-needy students than at schools that predominantly used their aid to fill financial need (see Figure 29).
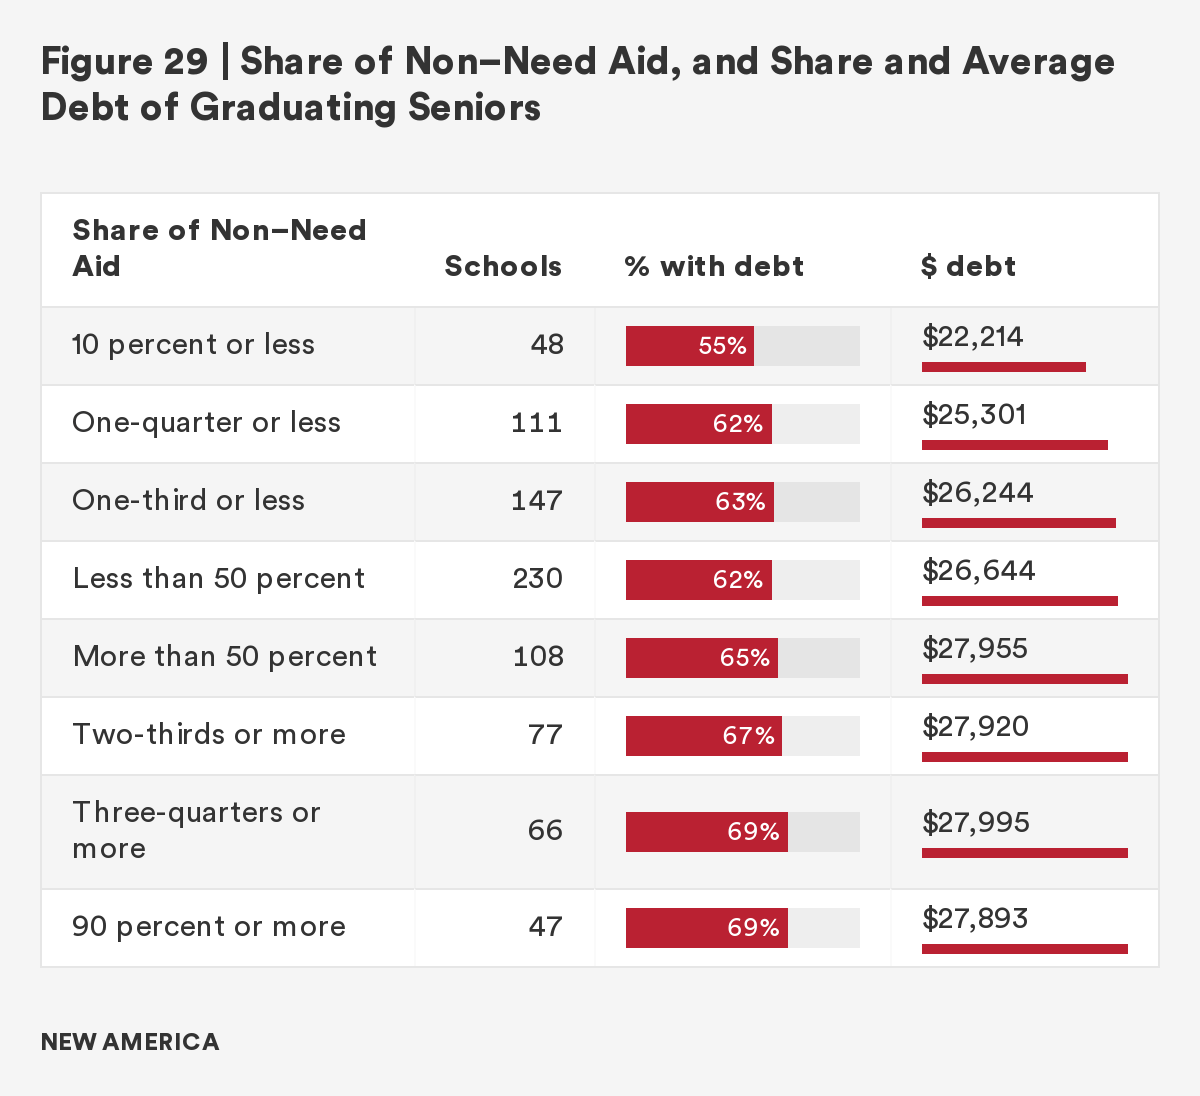
For example, in 2016–2017:
- At schools that spent more than half of their aid on relatively affluent students, about 65 percent of graduating seniors borrowed, with an average debt of $27,955. In comparison, at institutions that spent less than half of their aid budget on those students, 62 percent borrowed and had an average debt of $26,644 .
- At schools that spent three-quarters or more of their aid on students without financial need, 69 percent of graduating seniors borrowed, with an average debt of $27,995. In contrast, at institutions that spent one-quarter or less of their aid on those students, 62 percent borrowed and had an average debt of $25,301.
- At schools that spent 90 percent or more of their aid on non-needy students, 69 percent of graduating seniors borrowed with an average debt of $27,893 . In comparison, at institutions that spent 10 percent or less of their aid on those students, 55 percent borrowed, with an average debt of $22,214
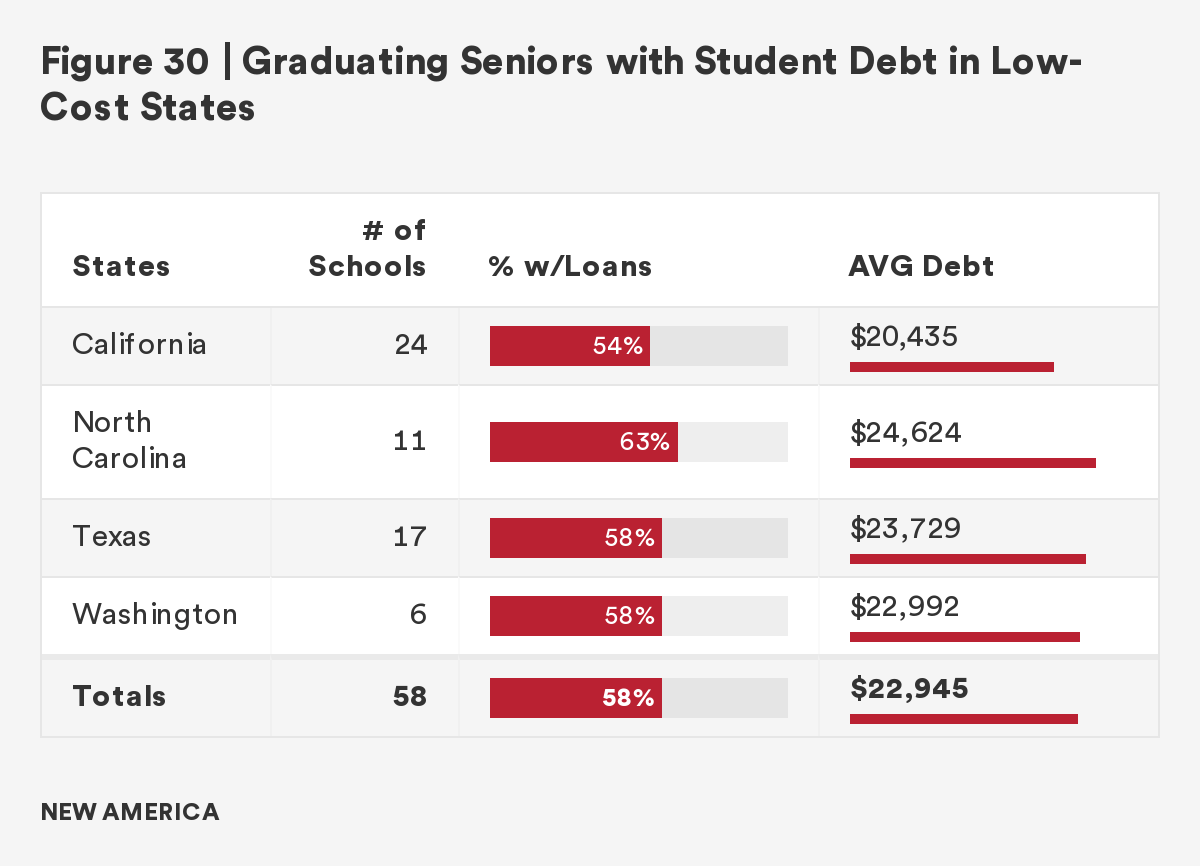
At the 58 schools in the four states that have kept their prices low and have generally not participated in the merit-aid arms race, 58 percent of seniors graduated with debt averaging $22,945 in 2016–2017 (see Figure 30).
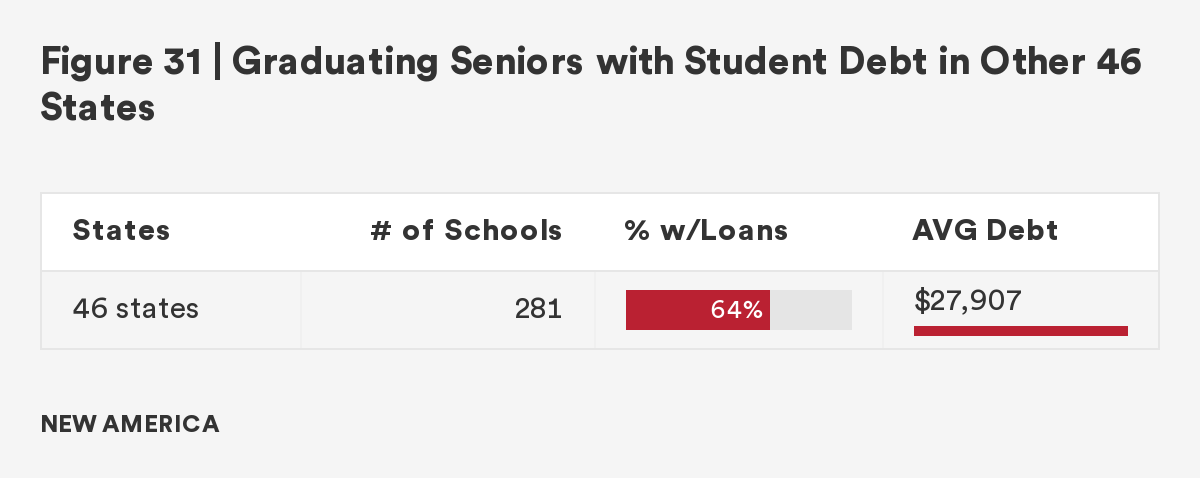
That compared with 64 percent of graduating seniors at public universities in the other 46 states combined. Those students completed college with an average debt of $27,907 (see Figure 31).
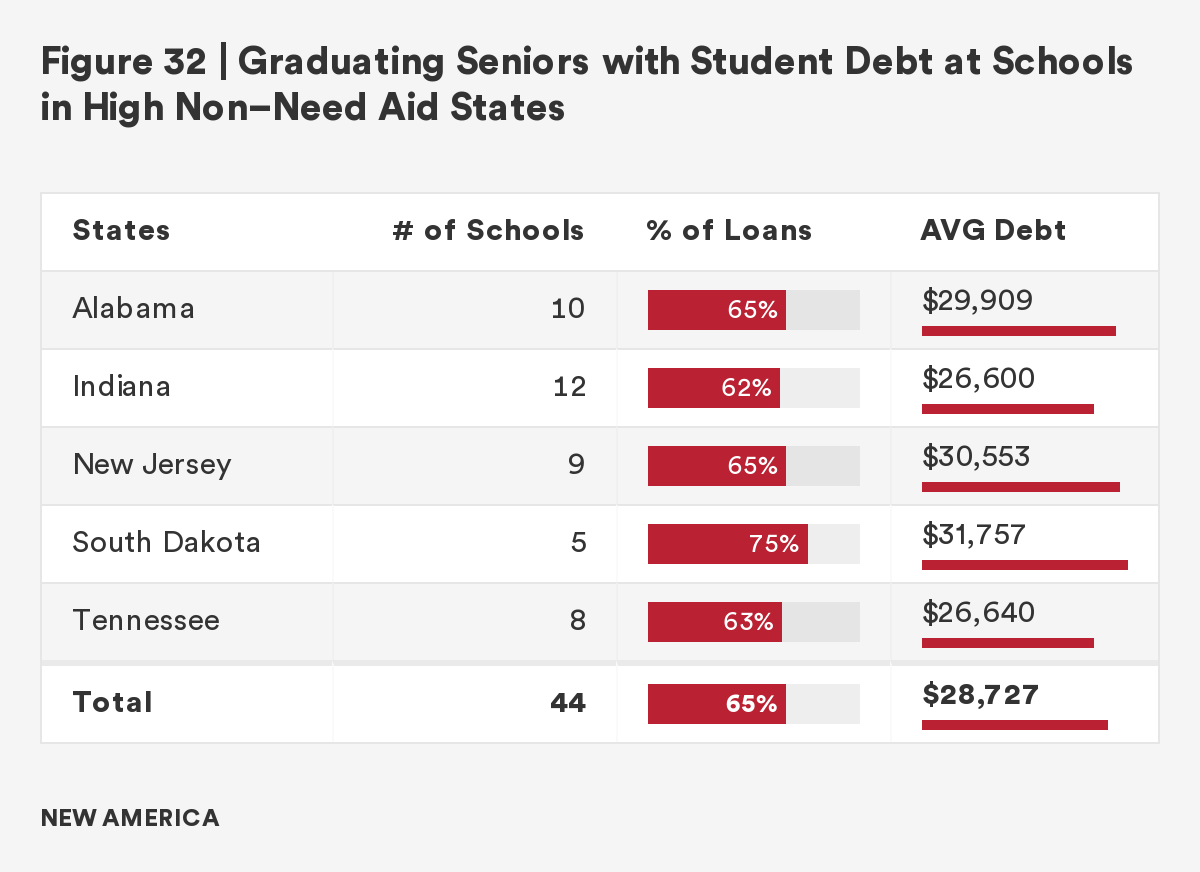
Meanwhile, at the 44 schools in the five states that have a large number of public universities heavily involved in the merit-aid arms race, 65 percent of seniors graduated with debt averaging $28,727 (see Figure 32).
The high-tuition, high-aid policies that more and more public universities are adopting under the sway of enrollment management are putting low-income and working-class students under considerable financial pressure. And the debt figures very likely understate the problem, as they represent those who have successfully completed their programs and are better able to repay their loans. There is little information about the financial pressures faced by those who are lost along the way—those who drop out and must repay their debt without the benefit of having a college degree.
At a time of ever-growing inequality in this country, this country needs its public universities to be engines of opportunity once again.