
Table of Contents
- Frequently Asked Questions
- Moving Forward: Voices from the Field
- Introduction
- Landscape of Early Care and Education Financing
- Current Financing for Early Care and Education: Financing a Highly Qualified Workforce
- Current Financing for Early Care and Education: Affordability & Equitable Access
- Current Financing for Early Care and Education: Ensuring High Quality Across Settings
- Estimating the Cost of High-Quality Early Care and Education
- A Vision for Financing Early Care and Education
- Behind the Numbers
- Putting it into Context
- Learning from States and Other Countries
- Tools and Resources
- Graphics and Data Visualization
- Glossary
Putting it into Context

Under its current system of funding, the United States is not investing enough to consistently provide adequate access and secure quality in early childhood services. According to the Center for the Study of Child Care Employment, “as estimates are used to inform policy and revenue strategies, it is necessary for policymakers and the public to understand the distance between the current system and the system that is needed and to be able to design short- and long-term goals to close the gap.” The Transforming the Financing of Early Care and Education report presents a cost model that would close that gap.
Putting the Cost Estimate into Context
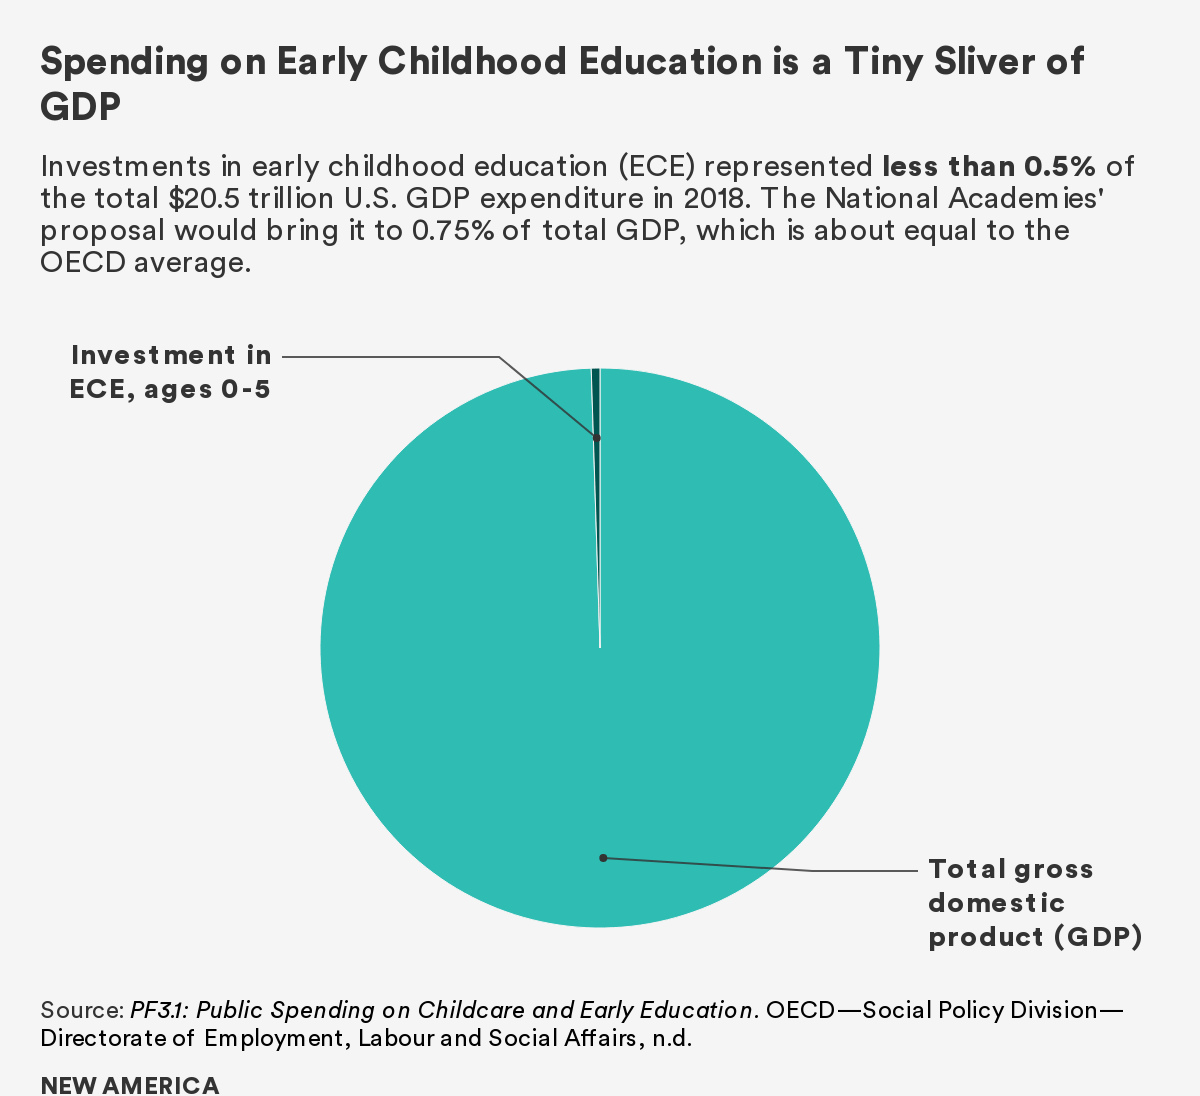
While the estimated $140 billion price tag may seem high, these numbers are not out of line with other indicators of investment in early education as measured through shares of the gross domestic product (GDP) in Organisation for Economic Co-operation and Development (OECD) countries. In addition, when the current cost of ECE and the amount that families will pay in the harmonized system are taken into account, the total price is between $53 billion and $82 billion over current public/private expenditures (see Chapter 6 for an in-depth analysis).
Comparing domestic and international practice as measured through shares of GDP
- U.S. GDP
- In 2018, it was $20.5 trillion. According to the OECD, the U.S. puts less than 0.5 percent of this toward ECE. When the transformation to a harmonized system of high-quality care and education is complete, the projected $140 billion needed to support the system equals a share of less than 1 percent (0.75 percent) of total GDP.
- OECD GDP
- The U.S. spends less than half the average of what other industrialized countries pay for quality ECE. The OECD and the European Union suggest that 1 percent of GDP should be spent on ECE services. While there is variability—France, New Zealand, and the Nordic countries spend 1 percent or more—on average, OECD countries spend about 0.8 percent of GDP on ECE. Contributing less than 0.5 percent, the U.S. joins countries that spend below this average, such as Japan, Portugal, and Turkey.
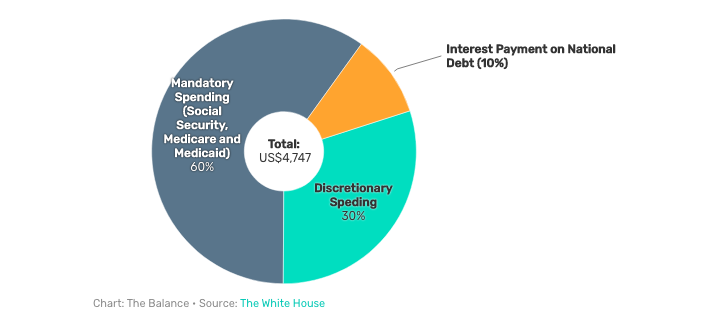
Breaking down current U.S. federal budget
- Current U.S. spending for 2019–2020 (10/1/19–9/30/20) = $4.7 trillion, representing 21.6 percent of GDP
- Mandatory spending = $2.98 trillion/60 percent of budget
- Social Security: $1.1 trillion
- Medicaid: $447 billion
- Medicare: $694 billion
- Other: $744 billion (food stamps, unemployment compensation, child nutrition, child tax credits, SSI, and student loans)
- Discretionary spending = $1.4 trillion/30 percent (includes defense/military, education, energy, interest on the national debt)
- Military/Defense = $936 billion
- Health & Human Services = $105.8 billion
- Other discretionary spending = $396 billion
- Interest on the national debt: $376 billion/10 percent (the debt currently amounts to $18 trillion)
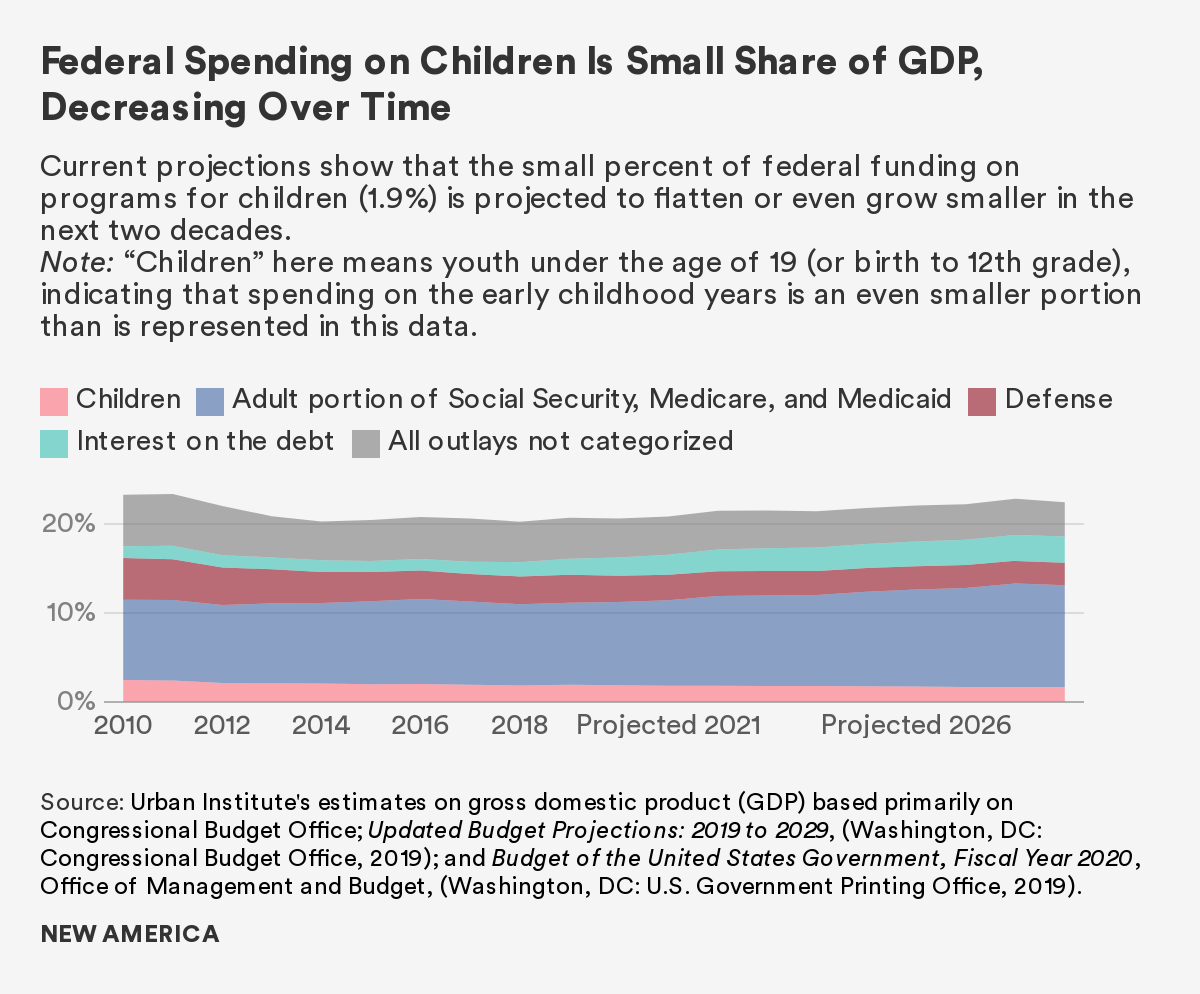
Examining our spending on children
Public spending on children aims to support their healthy development and help them fulfill their human potential, which makes federal spending on them an investment in the nation’s future. To inform policymakers, children’s advocates, and the general public about how public funds are spent on children, the annual Kids’ Share report provides an analysis of these federal expenditures. It also projects federal expenditures on children through 2029 to give a sense of how budget priorities may unfold absent changes to current law. Some highlights:
- In 2018, the federal government spent about $6,200 per child younger than 19, less than in 2017 after adjusting for inflation. This decline is driven by a reduction in federal spending on education and nutrition programs and a temporary reduction in child-related tax credits.
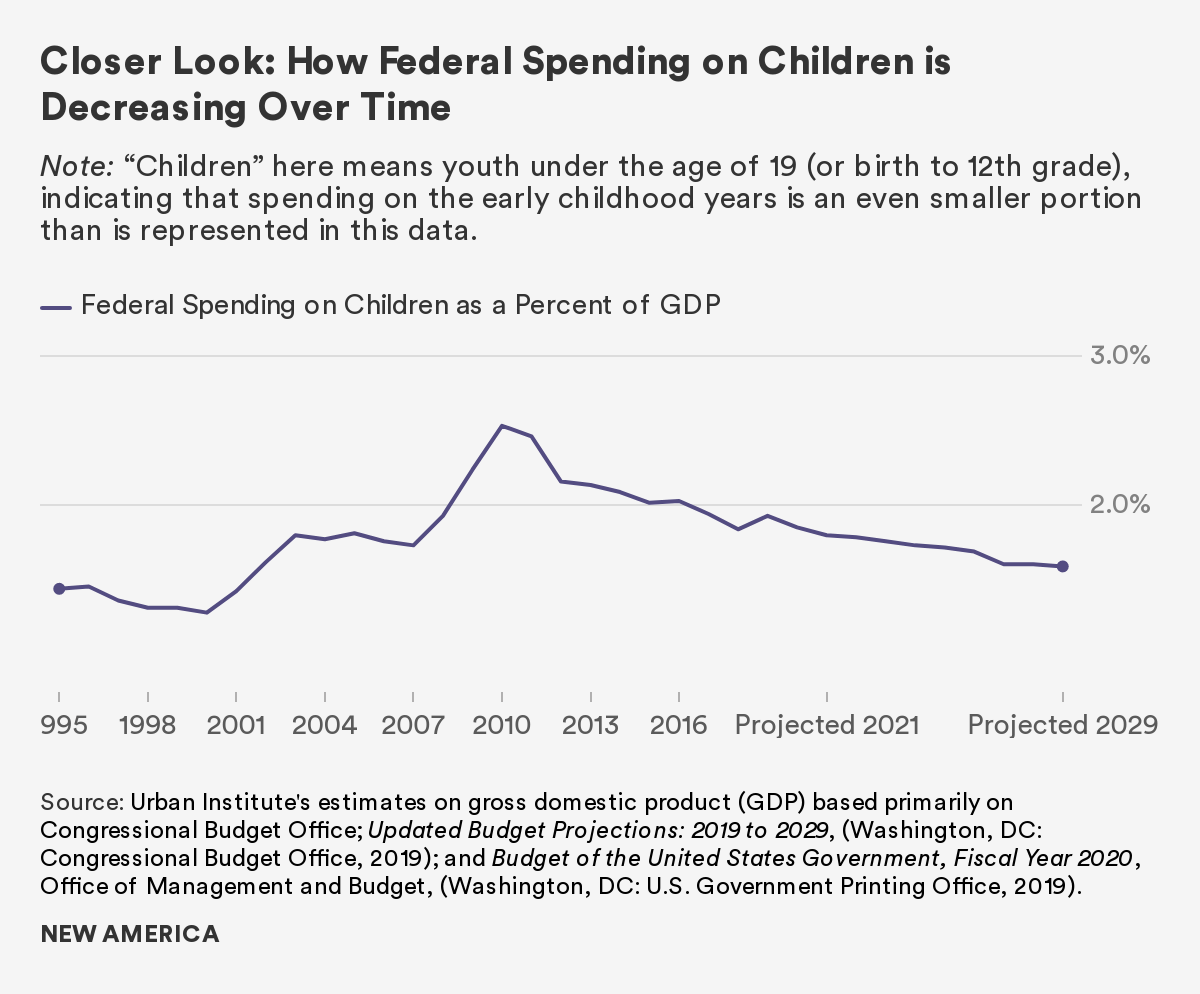
- As a share of the economy, federal investments in children fell to 1.9 percent of GDP in 2018, the lowest level in a decade.
- Medicaid is the largest source of federal support for children, followed by the child tax credit and the earned income tax credit. More than three-fifths of federal expenditures on children are from health or tax provisions.
- The share of federal expenditures for children targeted to low-income families has grown over time, reaching 61 percent in 2018.
- Children’s programs are projected to receive only 3 cents of every dollar of the projected $1.5 trillion increase in federal spending over the next decade.
- Assuming no changes to current law, the children’s share of the budget is projected to drop from 9.2 percent to 7.5 percent over the next decade, as spending on Social Security, Medicare, Medicaid, and interest payments on the debt consume a growing share of the budget.
- By 2020, the federal government is projected to spend more on interest payments on the debt than on children.
- Over the next decade, all categories of spending on children except health are projected to decline relative to GDP; most categories also see declines or remain at similar levels in real dollars.
- States and localities pay the major proportion of education expenditures; federal investment is projected to fall.
In comparing 2018 expenditures for K-12 education and early care and education, the Kids Share report found that:
- Education allocations = $41 billion
- Early care and education allocations = $15 billion
In addition, future spending on young children as a percentage of GDP is projected to fall relative to other investments:
See the Glossary for key word definitions.