

Table of Contents
- Frequently Asked Questions
- Moving Forward: Voices from the Field
- Introduction
- Landscape of Early Care and Education Financing
- Current Financing for Early Care and Education: Financing a Highly Qualified Workforce
- Current Financing for Early Care and Education: Affordability & Equitable Access
- Current Financing for Early Care and Education: Ensuring High Quality Across Settings
- Estimating the Cost of High-Quality Early Care and Education
- A Vision for Financing Early Care and Education
- Behind the Numbers
- Putting it into Context
- Learning from States and Other Countries
- Tools and Resources
- Graphics and Data Visualization
- Glossary
Abstract
In April 2015, the Institute of Medicine and the National Research Council released a seminal volume for the early childhood education field. Transforming the Workforce for Children from Birth through Age 8: A Unifying Foundation put forth a vision for shared knowledge and competencies for early care and education professionals, and laid out many principles for effective professional learning (pre-service and in-service). Transforming the Workforce’s “Blueprint for Action” called for significant shifts to revamp how teachers, leaders, and other professionals working with children birth through age eight are prepared, credentialed, and supported. One important component for enabling these shifts is increased, predictable, and sustainable funding of early care and education, which means a new vision for financing is needed.
In 2018, the National Academies of Science, Engineering, and Medicine published that new vision in its Transforming the Financing of Early Care and Education (birth through age 5). The Committee on Financing Early Care and Education with a Highly Qualified Workforce puts forth an ambitious vision for financing early care and education (ECE) with a well-prepared and well-compensated workforce. To make the 2015 Transforming the Workforce volume more accessible, New America produced Transforming the Early Education Workforce: A Multimedia Guidebook.
Below is the companion, Transforming the Financing of Early Care and Education: A Multimedia Guidebook, which pulls out key takeaways and ideas, elevates important concepts, and brings context to the dollar amounts discussed in the report. This multimedia guidebook is inspired by and drawn from the Transforming the Financing of Early Care and Education (National Academies Press, 2018).
Acknowledgments
Thank you to Sabrina Detlef, Samantha Gray Keen, and Lindsey Allard Agnamba for editorial insights and thought partnership. Thank you to the Education Policy communications team of Julie Brosnan, Riker Pasterkiewicz, and Fabio Murgia, and the New America communications and production team for invaluable support. Thank you to the national experts interviewed for this project: we appreciate your time, insight, and advice. Thank you to the Foundation for Child Development for support of this project.
New America’s Early & Elementary Education Policy broader work is funded by the Alliance for Early Success, the David and Lucile Packard Foundation, the Foundation for Child Development, the Heising-Simons Foundation, the Richard E. and Nancy P. Marriott Foundation, the W. Clement & Jessie V. Stone Foundation, Bill & Melinda Gates Foundation, and Trust for Learning. We thank them for their support. The views expressed in this guidebook are not necessarily the views of these organizations.
Frequently Asked Questions
What do you mean by high-quality care?
A high-quality early childhood program provides a safe and nurturing environment that supports learning, health, and family well-being while promoting the physical, social, emotional, and intellectual development of young children. While it is not easy to measure program quality and its impact on learning and development, studies of program quality generally focus on two elements: structural quality (measuring components such as teacher-child ratios, group size, staff qualifications, program duration, etc.) and process quality (focused primarily on relationships and interactions between children and staff). The National Institute for Early Education Research (NIEER) publishes an annual report that tracks state pre-K program progress on 10 quality indicators. In 2018 NIEER assessed preschool policies using an updated set of minimum quality standards focusing on process quality and reflecting recent research on effective ECE. National accreditation is another mechanism for measuring and demonstrating quality. A number of studies have focused on the key elements of high-quality programs and have identified components relating to staff qualifications and strong leadership, high-quality and appropriate curricula, family engagement, continuous quality improvement strategies, and sustainable funding. At the systems level, the Transforming the Financing report identified six principles for a high-quality ECE system:
- A “diverse, competent, effective, well-compensated, and professionally supported” workforce
- Equitable and affordable access for all
- An adequate and transparent financing system
- A variety of delivery options
- Adequate resources for facilities
- Ongoing accountability and evaluation systems
REFERENCES:
Transforming the Financing of Early Care and Education
The State of Preschool 2018: State Preschool Yearbook
Quality 101: Identifying the Core
Components of a High-Quality Early Childhood Program
The Building Blocks of High-Quality ECE Programs
Investing in our Future: The Evidence Base on Preschool Education
Financing Early Care and Education Interactive Guide
Why does the ECE financing system require a transformation?
Currently, there is no system. The Transforming the Financing report says on page one that “despite the great promise of early care and education, it has been financed in such a way that high-quality early care and education has only been available to a fraction of the families needing and desiring it and does little to further develop the early care and education workforce. It is neither sustainable nor adequate to provide the quality of care and learning children and families need—a shortfall that further perpetuates and drives inequality.” In short, “for too long the nation has been making do with ECE policies and systems that were known to be broken” (p. 239). In spite of the recent $12 billion federal investment in the Child Care Development Block Grant (CCDBG), funding at the federal level remains insufficient to make broad changes in the ECE system. At the state level, investments have tended to focus on services for three- and four-year-old children, leaving families of infants and toddlers with fewer options and higher costs. According to one study, most efforts to improve both access and quality have only scratched the surface in addressing the inequities and inadequacies of the system. Efforts to envision better workforce policies and adequate funding have been constrained in part by an assumption that change must fit within the confines of the existing infrastructure and funding streams. Such constraints have undermined a comprehensive approach to quality improvement and workforce policies and have allowed proposals that raise qualifications for the workforce to move forward without being linked to resources that simultaneously address teachers’ earnings and economic well-being. For an overview of the three areas of focus in the report, watch this 2-minute video.
REFERENCES:
Transforming the Financing of Early Care and Education
Early Childhood Workforce Index 2018
Financing Early Care and Education Interactive Guide
Why is financing so complicated?
Funding for ECE services comes from a multitude of revenue streams, including families’ payments, public sector expenditures, and private sources such as philanthropy and employers. As a result, the financing for early care and education in the U.S. is a layering of separate programs, with different funding streams, constituencies, eligibility requirements, and quality standards. What is needed is a more harmonized system that offers a continuum of care.
REFERENCES:
Why is child care so expensive?
With early childhood educators being paid extremely low wages and providers struggling to make ends meet the burning question is: Why is care so expensive? There is no question that child care in the U.S. is expensive. In the current system, families are paying the majority of the costs in the form of fees and tuition—approximately 60 percent of the total cost of care, which consumes, on average, one-fifth of a median household income. A reasonable estimate of the average cost of child care for families is around $10,000 per year. For infant and toddler care, the costs can exceed college tuition. Child care is a labor-intensive and labor driven industry, and staffing is expensive. The largest cost drivers are salaries and benefits. Licensed programs must meet staffing requirements that set the ratio of caregivers to children. Prevailing child-to-staff ratios suggest a ratio of 1 teacher for every 4 infants, 1 teacher to every 6 toddlers, and 1 teacher to every 10 preschoolers. Other expenses fall generally into three categories: occupancy, office and administrative costs, and classroom expenses. Let’s look at one calculation that illustrates the problem. Child Care Aware asks us to imagine a center that serves 40 children, at an annual cost to families of $10,000, for example. That's a total revenue of $400,000. Let’s deduct the cost of rent, utilities, and maintenance—that is $48,000 and represents 12 percent of the revenue. Now let’s deduct the cost of classroom materials, food, and administrative costs—that is $92,000 and represents 23 percent of the revenue. Finally, let's deduct personnel costs—one director, 3 lead teachers, and 6 assistant teachers working 10 hours per day will cost $260,000, or 65 percent of the total revenue. To ensure all families have access to quality care, numerous studies, including the Financing report, conclude the current system is unsustainable and the best solution is increased public investments.
- Are certain families more hard-hit than others? Child care is unaffordable for parents nationwide; it's worse for millennial parents (those born between 1980 and 1997). Parental cost of child care varies widely from state to state, but with the median income for millennials near poverty levels, affording child care is a huge challenge. For families making minimum wage, the cost of child care takes up two-thirds of their earnings. And while some assistance programs help very low-income families, those whose incomes are slightly higher make too much to qualify for assistance. In order to work, these families often turn to the "grey market" of informal, unlicensed care. New federal legislation such as the Child Care for Working Families Act can go a long way to support working families' ability to access needed quality care.
- What about publicly funded programs—do they help? Head Start, state Child Care Assistance programs, and state-funded prekindergarten programs typically provide resources to low-income families, while tax preferences benefit middle- and upper-income families. (One exception is universal pre-K programs, which are open to families of all income levels.) The current lack of harmonization among these financing mechanisms leads to gaps in ECE affordability for some low-income families and under-utilization of ECE services by middle-income families. Also, in many, if not most cases, funding is not adequate to cover all eligible children.
REFERENCES:
Where Does Your Child Care Dollar Go?
The U.S. and the High Cost of Child Care (YouTube video, 1:48)
The US and the High Cost of Child Care: 2019 (interactive state and county map)
Worthy Work, STILL Unlivable Wages
Child Care for Working Families Act
Working Families Spending Big Money on Child Care
How does ECE funding differ from K–12 funding?
States fund their K–12 education systems based on a funding formula, and for most, this is a per-student figure, with additional money allocated for need. While K–12 funding formulas do not guarantee adequate levels of funding, money distributed through a formula is more insulated from the economic ebbs and flows of the state budget process. The mechanisms through which states collect and fund pre-K programs vary greatly. Many states use more than one source to fund pre-K, including state, federal, and local funding. Funding for a state pre-K program can come from general fund appropriation, block grants, or a funding formula similar to that used in K–12.
REFERENCES:
How States Fund Pre-K: A Primer for Policymakers
How much is the ECE workforce paid now?
Comprised primarily of women, many of whom are women of color, the ECE workforce represents some of the lowest-paid professionals in the country. In fact, nearly 40 percent of ECE teachers rely on public assistance at some point in their careers, in spite of the fact that they have earned required credentials and degrees. While income levels vary across states and regions, as well as by work settings, studies estimate that median hourly wages range from around $10 for child care providers to $13 for preschool teachers across all settings and $26 for preschool teachers in public school settings. To recruit and retain teachers with appropriate qualifications and experience to support young children’s development, programs need to offer adequate compensation. Many teachers suffer from economic anxiety and report “worrying about having enough food for their family…covering routine health expenses, and…paying their monthly bills.” The stress of living in poverty not only affects teachers and their families but can also have negative consequences for the children in their care. When teachers are stressed about their ability to provide for their own families, they are less likely to engage in positive interactions with children, making it challenging to build a supportive learning environment. Compensation needs to be sufficient to recruit and retain highly skilled teachers and ensure that teaching in an early childhood program can be a sustainable long-term career choice.
REFERENCES:
Working Hard for Poverty Wages (YouTube video, 1:27)
Where Does Your Child Care Dollar Go?
Worthy Work, STILL Unlivable Wages
Building a Skilled Teacher Workforce
Transforming the Workforce for Children Birth Through Age 8: A Unifying Foundation (chapter 11)
How many states offer a public pre-K program?
In 2018, public pre-K programs were operating in 44 states and the District of Columbia. States enrolled almost 1.58 million children in state-funded preschool, including more than 1.3 million four-year-olds—one-third of all four-year-olds in the country. Enrollment of three-year-olds was about 227,000, or nearly 5.7 percent. Tracking conducted each year by NIEER reveals that enrollment of state pre-K grew steadily until 2008. The number of children enrolled decreased in 2012. The state pre-K enrollment growth rate has been anemic from 2013 to the present, with average annual increases below the 2008 pre-recession level. At the current pace, it would take states nearly 20 years to serve just half of all four-year-olds in preschool. And with the sunsetting of federal Preschool Development Grant (PDG) support, some states may struggle to even sustain current levels of enrollment. It would take nearly a century to reach the 50 percent mark for three-year-olds at the current pace, according to the 2018 NIEER State Preschool Yearbook.
REFERENCES:
How do funding mechanisms support or incentivize quality?
Family-oriented financing, such as the provision of child care assistance, has some potential to influence quality. The 2014 revisions to the Child Care Development Block Grant created a quality improvement set-aside designed to improve program quality and support school readiness. States have considerable flexibility in deciding how they will use quality set-aside funds as well as in setting reimbursement rates. While the federal government recommends rates be set at the 75th percentile of the current market rate, most states set rates well below that threshold. When states set low reimbursement rates, providers are not able to invest revenue in quality improvement efforts. Many states link payments directly to quality through their Quality Rating and Improvement System (QRIS). Quality improvement incentives such as QRIS are designed to reward the attainment of higher quality with increased reimbursement rates. However, for many providers, the increased revenue does not cover the cost of making and sustaining improvements (e.g., raising salaries or offering professional development). Forty states have implemented a tiered reimbursement approach tied to their QRIS, which offers higher reimbursement rates to providers as programs achieve higher scores. However, three-fourths of the states implementing tiered reimbursement still set rates below the recommended 75th percentile. As a result, tiered reimbursement by itself rarely generates enough revenue to raise quality, and levels of reimbursement are rarely set with a determination that the higher rates are adequate to meet the cost of quality. Provider-oriented financing mechanisms can provide incentives to improve ECE quality and the distributing entity can establish or enforce standards. For example, Head Start regulations link the receipt of funding to quality standards such as staff qualifications, use of evidence-based curricula, etc. and in some cases to a center’s quality rating, thereby making quality a consideration in new or ongoing funding decisions. In some states, funding for state-sponsored pre-K programs is also linked to a provider’s quality rating under the QRIS.
REFERENCES:
Red Light Green Light: State Child Care Assistance Policies 2016
Head Start Policy & Regulations
See the Glossary for key word definitions.
Moving Forward: Voices from the Field

As we put together this multimedia guidebook, we spoke with nine national experts on early care and education systems and financing about their take on the National Academies’ Financing report, the current early care and education system, and other related topics. Below are key quotes from our discussions:
About the Transforming the Financing report:
- "The administrative burden is quite high, especially when providers are trying to mix funding from various funding streams and whatnot. So I think the need for a more integrated system is really a key takeaway from the report."
- "The report talks a lot about the business community and the need to really invest early on in the education of our young people because that is tomorrow's workforce and we all have a responsibility for ensuring that we're setting young people on a path for success."
- "The report didn't tackle the fundamental problem, which is that the business model doesn't work…..So in my opinion, the report really missed the boat by not saying there has to be industry consolidation."
- "More important than the cost estimate per se is the vision in chapter seven of what defines an effective financing structure and of what's needed to achieve this affordable, accessible, high quality early care and education system for all children and families."
- "It is important for policymakers to understand the limitations of the current system…specifically about the limitations of the financing mechanisms. There's a lot of work out there about the problems with low quality care, and the problems with not having children ready for school, and all that. But really the focus in the report is on how can we do this better by providing both adequate levels of financing, and the way in which we finance it to better support quality, to have a more harmonized system of financing so that neither families nor providers sort of fall through the cracks, and a more aggressive system to deal with affordability."
On financing generally:
- "We've got to separate out the elements of financing. Are we talking about revenue generation? Are we talking about revenue deployment? Are we talking about revenue accountability? There are diverse elements of this and to lump them together both strategically as well as with the futuristic idea, is really problematic."
- "[Revenue generation] is the issue that needs the biggest lift because we need inventive thinking there and inventive strategies."
- "With regard to revenue expenditures, we as a country have been too focused on pre-kindergarten, not really realizing that there's a long tail before children are four years old. Most countries that are doing a really good job with kids, really do begin early and invest in very diverse ways."
- "And on the revenue accountability side, we're spending money and we're not really being efficient about our use of resources….We're duplicating services, we're duplicating recruitments."
- "Questions that I would ask if I were talking about innovation: who is doing scalable work, because it's quite limited in my mind. That is the distinguishing characteristic, which is why we don't get anywhere."
- "Here's the challenge with revenue, basically it's general fund dollars, and it's like how do you leverage general fund dollars?…In states like Washington and Oregon, they have strong political support for appropriations. And they make big appropriations, and you've clearly seen states like that. States like Louisiana, which are trying to strategically leverage tax credits. You're talking about a big ticket item. It's a big ticket item, and they have to figure out how they're going to generate the revenue."
On the current system:
- "The levels of funding that we have really don't support providers in achieving high-quality care. There just aren't the resources in the system for those providers to provide the care that is required to really get the developmental benefits that we all know can occur during the early childhood period."
- "The system is failing them in any number of ways. In a system that was meeting the goals you'd have way more people eligible. You'd have providers being reimbursed at much higher rates to provide service to those kids, and you'd have much lower copays, particularly at the lower end of the financial spectrum. Again, all of that costs money. If you're having a conversation about early childhood finance, all of those are things that should be on the table."
- "The fact that there's a lot of families who are eligible, but the funding isn't adequate. There are families that fall through the cracks because they earn too much income for one subsidy, but not enough to take advantage of tax credits for example."
On the workforce:
- "The way to retain a qualified and experienced workforce is to pay them one, a living wage, but also a wage that meets the expertise and the experience that they're providing."
- "I think what's important in this report is just making the connection between low compensation and quality, or lack of quality. Even if someone has the skills and knowledge, if they are stressed financially, they may not be able to provide the high-quality care. And this is also a real challenge in terms of financing. How do we ensure that even if we throw more money at the system, some of it, or most of it results in higher compensation for the workforce?"
On cost modeling:
- "Cost modeling is incredibly important when you're thinking about system expansion so that you can give people a realistic understanding of what is and what isn't possible within big expected revenue…"
- "…we don't understand the money and how the money is actually flowing and where the inequities really are within the system."
- "A cost model is just a way to do financial forecasting….The report made its conclusions based on a cost model with certain assumptions and as states and localities do their own, the assumptions they make about what [to include] in the forecasting are critical."
On stakeholder engagement:
- "One of the questions that we want to capitalize on is what, if any role do local communities have in financing early childhood services. We're going to be talking about that… People who live at that [community] level need to be part of this mission and part of this conversation or engaged in it."
- "When you have an issue this complex that impacts so many people, it requires multiple stakeholders to come up with a consensus solution. The process of doing that just takes a certain amount of time and bandwidth, that if nobody is providing it, it just never happens. Then what you get is some not necessarily well-designed bill that either has muscle behind it or it doesn't. Then it passes, and then if it passes, there are all sorts of easily foreseeable problems that could have been prevented if there had been better stakeholder engagement, and then it becomes an operating nightmare."
On market rates:
- "Another challenge that states are dealing with is the problem with market rates. I think that we're at the point now in the early care and education system growth that market rates are not working anymore. And yet, while states have the ability to request an alternative rate setting strategy, very few of them are. States need to start thinking differently about how they set rates for early childhood."
- "It's going to be more expensive, but seriously the gap between market prices and the cost of delivering the service is probably not that great in most places for three-and four-year-olds, or at least four-year-olds. It's infants and toddlers. It's the zero to three population. That's where the gap is."
On multiple funding streams:
- "I think there are probably some people who would say, 'Oh we should have just one funding stream.' But there are some trade offs and some reasons why there's advantages to having multiple funding streams. They're really, to some extent, targeting different parts of the ECE market, or different families and children in different circumstances. So having the multiple streams has some advantages. But it makes it a more confusing system, and it leads to these problems with both the gaps in coverage, and then for providers, the burden of having to manage all these different funding streams. So a really important recommendation from the report is about figuring out how, at the state level, to coordinate the funding streams from these multiple sources so that it doesn't have to happen at the provider level."
- "Maybe we don't need all the different programs we have, but we need to think carefully about what are the roles of those different programs and the different financing mechanisms. Some financing mechanisms like subsidies may work better for families with low incomes, and tax credits may work better for families with middle income. But then you have to make sure you don't have a gap when people are kind of in between those two types of mechanisms."
Other considerations for the future:
- "We've got to get the field using automation, and using it effectively and smartly, because it's, again, that's another way to have industry consolidation is starting to get people maximizing automation so that they're actually replacing labor with technology wherever they can."
- "I think the extent to which we can explain to the business community their role in the financing of this work, and also the return on investment that happens when we do fully finance or when we attempt to create systems that support the child care base. Businesses know that their parents need child care. They don't really know what child care needs, and what child care providers need, or what CCR&Rs (child care resource and referrals) need. So a lot of it is the introduction and the education around how they could both support each other."
- "In some ways the only way that a conversation about finance takes legs is if someone really important is making it happen. It could be a legislator, it could be in the governor's office, it could be someone influential in the private sector or outside of government who brings people together to talk about it."
See the Glossary for key word definitions.
Introduction

Key takeaways
- Early childhood is a critically important time in the human life cycle.
- The current fragmented system of early childhood care and education in the United States is underfunded, perpetuates racial and socioeconomic inequities, and prevents many families from accessing affordable, high-quality care.
- One major aspect of the Early Childhood Education (ECE) financing system needing reform is the workforce: as teachers continue to develop knowledge and competencies and acquire the minimum of a bachelor’s degree, they will need financial and workplace supports along with more competitive compensation.
Summary
Early childhood, the time between birth to age eight, is a period of tremendous learning and development. From the moment children are born, they are learning skills from their environment, experiences, and interactions with caregivers that will predict their success in life. ECE bolsters the development of both children and the economy by enabling parents to stay in the workforce while promoting children’s cognitive, social, and physical growth.
ECE investments are inarguably wise. Studies have shown that high-quality programs, like the Perry Preschool Project, yield returns of $10 for every dollar invested, while typical programs have a return on investment of $3 to $4. Five million children in the U.S. (about one in five) live in poverty, and economists estimate that access to ECE has the potential to reduce child poverty by 3 percent.
Yet for all of the potential within ECE, the system of delivery is fragmented, with uneven access, quality, and affordability, and a workforce that is as poorly unified as it is compensated.
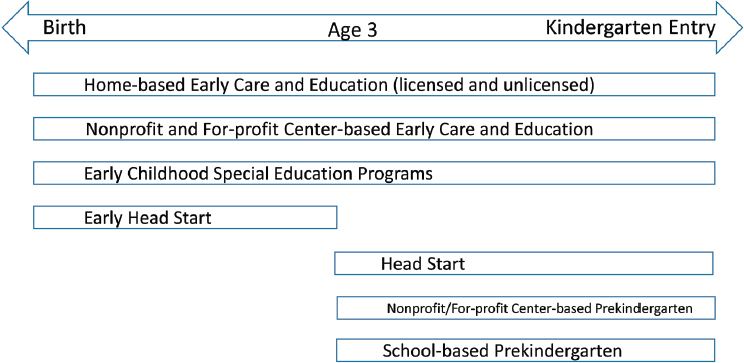
Early care and education settings vary by facility (such as home-based or center-based), age served, and funding source. Public programs may be targeted at particular populations, such as Head Start, which serves families with low incomes, or universal, such as school-based pre-K.
- See National Academies report: Figure 1-1 – Service delivery settings where children from birth to kindergarten receive early care and education
Funding sources for ECE include federal, state, and local revenue, as well as philanthropy and business sector investments, though most of the funding comes from parents. Funds may be distributed to providers, families, and the ECE workforce through a number of financing mechanisms, such as tax preferences, vouchers, and grants. Fragmentation in delivery, paired with perpetual underfunding, results in uneven quality and access to services, places financial burdens on families, and perpetuates inadequate wages for the ECE workforce.
The two-million-member workforce contributes to the outcomes of children and our future prosperity each day, while receiving little respect and low compensation. According to the 2018 Index from the Center for the Study of Child Care Employment, the median wage for child care workers was $10.72 in 2017 and just slightly higher for pre-K teachers, $13.94. Overall, 86 percent of teachers caring for infants and toddlers and 67 percent of pre-K teachers earned below $15 per hour. Half of all ECE professionals rely on public assistance. ECE teachers are being encouraged and, in some places, required to earn bachelor’s degrees, yet their inadequate wages make tuition payments burdensome and provide little incentive to remain in the field once the credential is achieved.
This financing report drew upon the six principles of high-quality early care and education defined in Transforming the Workforce in order to judge the current financing system and to innovate solutions. The report’s authors assessed research in fields such as early childhood, economics, and public policy; reviewed legislation, state and local budgets, and literature on the state of ECE in the U.S.; and analyzed a number of international ECE financing systems. From their thorough audit, the committee that wrote the report developed a framework and vision for the future of funding early care and education that will be explored in this guidebook.
- See National Academies report: Box 1-4 – Principles of High-Quality Early Care and Education
Key quotes from the report:
- “Early care and education (ECE) investments are critical because the early foundation needed for success in school and later in life is built during the beginning years of a child’s life. During this period, brain development and early learning occur rapidly and are greatly influenced by environments, experiences, and relationships. Each interaction an infant, toddler, or pre-kindergartener has with the adults in his or her life can influence neural, cognitive, and social and emotional development.” (p. 17)
- “Despite the great promise of investments in early care and education, its current financing structure only allows it to serve a fraction of the families who need high-quality care and hampers the development of a stable, highly qualified, and high-quality ECE workforce, making the financing structure neither sustainable nor adequate to provide the quality of care and learning children and families need.” (p. 18)
- “The inability of all American families to access affordable, high-quality early care and education increases the poverty rate among children and contributes to gaps in later educational outcomes across socioeconomic and racial/ethnic groups, resulting in greater likelihood of lifelong poverty for these children.” (p. 19)
- “The relevant systems and services are diverse, fragmented, and often decentralized at a time when children would benefit most from high-quality experiences that build on each other consistently over time.” (p. 27)
Questions for policymakers:
- How has your state made adaptations to address the recommendations of the Transforming the Workforce report?
- What is your state’s current investment in implementing one or more of those recommendations?
- What is the current financing system in your state or locality?
- Is public funding reaching the children who need it most? What are the gaps and how do you know?
- How does early childhood impact your state or locality’s workforce?
Questions for higher education:
- Has your institution taken steps to implement the relevant recommendations of the Transforming the Workforce report?
- What are the barriers for your institution to fully implement those recommendations?
- How do you think compensation and financing of early childhood education impacts the potential workforce and the current workforce?
Questions for the workforce:
- In what ways do you feel supported with resources and compensation that allows you to provide high-quality care for children?
- What would you change about the system? What would work better for children, families, and you?
- How are programs funded, and how does that impact providers’ ability to attract families, support the workforce, and cover expenses?
See the Glossary for key word definitions.
Landscape of Early Care and Education Financing

Key takeaways
- Early childhood education is funded in a piecemeal approach, primarily through family payments and public provisions that fuel inequity. Families with low incomes spend a greater portion of their discretionary income on child care, and public subsidies allow only a fraction of eligible families to access the services they need.
- Despite the many programs that may be used for early care and education, only nine programs are designated specifically for the care and education of young children, the largest of which are Head Start and the Child Care and Development Block Grant (CCDBG).
- Though the body of research on child development and public interest has been continuously growing, ECE still lacks support to fund programs at the levels that would allow all eligible children to receive high-quality care from an appropriately compensated workforce.
Summary
While primary and secondary education is free and provided as a public good, early childhood education costs largely fall upon families. Families shoulder 52 percent, the public sector covers 46 percent, and private and philanthropic entities cover 2 percent of total costs for early education and care. Nearly 70 percent of families with children below the age of five use some type of non-parental care, typically averaging $130 per child each week, with 25 percent of families paying over $180 per week. Families with lower incomes pay a higher portion of their income on these costs.
In 2015, the Government Accountability Office identified 44 programs related to providing care for young children, though only nine programs have child care as their explicit focus. The same year, the federal government spent $15 billion on ECE. Most of that funding was channeled towards four- and five-year-old children, despite the fact that infancy to the age of three is the most influential period of child development, and infants and toddlers incurring higher costs with fewer provider options.
Of the $15 billion in federal funding being earmarked for young children’s learning and care, $9.2 billion was allocated to Head Start. Head Start serves roughly one million children annually through 1,700 public agencies, private organizations, tribal governments, and school systems. In 2016, its appropriation resulted in $9,000 of funding per child, and grantees were responsible for matching federal funds at a rate of 20 percent.
The Child Care and Development Block Grant (CCDBG), a provision of the Child Care and Development Fund (CCDF), was appropriated at $8.1 billion in 2019. States are obligated to contribute to CCDBG and may choose to transfer funds from the Temporary Assistance for Needy Families (TANF) to CCDF. CCDBG is similar to a voucher program, in that parents choose the facility and the state subsidizes the selected provider. A portion of CCDBG funds are intended for program improvements, and specific improvements for infants and toddlers.
Two federal tax income benefits are designed to assist with early care costs. The Child Care and Dependent Tax Credit (CDCTC) allows families to claim a tax credit for 20 to 35 percent for the first $3,000 spent on care per child, or $6,000 for two children. The credit is determined on a sliding scale and only available for families who pay federal taxes and use ECE services to work or attend school. The Dependent Care Assistance Program (DCAP) permits families to reserve up to $5,000 in pre-tax funds in a flexible spending account to reduce their overall tax burden. The foregone federal tax revenue from CDCTC and DCAP are $4.6 billion and $1.0 billion, respectively. These tax credits mostly benefit wealthier families, as families with incomes over $100,000 receive 52 percent of benefits and families with incomes below $40,000 receive 15 percent of benefits.
States are significant funding partners in early childhood education. Many states offer state-funded pre-K, give state-level tax credits to employers and families, and contribute heavily to CCDBG. For state-funded pre-K, states contributed $7.4 billion in 2016, which was supplemented by $434 million from the federal government and $634 million from local governments, to educate 1.5 million children. Twenty-three states offer child and dependent care tax credits, many structured similarly to the CDCTC credits. Twelve of these states made the credit fully or partially refundable, so families weren’t required to pay state taxes to be eligible.
Employers may contribute to child care costs through the federal employer-provided care Credit and employee incentives. Using the credit, employers can deduct 25 percent of qualified child care expenses and 10 percent of resource and referral fees, for up to $150,000 annually. Forgone revenue from this credit totals roughly $10 million. Employers may also offer employee benefits or incentives, like on-site child care centers and paid family leave. Fifty-six percent of employers offer DCAP plans that allow families to pay ECE with pre-tax income and 41 percent of employers offer resource and referral services. A major concern with this strategy is that associated benefits may lower employees’ overall cash compensation (even for those without children), so the actual benefit may be negligible.
Private institutions contribute a small fraction of the total ECE system costs. Private agencies and philanthropies support ECE by piloting innovation, building systems, and establishing public-private partnerships that include pay-for-success models and Shared Services Alliances (SSAs).
See National Academies report: Table 2-2 – Major Sources of Federal and State ECE Funding in Fiscal 2016.
Key quotes from the report:
- “Unlike kindergarten through 12th grade (K–12) education, the early care and education (ECE) ‘system’ is a hodgepodge of different programs with different goals, constituencies, and requirements, implemented with great variation across states and localities.” (p. 45)
- “Historically, early care and education in the United States has been delivered through multiple systems with multiple goals, with the most marked bifurcation being between programs for middle- to upper-class children and programs for poor children.” (p. 46)
- “Early care and education provides care and supervision of children so that parents can work, go to school, get a respite from parenting, or complete a myriad of other tasks. For children, it provides learning, positive development, socialization, nurturing, play, and—particularly as they near kindergarten—a bridge to formal education. For society at large, high-quality early care and education can play an important role in preparing the next generation to be productive and educated citizens.” (p. 56)
Questions for federal policymakers:
- How can we garner support to fully fund existing programs such as CCDBG and TANF?
- What would be the impact of discontinuing tax credits for child care, and channeling those funds ($5.61 billion) into public options?
Questions for higher education:
- How are current and future early childhood educators financially supported to obtain degrees?
- What role do institutions have in supporting student degree attainment?
- How do child care costs and the current landscape of child care impact ECE educators enrolled in higher education?
Questions for the workforce:
- Are you eligible to participate in tax credit programs, and if so, how have these programs impacted your life as a parent and professional?
- How can the importance of much tax revenue that is lost when parents leave the workforce to care for their children be better communicated?
- What would be most helpful as you pursue a degree? Scholarship, loan forgiveness, wage supplement, compensation increase, academic support, or is something else needed?
See the Glossary for key word definitions.
| Timeline for early education in the United States: | |
|---|---|
| Year(s) | Details |
| Mid-1800s | ECE programs are founded in the U.S. for children from toddlers to primary school age. Programs funded with tuition tended to focus on enrichment. Free programs intended for immigrant families and families with low incomes focused on “moral habits” and basic caretaking. |
| 1890s–1900s | Critics begin speaking out against child care outside of the home and supporting policies to allow mothers to stay home with children. |
| 1909 | The White House Conference on Children encourages aid to mothers to allow them to stay home with children, asserting that “home life is the highest and finest product of civilizations.” |
| 1919 | Mothers’ pension legislation is enacted in 39 states, plus Hawaii and Alaska. Financial assistance is provided with rules that exclude mothers who are widowed, divorced, married to men incapable of breadwinning, or are racial or ethnic minorities. |
| 1935 | The “Aid to Dependent Children” provision is passed through the Social Security Act, providing cash assistance to mothers except those of color and those with “illegitimate” children. |
| 1930s | President Roosevelt establishes nursery schools with public funding, to employ teachers and other school staff while protecting the well-being of pre-K children from “needy, under-privileged families.” Middle-class enrollment in private nursery schools grows during this time, and teachers in all settings are required to have ECE-specific training. |
| 1943–1946 | The Lantham Act of 1940 passes in response to World War II. Mothers working for the defense fund accessed child care through federal grants, marking the first time the federal government provided support for middle-income families. The program ends when the war does. |
| 1950s | Public attitudes are still deeply invested in the mother’s role in the home, though there are three times as many working mothers as there were before the war. Public funding is scarce, and most families rely on informal or private care. |
| 1964 | President Johnson declares his “War on Poverty” and establishes Head Start. Head Start’s multi-generational approach is intended to “strike at the basic cause of poverty.” |
| 1960s–1970s | States initiate funding kindergarten as part of the public-school system. |
| 1971 | President Nixon recommends, at the 1971 White House Conference on Children, that “the Federal government fund comprehensive child care programs, which will be family-centered, locally controlled, and universally available.” Congress agrees, and passes the Comprehensive Child Development Act to help support low-income families and working parents and centering on child development and early education. |
| 1972 | President Nixon surprises many by vetoing the bill, citing its potentially negative impact on family relationships. |
| 1974 | Title XX of the Social Services Block Grant subsidizes early care and education for low-income families and those receiving public assistance. |
| 1981 | Funds for Title XX are drastically reduced; money earmarked for child care is eliminated. |
| 1988 | The Family Support Act requires most welfare recipients to either work or attend school, and provides child care assistance to eligible families. The dependent care tax credit (established in 1954) has the income cap raised and removed, becomes a nonrefundable tax credit, and increases the amount taxpayers can claim for child care. |
| 1989 | The first National Child Care Staffing Survey finds that ECE teachers are underpaid and under supported, and they exit the profession at rates of over 40 percent. The study determines that workforce conditions and training are essential for high-quality programs. |
| 1989 | The Military Child Care Act (MCCA) establishes a system of high-quality child care centers and family child care programs, raises qualifications and compensation for teachers, and establishes a sliding scale for parent payment. |
| 1990 | Congress passes the Child Care and Development Block Grant Act (CCDBG), which authorizes the Child Care and Development Fund (CCDF). Funding is provided through vouchers to providers that parents choose. States are required to set quality standards and eligibility requirements. Funding levels are too low to cover all potentially eligible families. |
| 1990 | Congress passes the Head Start Expansion and Quality Improvement Act to reauthorize federal funding for Head Start and requires 10 percent of funds be channeled towards quality improvement, such as staff training. |
| 1996 | President Clinton passes the Personal Responsibility and Work Opportunity Act of 1996, establishing the Temporary Assistance for Needy Families (TANF) program with work requirements. The act increases federal ECE funds by $4 billion and redirects 4 percent of CCDF funding to quality improvement. |
| 1990s–2010s | State-funded pre-K programs expand significantly. By 2018, 44 states and the District of Columbia have[ ](http://nieer.org/wp-content/uploads/2019/08/YB2018_Full-ReportR3wAppendices.pdf)[state-funded pre-K programs](http://nieer.org/wp-content/uploads/2019/08/YB2018_Full-ReportR3wAppendices.pdf), serving one-third of four-year-olds and 5.7 percent of three-year-olds. |
| 2007 | The Head Start Reauthorization Act requires that by 2013, half of all Head Start teachers obtain at least a bachelor’s degree in early childhood education, but no guaranteed compensation increases. |
| 2011 | The four-year competitive grant program Race to the Top-Early Learning Challenge ([RTT-ELC](https://www2.ed.gov/programs/racetothetop-earlylearningchallenge/2013-early-learning-challenge-flyer.pdf)) awards over $1 billion to 20 states for improving program quality through use of Quality Rating Improvement Systems ([QRIS](https://www.newamerica.org/education-policy/edcentral/even-more-research-many-qs-remain-about-qris/)). |
| 2013 | Early Head Start-Child Care ([EHS-CC](https://www.ffyf.org/issues/ehs-ccp/)) Partnerships are established to foster coordination between Early Head Start grantees and local child care providers, with the goal of improving quality. In 2019, EHS-CC partnerships are funded at $805 million. |
| 2014 | The Child Care Development Block Grant program ([CCDBG](https://www.newamerica.org/education-policy/edcentral/ccdbgpasses/)) is reauthorized for the first time since 1996, and is funded at $400 million annually over six years. This reauthorization modifies the frequency of family eligibility audits to once per year and requires providers to pass annual fire, health, and safety inspections. |
| 2014 | Preschool Development Grants ([PDG](https://www.newamerica.org/education-policy/edcentral/preschool-dev-grants-win/)) distribute $250 million over four years to 18 states, increasing access to high-quality pre-K for[ ](http://blogs.edweek.org/edweek/early_years/2018/08/preschool_development_grants_boosted_access_to_high-quality_care_report_says.html)[49,000](http://blogs.edweek.org/edweek/early_years/2018/08/preschool_development_grants_boosted_access_to_high-quality_care_report_says.html) children in over 200 high-need communities. |
| 2018 | The Preschool Development Grants Birth through Five ([PDG B-5](https://www.newamerica.org/education-policy/edcentral/hhs-announces-details-about-new-pdg-b-5-program/)) program builds on the PDG program by extending opportunities for access to early learning programs. In December,[ ](https://www.acf.hhs.gov/occ/resource/pdg-b-5-initiative)[46 states](https://www.acf.hhs.gov/occ/resource/pdg-b-5-initiative) receive federal grants totaling $250 million towards this effort. |
| 2018 | CCDBG funding is more than[ ](https://www.newamerica.org/education-policy/edcentral/house-omnibus-bill-brings-good-news-early-childhood-advocates/)[doubled](https://www.newamerica.org/education-policy/edcentral/house-omnibus-bill-brings-good-news-early-childhood-advocates/), from $2.37 billion to $5.22 billion, to increase access to child care for more than[ ](https://www.clasp.org/sites/default/files/publications/2018/02/State%20Impact%20of%20Doubling%20CCDBG%20.pdf)[200,000](https://www.clasp.org/sites/default/files/publications/2018/02/State%20Impact%20of%20Doubling%20CCDBG%20.pdf) children. Funding for the Child Care Access Means Parents in School (CCAMPIS) program, which supports parents of young children attending higher education programs, is more than[ ](https://firstfocus.org/wp-content/uploads/2019/09/FirstFocus-ChildrensBudget2019-pages.pdf)[tripled](https://firstfocus.org/wp-content/uploads/2019/09/FirstFocus-ChildrensBudget2019-pages.pdf), from $15 million to $50 million annually. |
Current Financing for Early Care and Education: Financing a Highly Qualified Workforce

Key takeaways
- Efforts that have been made to improve compensation levels have been inadequate.
- Relying on loans to fund higher education is risky because of the difficulty the ECE workforce will have in paying these loans off.
- Most states do not have a comprehensive system of professional development for the workforce; access to professional development varies significantly depending on setting.
- There is a lack of high-quality ECE preparation programs that provide the competencies necessary to effectively work with young children.
Summary
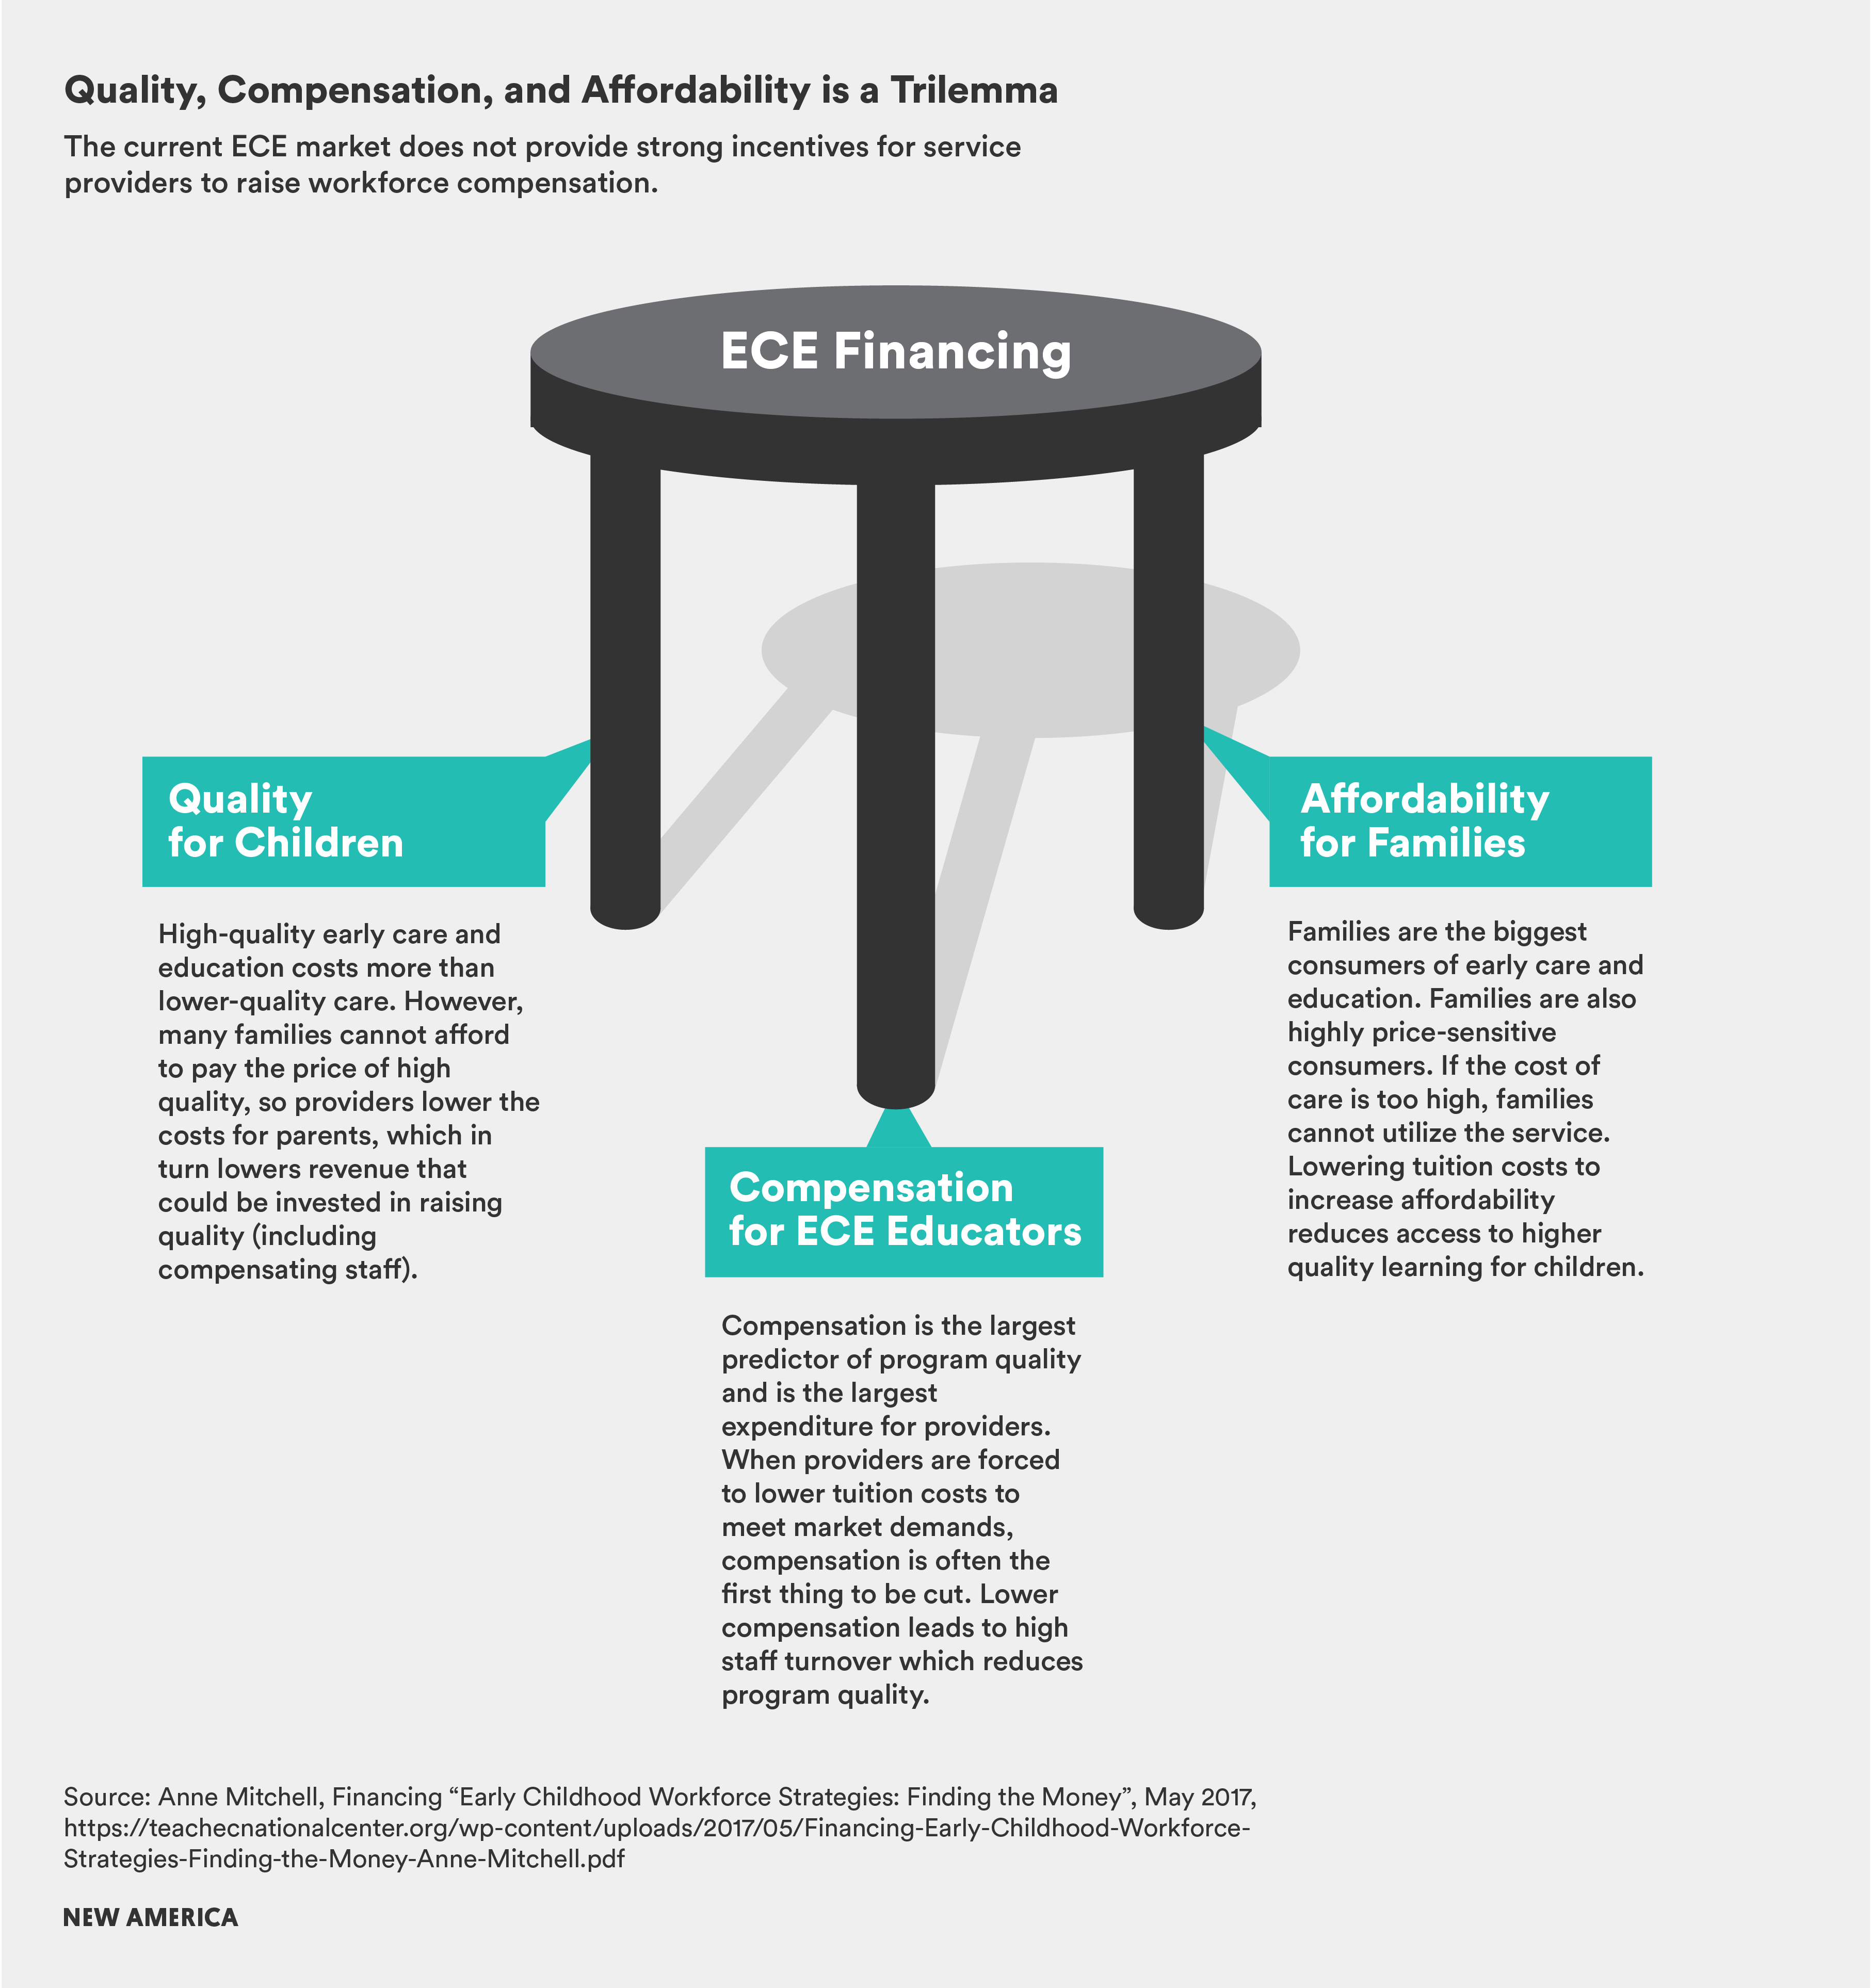
In order to ensure a highly qualified workforce, early educators need to receive adequate compensation, have opportunities to access affordable higher education, and receive ongoing professional development. While there has been an increased emphasis over the past two decades on raising the educational requirements of early educators, there has not been an equal emphasis placed on increasing their compensation. The average pay for a Head Start teacher in 2012 was only $33,072, compared to $56,130 for an elementary school teacher. Not only is compensation generally low for the ECE workforce, but benefits are also typically limited in comparison to K–12 educators. Many struggle financially and are forced to rely on public support programs. Inadequate compensation also contributes to the high levels of employee turnover in many ECE settings.
The efforts that have been made to improve compensation have been inadequate. Wage supplements and tax credits may provide temporary financial assistance to early educators, but they do little to alter the low base salaries received by the majority of the workforce. The most effective way to improve compensation levels would be raising base pay through contracts, but there are currently inadequate levels of funding available for such salary increases across all settings. Funding is needed to provide for adequate compensation of the ECE workforce while simultaneously ensuring that higher costs are not shifted onto families who are already struggling to pay for early care and education.
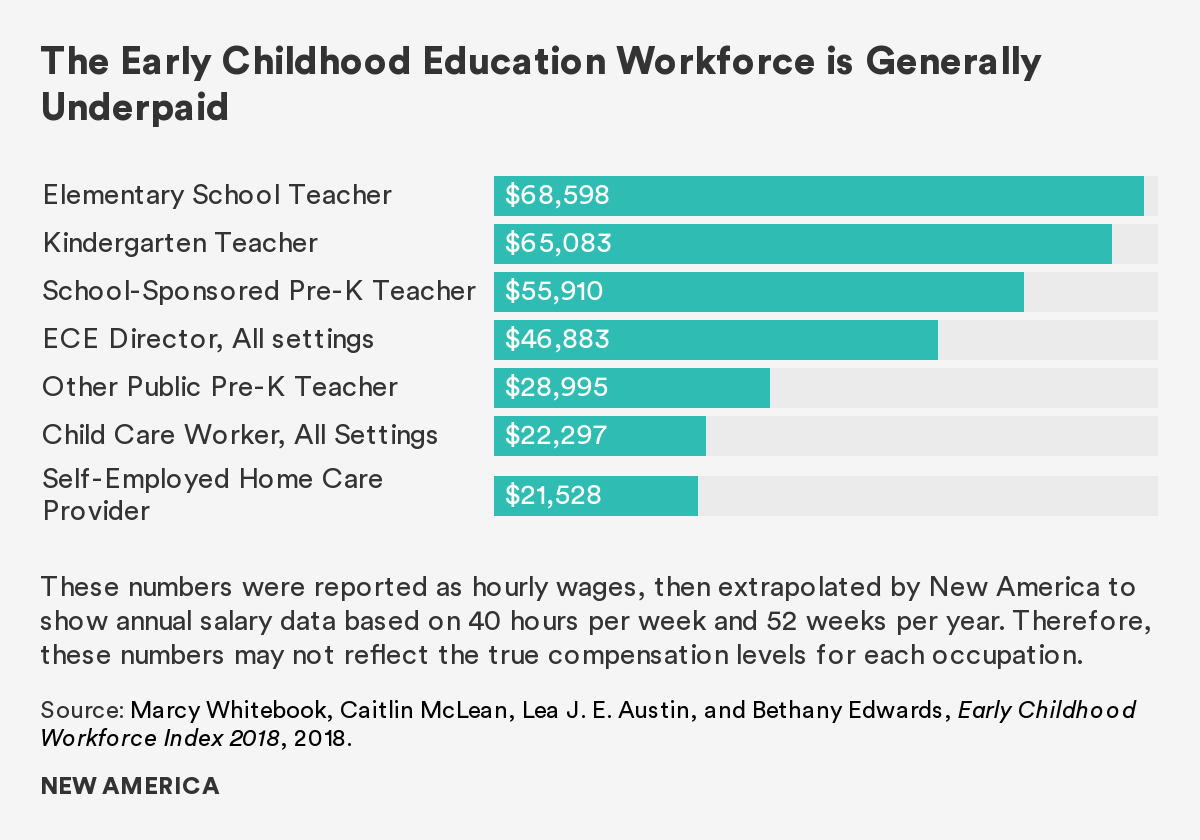
Like adequate compensation, opportunities to access affordable higher education are critical for ensuring a highly qualified ECE workforce. While the Transforming the Workforce report emphasized the importance of bachelor’s degrees or higher for lead educators, it’s also important that financing be in place to support early educators pursuing CDA credentials and associate degrees. As demand grows for early educators with higher education, there is a danger of a large increase in total debt load for them unless scholarships and other financial supports are made available.
There are a few financing mechanisms designed to support the educational attainment of the workforce, such as the T.E.A.C.H. scholarship program, currently in operation in 23 states and the District of Columbia, which provides financial assistance for current ECE educators. Apprenticeship programs are another way to help build ECE workforce qualifications. The workforce can also take advantage of general higher education supports, such as federal loans, which can be made more affordable through the use of income-driven repayment plans. But unless the compensation levels of early educators rise significantly, relying on loans to fund higher education is risky because of the difficulty the workforce will face in paying these loans off over time. Current ECE professionals may also be eligible for need-based grants, such as federal Pell grants, though such grants may not cover the full costs of higher education.
Even if supports are put in place to help the workforce afford higher education, there remains the problem of a lack of high-quality ECE preparation programs that provide the competencies necessary to effectively work with young children. Additionally, ECE degree programs typically have limited to no resources for faculty development. In many states, there has been an overall decline in funding for public colleges.
Once an early educator has graduated from a high-quality preparation program, it’s imperative that she receive ongoing support and professional development (PD). Unfortunately, most states do not have a comprehensive system for training of the ECE workforce and access to PD varies significantly depending on setting. While “one-off” training sessions for ECE staff are often the norm, this type of PD is unlikely to impact practice. Instead, PD should be delivered via sequential learning options and coursework from accredited institutions. Ideally, early educators would be able to translate the skills acquired through PD into credentials and advanced degrees.
Key quotes from the report:
- "Despite an increased emphasis on raising the qualifications and education level of ECE educators over the last two decades, there has not been a commensurate emphasis on raising the compensation of the workforce." (p. 88)
- "Benefits for the ECE workforce are limited and vary greatly by job title and ECE setting." (p. 90)
- "Although wage supplementation is the most common strategy for increasing compensation, there are several disadvantages to how it has been implemented to date, in terms of ensuring the well-being and adequate compensation of the ECE workforce." (p. 93)
- "Unless earnings for ECE professionals rise, relying on student loans to fund new credential requirements is risky because students' low earnings will make it difficult for them to pay off their loans in the future, creating costly burdens for taxpayers who will eventually cover a large share of the debt burden." (p. 103)
- "Existing professional development supports for the ECE workforce reflect the under-resourced and piecemeal ECE system as a whole." (p. 112)
Questions for policymakers:
- What states, if any, have made progress in improving the compensation of the ECE workforce? What are the key policies or levers that have led to that change?
- What levers are there for states to spur institutes of higher education to more effectively support and prepare early childhood educators?
Questions for higher education:
- What supports or innovations are available for non-traditional students and English learners?
- With regards to field placements, how can you meet the need of many early childhood educators to continue working as well as ensure their exposure to strong mentor teachers and high-quality early learning environments?
- What are the most significant barriers to establishing articulation agreements with two-year-institutions and to accepting credit for prior learning?
- What alternative class schedules are available to support early educators who work during the day? What do you need to make alternative class schedules possible?
Question for other stakeholders:
- How can philanthropy help improve supports for and preparation of early childhood educators?
See the Glossary for key word definitions.
Current Financing for Early Care and Education: Affordability & Equitable Access

Key takeaways
- While Head Start and state pre-K resources aimed at low-income families contribute to equity of access, the programs often leave middle-class families without access to affordable, high-quality early care and education.
- The existing ECE system consists of a hodgepodge of various programs with conflicting eligibility criteria.
- Because of the high cost of early care and education, many low-income families are forced to rely on relatives and others to provide care rather than enroll their children in center-based care.
Summary
Analyzing current patterns of family use and spending when it comes to early care and education is helpful for understanding the shortcomings of the current financing structure. A majority of children will have at least one regular ECE provider by the time they are one year old. This percentage increases with a child’s age, with nearly three-quarters of four-year-olds having at least one regular ECE provider. The patterns of ECE usage by family income shows that the share of children in ECE increases as family income increases; the same pattern holds for the share of children in center-based rather than home-based care. Studies suggest that low-income families are less likely to use center-based care than high-income families and are more likely to rely on relatives for care, probably due to a combination of cost, convenience, and difficulty finding a center that offers care during non-traditional hours. These studies also suggest that families with lower incomes would likely make greater use of ECE if they could afford to do so.
See National Academies report: Figures 4-1 – Patterns of ECE utilization by income category, all children ages 0–5 years (not in kindergarten) and 4-2 – Share of children in center-based early care and education, by age and income category
See National Academies report: Table 4-2 – Average Weekly Hours of Care per Child, by Age Group and Type of Early Care and Education
There are two major programs that distribute funds directly to providers: federally funded Head Start programs and public pre-K programs primarily funded by states or localities. Participating families pay no cost for Head Start services. Some public pre-K programs require no payment, others require payment from some parents based on a sliding income scale, and others require some payment from all parents. While families are eligible to enroll children in Head Start if their income falls below a certain level, many but not all public pre-K programs are targeted at children from low-income families. In FY 2016, only 31 percent of eligible children ages three to five were served by Head Start. Less than 3 percent of eligible children under age three were served by Early Head Start in 2014–15. There is great variation among states in terms of children served by state-funded public pre-K programs. Across all public programs (public pre-K and special education enrollment plus Head Start) about 44 percent of four-year-olds and 16 percent of three-year-olds are currently served.
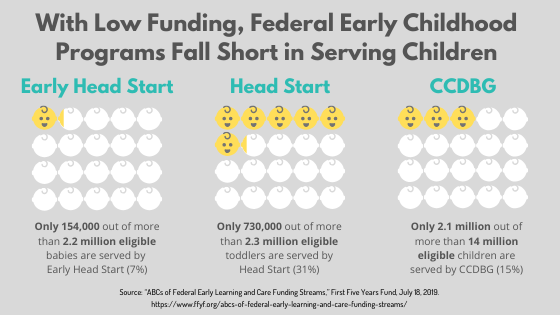
There are mechanisms in place to provide assistance to low- and moderate-income families in affording child care. Subsidies are issued on a sliding scale based on family size and income. Head Start is provided at no cost for families with incomes up to the federal poverty line, meaning a family may longer be eligible for the program if its income increases slightly. Even with child care subsidies some states require such high copayments that many low-income families may still be unable to afford ECE. Currently, only 11 percent of children who are eligible for child care assistance actually receive it. Due to limited funds, 20 states had waiting lists or froze intake for child care assistance in 2016. It’s important to note that these subsidies are restricted by federal law to families with parents who are employed or involved in education or training programs, so that some families will be ineligible for any sort of child care assistance. While there are tax regulations designed to assist families with paying for child care, such as the Child Care and Dependent Tax Credit, these credits tend to be more beneficial for middle- and upper-income families than for low-income families.
Key quotes from the report:
- "Studies have found that low-income families use less center-based care than do high-income families and more often rely on relatives to provide care." (p. 119)
- "The stark difference in ECE utilization patterns across income categories supports the hypothesis that the cost to families is an important determinant of children's access to early care and education." (p. 122)
- "While targeting low-income children responds to one aspect of equity, current provider-oriented mechanisms are insufficient to support access for all low-income families and do not address the middle-income gap." (p. 125)
- "Eligibility requirements that are tied to parental employment rather than children's developmental needs may increase instability in ECE arrangements." (p. 129)
Questions for policymakers:
- Given the fact that children of low-income families are more likely to use family, friend, and neighbor care, what policies can help increase the overall quality of these informal care settings?
- How can the recent increase in CCDBG funds best be used to both increase access and quality to ECE for children from low-income families? How is your state using the quality set-aside? What’s the priority need in your state in terms of access to ECE vs. quality? What are the tradeoffs of focusing on one over the other?
- How can current tax regulations be altered so that they offer more benefits to low-income families?
- What are current reimbursement rates for child care providers? What has your state done to increase these rates, particularly for high-quality early learning providers?
- Has your state considered contracting with early learning providers rather than reimbursing based on attendance? How might this impact providers’ ability to deliver more consistent quality?
See the Glossary for key word definitions.
Current Financing for Early Care and Education: Ensuring High Quality Across Settings

Key takeaways
- The way most ECE programs receive funding is not linked to the cost of maintaining quality standards and does not adequately incentivize high quality.
- Families who need care during evenings and weekends find it very difficult to access such care.
- No system-wide approach for funding high-quality ECE facilities currently exists so providers are forced to pursue piecemeal, often insufficient, financing approaches.
- Financing for data collection systems is typically comprised of short-term or one-time funding initiatives which leads to a lack of data systems capable of measuring whether investments are achieving their intended results.
Summary
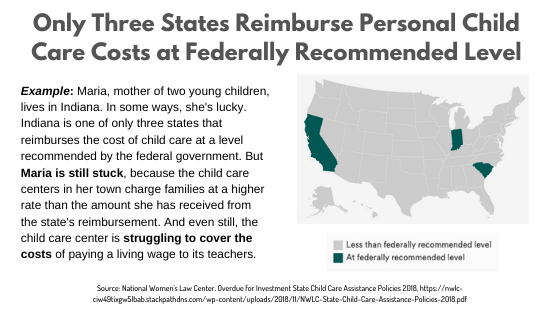
There are a few ways that current financing mechanisms incentivize ECE quality. For example, Head Start promotes quality by requiring that staff members meet certain qualification standards, and regulations link funding to a center’s quality rating. Some states also link funding for state-sponsored pre-K to a provider’s rating under the state’s quality rating and improvement system (QRIS). States are also responsible for setting policies on quality requirements for access to ECE assistance programs. The 2014 CCDBG reauthorization mandates that CCDF funds be set aside for activities that improve quality and states have flexibility in how to spend those funds. While states also set provider reimbursement rates for ECE assistance programs, only one state sets its reimbursement rate at the 75th percentile of current market value, the level recommended by the federal government. Low reimbursement rates limit the quality of care that a provider can offer children and families, and a tiered reimbursement strategy by itself rarely generates enough revenue to significantly raise the quality of programs. So, increasing reimbursement rates to “market rate” is a step toward quality, but alone it will not bring in enough revenue to meet the true cost of quality. Quality standards and their implementation vary greatly across ECE programs.
It’s important that families have a variety of affordable, high-quality ECE program options to choose from. However, there is currently a lack of availability of care during nonstandard hours, such as nights and weekends, because offering care during these hours is generally not cost-effective for centers. In fact, only about 8 percent of centers offer any nonstandard hours. ECE programs vary greatly in the duration of hours available to families. In the 2015–16 school year, only 44 percent of children enrolled in Head Start received services for an entire school day five days out of the week. And of the 59 state-funded pre-K programs serving children during the 2015–16 school year, a majority were offered for less than four hours per day. While family-oriented financing mechanisms may give more options in regard to program location and hours of operation, research suggests families often choose care based on convenience and flexibility at the expense of program quality.
Because high-quality ECE requires safe and modern facilities, it’s important that programs have access to the necessary financing to acquire new facilities or improve existing ones. However, unlike the K–12 system, there is no dedicated financing mechanism for ECE facilities. The federal programs Head Start and CCDF do not include allowances for facilities acquisition, expansion, or improvements. Providers are forced to pursue a hodgepodge of approaches to fund facility improvements, such as loans, grants, and tax credits. Many ECE providers are unable to qualify for a loan large enough to undertake a major facilities upgrade, however, because only providers with the ability to take on such debt are helped by loan programs. It is difficult to accurately estimate the scope of these improvements needed around the country because there is currently no national-level survey of the state of ECE facilities.
Improving the quality of ECE programs also requires data collection and management systems to help policymakers understand the current landscape and changes that take place over time. Answering even fairly basic questions about ECE is often impossible due to the lack of a comprehensive data system that tracks information about program enrollment, program quality, and the workforce. Additionally, few systems link with data on child outcomes over time in a way that allows for long-term program evaluation. A 2013 analysis found that only one state had a coordinated data system that merged information from all types of publicly funded ECE programs and linked it to K–12 data. Generally, financing for data collection systems tends to be through one-time or short-term funding initiatives, making it difficult to measure whether investments are achieving their intended results over the long term.
Finally, accountability and improvement systems are designed to provide supports and incentives for quality improvement. Most states have adopted a QRIS to provide more quality information to parents and offer financial incentives for programs to improve quality. However, the original vision of QRIS has yet to be realized due to limited financial incentives available for providers that meet higher quality standards.
See graphic, “Only Three States Reimburse Personal Child Care Costs at Federally Recommended Level” from the previous section, Current Financing for Early Care and Education: Affordability & Equitable Access
Key quotes from the report:
- "Levels for tiered reimbursement rates are commonly set without a determination that the higher rates are sufficient to meet the costs to providers of attaining higher quality-standards." (p. 137)
- "Only about 8 percent of centers offer any nonstandard hours of ECE services, and only 2–3 percent are open evenings or weekends." (p. 139)
- "Despite the importance of facilities in ensuring quality early care and education, most financing mechanisms that support service delivery—such as Head Start or CCDF—do not include allowances for facilities acquisition, expansion, or improvements." (p. 141)
- "Because most major facilities investments require deeper subsidies than loan guarantees offer, many ECE providers are unable to qualify for a large enough loan to undertake a major physical infrastructure initiative." (p. 143)
- "The complexity and cost of compliance obligations to multiple funders is burdensome for providers, as they currently must meet the demands of many masters to cobble together enough revenue to support the costs of even the most basic services." (p. 152)
Questions for policymakers:
- How can ECE providers be financially incentivized to offer care on nights and weekends?
- What additional strategies are there for financing and improving the quality of QRIS?
- What level of reimbursement rate is needed to incentivize high-quality ECE in your state?
Question for funders:
- How can more private funders be encouraged to support their local communities by making grants for ECE facilities projects and projects to improve learning environments?
Question for other stakeholders:
- How can partnerships with the business community support the expansion of high-quality early learning?
See the Glossary for key word definitions.
Estimating the Cost of High-Quality Early Care and Education

Key takeaways
- Early care and education is a labor-intensive industry, so staff qualifications and compensation largely drive the cost of service.
- The costs of a high-quality system will be much higher than current costs in large part due to the significantly higher levels of compensation required to recruit and retain a well-qualified workforce.
- There are many uncertainties inherent in projecting the national costs of implementing an ECE system that is drastically different than the current one.
Summary
Estimating the cost of providing high-quality early care and education is a vital first step in building a financing system that ensures access to high-quality ECE for all children. The total resources that need to be invested in a high-quality ECE system include on-site costs and system-level costs. On-site costs include maintaining appropriate staffing levels, compensating staff adequately, providing professional development, and paying for things like curriculum, facilities, and equipment.
The video above explains why costs are so high while early childhood teachers are paid so little. It was produced by Child Care Aware of America, a national advocacy group, and the Center for the Study of Child Care Employment at the University of California-Berkeley.
System-level costs include workforce development supports, such as off-site training, ongoing professional learning, and higher education; as well as costs related to quality assurance and improvement, such as data systems and licensing and accreditation.
Because early care and education generally requires a larger supply of staff than the K–12 school system due to lower student-teacher ratios, staff qualifications and compensation account for the largest share of costs. The costs of a high-quality ECE system will be much higher than current costs, because significantly higher levels of compensation will be needed to recruit and retain a well-qualified workforce. While it’s clear that current compensation is too low for ECE staff, it’s not entirely clear how high compensation needs to be set in order to attract and retain a qualified workforce. Some advocates propose that compensation levels for ECE educators be equal to that of kindergarten-to-third grade educators, but there are a number of challenges to achieving pay parity, including lower levels of unionization among early educators and a lack of protected funding sources dedicated to ECE. A new financing structure that includes dedicated, predictable, and sustainable funding sources could help address these challenges.
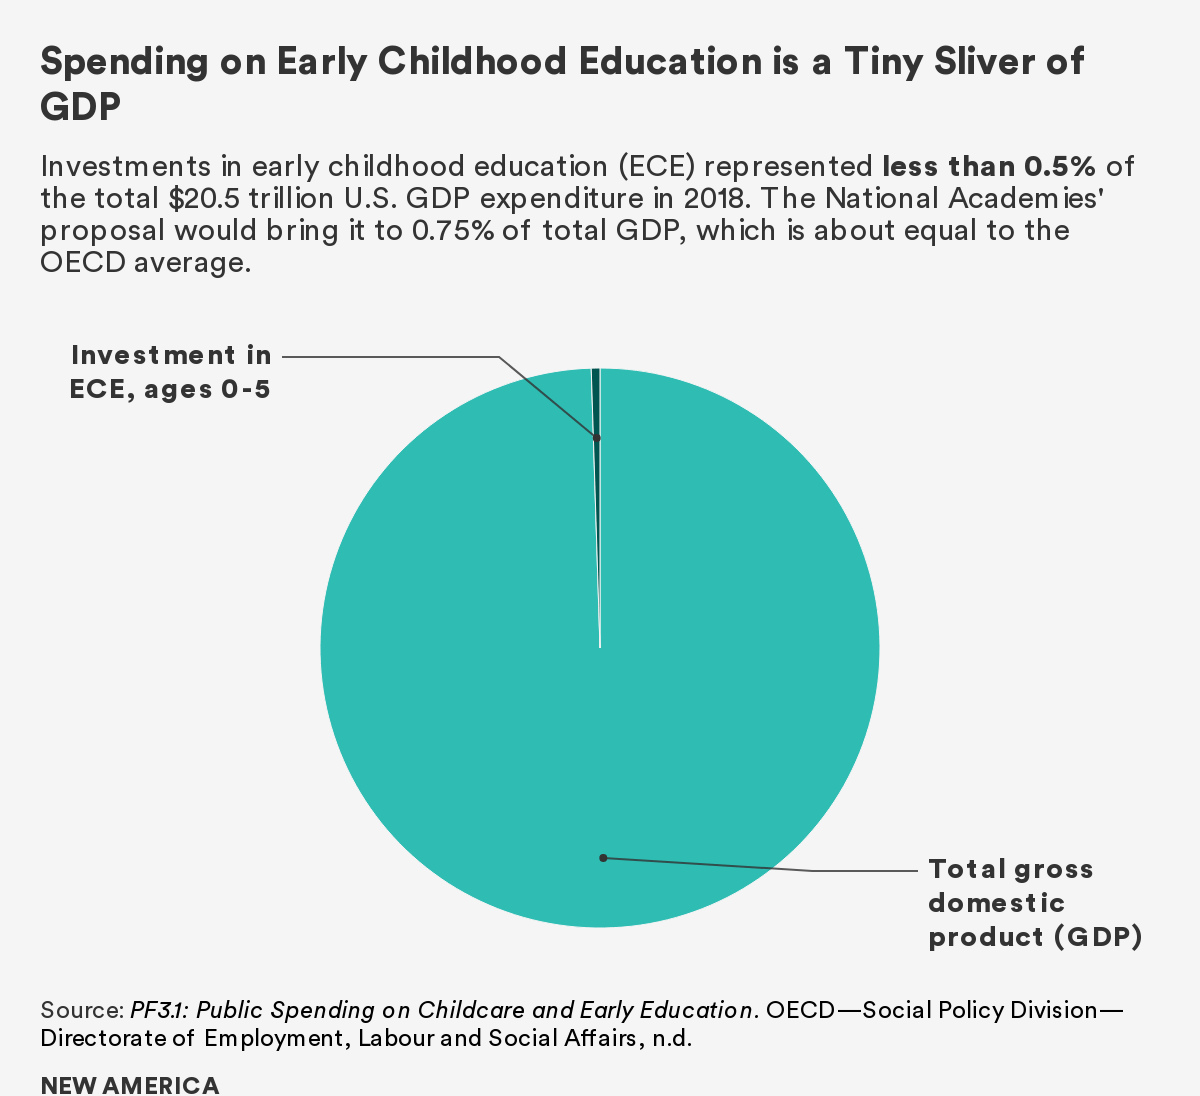
There are a number of uncertainties inherent in projecting the national, aggregate costs of implementing an improved ECE system. For example, it’s unclear exactly how much overall participation in ECE would increase under an entirely different set of conditions. It’s also unclear if the new system would lead to a substantial shift from home-based to center-based ECE services. For its cost estimate, the committee that wrote the report assumes more families will use center-based ECE options and will use more ECE hours per child. With these limitations in mind, the committee estimates that, once fully implemented, the total cost of offering accessible and affordable high-quality ECE with a highly qualified workforce would amount to at least $140 billion per year. Current federal and state ECE-related spending amounts to about $29 billion, well below what is necessary to support high-quality ECE for all children. While $140 billion is a large number, it represents only about 0.75 percent of the country's gross domestic product (GDP), slightly less than the average of 0.8 percent of GDP allocated to ECE for the nations in the OECD.
Part of establishing a system that provides affordable, high-quality ECE is determining a reasonable financial share for parents to pay to help offset the public costs. If it is determined that parents should pay for a portion of the cost of providing ECE, the payment schedule should be progressive: the cost for low- to middle-income families should be lower than that for more affluent families. If, on the other hand, the new system includes no fees for families, as is the case in the public K–12 system, a greater share of funding from private or public sources would be needed.
See Behind the Numbers for further discussion of cost estimates.
Key quotes from the report:
- "It is clear that the committee's estimate of the total cost of providing high-quality early care and education, reinforced by previous cost estimates, suggests that there is a significant gap between the amount of funding currently in the ECE system and the amount of money needed to support access to high-quality early care and education for all children." (p. 193)
- "These numbers are large but are not out of line with current international practice nor with current spending on K–12 education." (p. 193)
Questions for policymakers:
- How can political will be built to significantly increase local, state, and federal funding of early care and education?
- How does investment in an early care and education system fit with other priorities? What are the other top priorities? Are there investments in ECE that can benefit those other priorities?
- What are the pros and cons of designing an ECE system that is free for all families versus one that institutes a sliding scale payment system?
- What is a reasonable timeline for raising the quality of ECE to meet a higher standard?
- What are the most pressing issues in ECE financing? What will happen if we don’t address ECE financing?
- Could cost modelling be used to understand the current landscape?
- What is hampering resource allocation for sustainable and stable ECE program funding?
- Is your state or locality engaged in public-private partnerships that benefit early care and education? What looks promising? What has been challenging?
Questions for funders:
- How can private sources of funding be used to defray the cost of building a high-quality ECE system?
- How can philanthropic funders work with public agencies to spur pilots and innovations that become publicly supported if they prove successful?
Questions for the workforce:
- For service providers: What support is needed to help increase the quality of ECE services, in addition to funding, especially as it relates to increasing staff qualifications?
- For program administrators: What is your current capacity to manage multiple funding streams needed to expand access, and what would help you to manage these streams? What state-level supports or policies would help?
See the Glossary for key word definitions.
A Vision for Financing Early Care and Education

Decades of brain research show that high-quality early care and education (ECE) benefit children, families, and society as a whole. But we know that the majority of children attend low- or mediocre-quality programs. Increasing family access to high-quality ECE requires more public investment. The recommendations put forth by the consensus committee offer a vision for a transformed, effective financing structure that builds on six principles.
The committee also highlighted five goals that would be ensured under an integrated set of laws and policies:
● Providers will receive financial support based on the cost of high-quality programs.
● Providers meeting high standards will get core financial support to enable recruitment and retention of well-qualified teachers to meet children’s developmental needs.
● Families seeking early care and education programs will be charged no more than they can reasonably afford, with some paying nothing.
● Providers will see ongoing investments in a support and accountability infrastructure to help them maintain high quality.
● Public funding will be at a level that enables an adequate, equitable, and sustainable system.
Current ECE funding is inefficient and inadequate. As the committee says in its conclusion, “for too long, the nation has been making do with ECE policies and systems that were known to be broken.” Full implementation of the committee’s vision will require a transition period, political will, and political leadership at all levels of government. Below are the 10 recommendations from the committee for actors in federal, state, and local government; private sector stakeholders; institutions of higher education; and philanthropy. They fall into six areas: effective financing structure; cost sharing; transition planning; workforce transformation financing; business supports; and progress assessment.
An Effective Financing Structure
“To realize the considerable potential benefits of early education, an integrated framework of laws and policies is needed, in which financing is used to bring about an accessible, affordable, and high-quality system for all children from birth to kindergarten entry.” (p. 201)
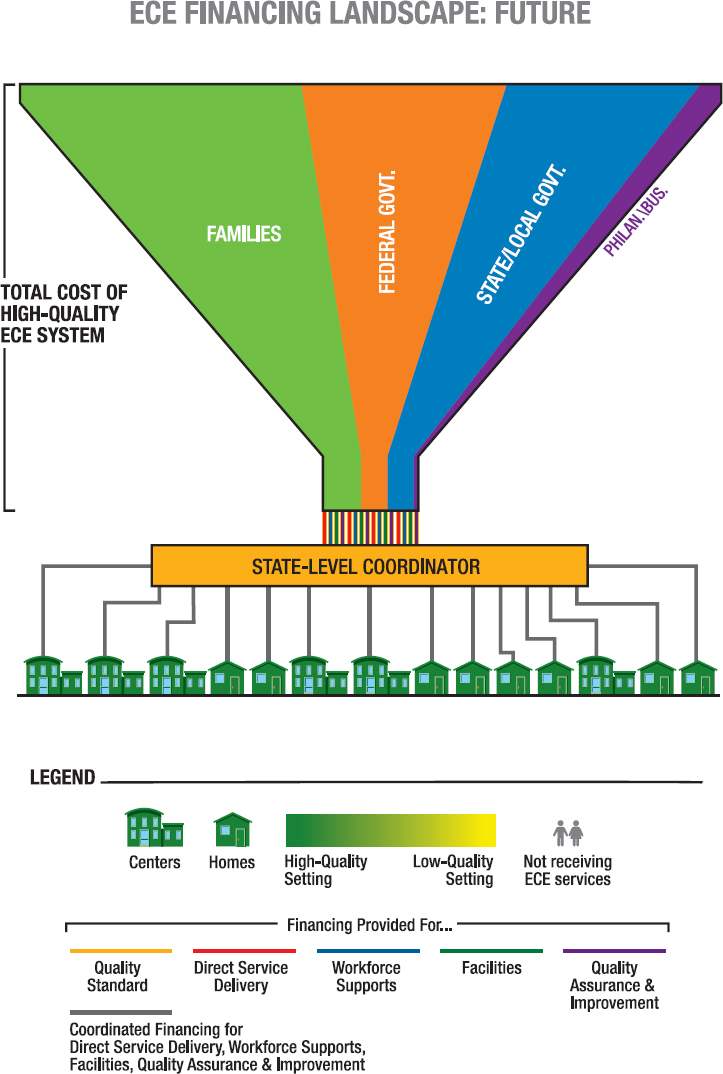
Source: Figure 7-3, https://www.nap.edu/read/24984/chapter/9#200
Consistent high-quality standards and cost-based payments
Recommendation 1: Federal and state governments should establish consistent standards for high quality across all ECE programs. Receipt of funding should be linked to attaining and maintaining these quality standards. State and federal financing mechanisms should ensure that providers receive payments sufficient to cover the total cost of high-quality ECE. Quality standards currently vary across states and federal programs, which means early care and education providers may be required to meet multiple sets of overlapping—and sometimes conflicting—requirements. This can be burdensome for providers and often results in confusion and inefficiencies. To ensure access to high-quality ECE for all children, the federal government and states should use consistent quality standards (linked to the Transforming the Workforce report) across all publicly funded programs and initiatives. Quality standards should address staff qualifications and compensation, professional development, coaching and mentoring, and quality monitoring and assurance. Federal and state funding should be set at the level necessary for providers to attain and maintain the quality standards. With regards to child care subsidies, for example, provider reimbursement rates should be set to reflect the actual cost of providing high-quality ECE and should reflect the costs of serving children with differing physical, emotional, and linguistic needs.
Ensuring Access to High Quality
Recommendation 2: All children and families should have access to affordable, high-quality early care and education, and access should not be contingent on parent income or work status.
The following are necessary to fulfill recommendation 2:
- ECE programs and financing mechanisms (with the exception of employer-based programs) should avoid setting eligibility standards that require parental employment, job training, education, or other activities.
- Federal and state governments should set uniform family payment standards that increase progressively with income and are applied if an ECE program requires a family contribution (payment).
- The share of total ECE system costs not covered by family payments should be covered by a combination of institutional support to providers who meet quality standards and direct assistance to families based on uniform income eligibility standards.
Federal ECE assistance programs are currently only available to parents who are employed or participating in approved education and training activities, increasing developmental gaps and inequities for young children whose parents are not employed. Research suggests that increasing access to ECE can actually have the effect of increasing parental employment.
Uniform government family payment standards would help families select among a variety of ECE providers that meet their needs and preferences. These payment standards should be set to ensure that families of all income groups have access to high-quality ECE. The amount of family payment would be determined on a progressive scale so that the share of family payment expected increases as household income rises, reversing the current pattern where families with lower incomes ineligible for no-fee ECE options typically pay a larger share of their household income than do families with higher incomes. This kind of arrangement has the potential to reduce economic segregation, as ECE programs serving only children from families with low-incomes begin to also serve children from other socioeconomic backgrounds.
State-Level Coordination
Recommendation 3: In states that have demonstrated a readiness to implement a financing structure that advances principles for a high-quality ECE system and includes adequate funding, government or other state-level entities should act as coordinators for the various financing mechanisms that support early care and education, with the exception of federal and state tax preferences that flow directly to families.
State governments should act as coordinators of most of the revenue streams and financing mechanisms supporting ECE in order to eliminate the administrative burden on providers. States should only be given this responsibility after showing a willingness to implement a financing structure that advances the principles of high-quality ECE. States would distribute federal and state funds to providers and families and create an administrative structure that best fits the states’ needs. One way a state could show that it is ready to implement this recommendation is by meeting or exceeding Head Start standards in its pre-K programs and investing adequate funds to deliver high-quality ECE to infants and toddlers.
Even with a coordinated financing structure, multiple funding streams would still be needed. For example, some families may use Head Start services but also need ECE services during nonstandard work hours. A coordinated financing structure does not mean federal revenue streams should be consolidated and distributed to states as block grants, however. The recent history of block grants shows that the use of such grants often leads to decreased federal funding.
Sharing the Cost for High-Quality Early Care and Education
“To build adequate, equitable, and sustainable financing with effective incentives for quality, additional resources will need to come from a combination of public and private resources, with the largest portion of the necessary increase coming from public investments.” (p. 213)
Public Share of Costs
Recommendation 4: To provide adequate, equitable, and sustainable funding for a unified, high-quality system of ECE for all children from birth to kindergarten entry, federal and state governments should increase funding levels and revise tax preferences.
There is an urgent need for greater public investments to ensure all families can access high-quality ECE. The public share will increase during the transition period to a new financing system due to higher quality standards and costs that will make ECE less affordable for families unless they receive financial assistance. The committee estimates that its recommendations would require at least $140 billion of annual funding, equal to about 0.75 percent of U.S. gross domestic product, slightly less than the average 0.8 percent of GDP spent by OECD nations on ECE. The committee estimates that an affordable family contribution would yield about $58 billion, leaving a need of at least $82 billion in public funding, an increase of about $53 billion over current spending levels. How that cost should be distributed among levels of government and among revenue sources must be determined through political processes, where the benefits of a high-quality ECE system are weighed against raising taxes or reducing other public spending. Governments must decide whether to rely on a dedicated revenue source or on general tax revenue to fund the new ECE system. The committee emphasizes that increased ECE spending should not be offset by cutting other essential services to children and families.
If new taxes are imposed to pay for ECE, the tax burden should either be progressive or proportional, but not regressive. An income tax is a viable option for a progressive tax, while state sales taxes are likely to be regressive. A good tax source for funding ECE should also be stable over economic cycles and should increase with population growth.
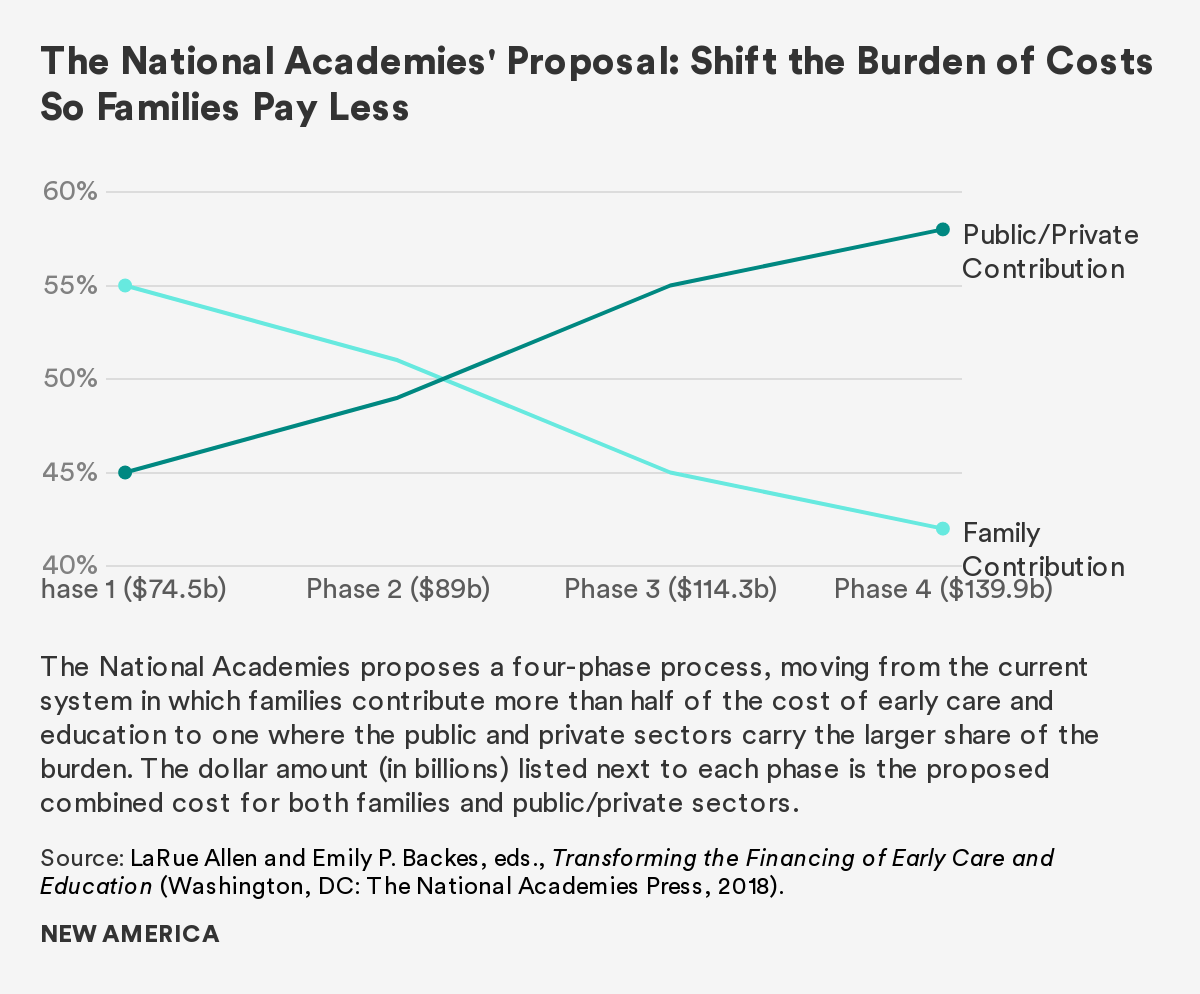
Families’ Share of Costs
Recommendation 5: Payments for families at the lowest income level should be reduced to zero, and if a family contribution is required by a program, that contribution should progressively increase as income rises.
The current ECE financing structure is regressive because the fees paid by low- and middle-income families generally account for a greater share of household income than fees paid by wealthier families. There are pros and cons to both no-fee approaches and approaches that require families to pay an affordable share of costs. A no-fee approach could promote socioeconomic integration in ECE settings, which has been shown to benefit all children. Such an approach would also ensure that no children lack access to ECE due to financial barriers. However, a no-fee approach also would transfer some resources from the public to the affluent, subsidizing high-income families, and the higher public cost of a no-fee approach could cause policymakers to limit eligibility to children from low-income families, further exacerbating economic segregation.
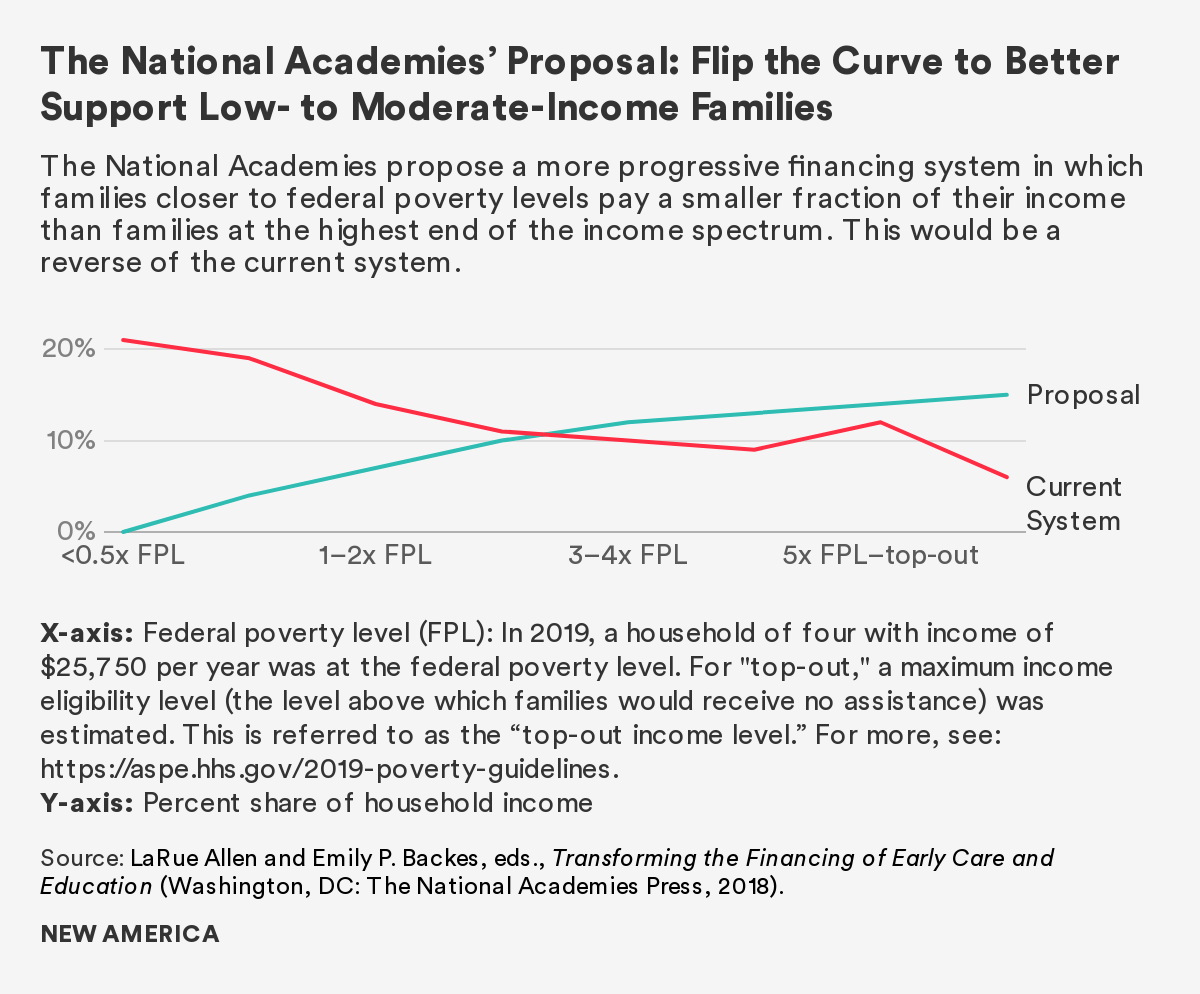
A Note on Other Private Sector Stakeholders:
“While employers’ and philanthropies’ financial contributions to early care and education are small relative to the scale of the contributions of parents and the public sector, this sector’s leadership and active participation in asserting the importance of and setting the vision for systemic transformation are essential. The private sector has the potential to play a critical role advocating for policies and leveraging available dollars to support high-quality ECE services and systems, particularly during the transition phases for moving from the current fragmented and failing system to an effective, high-quality ECE system.” (p. 220)
Planning for the Transition to High Quality
“Local-, state-, and national-level planning efforts, taken together, are critical to facilitating the implementation of an integrated financing system as envisioned in this report by identifying key stakeholders charged with moving the plans forward, building constituencies to support systemic transformation, and leveraging resources to bring about high-quality early care and education that is affordable and accessible for all children.” (p. 225)
Recommendation 6: A coalition of public and private funders, in coordination with other key stakeholders, should support the development and implementation of a first round of local-, state-, and national-level strategic business plans to guide transitions toward a reformed financing structure for high-quality early care and education.
Transitioning from the current ECE financing structure to an entirely new structure will require time, resources, and thoughtful coordination and planning. During this transition period, the private sector will have an important role, including in: building coalitions in support of initiatives to spur change, using investments to drive implementation of a new financing structure, and holding the public sector accountable for improving ECE equality. Developing public-private partnerships, such as the one in Virginia, will be important during the transition period to leverage resources and ensure a commitment in moving toward a high-quality system. Private funders should work with public funders and other stakeholders to develop and implement strategic business plans at the local, state, and national level to guide the transition toward a new financing structure.
Financing Workforce Transformation
Considering the financial resources needed for workforce transformation, compensation, higher education, and professional development must be part of the conversation. Because of limited funding in the system, qualification requirements have not significantly raised compensation.
System-Level Workforce Development
Recommendation 7: Because compensation is not currently commensurate with desired qualifications, the ECE workforce should be provided with financial assistance to increase knowledge and competencies and to achieve required qualifications through higher-education programs, credentialing programs, and other forms of professional learning. The incumbent workforce should bear no cost for increasing its knowledge base, competencies, and qualifications, and the entering workforce should see costs limited to a reasonable proportion of postgraduate earnings, so that diversity in the pipeline of ECE professionals is maintained and promoted.
The following are essential for achieving recommendation 7:
- Existing grant-based resources should be leveraged, and states and localities, along with colleges and universities, should work together to provide additional resources and supports to the incumbent workforce, as practitioners further their qualifications as ECE professionals.
- Government should provide appropriate supports in order to limit to a reasonable proportion of expected postgraduate earnings any expenses incurred by prospective ECE professionals not covered by existing financial aid programs.
Recommendation 8: States and the federal government should provide grants to institutions and systems of postsecondary education to develop faculty and ECE programs, and to align curricula with the science of child development and early learning and with principles of high-quality professional practice. Federal funding should be leveraged through grants that provide incentives to states, colleges, and universities to ensure higher-education programs are of high quality and aligned with workforce needs, including evaluating and monitoring student outcomes, curricula, and processes.
Under the current system, the cost of professional training is paid for either directly by the workforce or is shared between the workforce and employers. The current ECE workforce should not be financially responsible for any of the costs associated with additional training since it is unrealistic that these workers would be able to repay loans with future wages. The entering workforce should have financial assistance so that its education costs are limited to a reasonable proportion of future earnings. Asking providers to cover the costs would also pose serious difficulties since many are small businesses that operate with limited budgets. Therefore, additional federal and state funding will be necessary to help the workforce achieve higher levels of training and education.
Once workforce compensation reaches higher levels, it may be reasonable to ask ECE professionals to contribute to the cost of obtaining additional qualifications. The expected financial contribution from the workforce should still be a small percentage of expected future earnings. State officials will need to use public colleges and universities to promote high-quality, affordable training for ECE professionals and should create options to assist private institutions to make low-cost training available. Targeted financing mechanisms should be put toward supporting culturally and linguistically diverse professionals.
State leaders will also need to find ways to spur higher education programs to align coursework and experiences with the core knowledge and competencies needed by the ECE workforce. The federal government can play a role as well, by providing grants to state higher education systems to align curricula with the latest science of child development and early learning, ensure affordability for the workforce, and support faculty and program development. It will also be important for states to support efforts to streamline career pathways through the development of stackable credentials and coursework sequencing that ensures seamless articulation between preparation programs.
Business Supports
Because access to high-quality ECE depends on the financial viability of providers, the workforce needs to be supported with business, planning, and financial management tools, resources, and technical assistance. The 2014 CCDBG Reauthorization Act required states to take steps to improve the business practices of providers and mandated that states submit plans to provide technical assistance to providers. Since many providers might not have the expertise to manage business and financial responsibilities on their own, participation in a shared services alliance (SSA) can be helpful for cutting costs. The cost savings resulting from participation in an SSA could then be used to invest in quality improvement, such as higher compensation for ECE educators. Higher education programs for ECE professionals should include training focused on business and financial management to ensure that program leaders have the competencies necessary to ensure that their operations are sustainable.
Assessing Progress Toward Quality
“Given the large amount of resources required, it is essential to monitor the effects of key changes as they are phased in, to ensure investments yield desired results for children, the workforce, and families. It is also important to incentivize innovation and a diversity of approaches to quality improvement and to evaluate those innovations and approaches.” (p. 233)
Recommendation 9: The federal and state governments, as well as other funders, should provide sustained dollars for research and evaluation on early childhood education, particularly during the transition period, to ensure efforts to improve the ECE system are resulting in positive outcomes for children and in the recruitment and retention of a highly qualified workforce.
As ECE transitions into its new system, it will be important to monitor and evaluate the impact of the changes and their effect on the well-being of children, families, and the workforce. There is still not a strong evidentiary base on many important issues related to the workforce, including the effects of requiring particular degrees for ECE educators. Despite this lack of clear evidence, practical reasons exist for developing a system in which more of the ECE workforce has stronger qualifications. Stronger qualifications will strengthen the case for increasing compensation to the point necessary to recruit and retain well-qualified staff, will elevate the stature of the workforce and help it be seen as professional, and will lead to higher levels of well-being for employees. But these additional qualification increases and other sweeping changes to the ECE system should be carefully monitored to ensure investments yield the desired results.
Federal and state governments should fund sustained research to determine the success of efforts to improve the ECE system and workforce. Multiyear evaluations will be necessary throughout the transition to the new high-quality ECE system. Data should be collected to assess whether rising compensation levels are actually leading to the recruitment and retention of highly qualified staff. Government should also provide funding for facility needs assessments to understand which communities need newly constructed or renovated ECE facilities.
A comprehensive, nationwide system will be needed for the collection, reporting, sharing, and use of key information on the status of the ECE system both before and after the transition to high quality. While a number of monitoring systems are in place across the states, they are insufficient for tracking system-wide progress. This system should conceive of quality broadly and include not only structural features of care and education, such as teacher-child ratios, but also process measures, including observational measures of teacher-child interactions. Such a system should also include regular assessment of workforce well-being through the use of tools such as the Supportive Environmental Quality Underlying Adult Learning (SEQUAL) instrument that is administered directly to teachers and assistant teachers and measures how well staff is being supported to develop knowledge and skills on the job. A comprehensive system like this is essential for ensuring that new investments are leading to the desired outcomes.
Ongoing Data Collection and Research
Recommendation 10: The federal government should align its data collection requirements across all federal ECE funding streams to collect comprehensive information about the entire sector and sustain investments in regular, national data collection efforts from state and nationally representative samples that track changes in the landscape over time, to better understand the experiences of ECE programs, the workforce, and the developmental outcomes of children who participate in programs.
There are a number of holes when it comes to ECE data collection. More comprehensive and ongoing data about children, programs, and the workforce are needed. A revamped financing structure should include funding to align data collection requirements across all federal ECE funding streams. All federally funded programs should be required to submit the same type of data to allow for comparisons across settings. The federal government could also create incentives to encourage the incorporation of aligned data collection for state and local ECE programs. It is also important to understand whether or not all children have access to high-quality ECE experiences and are ready to learn when they enter elementary school.
Resources are needed for collecting data from a nationally representative sample of young children over regular intervals, similar to what currently takes place for older children via the National Assessment of Educational Progress (NAEP). For younger children, though, doing this accurately and appropriately will be more costly than for K–12 due to the need for one-on-one assessments. But spending on collecting data about children’s skills is essential for tracking whether investments in ECE are associated with improvements in child outcomes across a diverse set of measures. The federal government should also collect data at regular intervals to track children’s experiences in ECE settings and changes in the ECE workforce over time. There have been federal studies done before on the ECE sector but not on a regular basis, making it difficult to track change and progress over time. There is much to learn from data collection in the K–12 sector, particularly with NAEP and with the National Center for Education Statistics’ Schools and Staffing Survey, now known as the National Teacher and Principal Survey.
See the Glossary for key word definitions.
Behind the Numbers

According to the Transforming the Financing report, the total cost of offering accessible and affordable ECE with a highly qualified workforce in the U.S. amounts to at least $140 billion per year. This “Behind the Numbers” section explains the assumptions the committee made to estimate the cost of a high-quality ECE system, such as child-to-staff ratios, staff compensation, and length of school day. It also breaks down and explains the different types of costs that are incurred when providing high-quality ECE, such as personnel costs and costs related to workforce development. Finally, this section explains how the cost of providing high-quality ECE is distributed between the public sector and contributions from families under different scenarios.
1. What assumptions does the committee make to estimate the total cost of a high-quality ECE system?
The calculation serves as an example for decision-makers working to implement the major recommendations of the Transforming the Workforce for Children Birth Through Age 8: A Unifying Foundation (2015) report. The committee has specified an array of quality-related assumptions to estimate the total cost of a high-quality ECE system, tied to these six principles:
- Financing a Highly Qualified Workforce
-Staff levels and structures: reflect the child-to-staff ratios recommended by NAEYC
-Qualifications: all ECE professionals meet competency-based requirements
-Compensation: all staff, including ECE educators, directors, specialists, and other staff, receive
compensation that reflects their education level, qualifications, and responsibility12 - Affordability and Equitable Access
-Full-day, full-year (40 hours per week, 52 weeks per year3) of ECE services
-Includes young children from birth to kindergarten entry - Easy-to-Administer Financing with Incentives for Quality
-A harmonized system where all costs are lumped and financed together - Variety of High-Quality Service Options
-High-quality, financially sustainable delivery options, including home-based and center-based services - High-Quality Facilities
-Facilities that offer young children opportunities for cognitive, emotional, and physical development
-Immediate costs for modernizing or building facilities (or transition costs) and long-term costs (occupancy costs) for maintenance or rental costs of the space - Quality Assurance and Improvement
-Monitoring and regulation systems
-Quality improvement and accountability systems
2. What costs are needed for high-quality ECE?
Total costs = on-site costs + system-level costs
a) On-site costs:
- Personnel costs (aggregate service delivery costs): staff compensation and benefits, on-site staff supports, and professional development Personnel Costs = unit cost per child-hour x hours of ECE Utilized
- Unit cost per child-hour
- Assume that the transition to high-quality early care and education will occur over a four-phase process
- Hourly costs by age group and by four phases, at each phase:
- A higher share of staff with desired qualifications
- Higher wage linked to each level of education
- Hours of ECE Utilized (see Figure 6-1 on the report)
- Non-personnel costs: include facilities occupancy costs, such as rent and utilities; education equipment and supplies, including technology; office supplies; and food and kitchen supplies
Non-personnel Costs = 8 percent added to the first phase, amount constant across the four phases6
- Reserve (Adjustment Factor): to cover inefficiencies like temporary drops in enrollment, delays in state reimbursement, or nonpayment by families
Reserve (adjustment factor) = A constant 10 percent is added to personnel (i) and non-personnel (ii) costs
b) System-level costs:
- related to system-level workforce development supports and quality assurance and improvement, such as monitoring and regulation, quality and systems improvement and accountability, data systems, and licensing and accreditation
System-Level Costs = a constant factor of 8 percent was added to the aggregate service delivery costs (i) at each phase
3. How much is the total cost, under dynamic estimate?
a) The annual cost of a high-quality ECE system is $140B, under dynamic estimate
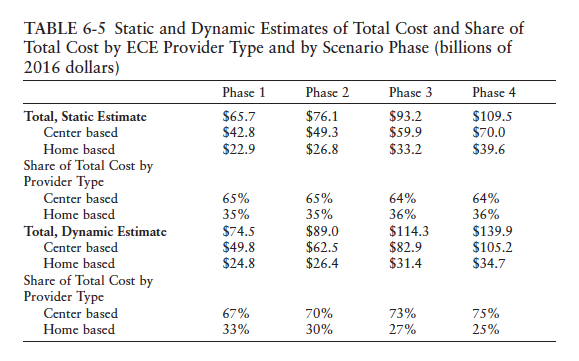
4. Who will pay for ECE?
Total costs = public and private resources + family contributions
a) Possibilities
- Progressive family schedule: targets resources to those most in need, reduces public costs, and retains an additional revenue stream
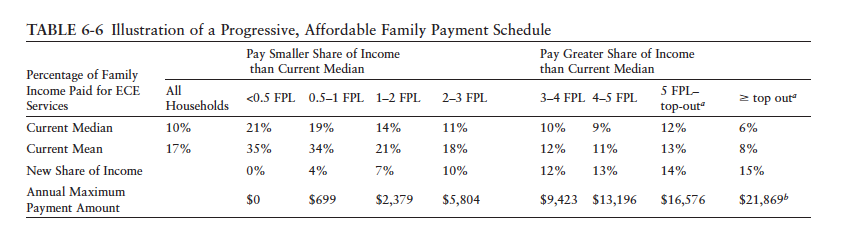
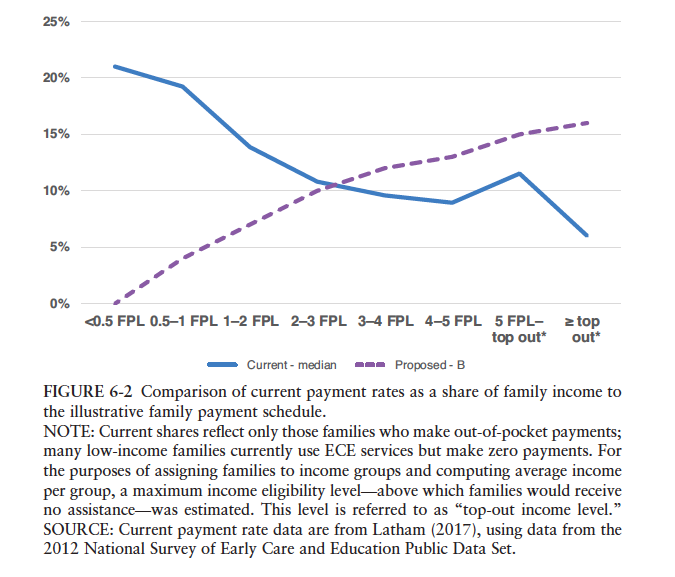
- No fee for families: reduces or eliminates financial barriers to ECE participation, but not charging fees transfers resources from the public to the affluent; target efficiency could be improved if tax revenues for the public share of ECE costs are generated progressively
5. Contextualizing the numbers
If families pay according to the progressive scale, the public/private share will be 58 percent ($82 billion) under the dynamic estimate, which is $53 billion over current public/private expenditures.
| Phase 1 | Phase 4 | |||
|---|---|---|---|---|
| Static | Dynamic | Static | Dynamic | |
| Total Costs in Billions/Year (% of GDP) | 65.7(0.35%) | 74.5(0.4%) | 109.5(0.59%) | 139.9(0.75%) |
| Family Share (%) | 49% | 55% | 36% | 42% |
| Public Share (%) | 51% | 45% | 64% | 58% |
See the Glossary for key word definitions.
Citations
- The committee took a national-level perspective on the cost of implementing high-quality ECE, acknowledging influences from various factors, including complexity in the marketplace; local variations; types of service (center-based, home-based); various kinds of funding and sponsorship, organization structure, and size; and varying costs of providing services to different groups of children. Therefore, the true costs incurred by individual service providers can be very different.
- Adequate levels of compensation include an increased level of benefits (applied equally for all staff positions) and paid non-child contact time and release time for professional development.
- The committee defined key salary levels as: (1) ECE educators with a bachelor’s degree: equivalent to child-family social workers with a bachelor’s degree by phase 2; equivalent to kindergarten educators by phase 4, though not annualized for a full year (12 months) of ECE service. (2) Lead educators: equivalent to kindergarten educators for a 9-month contract in phase 4.
- For the hourly cost calculation, costs were computed on the basis of full-time (40 hours per week), full-year operation (52 weeks per year). For the aggregate cost calculation, two different measures of duration were applied. The weekly hours were multiplied by 52 weeks, then decreased by 5 percent to account for an anticipated decrease during the summer in demand for ECE services.
- For the static analysis, the committee applied the current average hours per week in each type of ECE setting by child-age group, based on Latham (2017) using 2012 data from the NSECE Public Data Set. This result is calculated separately for each family income category.
- The dynamic analysis assumed that as affordability improves, the average weekly hours of ECE used by enrolled children would increase for all age and income groups. Whereas prekindergartners currently spend more time in unpaid ECE settings than younger children, the dynamic estimates assumed a higher participation in full-time programs for prekindergartners.
Putting it into Context

Under its current system of funding, the United States is not investing enough to consistently provide adequate access and secure quality in early childhood services. According to the Center for the Study of Child Care Employment, “as estimates are used to inform policy and revenue strategies, it is necessary for policymakers and the public to understand the distance between the current system and the system that is needed and to be able to design short- and long-term goals to close the gap.” The Transforming the Financing of Early Care and Education report presents a cost model that would close that gap.
Putting the Cost Estimate into Context
While the estimated $140 billion price tag may seem high, these numbers are not out of line with other indicators of investment in early education as measured through shares of the gross domestic product (GDP) in Organisation for Economic Co-operation and Development (OECD) countries. In addition, when the current cost of ECE and the amount that families will pay in the harmonized system are taken into account, the total price is between $53 billion and $82 billion over current public/private expenditures (see Chapter 6 for an in-depth analysis).
Comparing domestic and international practice as measured through shares of GDP
- U.S. GDP
- In 2018, it was $20.5 trillion. According to the OECD, the U.S. puts less than 0.5 percent of this toward ECE. When the transformation to a harmonized system of high-quality care and education is complete, the projected $140 billion needed to support the system equals a share of less than 1 percent (0.75 percent) of total GDP.
- OECD GDP
- The U.S. spends less than half the average of what other industrialized countries pay for quality ECE. The OECD and the European Union suggest that 1 percent of GDP should be spent on ECE services. While there is variability—France, New Zealand, and the Nordic countries spend 1 percent or more—on average, OECD countries spend about 0.8 percent of GDP on ECE. Contributing less than 0.5 percent, the U.S. joins countries that spend below this average, such as Japan, Portugal, and Turkey.
Breaking down current U.S. federal budget
- Current U.S. spending for 2019–2020 (10/1/19–9/30/20) = $4.7 trillion, representing 21.6 percent of GDP
- Mandatory spending = $2.98 trillion/60 percent of budget
- Social Security: $1.1 trillion
- Medicaid: $447 billion
- Medicare: $694 billion
- Other: $744 billion (food stamps, unemployment compensation, child nutrition, child tax credits, SSI, and student loans)
- Discretionary spending = $1.4 trillion/30 percent (includes defense/military, education, energy, interest on the national debt)
- Military/Defense = $936 billion
- Health & Human Services = $105.8 billion
- Other discretionary spending = $396 billion
- Interest on the national debt: $376 billion/10 percent (the debt currently amounts to $18 trillion)
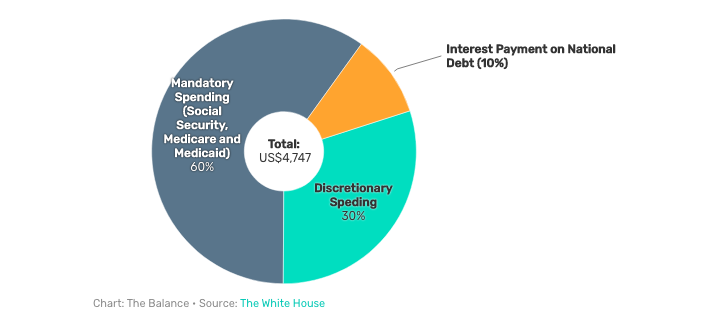
Examining our spending on children
Public spending on children aims to support their healthy development and help them fulfill their human potential, which makes federal spending on them an investment in the nation’s future. To inform policymakers, children’s advocates, and the general public about how public funds are spent on children, the annual Kids’ Share report provides an analysis of these federal expenditures. It also projects federal expenditures on children through 2029 to give a sense of how budget priorities may unfold absent changes to current law. Some highlights:
- In 2018, the federal government spent about $6,200 per child younger than 19, less than in 2017 after adjusting for inflation. This decline is driven by a reduction in federal spending on education and nutrition programs and a temporary reduction in child-related tax credits.
- As a share of the economy, federal investments in children fell to 1.9 percent of GDP in 2018, the lowest level in a decade.
- Medicaid is the largest source of federal support for children, followed by the child tax credit and the earned income tax credit. More than three-fifths of federal expenditures on children are from health or tax provisions.
- The share of federal expenditures for children targeted to low-income families has grown over time, reaching 61 percent in 2018.
- Children’s programs are projected to receive only 3 cents of every dollar of the projected $1.5 trillion increase in federal spending over the next decade.
- Assuming no changes to current law, the children’s share of the budget is projected to drop from 9.2 percent to 7.5 percent over the next decade, as spending on Social Security, Medicare, Medicaid, and interest payments on the debt consume a growing share of the budget.
- By 2020, the federal government is projected to spend more on interest payments on the debt than on children.
- Over the next decade, all categories of spending on children except health are projected to decline relative to GDP; most categories also see declines or remain at similar levels in real dollars.
- States and localities pay the major proportion of education expenditures; federal investment is projected to fall.
In comparing 2018 expenditures for K-12 education and early care and education, the Kids Share report found that:
- Education allocations = $41 billion
- Early care and education allocations = $15 billion
In addition, future spending on young children as a percentage of GDP is projected to fall relative to other investments:
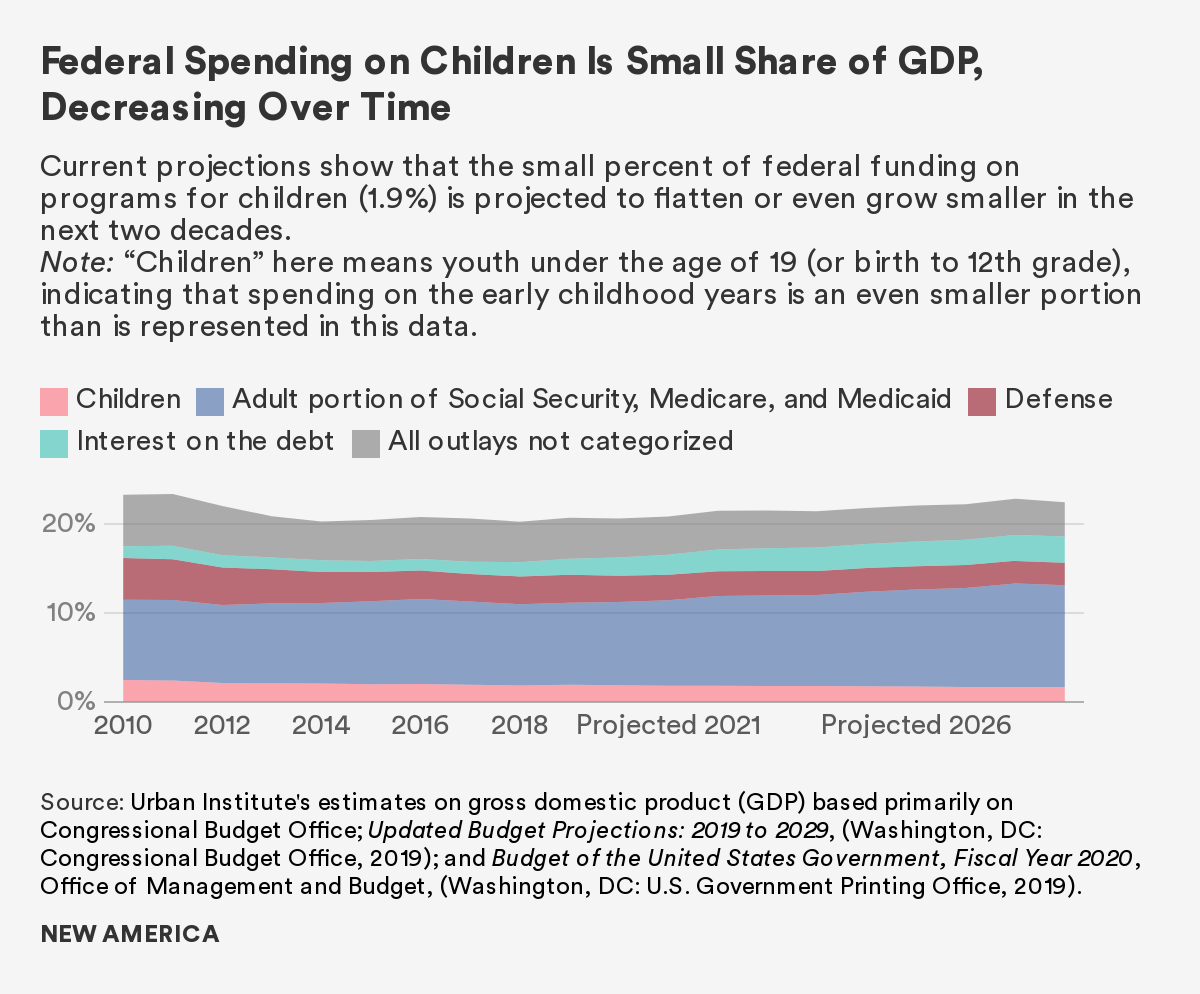
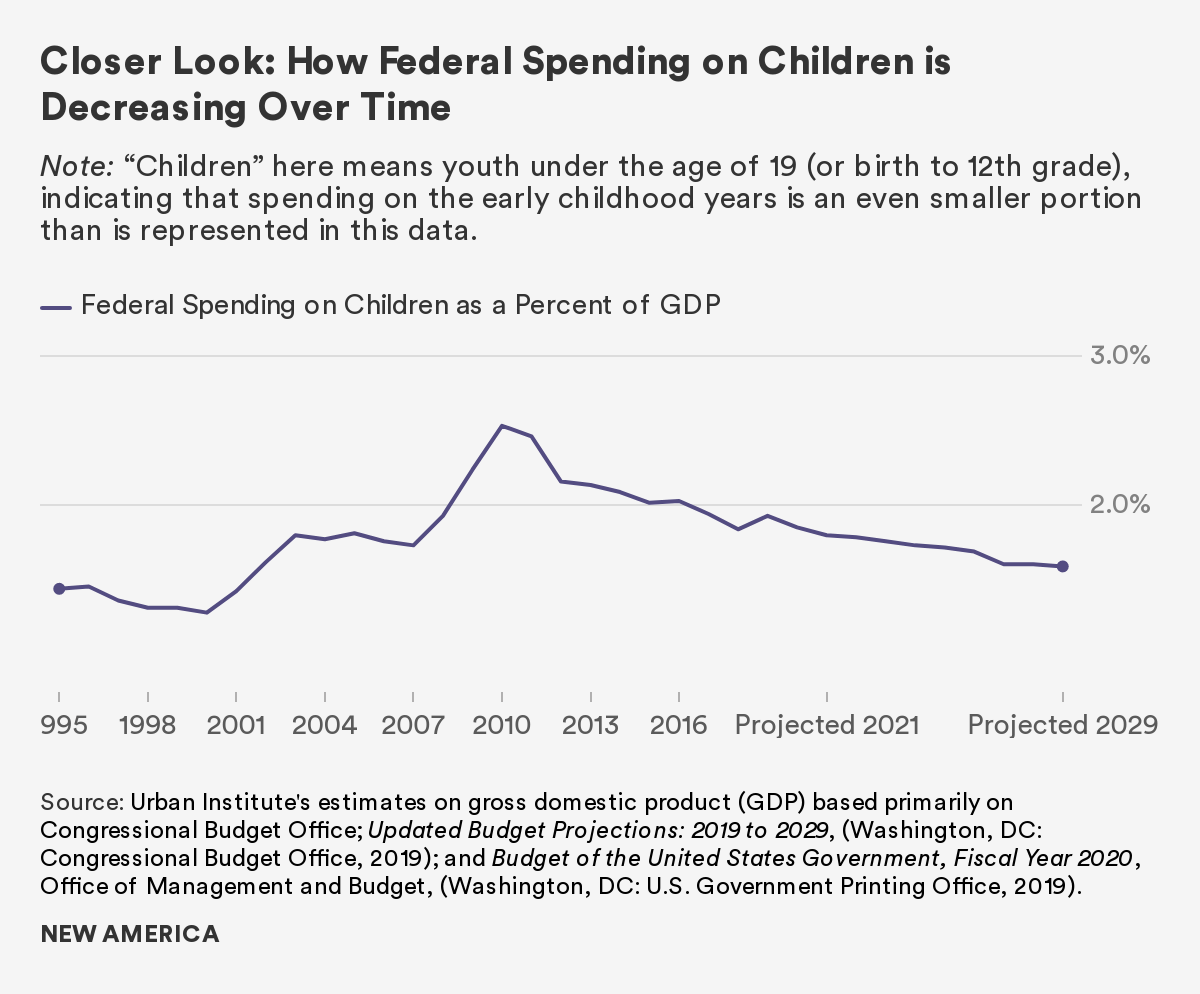
See the Glossary for key word definitions.
Learning from States and Other Countries
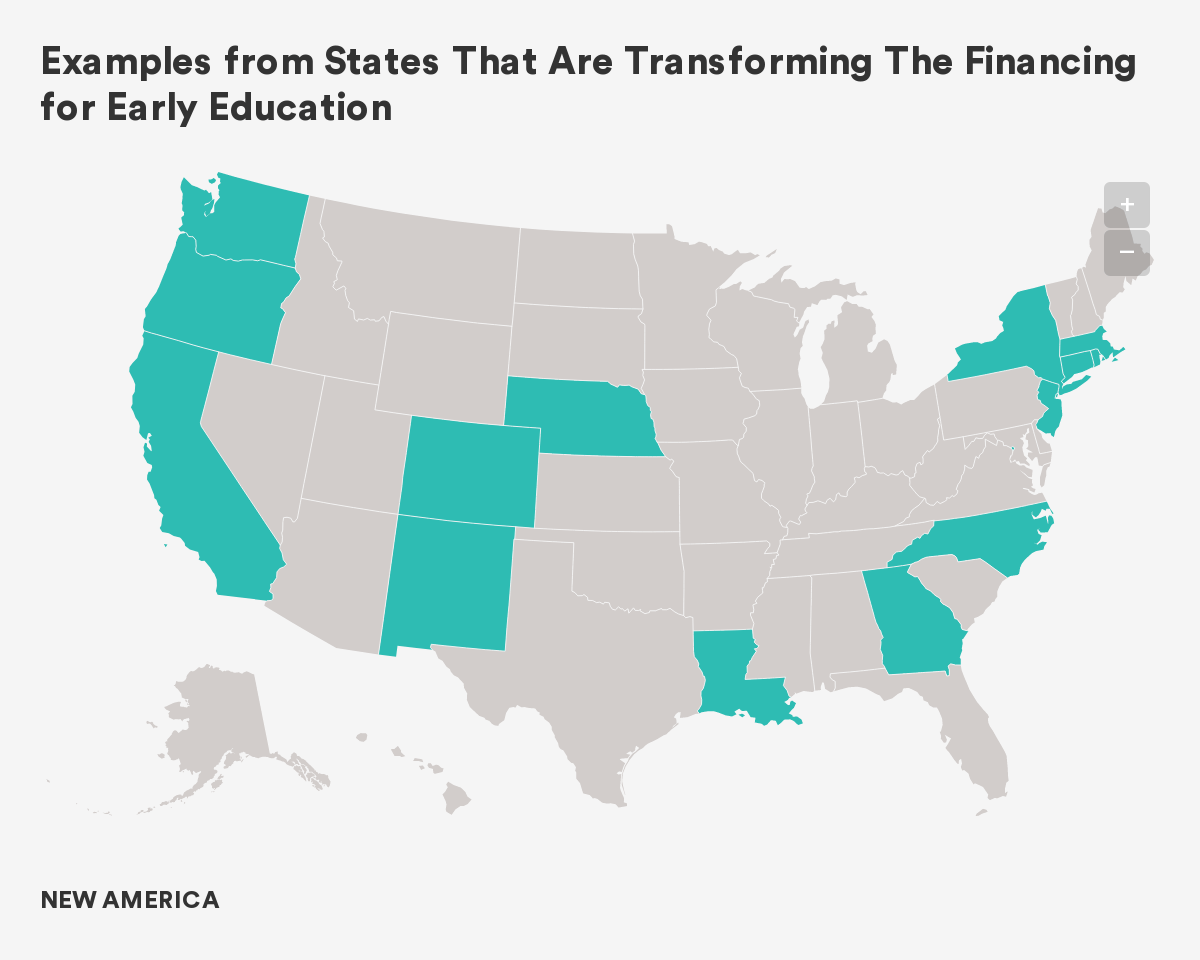
The Transforming the Financing report recommends a major overhaul in the way the United States funds and ensures access to high-quality early care and education for young children from birth to kindergarten entry. While such a change will take time, some places have already taken steps to address some of the challenges outlined in the report. This section highlights state and local actions to increase compensation for the workforce and improve ECE quality, access, and affordability. This section ends with a look at various international approaches to ECE systems building and funding.
Task Forces, Working Groups, and Governance Structures
California
In 2019, the California Assembly Blue Ribbon Commission on Early Childhood Education released its final report with recommendations for “an early learning system that works for children, families and providers.” The commission is envisioning universal access to early education for every family with a focus first on children in low-income families but recognized that while these increases represent an important start, they fail to address the persistent problem of raising workforce compensation. In November 2019, the governor created the State Early Childhood Policy Council and the State Early Childhood Action Research Team; the team is charged with creating a comprehensive plan for universal preschool and access to high-quality, affordable child care.
New York State
The Child Care Availability Task Force, convened by the governor in 2018 and made up of providers, advocates, business, unions, and government, will examine options and develop recommendations to improve access to high-quality, affordable child care. The task force is charged with addressing the shortcomings in the current subsidy system and will look at access to affordable care, availability of child care for families working nontraditional hours, statutory and regulatory changes to promote or enhance access, and the impact of tax credits and deductions. Recommendations will be submitted at the end of 2020.
Oregon
The Task Force on Access to Quality Affordable Child Care will develop recommendations to the legislative assembly to improve access to and affordability of child care by soliciting input from underserved populations, researching how child care subsidies are currently being used (and how they have worked in the past), and studying state and federally funded child care and early learning programs.
Washington State
The Washington Childcare Access Now (CAN) Act establishes a child care collaborative task force to develop a plan for affordable, quality care that includes an investment in the workforce.
Washington, DC
The Birth-to-Three For All D.C Act was signed into law in 2018, but has yet to be fully funded or implemented. The law boosts child care subsidies to both expand access to families and increase the wages of child care workers. It targets families who need it the most, but provides support to everyone.
New Mexico
Senate Bill 22 established a new cabinet-level department dedicated to programs for children from birth to five, the Early Childhood Education & Care Department, with oversight of child care assistance, pre-kindergarten, and home-visiting programs. This department is seen as an important step toward creating more consistency, accountability, and quality across ECE.
Governors’ 2019 and 2020 Budget Proposals
In the 2019 governors’ races, a record number of candidates across party lines included a focus on early care and education in their platforms. As new budget proposals were rolled out, 32 governors and the mayor of Washington DC proposed $2.9 billion in additional state funds for early care and education programs. Many governors continued this trend of advocating for additional state funding for early care and education by including funding increases in their 2020 budget proposals. While the bulk of proposed funding focused on access to pre-K, a few states did take on the important issue of funding for infant and toddler programs, which are higher cost. Here is a summary of state priorities among the seven states with the highest proposal levels:
- California: Expanding the number of subsidized child care facilities, improving and expanding campus-based child care options, expanding full-day kindergarten, and increasing home visiting programs targeting infant-maternal health improvements for African American families.
- Colorado: Funding for full-day kindergarten as a way to improve outcomes for children, reduce child care burden for families, and free up resources for districts to invest in additional pre-K and child care slots, as well as increased funding to help an additional 6,000 children attend the Colorado Preschool Program.
- Washington, DC: A per-child increase in spending that exceeded all other states to enhance the existing universal pre-K program, as well as the conversion of old school buildings into new child care centers, expansion of early action initiatives, improving provider rates, and expanding the refundable child care affordability tax credit.
- New Mexico: The state established a new Department of Early Education and Care, as well as funding to continue to move toward universal pre-K and expand home visiting and early screening services. In 2020, in addition to funds supporting the new Department of Early Education & Care, the state approved a $320 million non-recurring appropriation to create the Early Childhood Trust Fund.
- Oregon: $220 million for early care and education over the state’s two-year biennium budgeting process, including funds for the Baby Promise program to increase access to infant and toddler care and to establish a fund focused on equity in early care and education.
- Pennsylvania: An expansion of free, full-day kindergarten so that it’s available to every child, along with a $30 million increase for high-quality early childhood education.
- Virginia: $95 million to improve the quality and availability of pre-K for three- and four-year-olds from families with low incomes, which is estimated to allow an additional 11,000 children to enroll over the next two years.
State and Local Efforts to Address Specific Components of Transforming the Financing
1) Supporting & Compensating a Qualified Workforce
Self-sufficiency wages:
Bills in six states this year specifically addressed the importance of wages for early educators:
- In Washington State, the child care collaborative task force makes recommendations related to access to quality care to the governor and legislature. Among the issues on which it will deliberate are a number of specifications related to the workforce:
-changing pay scale to achieve parity with K–12 teachers
-preserving and increasing racial and ethnic diversity in the workforce
-ensuring that salary floor is adequate to support recruitment and retention of a qualified workforce
-incentivizing advancements in higher education credentials and equivalencies, training, and years of experience
-considering a provider’s years of experience in the field and at her current site
-differentiating subsidy rates by region
-providing additional compensation to providers serving specific populations, including lower-income families or those with additional linguistic or cultural competency needs. - In Massachusetts, proposed legislation calls for “appropriate professional development and compensation for early education and care providers.”
- In Washington, DC, a law that was signed in 2018, but has yet to be fully implemented, includes a requirement that the Office of the State Superintendent of Education develop a competitive compensation/salary scale for lead teachers and teacher’s assistants with a “cost modeling analysis” to help establish reimbursement rates that reflect the competitive salary scale.
- In New York City, a comprehensive proposal to expand infant and toddler care, NYC Under 3, was introduced to address issues of affordability, availability, and quality of care. The proposal included a provision for investing in the child care workforce through a commitment to living wages for early educators and provides funding for training, professional development, and scholarships as well as for a study to determine reimbursement rates that support quality and provide a wage.
- In Rhode Island, the Moving the Needle on Compensation Task Force made a series of recommendations focused on improving compensation for the infant and toddler workforce. These recommendations include the use of a statewide target wage scale linked to education levels, conducting a public education campaign to highlight the need for improved compensation, and funding a wage supplement demonstration project to help programs retain qualified and effective educators.
- In Nebraska, the Early Childhood Workforce Commission released a plan to fully fund early care and education by 2030. The plan includes a recommendation to close the gap between current investments in early care and education and the total cost of a system with a highly qualified, adequately compensated workforce.
Salary parity:
California’s Blue Ribbon Commission recommended that policymakers ensure salary parity with K–3 educators for those with comparable education and experience, including offering early educators competitive benefit packages that cover health, dental, vision, 20 days paid time off annually, and retirement contribution.
Salary enhancements:
North Carolina’s HB 882 adds a new compensation strategy for early childhood programs that employ qualified teachers who meet new standards. It requires the Division of Child Development and Early Childhood to create a new subsidy enhancement incentive program for programs that use a salary scale and employ qualified teachers. Programs would receive an enhanced child care subsidy payment for doing so, which would give them additional resources to pay teachers better and retain qualified teachers. H882 adds another compensation strategy to two programs already in place:
- The WAGE$ programs supports teacher education and compensation and is made available through Smart Start funding provided by local Partnerships for Children in about half of NC counties.
- The Infant Toddler AWARDS program increased compensation infant toddler leaders who already have an associate degree or higher and who are working full-time in child care programs.
Workforce development plans:
After conducting an ECE workforce study, Colorado developed its Workforce Development Plan 2020, which laid out a set of strategies addressing professional development and education, compensation, leadership, financing, and data and quality improvement.
Collective bargaining:
California enacted A.B. 378, a bill assuring collective bargaining rights for underpaid and overworked home-based child care providers.
2) Financing ECE
Tax Credits
- The state of Louisiana established a set of four School Readiness Tax Credits in 2007. Providers who own and operate a facility where care is given to foster children or to children who participate in the Child Care Assistance Program can claim a refundable tax credit based on the average monthly number of children who attend the facility multiplied by the applicable credit amount based on the quality rating of the child care facility. Refunds range from $750 per child at a 2-star level to $1,500 per child at a 5-star level. Child care directors and eligible staff can claim a refundable tax credit if they work at least six months for a licensed child care facility that participates in the quality rating system and are enrolled in the Louisiana Pathways Child Care Career Development System. Individual teacher and director credits range from $1,715 to $3,429.
- Colorado HB 1005 allows an income tax credit to eligible educators who hold an early childhood professional credential and who, for at least six months of the taxable year, are either the head of a family child care home or are employed with an eligible early childhood education program or a family child care home. The state also enacted HB 19-1013, a limited tax credit to help low-income families cover child care expenses of up to $1,000 per year.
Leveraging state and local tax revenue:
- The recent publication Funding our Future: Generating State and Local Revenue for Quality Early Care and Education1 from the BUILD Initiative provides funding strategies for increasing the revenue from state and local sources that can be directed to high-quality ECE. Based on the premise that state and local tax revenue dedicated for ECE represents a largely untapped approach for leaders to consider, the report enumerates seven available options, provides a set of guiding questions to assess state and local revenue options, and profiles states and localities currently implementing each option.
3) Increasing Access and Affordability
Sliding fee scales:
The Denver Preschool Program makes monthly tuition support available on a sliding scale. The amount of support a family receives is based on family income, the quality rating of the preschool, and the length of day the child attends. Preschools are rated for quality on a scale from 1 to 5. Families with lower incomes who choose higher-quality programs receive a greater amount of tuition support. In Washington DC, subsidized child care co-payments are based on the DC Sliding Fee scale. If the family is assessed a co-pay, it is based on adjusted gross income and family size.
Supports for infant/toddler care:
- A number of states have recently passed Paid Family and Medical Leave legislation, which is being recognized as a key strategy for relieving the high financial burden of finding out-of-home care for very young children. California, New Jersey, Rhode Island, New York, Washington, Massachusetts, Oregon, Connecticut, and Washington, DC have enacted paid family leave policies that ensure parents can take time to care for their babies in the earliest months of their lives.
- In Georgia, the Department of Early Care and Learning has initiated a plan to move 10,000 infant child care slots to a grant-funded model (Quality Rated Subsidy Grants) that enables providers to receive funding on an annual basis instead of being reimbursed based on attendance. This pilot pays providers 35 percent above the state’s base payment rates. In California, the state’s Blue Ribbon Commission recommends that policymakers develop guidelines and provide incentives to licensed family child care homes who wish to specialize in the care of infants and toddlers by establishing a specialized reimbursement rate for those with demonstrated experience and specialized training.
- Citing high costs for infant care ($21,000 per year) in New York City, along with lack of access (one-half of all districts meet the definition of child care deserts) and low levels of public funding (only 7 percent of eligible infants and toddlers are currently supported through public funds), NYC Under 3 increases access and affordability of care by extending child care assistance to working families with incomes up to 400 percent of poverty ($100,000 for a family of four). The proposal also provides funds for startup and expansion.
Tax credits and revenue from taxes:
- Louisiana is providing funding for early care and education programs by implementing a tax on hemp-derived CBD products and dedicating a portion of gambling revenue to its Early Childhood Education Trust.
State investments in expanding access:
- In May 2019, the Oregon legislature passed HB 3427, The Student Success Act, allocating $2 billion to improve education. The Early Learning Account of the Student Success Act leverages $2 million annually to support access to ECE for low-income children from birth to age five. Funds will support expansion of existing programs; support the Equity Fund, a parenting program; and be invested in the early childhood education workforce.
- The 2019 California state budget increased spending on ECE by 15 percent, including expansion of subsidies for 12,400 children, expansion of full-day kindergarten statewide, an increase of 10,000 pre-K seats, and increased access to care for parents in the state work assistance program. Other investments include support for facilities construction, improvements in data collection and utilization, the development of a plan for a comprehensive ECE system, increased family leave periods, and supports for home-based child care providers.
- Louisiana allocated $20 million of its $40 billion state budget to increase access to quality ECE for children four and under.
- Illinois increased funding to its Early Childhood Block Grant to expand and improve 0–5 services and to the Child Care Assistance program to increase access by extending income eligibility from 185 percent to 200 percent of the federal poverty level.
- In Texas, school finance bill HB 3 included funding for the state’s pre-K to help existing programs meet quality requirements and requirements to be full-day.
- In 2019, Washington, DC added $15.8 million in funding for programs included in the Birth-to-Three for All DC Act of 2018, which has not yet been fully funded or implemented. Implementation would build on Washington’s success with universal preschool, expanding access to affordable child care for the youngest children and raising early educator wages.
4) Ensuring Quality Across Settings
Support for facilities:
- Private investments:
- North Carolina’s Self Help, Inc. partnered with the state to guarantee loans to ECE providers using federal block grants from CCDF. The loan guarantee was available to providers who served children whose ECE services were subsidized by the state.
- The Connecticut Health and Educational Facilities Authority partially guarantees private-sector loans to ECE providers. This program combines an interest rate subsidy with its loan guarantee to increase the feasibility of borrowing for ECE programs.
- Tax credit programs also provide opportunities to improve facilities, like the Louisiana School Readiness tax credits program.
- Illinois allocated $100 million for building and updating child care and school facilities as part of an infrastructure package.
- The City of New York’s NYC Under 3 addressed the lack of affordable and accessible infant care by issuing grants for start-up construction and facilities renovation. The proposal offered start-up and expansion grants to providers willing to add infant and toddler seats. These competitive grants would give priority to those in neighborhoods with significant income-eligible populations and limited supply of programs. An additional $500 million capital campaign was included that would build new infant toddler facilities, beginning with city-owned building sites.
- The Federal New Markets Tax Credit, instituted in 2000 to promote economic development and create jobs in low-income communities, provides an incentive for banks, businesses, or individuals to invest in intermediaries that invest in projects in economically distressed areas. While the program is not focused on ECE projects, Head Start and Educare schools have successfully utilized this mechanism, opening the possibility that other ECE programs may qualify for the credit (Transforming the Financing report, p. 145).
5) Estimating the Cost of High-Quality ECE
Cost Modeling/Calculating:
- Identifying a Values-Based Budget for Children, Parents, and Teachers in California is grounded in an “understanding of what is required of early childhood educators and the conditions necessary for effective teaching.” Cost estimates sought to eliminate current disparities among educators based on age of children served, setting, and funding stream.
- A report commissioned by North Carolina business leaders highlights three interrelated issues critical to expanding the state’s pre-K program: accurately determining how many children are eligible but lack access, analyzing whether county waiting lists accurately reflect the need, and eliminating barriers to expanding the program to fully meet the actual need. NIEER used the Cost of Preschool Quality & Revenue calculator to analyze how the state’s pre-K funding mechanism is hampering enrollment.
International Approaches to ECE Systems Building and Funding:
Study 1: Sharon Lynn Kagan, ed., The Early Advantage 2: Building Systems That Work for Young Children: International Insights from Innovative Early Childhood Systems (New York: Teachers College Press, 2019)
This volume begins with the premise that in the rush to address the needs of children, countries are enacting “chaotic policies and services that lack coherent planning and structures,” and as a result compromise both quality and efficiency. The Early Advantage 2: Building Systems that Work for Young Children examines efforts in Finland, England, Australia, Republic of Korea, Singapore, and Hong Kong to advance children’s well-being and enact effective early childhood policies and strategies. The goal of the study was to describe how systems are created and supported, guided by three sets of questions:
- Descriptive questions focused on the “what's”: what system elements, what government structures, and what frameworks were in place, etc.
- Comparative questions focused on similarities and differences in policies, ideologies, services, practices, and priorities across the jurisdictions.
- Explanatory questions designed to illuminate the rationale and strategies that support service delivery, monitoring, and quality improvement.
To publication looks broadly at five systems elements (or pillars) including: Strong Policy Foundation; Comprehensive Services; Funding and Governance; Knowledgeable and Supported Teachers and Families; Informed, Individualized, and Continuous Pedagogy; and Data to Drive Improvement. Snapshots and full case studies of each country provide in-depth analysis of each country:
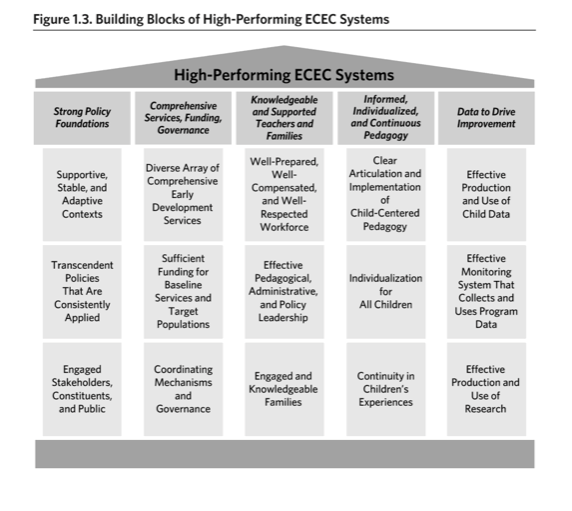
- Australia
- England
- Finland
- Hong Kong
- Singapore
- South Korea
Study 2: OECD, Providing Quality Early Childhood Education and Care: Results from the Starting Strong Survey, 2018 (Paris, France: Organisation for Economic Co-operation and Development, 2019)
The Starting Strong Teaching and Learning International Survey (TALIS Starting Strong) asked ECE staff and leaders in Chile, Denmark, Germany, Iceland, Israel, Japan, Korea, Norway, and Turkey about prevailing policies and practices within the sector. Findings on funding, governance, and quality include:
- Most (90 percent) centers receive government funds. Parents are also involved in funding programs, with more than 60 percent of centers receiving funds from parent fees in all countries except Chile and Iceland.
- Reducing group size, improving salaries, and receiving support for children with special needs are important spending priorities. Access to high-quality professional development is also a high priority, especially among those serving children under three years of age.
- The share of privately managed centers ranges from 10 percent in Israel to 70 percent in Germany. These centers benefit from greater autonomy in the management of budgets and human resources.
- Monitoring activities focus primarily on facilities and financing rather than on interactions. More than 20 percent of staff in Japan and Germany report never having been evaluated on process quality.
The report identified four key objectives for policy:
- Promote practices that support quality and foster learning, development, and well-being; provide pre-service and in-service training programs that can support staff in the use of effective practices, curriculum frameworks, and child-centered activities.
- Attract and retain a high-quality workforce; raise the status of the profession through additional salaries, reduced stress and instability, and access to professional development.
- Give a strong start to all children; address the needs of those facing barriers through staff preparation and additional supports as needed.
- Ensure smart spending; identify and agree on spending priorities and develop assessment and monitoring frameworks that support quality and empower center leaders.
See the Glossary for key word definitions.
Citations
- Roughly $3,200 per year for infants and toddlers and $1,800 per year for prekindergartners
Tools and Resources

Tools
Cost of Preschool Quality & Revenue Calculator
This is an Excel-based tool that help users determine costs and funding sources related to implementing high-quality preschool programs. The calculator can inform funding allocations by estimating costs of expansion and quality enhancements to identify trade-offs on quality and access associated with different pre-K policy options.
Family Budget Calculator
This calculator measures the income a family needs in order to attain a modest yet adequate standard of living.
Living Wage Calculator
This calculator estimates the cost of living in your community or region based on typical expenses. It can help employers determine a local wage rate that allows residents to meet minimum standards of living.
Provider Cost of Quality Calculator
This tool can help policymakers, providers, and other stakeholders estimate the annual cost and revenue for full-time child care provided through child care homes or centers at different quality levels.
Where Does Your Child Care Dollar Go?
This tool is informed by national averages and integrates local data to provide state-specific estimates for the cost of care. Users can modify seven elements of the child care program, including salaries, benefits, teacher-child ratios, and classroom materials. As users modify the seven elements, the tool calculates the monthly cost per child of providing care at the chosen level of quality.
Resources
Other Reports from the National Academies:
Animated Overview: Transforming the Financing of Early Care and Education
This 2018 video summarizes the main findings of the Transforming the Financing of Early Care and Education report.
A Vision for Financing Early Care and Education
This 2018 issue brief for policymakers summarizes the findings of the Transforming the Financing of Early Care and Education report related to needed policy changes.
Interactive Review of the Financing Report
This interactive website highlights the main findings of the Transforming the Financing of Early Care and Education report and includes videos and additional resources.
Parenting Matters: Supporting Parents of Children Ages 0-8
This 2016 report examines the integral role that parents play in the lives of young children.
Promoting the Educational Success of Children and Youth Learning English
This 2017 report assesses the current research, policy, and education landscape related to dual language learners.
Supporting the Transformation
This 2018 issue brief for the business community summarizes the findings of the Transforming the Financing of Early Care and Education report and describes how contributions from the business sector can be employed as part of a transformed financing system.
Transforming the Workforce for Children Birth Through Age 8
This 2015 report provides a comprehensive review of the science of childhood development and its implications on the education professionals that work with children B–8.
New America Resources:
Putting Degrees Within Reach: Strategies for Financing Early Educator Degrees
This 2019 brief examines strategies currently in use to assist early educators working to obtain a college degree and list important things to consider when designing programs to help educators earn a degree.
The Care Report
This 2016 report examines the cost, quality, and availability of child care across the United States.
Transforming the Early Education Workforce: A Multimedia Guidebook
This 2017 guidebook makes the Transforming the Early Education Workforce report more digestible and actionable, and includes key takeaways, videos, interactive tools, a glossary, and more.
Resources from Leading Organizations:
Child Care for All: A Blueprint for States (The Century Foundation)
This 2019 report details six priorities for state child care reform that will help ensure that child care policies are robust and impactful.
The video above explains why costs are so high while early childhood teachers are paid so little. It was produced by Child Care Aware of America, a national advocacy group, and the Center for the Study of Child Care Employment at the University of California-Berkeley.
Early Learning in the United States: 2019 (Center for American Progress)
These 2019 fact sheets provide state-specific information on child care costs, workforce wage levels, and gaps in child care funding and access.
Financing Early Educator Teacher Quality (Center for the Study of Child Care Employment (CSCCE))
This 2019 report examines a set of cost models with regard to assumptions about resources for teachers and their working environments. These assumptions drive the per child and total systems estimates produced for budgetary purposes and ultimately frame the daily realities of early educators.
Financing Early Educator Quality: A Values-Based Budget for Every State (Center for the Study of Child Care Employment (CSCCE))
This 2020 report offers cost estimates for an overhauled early care and education system in each individual state.
Funding Our Future: Generating State and Local Tax Revenue for Quality Early Care and Education (The Build Initiative, Center for American Progress, Children's Funding Project, Institute on Taxation and Economic Policy, University of Maryland)
This 2019 report provides early childhood leaders with funding strategies for increasing the revenue from state and local sources that can be directed to high-quality early care and education.
Minnesota Cost Modeling Report (Minnesota Department of Human Services)
This 2020 report offers a state-specific model for measuring the true cost of providing child care.
Most States Offer Preschool Programs and Rely on Multiple Funding Sources (Government Accountability Office (GAO))
This 2019 report examines (1) the number and characteristics of state ECE programs and the extent to which they share characteristics or overlap with federal or other state programs; and (2) how states fund their ECE programs, including any related benefits and challenges reported by states.
States’ Payment Rates Under the Child Care and Development Fund Program Could Limit Access to Child Care Providers (Department of Health and Human Services)
A 2019 report that explains how a majority of child care providers charge more for full-time infant care than states’ CCDF payment rates, limiting families’ access to care unless they can pay the difference between provider prices and state payment rates.
Strategies in Pursuit of Pre-K Teacher Compensation Parity (Center for the Study of Child Care Employment (CSCCE))
This 2017 report examines a small set of states and cities with the goal of understanding the policy rationale and process for moving toward compensation parity in different contexts.
The Early Childhood Workforce Index 2018 (Center for the Study of Child Care Employment (CSCCE))
This 2018 index offers state-by-state information on early childhood workforce conditions and policies.
This 2018 video produced by the National Women's Law Center describes the challenges of accessing child care for working families and the benefits of assistance to children and families.
Who’s Paying Now? The Explicit and Implicit Costs of the Current Early Care and Education System (Center for the Study of Child Care Employment (CSCCE) and the Economic Policy Institute)
This 2020 report breaks down the economic costs of the current ECE system and highlights the economic benefits that would be gained under a transformed system.
See the Glossary for key word definitions.
Graphics and Data Visualization
| Timeline for early education in the United States: | |
|---|---|
| Year(s) | Details |
| Mid-1800s | ECE programs are founded in the U.S. for children from toddlers to primary school age. Programs funded with tuition tended to focus on enrichment. Free programs intended for immigrant families and families with low incomes focused on “moral habits” and basic caretaking. |
| 1890s–1900s | Critics begin speaking out against child care outside of the home and supporting policies to allow mothers to stay home with children. |
| 1909 | The White House Conference on Children encourages aid to mothers to allow them to stay home with children, asserting that “home life is the highest and finest product of civilizations.” |
| 1919 | Mothers’ pension legislation is enacted in 39 states, plus Hawaii and Alaska. Financial assistance is provided with rules that exclude mothers who are widowed, divorced, married to men incapable of breadwinning, or are racial or ethnic minorities. |
| 1935 | The “Aid to Dependent Children” provision is passed through the Social Security Act, providing cash assistance to mothers except those of color and those with “illegitimate” children. |
| 1930s | President Roosevelt establishes nursery schools with public funding, to employ teachers and other school staff while protecting the well-being of pre-K children from “needy, under-privileged families.” Middle-class enrollment in private nursery schools grows during this time, and teachers in all settings are required to have ECE-specific training. |
| 1943–1946 | The Lantham Act of 1940 passes in response to World War II. Mothers working for the defense fund accessed child care through federal grants, marking the first time the federal government provided support for middle-income families. The program ends when the war does. |
| 1950s | Public attitudes are still deeply invested in the mother’s role in the home, though there are three times as many working mothers as there were before the war. Public funding is scarce, and most families rely on informal or private care. |
| 1964 | President Johnson declares his “War on Poverty” and establishes Head Start. Head Start’s multi-generational approach is intended to “strike at the basic cause of poverty.” |
| 1960s–1970s | States initiate funding kindergarten as part of the public-school system. |
| 1971 | President Nixon recommends, at the 1971 White House Conference on Children, that “the Federal government fund comprehensive child care programs, which will be family-centered, locally controlled, and universally available.” Congress agrees, and passes the Comprehensive Child Development Act to help support low-income families and working parents and centering on child development and early education. |
| 1972 | President Nixon surprises many by vetoing the bill, citing its potentially negative impact on family relationships. |
| 1974 | Title XX of the Social Services Block Grant subsidizes early care and education for low-income families and those receiving public assistance. |
| 1981 | Funds for Title XX are drastically reduced; money earmarked for child care is eliminated. |
| 1988 | The Family Support Act requires most welfare recipients to either work or attend school, and provides child care assistance to eligible families. The dependent care tax credit (established in 1954) has the income cap raised and removed, becomes a nonrefundable tax credit, and increases the amount taxpayers can claim for child care. |
| 1989 | The first National Child Care Staffing Survey finds that ECE teachers are underpaid and under supported, and they exit the profession at rates of over 40 percent. The study determines that workforce conditions and training are essential for high-quality programs. |
| 1989 | The Military Child Care Act (MCCA) establishes a system of high-quality child care centers and family child care programs, raises qualifications and compensation for teachers, and establishes a sliding scale for parent payment. |
| 1990 | Congress passes the Child Care and Development Block Grant Act (CCDBG), which authorizes the Child Care and Development Fund (CCDF). Funding is provided through vouchers to providers that parents choose. States are required to set quality standards and eligibility requirements. Funding levels are too low to cover all potentially eligible families. |
| 1990 | Congress passes the Head Start Expansion and Quality Improvement Act to reauthorize federal funding for Head Start and requires 10 percent of funds be channeled towards quality improvement, such as staff training. |
| 1996 | President Clinton passes the Personal Responsibility and Work Opportunity Act of 1996, establishing the Temporary Assistance for Needy Families (TANF) program with work requirements. The act increases federal ECE funds by $4 billion and redirects 4 percent of CCDF funding to quality improvement. |
| 1990s–2010s | State-funded pre-K programs expand significantly. By 2018, 44 states and the District of Columbia have[ ](http://nieer.org/wp-content/uploads/2019/08/YB2018_Full-ReportR3wAppendices.pdf)[state-funded pre-K programs](http://nieer.org/wp-content/uploads/2019/08/YB2018_Full-ReportR3wAppendices.pdf), serving one-third of four-year-olds and 5.7 percent of three-year-olds. |
| 2007 | The Head Start Reauthorization Act requires that by 2013, half of all Head Start teachers obtain at least a bachelor’s degree in early childhood education, but no guaranteed compensation increases. |
| 2011 | The four-year competitive grant program Race to the Top-Early Learning Challenge ([RTT-ELC](https://www2.ed.gov/programs/racetothetop-earlylearningchallenge/2013-early-learning-challenge-flyer.pdf)) awards over $1 billion to 20 states for improving program quality through use of Quality Rating Improvement Systems ([QRIS](https://www.newamerica.org/education-policy/edcentral/even-more-research-many-qs-remain-about-qris/)). |
| 2013 | Early Head Start-Child Care ([EHS-CC](https://www.ffyf.org/issues/ehs-ccp/)) Partnerships are established to foster coordination between Early Head Start grantees and local child care providers, with the goal of improving quality. In 2019, EHS-CC partnerships are funded at $805 million. |
| 2014 | The Child Care Development Block Grant program ([CCDBG](https://www.newamerica.org/education-policy/edcentral/ccdbgpasses/)) is reauthorized for the first time since 1996, and is funded at $400 million annually over six years. This reauthorization modifies the frequency of family eligibility audits to once per year and requires providers to pass annual fire, health, and safety inspections. |
| 2014 | Preschool Development Grants ([PDG](https://www.newamerica.org/education-policy/edcentral/preschool-dev-grants-win/)) distribute $250 million over four years to 18 states, increasing access to high-quality pre-K for[ ](http://blogs.edweek.org/edweek/early_years/2018/08/preschool_development_grants_boosted_access_to_high-quality_care_report_says.html)[49,000](http://blogs.edweek.org/edweek/early_years/2018/08/preschool_development_grants_boosted_access_to_high-quality_care_report_says.html) children in over 200 high-need communities. |
| 2018 | The Preschool Development Grants Birth through Five ([PDG B-5](https://www.newamerica.org/education-policy/edcentral/hhs-announces-details-about-new-pdg-b-5-program/)) program builds on the PDG program by extending opportunities for access to early learning programs. In December,[ ](https://www.acf.hhs.gov/occ/resource/pdg-b-5-initiative)[46 states](https://www.acf.hhs.gov/occ/resource/pdg-b-5-initiative) receive federal grants totaling $250 million towards this effort. |
| 2018 | CCDBG funding is more than[ ](https://www.newamerica.org/education-policy/edcentral/house-omnibus-bill-brings-good-news-early-childhood-advocates/)[doubled](https://www.newamerica.org/education-policy/edcentral/house-omnibus-bill-brings-good-news-early-childhood-advocates/), from $2.37 billion to $5.22 billion, to increase access to child care for more than[ ](https://www.clasp.org/sites/default/files/publications/2018/02/State%20Impact%20of%20Doubling%20CCDBG%20.pdf)[200,000](https://www.clasp.org/sites/default/files/publications/2018/02/State%20Impact%20of%20Doubling%20CCDBG%20.pdf) children. Funding for the Child Care Access Means Parents in School (CCAMPIS) program, which supports parents of young children attending higher education programs, is more than[ ](https://firstfocus.org/wp-content/uploads/2019/09/FirstFocus-ChildrensBudget2019-pages.pdf)[tripled](https://firstfocus.org/wp-content/uploads/2019/09/FirstFocus-ChildrensBudget2019-pages.pdf), from $15 million to $50 million annually. |
Source: Figure 7-3, https://www.nap.edu/read/24984/chapter/9#200
| Phase 1 | Phase 4 | |||
|---|---|---|---|---|
| Static | Dynamic | Static | Dynamic | |
| Total Costs in Billions/Year (% of GDP) | 65.7(0.35%) | 74.5(0.4%) | 109.5(0.59%) | 139.9(0.75%) |
| Family Share (%) | 49% | 55% | 36% | 42% |
| Public Share (%) | 51% | 45% | 64% | 58% |
Glossary
| Glossary | ||
|---|---|---|
| Chapter 1 | ||
| Term | Definition | Reference |
| Early care and education (ECE) | Nonparental care for children from birth to kindergarten entry that occurs outside a child’s home. | [Transforming the Financing](https://www.nap.edu/catalog/24984/transforming-the-financing-of-early-care-and-education), p. 23 |
| ECE system | ECE programs and services as well as the policies, regulations, and financing that shape their operation and the professional training needed for each setting. | [Transforming the Financing](https://www.nap.edu/catalog/24984/transforming-the-financing-of-early-care-and-education), p. 26 |
| Funding | Money provided by organizations or by a government sector for a specific purpose. | |
| Financing system | The policies, regulations, funding streams, and financing mechanisms in the ECE system. | [Transforming the Financing](https://www.nap.edu/catalog/24984/transforming-the-financing-of-early-care-and-education), p. 26 |
| Compensation | The total amount of monetary and non-monetary pay provided to an employee in return for work performed; can include salary and benefits such as health insurance and pension. | |
| Competency | The specialized knowledge, skills, and abilities needed by educators and administrators who work with children from birth to eight years old. | Transforming the Early Education Workforce, “[Glossary of Key Terms”](https://www.newamerica.org/in-depth/transforming-early-education-workforce/glossary-key-terms/) |
| State pre-K | Programs that are funded, controlled, and directed by the state to serve three- and four-year-olds; must offer group learning experiences for a minimum of two days per week focused on early childhood education. | |
| Head Start | Provides high-quality early childhood education and health, nutrition, and family engagement and support services to three- to four-year-old children living in poverty. | |
| Early Head Start | Provides high-quality early childhood education and health, nutrition, and family engagement and support services to infants and toddlers living in poverty. | |
| Chapter 2 | ||
| Term | Definition | Reference |
| Tax credits | An amount of money that taxpayers can subtract from taxes owed. There are two types: 1. Refundable tax credits, where taxpayers get a refund even if the refund is more than they owe. 2. Non-refundable tax credits, where taxpayers get a refund only up to the amount that they owe. |
[Investopedia](https://www.investopedia.com/terms/t/taxcredit.asp) |
| Employer-based tax credits | Tax credits that allow employers to deduct from their income tax a portion of the cost of direct ECE subsidies provided to employees or the cost of ECE resource and referral services, up to a maximum amount. | [Transforming the Financing](https://www.nap.edu/catalog/24984/transforming-the-financing-of-early-care-and-education), p. 74 & 78 |
| Pay for success | Contracts that tie payment for service delivery to measurable outcomes. Payors, typically the government, pay back investors if the services delivered achieve a pre-agreed-upon result. | [Nonprofit Finance Fund](https://www.payforsuccess.org/learn/basics/) |
| CCDF (Child Care and Development Fund) | Funds states, territories, and tribal entities to develop and implement a subsidy program for low-income families with children under age 13 (the majority of children served are under 5; subsidies can be used for care of children ages 5–13 during non-school hours) and to improve the quality of child care available. State governments have discretion to establish policies around its application, such as family eligibility and copayments. | [Benefits.gov](http://benefits.gov) |
| TANF (Temporary Assistance for Needy Families) | Assists families with children when parents or other responsible relatives cannot provide for basic needs. The federal government provides grants to states to run the TANF program. Each state and territory decides eligibility criteria and benefits. | [HHS](https://www.hhs.gov/answers/programs-for-families-and-children/what-is-tanf/index.html) |
| CDCTC (Child and Dependent Care Tax Credit) | Helps working families reduce the cost of ECE by allowing them to claim a federal tax credit. | [TCWF](http://www.taxcreditsforworkersandfamilies.org/federal-tax-credits/child-dependent-care/) |
| DCAP (Dependent Care Assistance Program) | Allows parents to set aside pretax funds in a flexible spending account to pay for child or dependent care, for children up to age 13 and for qualifying dependent adults. | [Transforming the Financing](https://www.nap.edu/catalog/24984/transforming-the-financing-of-early-care-and-education), p. 70 |
| Shared services | A partnership model comprised of centers and family child care homes working together to share costs and deliver services. | Administration for Children and Families |
| Chapter 3 | ||
| Term | Definition | Reference |
| CDA (Child Development Associate) credential | A national credential awarded by the Council for Early Childhood Professional Recognition; it requires at least 120 hours of formal training within the last five years. | [Council for Professional Recognition](https://www.cdacouncil.org/) |
| Fiscal substitution | The amount of compensation increase a provider pays in response to inflation and labor market demands. | [Transforming the Financing](https://www.nap.edu/catalog/24984/transforming-the-financing-of-early-care-and-education), p. 94 |
| Compensation parity | Defined by Whitebook and McLean as “parity for salary and benefits for equivalent levels of education and experience, adjusted to reflect differences in hours of work in private settings, and including payment for non–child contact hours, such as paid time for planning.” | [Transforming the Financing](https://www.nap.edu/catalog/24984/transforming-the-financing-of-early-care-and-education), p. 162 footnote |
| Needs-based scholarships | Scholarship awards based on financial need. | |
| T.E.A.C.H. (Federal Teacher Education Assistance for College and Higher Education Grants) | Provides educational scholarship opportunities for current ECE educators, with support from public and private funding; grants also provide supplemental funding to students who plan to teach in a high-needs field in low-income schools. | [Transforming the Financing](https://www.nap.edu/catalog/24984/transforming-the-financing-of-early-care-and-education), p. 100 & 103 |
| Provider-oriented financing mechanisms | Distribute funds to providers to cover costs of delivering services; Head Start and public pre-kindergarten are two major programs funded this way. | [Transforming the Financing](https://www.nap.edu/catalog/24984/transforming-the-financing-of-early-care-and-education), p. 84 |
| Family-oriented financing mechanisms | Provide financial support for ECE directly to or on behalf of individual families; enable families to pay in part or in whole the cost of ECE services. | [Transforming the Financing](https://www.nap.edu/catalog/24984/transforming-the-financing-of-early-care-and-education), p. 84 |
| Workforce-oriented financing mechanisms | Distribute funds directly to the ECE workforce; examples include scholarships, pay incentives, tax preferences, and reduced-rate loans. | [Transforming the Financing](https://www.nap.edu/catalog/24984/transforming-the-financing-of-early-care-and-education), p. 85 |
| Wage supplements | Additional compensation, scholarships, or other tuition offsets to support ECE educators who pursue higher education, achieve a particular degree, or meet a retention milestone. | [Transforming the Financing](https://www.nap.edu/catalog/24984/transforming-the-financing-of-early-care-and-education), p. 171 |
| System-oriented financing mechanisms | Distribute funds to support system-level initiatives, such as statewide quality rating assurance systems, professional development systems, or sustaining programs in higher education. | [Transforming the Financing](https://www.nap.edu/catalog/24984/transforming-the-financing-of-early-care-and-education), p. 85 |
| Pell Grants | Federal need-based scholarships for college students. | [Transforming the Financing](https://www.nap.edu/catalog/24984/transforming-the-financing-of-early-care-and-education), p. 103 |
| Chapter 4 | ||
| Term | Definition | Reference |
| CCAP (Child Care Assistance Program) | Helps working families pay for ECE programs: family chooses the service provider and the state ensures that the provider is paid for the subsidized child. CCAP is primarily funded by CCDF (Child Care and Development Fund) money in states. | [Transforming the Financing](https://www.nap.edu/catalog/24984/transforming-the-financing-of-early-care-and-education), p. 68 |
| Chapter 5 | ||
| Term | Definition | Reference |
| QRIS (Quality Rating and Improvement System) | QRIS for early childhood programs have been developed and implemented at the state and local level. While considerable variability exists in their design and implementation, they all aim to improve child outcomes and make the extent of a program’s quality transparent to parents and the general public by assessing multiple indicators and combining them into a single summary rating of quality. | Transforming the Early Education Workforce, “[Glossary of Key Terms”](https://www.newamerica.org/in-depth/transforming-early-education-workforce/glossary-key-terms/) |
| Tiered reimbursement | Financial incentives tied to QRIS that provide higher subsidy reimbursement rates to programs with higher quality ratings. | [National Center on Early Childhood Quality Assurance](https://qrisguide.acf.hhs.gov/sites/default/files/QRIS_Financial_Incentives.pdf) |
| Chapter 6 | ||
| Term | Definition | Reference |
| On-site costs | Costs of maintaining high-quality staff; providing on-site staff supports and professional development; and non-personnel items such as curriculum, facilities, and equipment. | [Transforming the Financing](https://www.nap.edu/catalog/24984/transforming-the-financing-of-early-care-and-education), p. 158 |
| System-level costs | Two categories: (1) workforce development supports, such as ongoing professional learning and higher education, and (2) costs related to QRIS, such as systems improvement and accountability, data systems, licensing, and accreditation. | [Transforming the Financing](https://www.nap.edu/catalog/24984/transforming-the-financing-of-early-care-and-education), p. 158 |
More About the Authors

Paula Lin

Aaron Loewenberg
Senior Policy Analyst, Early & Elementary Education

Laura Bornfreund
Senior Fellow, Early & Elementary Education

Elise Franchino
Program Manager, National Commission on Learning Ecosystems

Lisa Guernsey
Senior Director, Birth to 12th Grade Policy; Co-Founder and Director, Learning Sciences Exchange
Issues
Programs/Projects/Initiatives
Related