

Spandana Singh
Policy Analyst, Open Technology Institute
Disclaimer: This report is a living document and was first posted on June 17, 2020. The last iteration of this report was published December 9, 2021. This report reflects data published by five internet platforms for six services via transparency reports. These charts are based on the most recent data available as of November 9, 2021.
Today, transparency reporting on issues such as government requests for user data is considered an industry-wide best practice for technology and telecommunications companies. Over the past few years, internet platforms such as Facebook, Instagram, Reddit, TikTok, Twitter, and YouTube have also begun publishing transparency reports that outline how they are enforcing their own content policies and rules. This reporting has been expanded to include a number of metrics and categories of content that are unique to these types of platforms. However, although companies have made some positive strides toward providing transparency and accountability around their content moderation practices, there is still significant room for improvement. Through our Transparency Reporting Toolkit on Content Takedowns and the Santa Clara Principles on Transparency and Accountability in Content Moderation, which we drafted as part of a coalition dedicated to freedom of expression online, we have put forth a number of recommendations on how internet platforms can improve their transparency reporting on content moderation.
The charts below outline what metrics and categories of content Facebook, Instagram, Reddit, TikTok, Twitter, and YouTube are reporting on in their transparency reports related to content rules enforcement. These charts depict the breadth of categories and metrics that companies are reporting on, how these reports have evolved over time, and also enable comparison between the companies’ reports. In addition, these charts can be used to identify fundamental gaps in reporting.
Editorial disclosure: This toolkit discusses policies by Facebook (including Instagram), Google (including YouTube), and Twitter, all of which are funders of work at New America but did not contribute funds directly to the research or writing of this piece. New America is guided by the principles of full transparency, independence, and accessibility in all its activities and partnerships. New America does not engage in research or educational activities directed or influenced in any way by financial supporters. View our full list of donors at www.newamerica.org/our-funding.
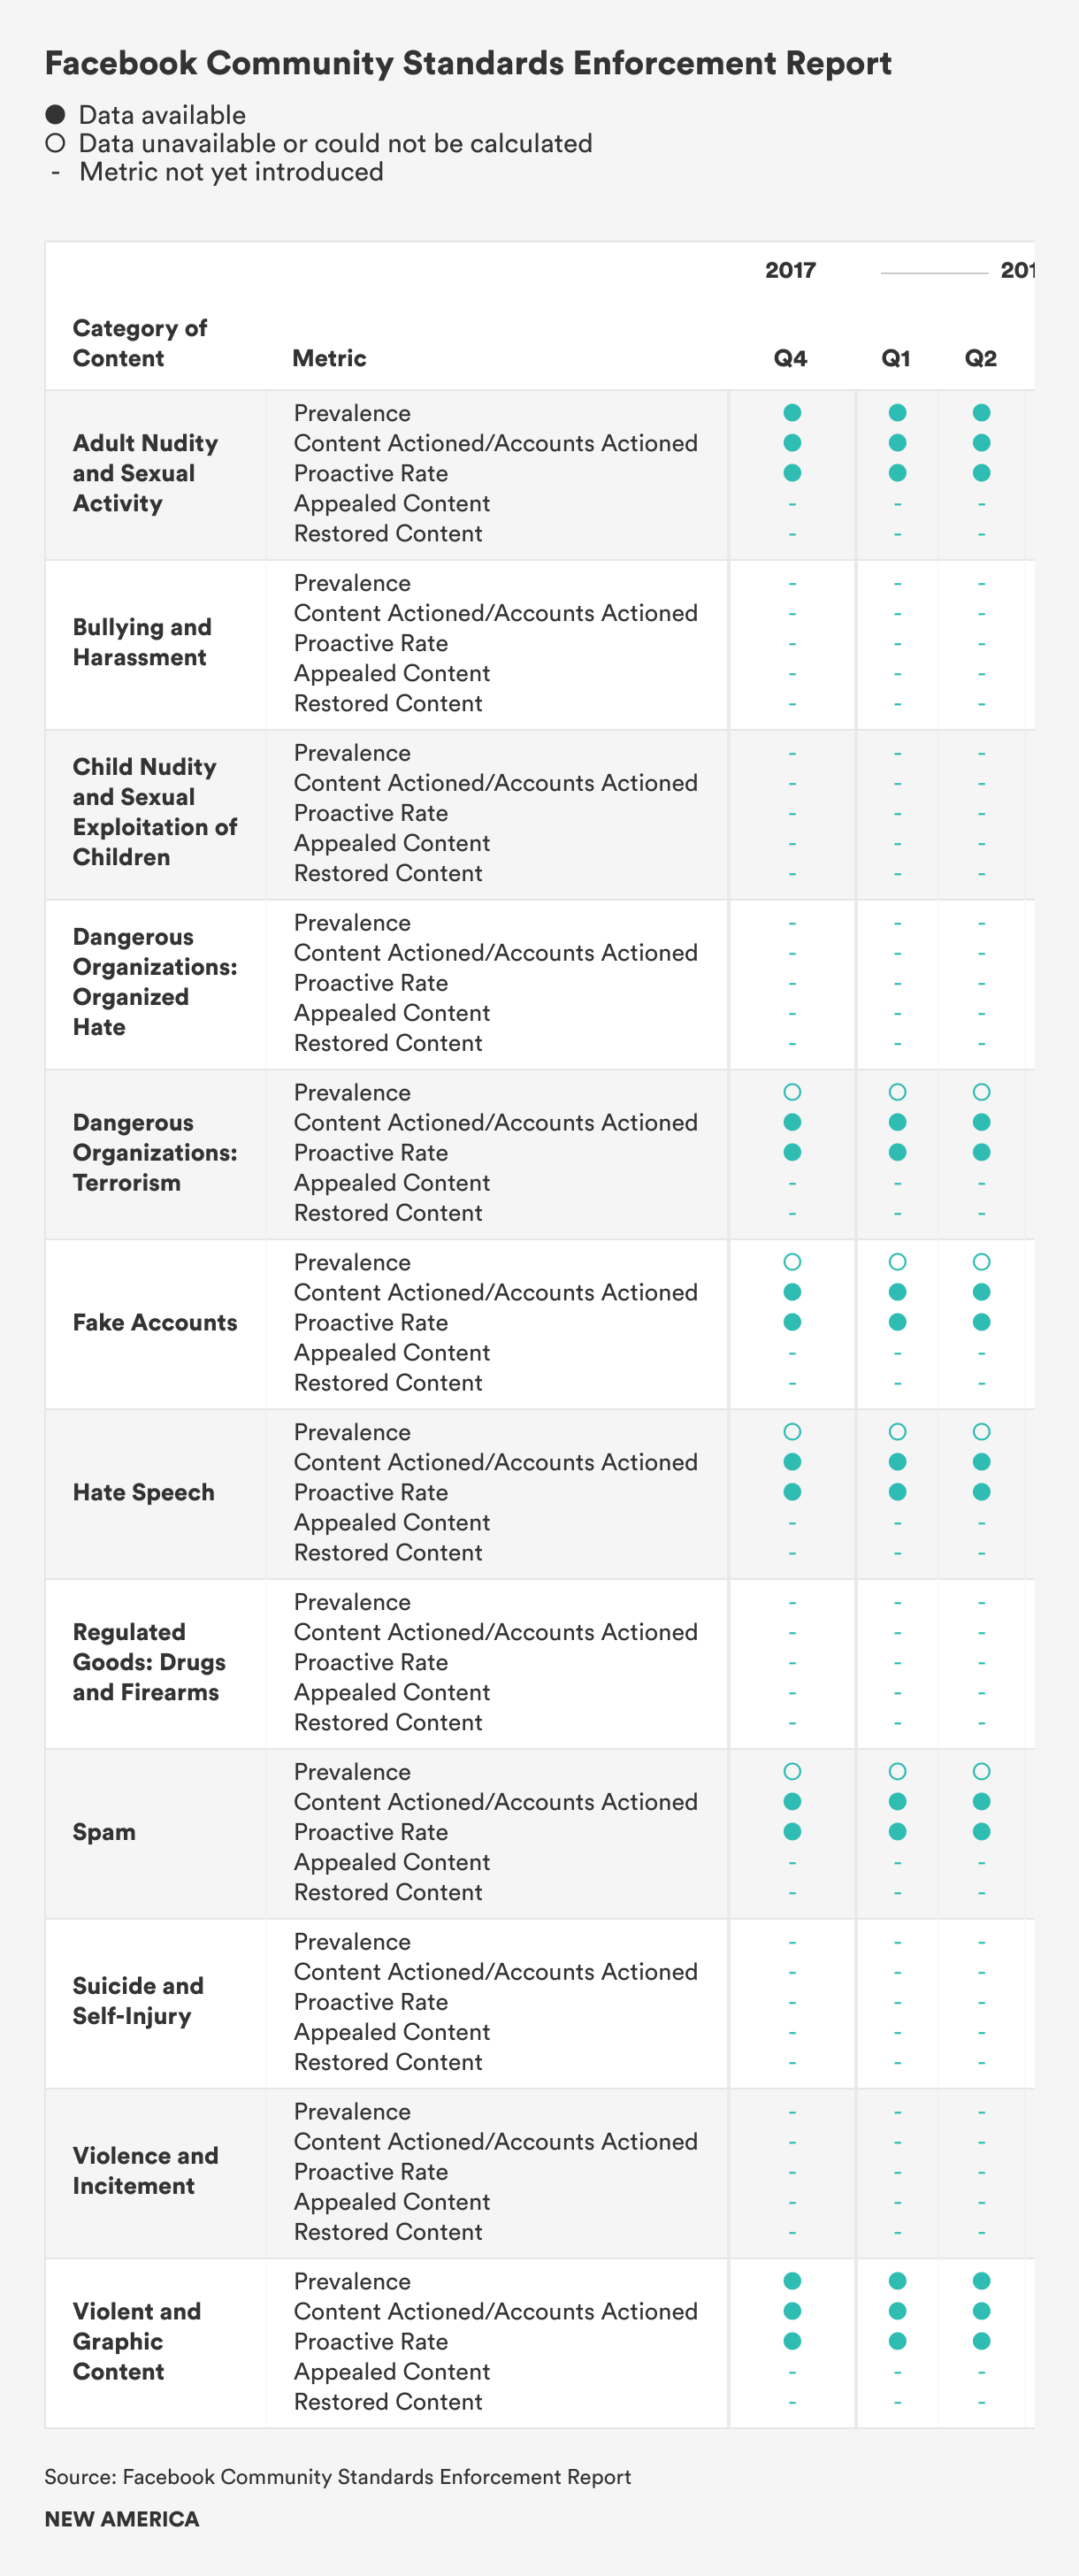
The chart below outlines the categories of content and metrics that Facebook reports on in its Community Standards Enforcement Report (CSER). These data points are broken down by time period in order to demonstrate when Facebook began introducing certain metrics and categories of content in its report.
Facebook released the first edition of its CSER in May 2018, shortly after the company published a detailed version of its Community Standards online. Facebook was the second company to publish a comprehensive transparency report (YouTube was the first) outlining how the platform enforces its content policies.
Facebook’s report (and Instagram’s report of the same name) features five metrics—Prevalence, Content/Accounts Actioned, Proactive Rate, Appealed Content, and Restored Content—which are applied across a range of categories of content. Whereas the three metrics of Content/Accounts Actioned, Appealed Content, and Restored Content are rather straightforward and common in such transparency reports, the Prevalence metric is unique to Facebook’s reports, and the Proactive rate metric is only visible in a few company reports.
The Prevalence and Proactive Rate metrics are broken down below:
Prevalence: This metric measures the percentage of all content views on Facebook (or Instagram) that were of violating content in a particular content category (e.g. hate speech). The metric is calculated by selecting a sample of content seen on Facebook, labeling how much of it is violating content, and dividing the estimated number of views that showed violating content by the estimated number of total content views on Facebook. The metric is based on the notion that content that violates the platform’s Community Standards can only have an impact on users if viewed. This metric therefore enables the platform, and the public, to understand how many views of violating content the company was not able to prevent, either because it could not identify the content as violating before it was viewed, or because the content slipped through the cracks altogether. This metric is meant to represent the effectiveness of the company’s efforts to minimize the impact of violating content. In its CSER, Facebook does not always provide archived, historical data on past calculations of the prevalence rate. Rather, for categories of content in which estimating prevalence is challenging (due to, for example, infrequent views of violating content in that category), the company only provides prevalence estimates for the most recent reporting period. For ease of tracking, if Facebook has provided prevalence data for a particular reporting period, we will mark it as such for that reporting period, even if the data is not archived and is replaced by updated data in future reports. (Note: We apply this to both reporting for Facebook and Instagram.) Going forward, Facebook should archive this data so that users can understand how the company’s prevalence estimates for these categories of content vary over time.
Proactive Rate: Out of all content or accounts that the company took action on, this metric measures the percentage that were identified and flagged by the company’s tools before users flagged them. This metric is intended to demonstrate how effective the company is at detecting content that violates its policies. According to Facebook, the rate at which the company is able to proactively detect violations in certain categories of content is high, typically due to the use of machine learning technology. However, given that such automated tools are not equally reliable across categories of content, this rate varies. Automated tools can be more effective at removing content in clearly defined categories that require little contextual analysis, such as child sexual abuse material, which is illegal in every country. However, the use of automated tools for proactive removal in categories of content that require additional context analysis—such as hate speech—is concerning, as research indicates that these tools are less accurate in subjective contexts. Because of this, human reviewers must be involved in moderation decisions.
In its CSER, Facebook aims to provide data under these five metrics for different categories of content. For example, when navigating the transparency report, you can choose to see data under these metrics broken out separately for content categories such as Bullying and Harassment and Spam. If Facebook is unable to apply one of its metrics to a certain category of content (perhaps because there is not enough data to sample from), or if there are caveats in how Facebook calculates a metric for a certain category of content, the report will explain why.
In Q1 2020, Facebook retroactively segmented the data it had reported under this metric to outline the percentage of content actioned that Facebook found and flagged before users reported it, and the percentage of content actioned that users reported first. Facebook also did this for proactive rate reporting in the Instagram CSER.
In Q1 2020, Facebook also retroactively segmented the data it reported under the Restored Content metric to outline the number of pieces of content that were restored without an appeal (i.e. the company proactively identified moderation errors and restored the content) and the number of pieces of content that were restored after an appeal. Facebook also implemented this change in the Instagram CSER.
In the same quarter, Facebook also expanded its reporting of the Regulated Goods: Drugs and Firearms category by segmenting the data in this category by drugs or firearms, rather than combining the data points. Further, Facebook also renamed the Terrorist Propaganda category to Dangerous Organizations: Terrorism and Hate, and began segmenting data in this category based on whether it was associated with terror group or organized hate group-related content. Facebook also did this for the Instagram CSER. Because this change did not provide retroactive data for dangerous organizations engaged in hateful activity, we created a separate row for this category of content.
In Q2 2021, Facebook renamed the Child Nudity and Sexual Exploitation of Children category in both the Facebook and Instagram reports to Child Endangerment: Nudity and Physical Abuse and Sexual Exploitation. Under this new category, Facebook segments data in both the Facebook and Instagram reports based on whether it was associated with child nudity and physical abuse content or child sexual exploitation content. Users can still view the data related to child nudity and sexual exploitation of children that Facebook reported in the past. Because retroactive data is still available, we did not create a separate line in the chart for this renamed category, and tracked reporting of this data under the original heading Child Nudity and Sexual Exploitation of Children.
Facebook does not currently report on all of the categories under which the platform removes content. Rather, it reports on the categories of content where the company has been able to make and distill measurements under the five metrics discussed above.
Due to a temporary reduction in Facebook’s manual review capacity as a result of COVID-19 (which they have noted will likely persist until widespread vaccination), during Q2 2020 Facebook suspended its content-moderation appeals process. Instead of typical appeals, users were only given a “Disagree with Decision” option if they wished to express disagreement with a removal decision, rather than request an additional review. In certain instances, Facebook would review a user’s expression of disagreement and restore content when appropriate. As a result, a number of their usual reported metrics for prevalence data were unavailable. Facebook’s decision to suspend content removal appeals is concerning, as this affected users’ ability to pursue due process in the case of wrongful removal. During this period, Facebook has also increased its reliance on automated tools for content detection and moderation, as detailed in their CSER for Q4 2020, even though they themselves have admitted that their AI-powered automation tools need to be improved to better account for context across languages, cultures, and geographies. As we have previously noted, these tools are often limited in their ability to detect and review content that requires subjective or contextual understanding, and because of this, Facebook’s decision to cut off remedy and redress mechanisms at this time is especially troubling. Further, Facebook and Instagram were the only major platforms to suspend their normal appeals process near the beginning of the COVID-19 pandemic.
In addition, due to their reduced capacity to conduct manual review, prevalence metrics for Adult Nudity and Sexual Activity, Terrorist Propaganda, Violent and Graphic Content, and Organized Hate are unavailable for Q2 2020. The Q3 2020 report resumed calculating prevalence for Adult Nudity and Sexual Activity, Terrorist Propaganda, and Violent and Graphic Content from September 2020 onwards.
In Facebook’s Q3 2021 report, the company began publishing prevalence data for the Bullying and Harassment category for the first time. The company also introduced a new content category, Violence and Incitement, and reported data from Q3 2021 for all five metrics for this category.
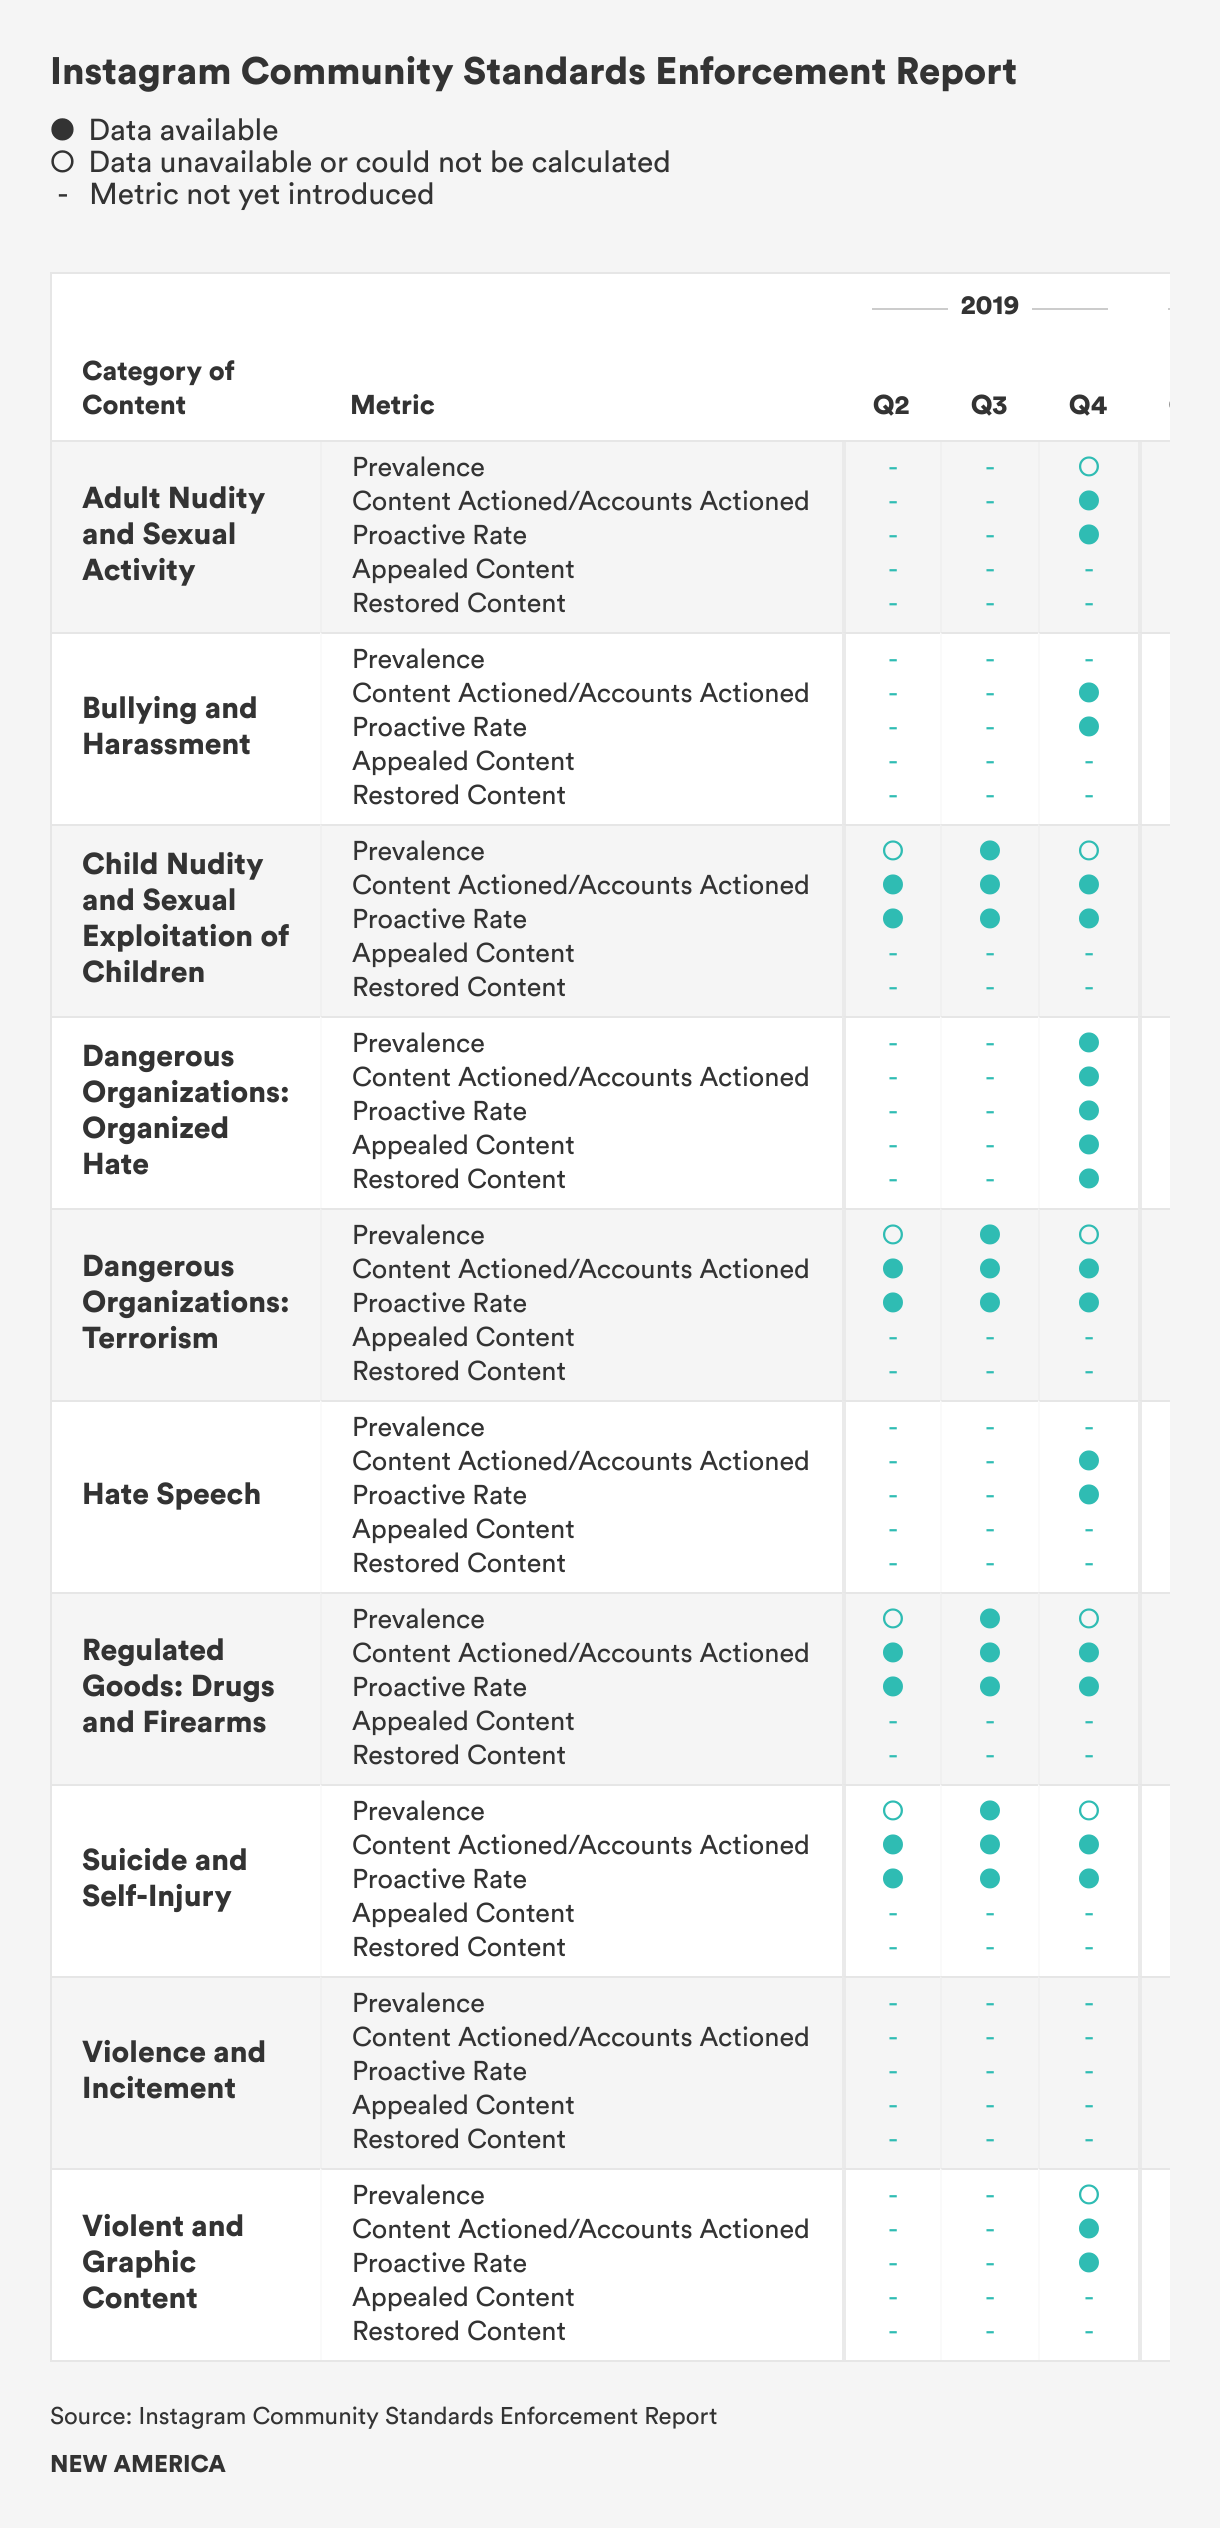
The chart below outlines the categories of content and metrics that Instagram reports on in its CSER. These data points are broken down by time period in order to demonstrate when certain metrics and categories of content were introduced.
In November 2019, Facebook expanded its CSER to include data from Instagram. Currently, Instagram’s report covers the same categories of content as Facebook’s report, except for the Spam and Fake Accounts categories. In addition, while Facebook uses the same metrics in its Instagram report, until Q1 2020, the Instagram report did not include data under the Appealed Content and Restored Content metrics.
Like the CSER on the Facebook platform itself, the CSER on Instagram provides data under the previously mentioned metrics across different categories of content. In instances where a metric cannot be calculated or applied to a certain category of content, or where there are caveats in how the metric is calculated or applied, the report explains why.
As with Facebook, during Q2 2020 Instagram suspended its content-moderation appeals process because of its reduced manual review capacity. Instead, users were only able to express disagreement with a removal decision via the “Disagree with Decision” option. This only sometimes allowed Instagram to review the expression of disagreement and restore content when appropriate. As a result, a number of the company’s usual reported metrics for prevalence were unavailable. Instagram’s decision to suspend content removal appeals is concerning, as this affected users’ ability to pursue due process in the case of wrongful removal. During this period, Instagram also increased its reliance on automated tools for content detection and moderation. Again, because these tools are often limited in their ability to detect and review content that requires subjective or contextual understanding, Instagram’s decision to cut off remedy and redress mechanisms at this time is particularly problematic. Facebook and Instagram were the only major platforms to suspend their normal appeals process during the beginning of the COVID-19 pandemic.
In Instagram’s Q3 2021 report, the company began publishing prevalence data for the Bullying and Harassment and Hate Speech categories for the first time. The company also introduced a new content category, Violence and Incitement, and reported data from Q3 2021 for all five metrics for this category.
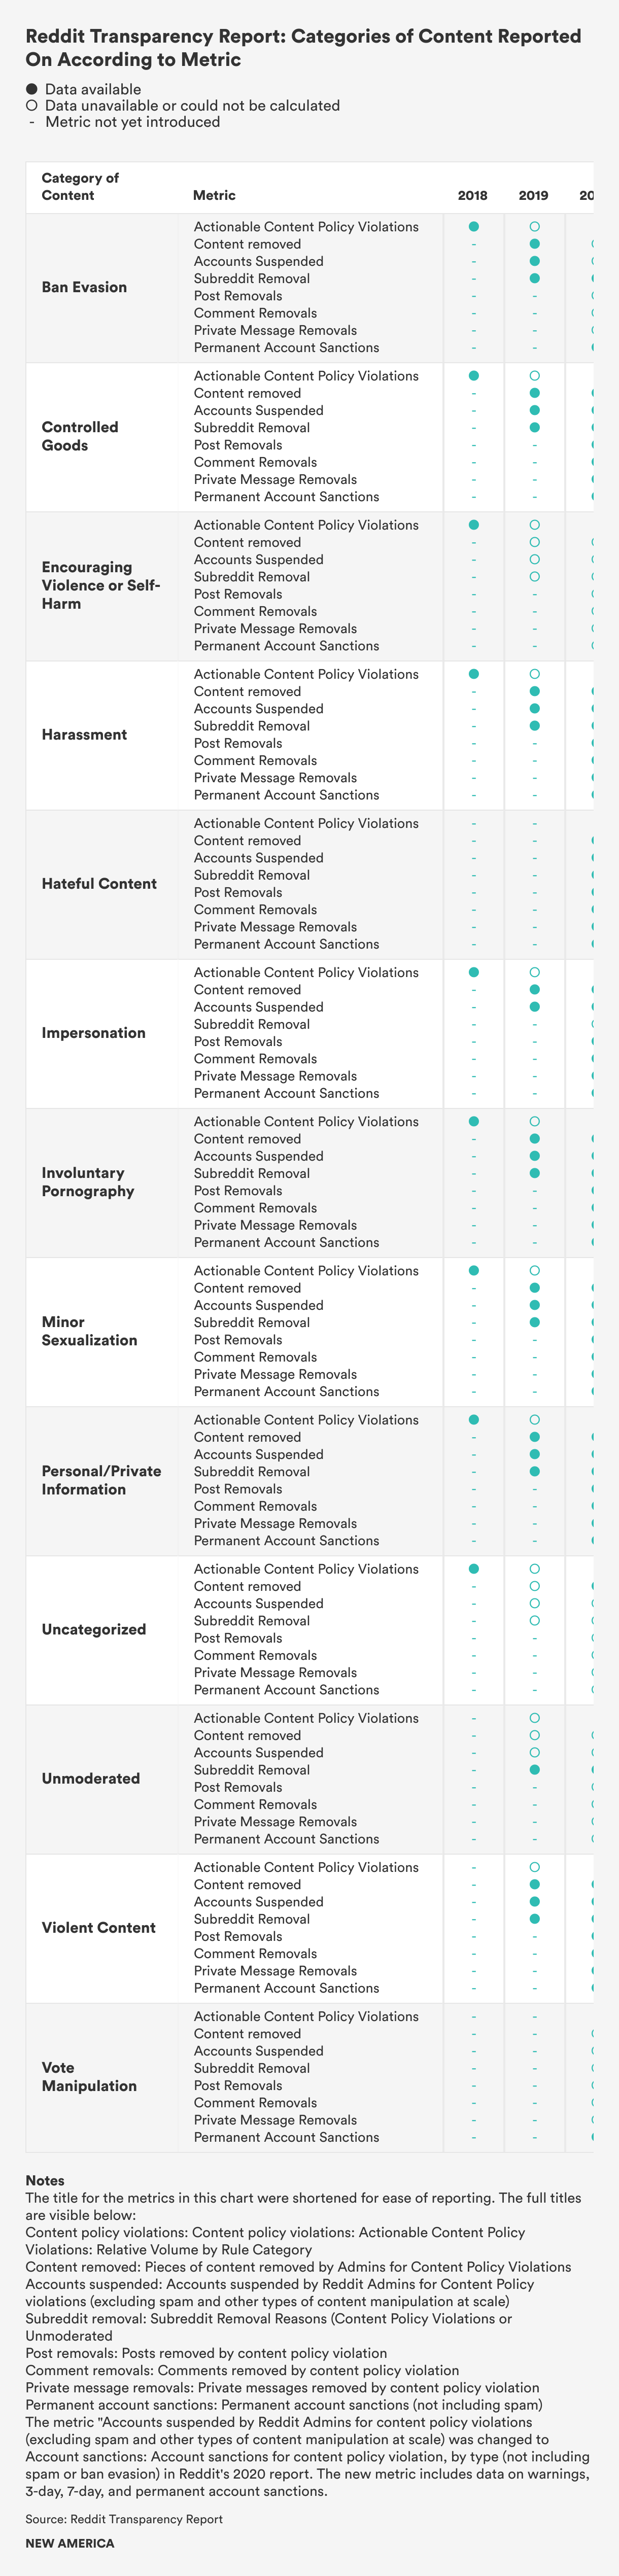
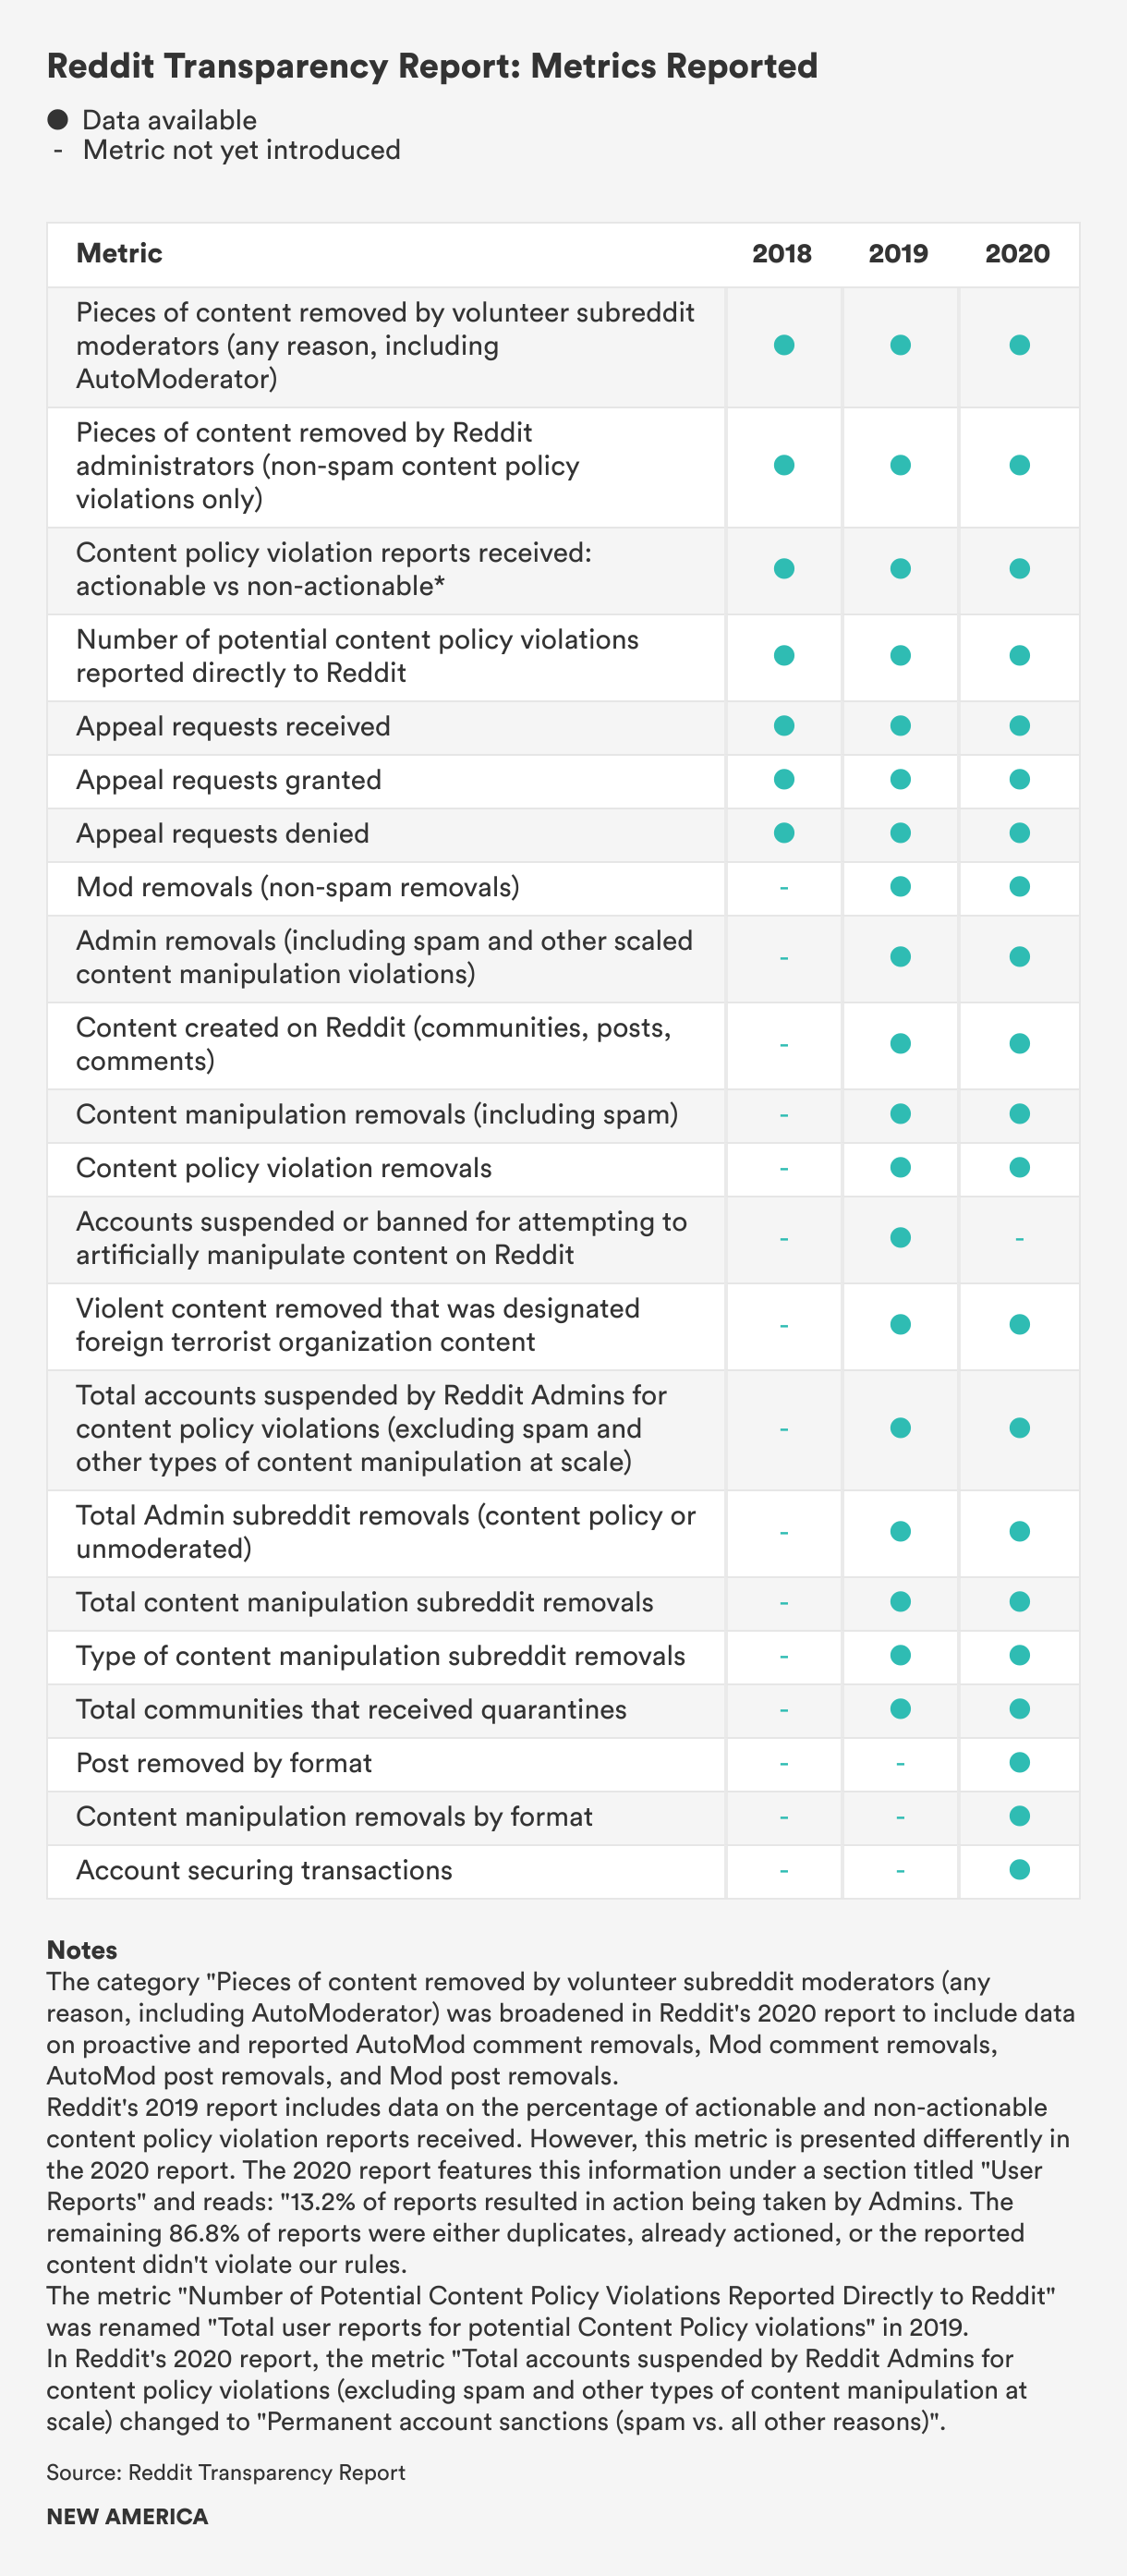
The chart below outlines the metrics that Reddit reports on in its annual transparency report. These data points are broken down by time period in order to demonstrate when Reddit began introducing certain metrics and which categories of content were most relevant to certain metrics over time.
Reddit first began publishing transparency reports in 2014. However, the company began publishing data on how it enforces its own Terms of Service, or Community Guidelines, in 2018.
Reddit’s 2018 report included some high-level metrics on its content policy enforcement, including the number of pieces of content removed by volunteer-user moderators (known as mods) and Reddit moderators (known as admins), the number of actionable content policy violations broken down by content policy, and the number of appeals the company received and subsequently approved or denied. Reddit’s 2019 report is more expansive. It includes many of the same metrics, but provides additional granularity around content manipulation-related content removals and account suspensions, and an outline of Admin removals, account suspensions, and subreddit removals broken down by the content policy violated. Reddit’s 2020 report provides further granularity around moderator removals, including how many removals were made using the AutoModerator tool (a built-in customizable bot that mods can use to moderate content) and in response to reports. The 2020 report also breaks down content policy violation removals by subreddit, posts, comments, and private messages, and outlines the type and volume of account sanctions the company has implemented in response to content policy violations.
Notably, Reddit has recognized the Santa Clara Principles in its reports since 2018. In its 2018 report, Reddit states that it supports the “goals and spirit” of the Principles as a “starting point for further conversation.”
Unlike Facebook, Instagram, and Twitter, Reddit’s reports are not structured so that they primarily outline the volume of removals, appeals, and enforcement actions under specific categories of content. Rather, in general, Reddit’s report outlines a set of unique metrics that demonstrate the different dimensions in which moderation on the platform occurs (e.g. through mods, admins, subreddit-based removals, community quarantines, etc.). It is important to note that Reddit often renames or combines metrics from past transparency reports in its newer versions. Where relevant, we have noted these changes in the notes section, and attempted to present the data in as consistent a format as possible.
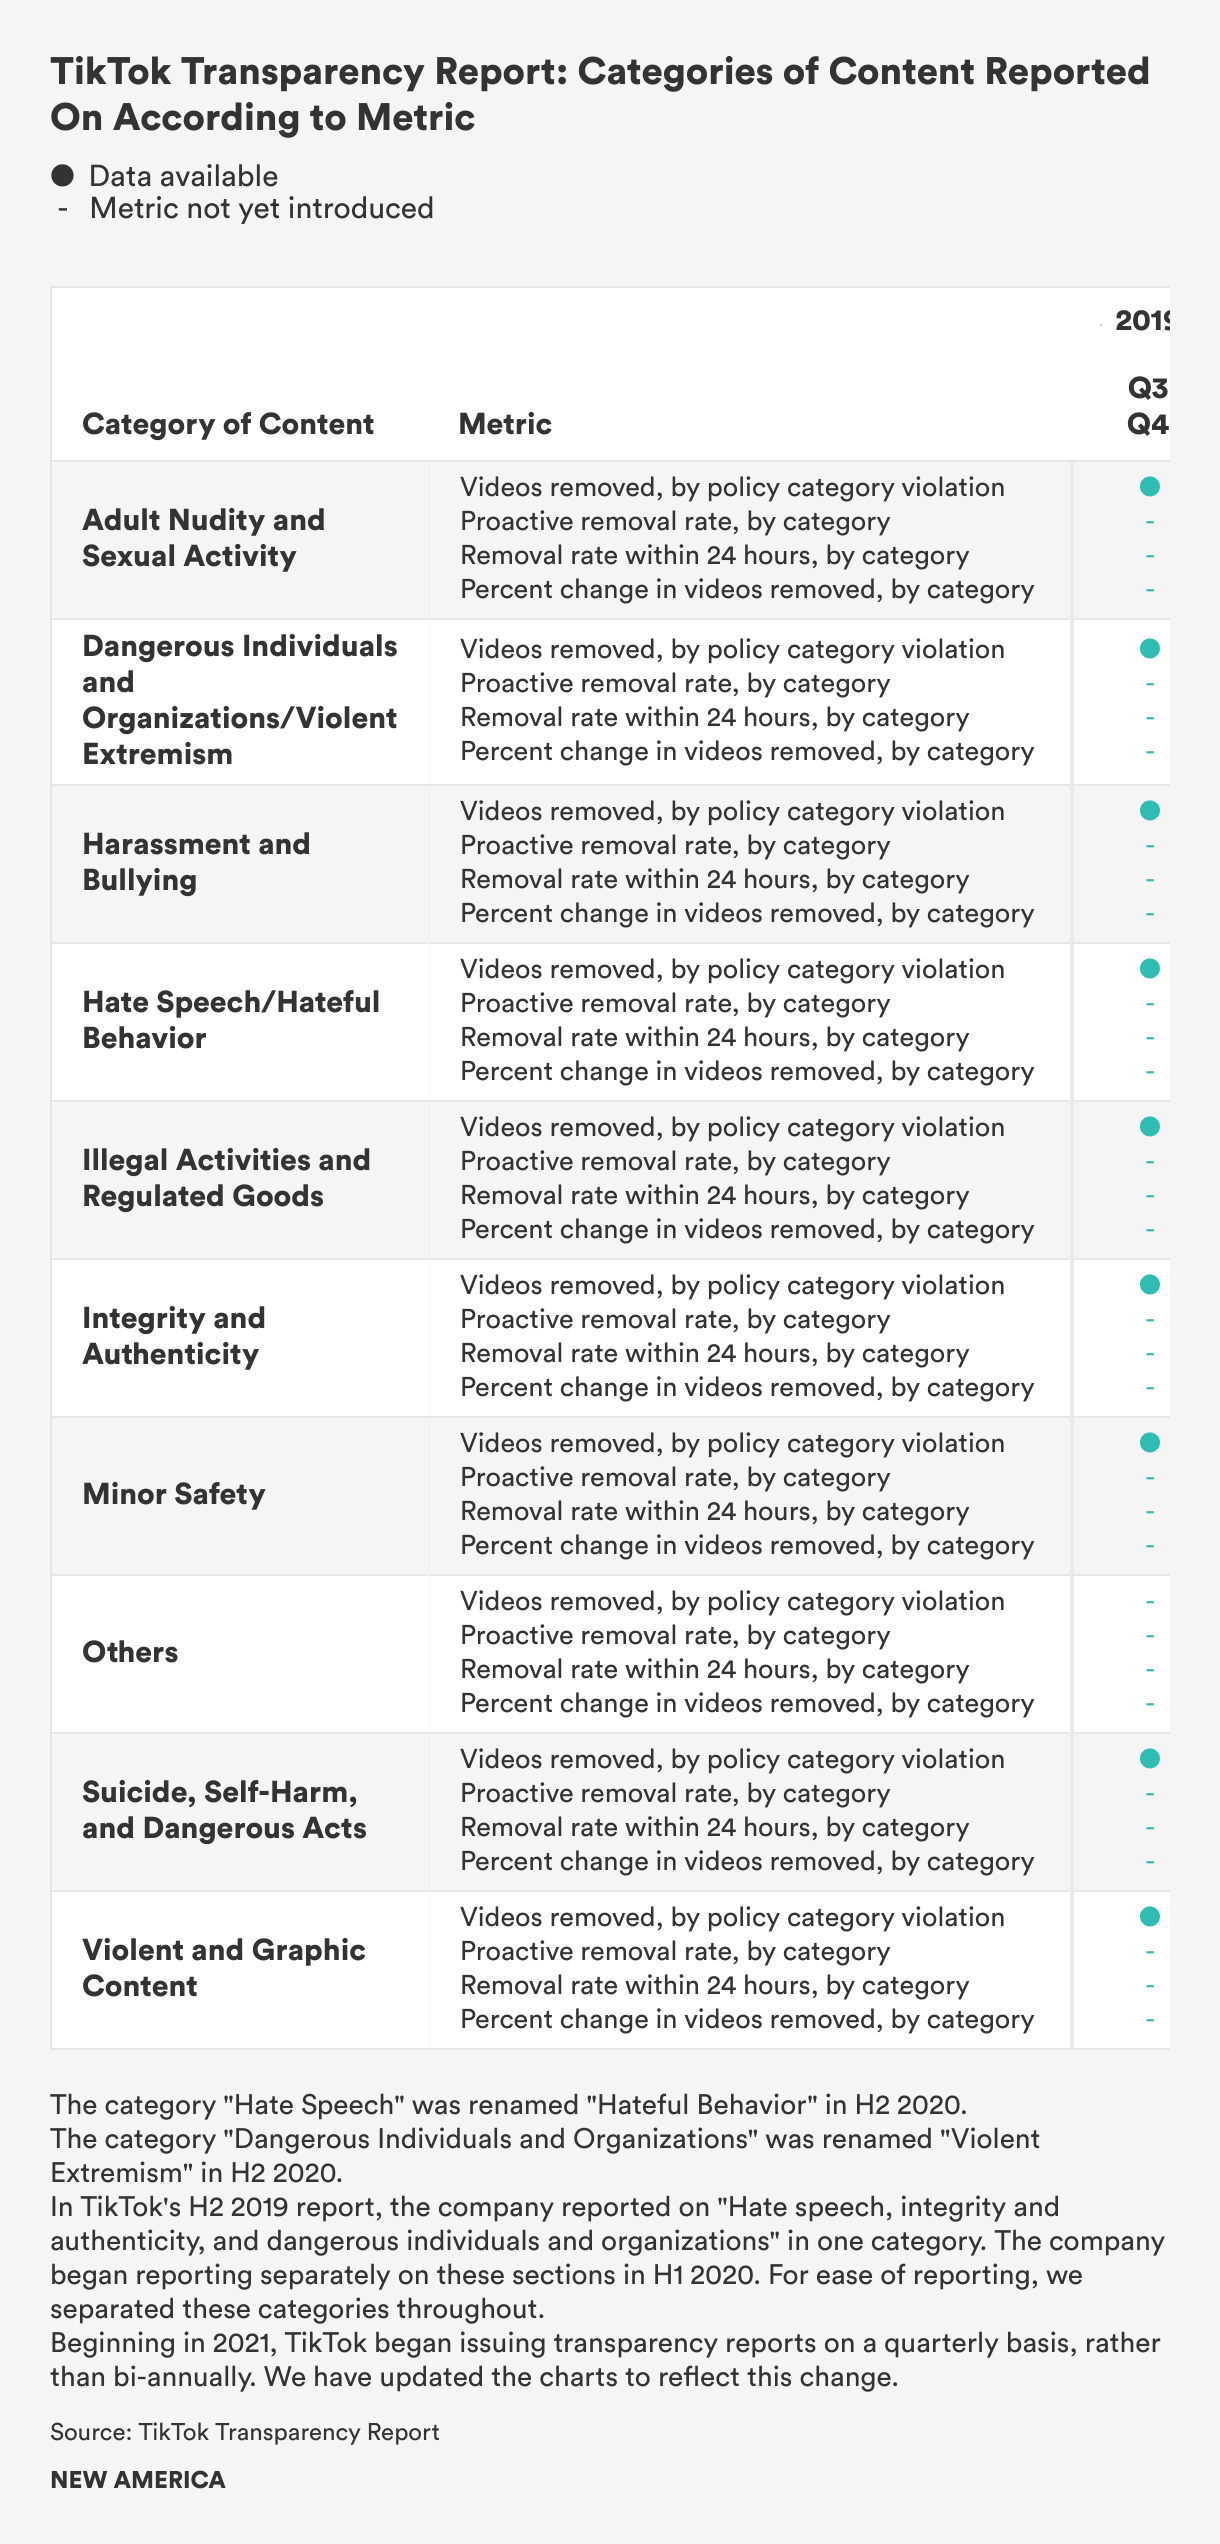
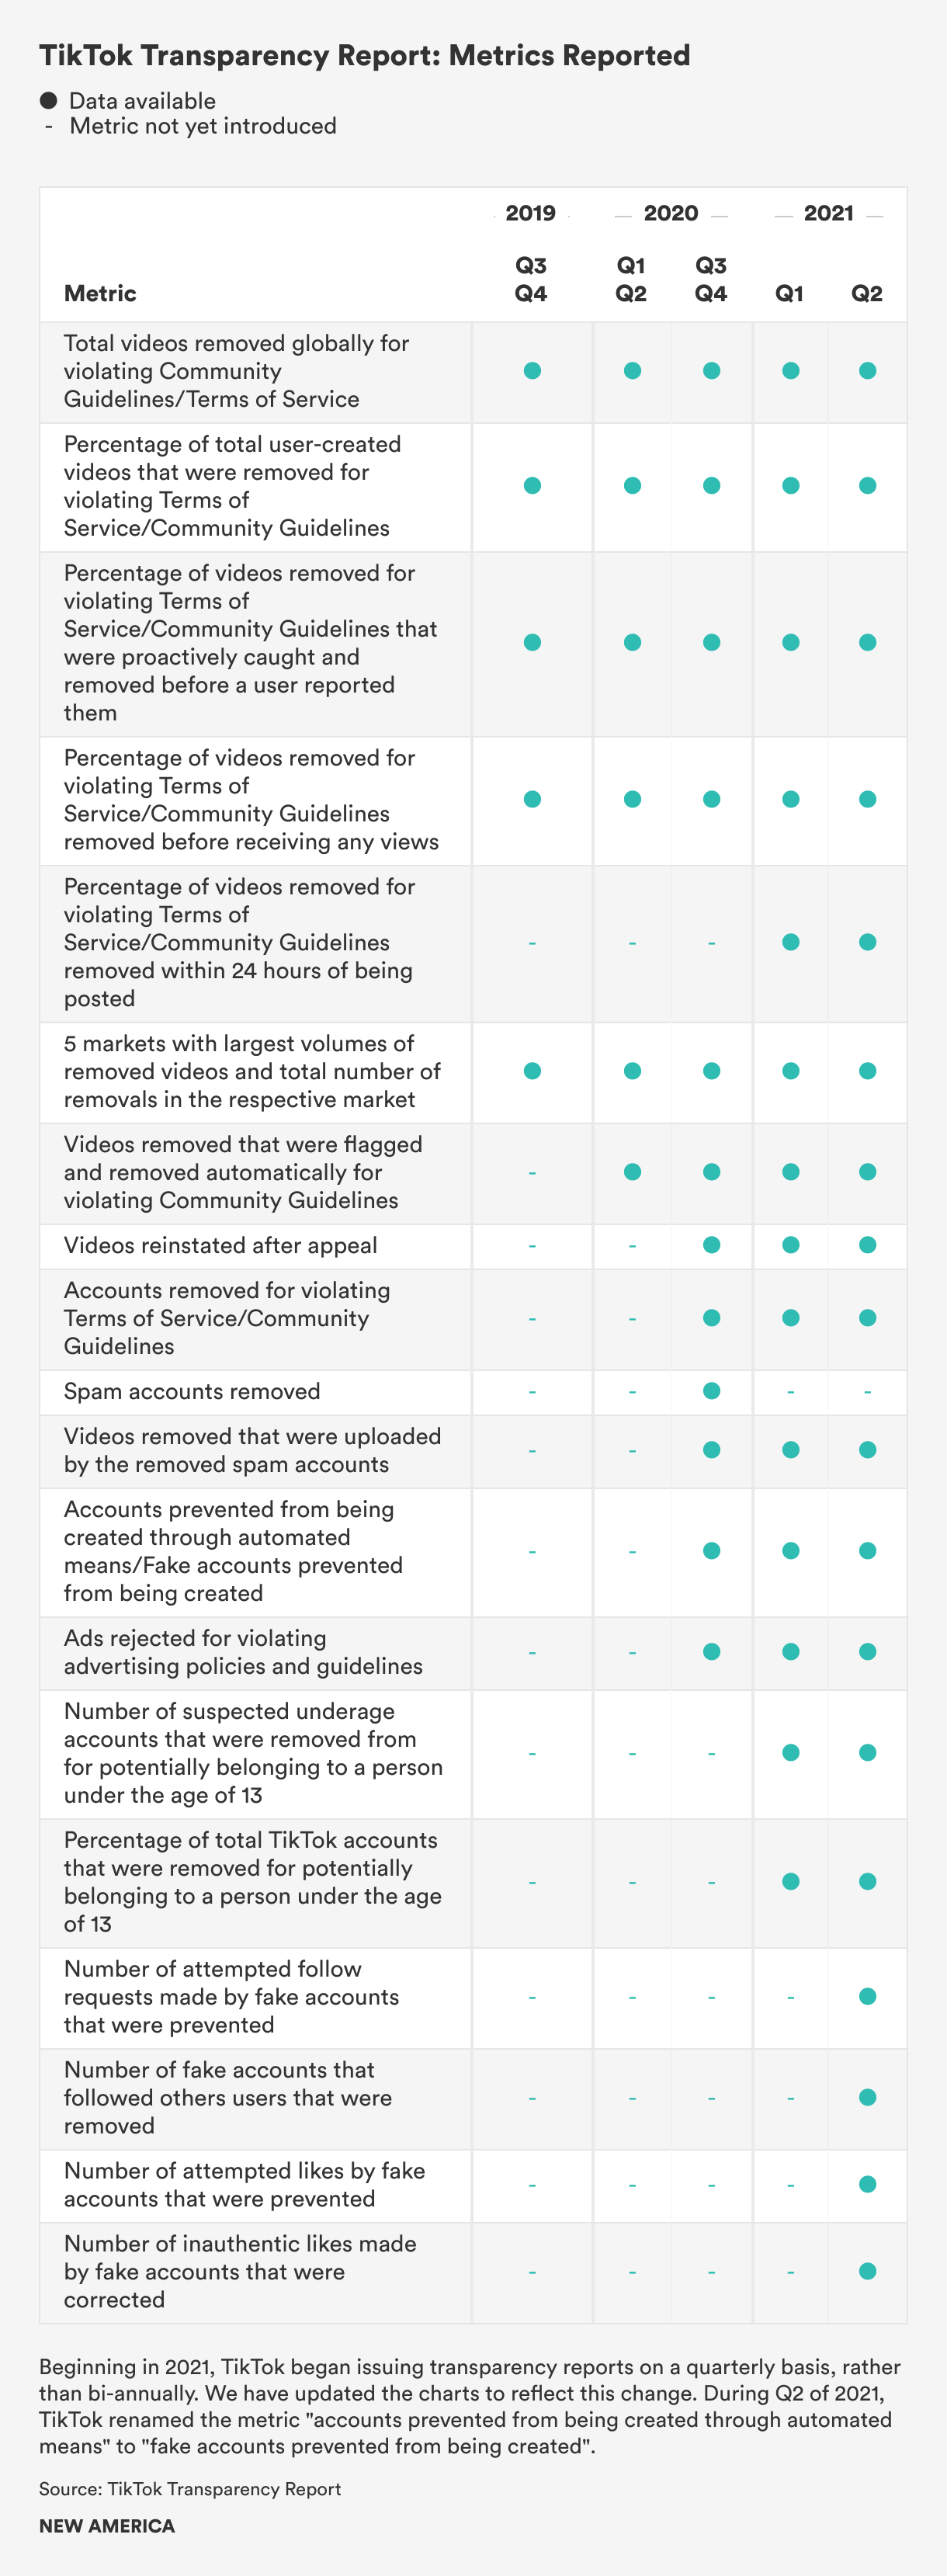
The chart below outlines the categories of content and metrics that TikTok reports on in its transparency report. Up until 2021, TikTok issued bi-annual transparency reports. However, beginning in 2021, the company began issuing reports on a quarterly basis. These data points are broken down by time period in order to demonstrate when TikTok began introducing certain metrics and began reporting on certain categories of content.
TikTok first began publishing transparency reports in 2019. The company first released data on how it enforces its Community Guidelines in its second report, which covered the second half of 2019. Like Reddit, TikTok’s reports do not segment data according to category of content. Rather, TikTok primarily reports metrics that reveal aggregate data about the company’s content policy enforcement efforts.
TikTok’s first transparency report featured some high-level metrics, including the total number of videos the company removed for violating its Terms of Service or Community Guidelines, the percentage of these videos the company proactively detected and removed before a user flagged them, and a breakdown of videos removed by policy category. Some of these metrics are similar to those available in Facebook and Instagram’s CSER. TikTok’s second transparency report featured one new metric: videos removed that were flagged and removed automatically for violating Community Guidelines. The second report also separated data on its hate speech, integrity and authenticity, and dangerous individuals and organizations categories and presented data in a more user-friendly manner. TikTok’s 2021 transparency reports featured seven new metrics, which primarily focused on enforcement actions the company had taken against suspected underage accounts and fake accounts.
In TikTok’s last 2020 transparency report, the company began reporting data on videos reinstated after appeal, accounts and spam content (accounts removed, spam accounts removed, videos removed that were uploaded by spam accounts, accounts prevented from being created through automated means), and ads that were rejected for violating advertising policies and guidelines. In addition, TikTok began reporting more granular data for each policy category, including proactive removal rate and removal rate within 24 hours. The company also provides qualitative explanations on why there were changes in removals within different content categories.
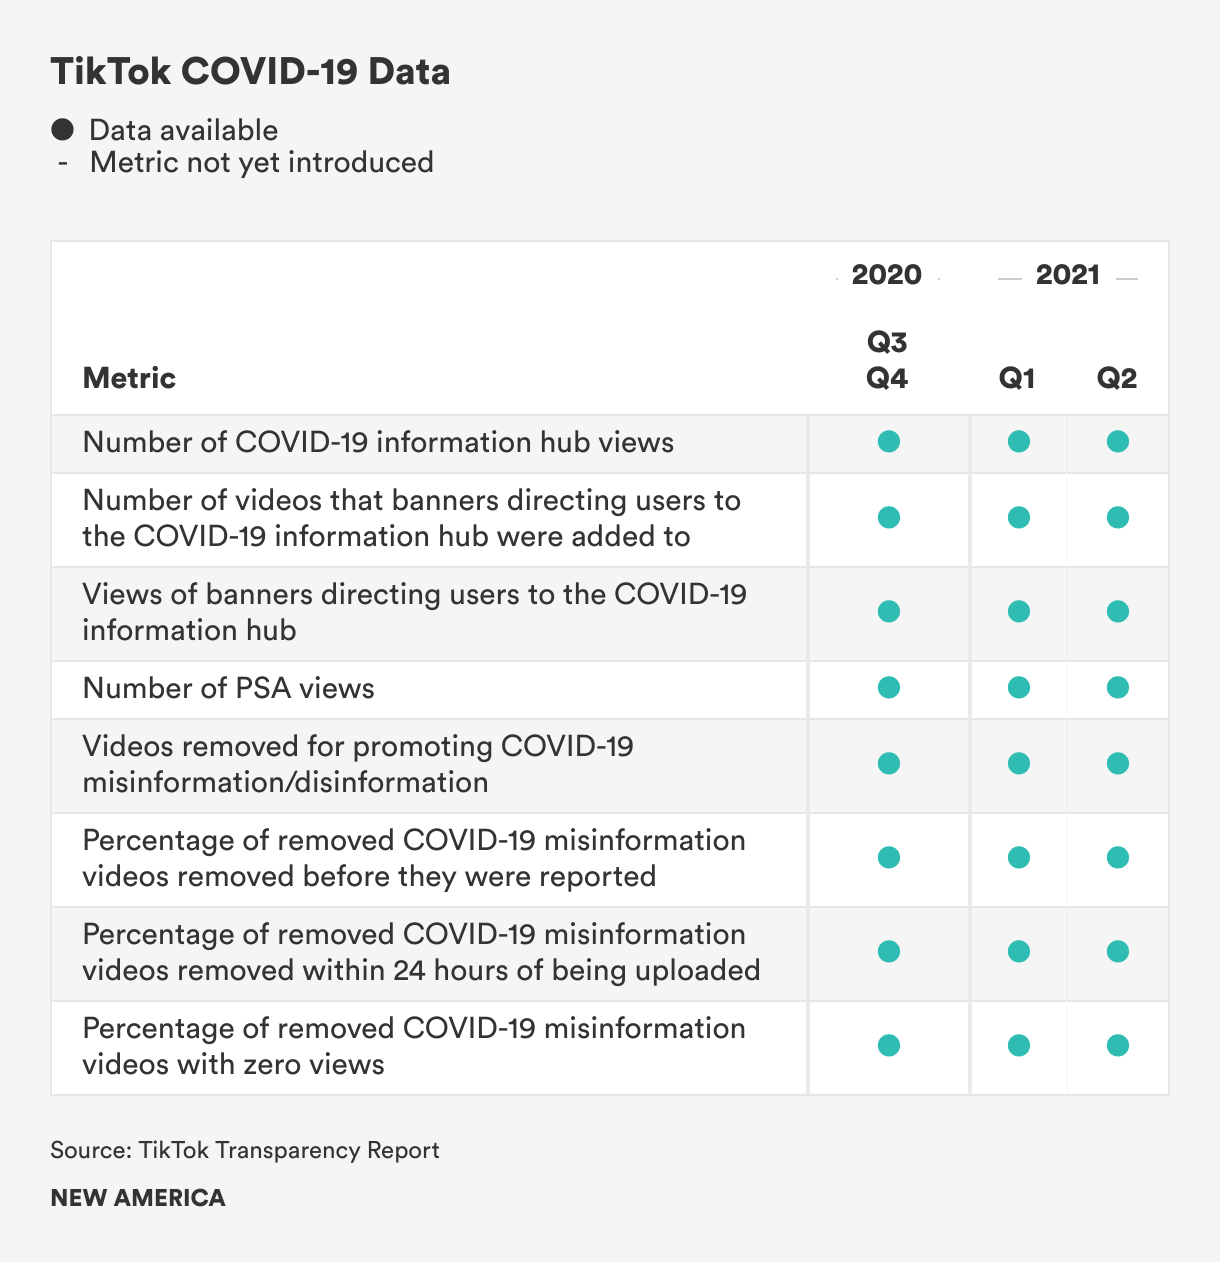
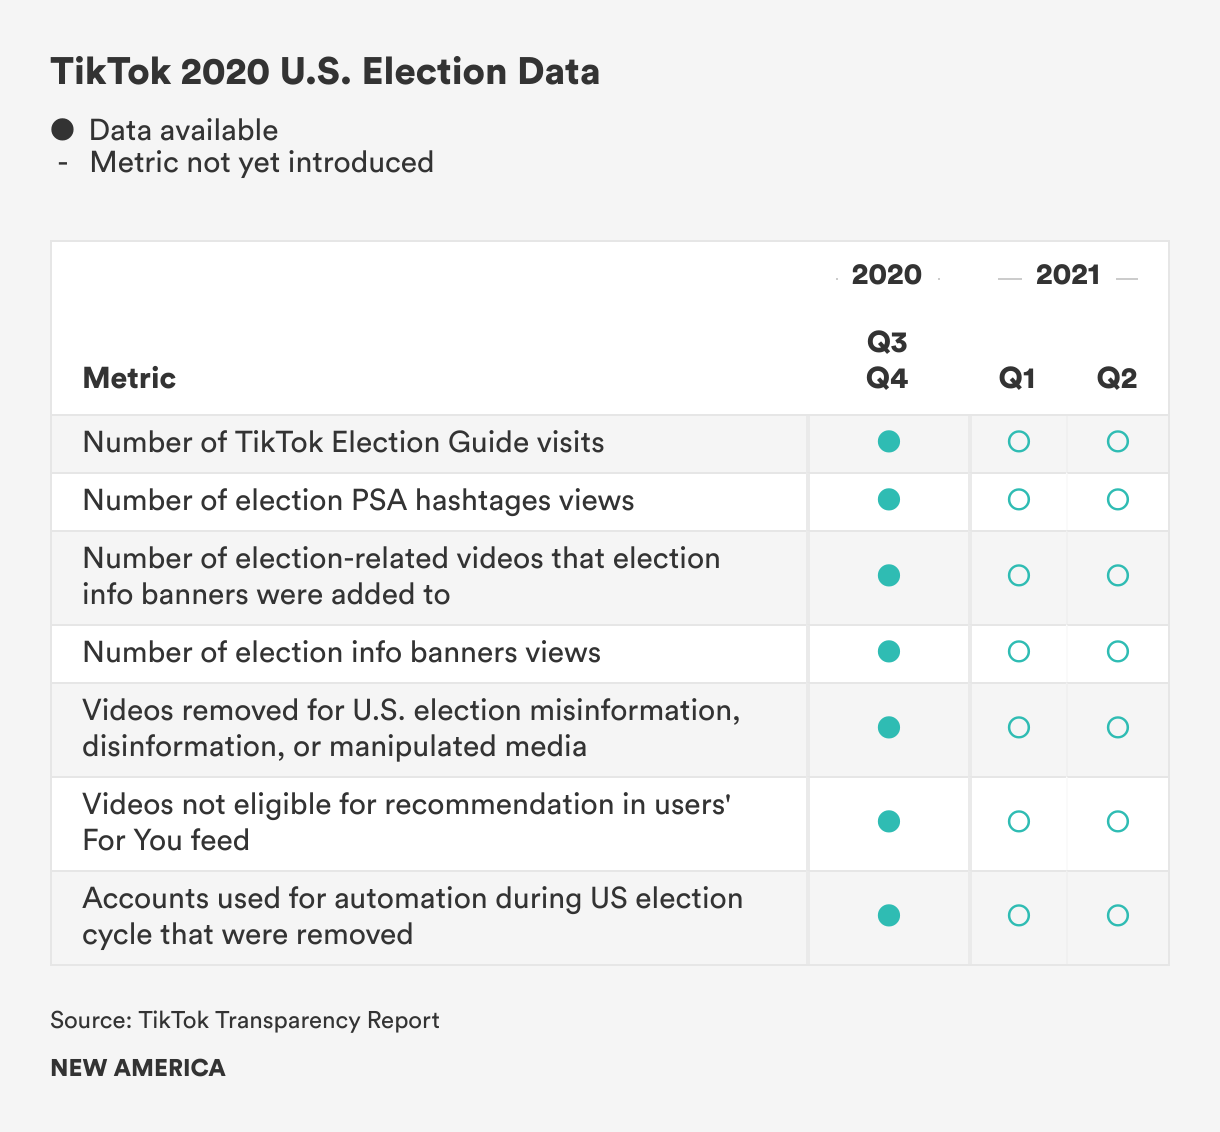
TikTok’s reports also include information and metrics related to the platform’s efforts to spread accurate information regarding COVID-19 and the 2020 U.S. election, although the company no longer reports U.S. election-related data now that the 2020 election cycle is over. Given that election-related content can still circulate after election cycles, however, platforms such as TikTok may want to consider expanding such period-based reporting to encompass one or two quarters after the event.TikTok’s reporting on COVID-19 and the 2020 U.S. election includes data on the number of views TikTok’s COVID-19 Information Hub and its Election Guide received, the number of videos TikTok added COVID-19 and election information banners to, and the number of videos the company removed for spreading COVID-19 misinformation and election disinformation. As we have previously noted in our work on COVID-19 misinformation and U.S. election disinformation, this information is critical for understanding how the platform has responded to misleading information around the coronavirus and the election, and is a valuable starting point for evaluating whether their other misinformation response efforts were effective.
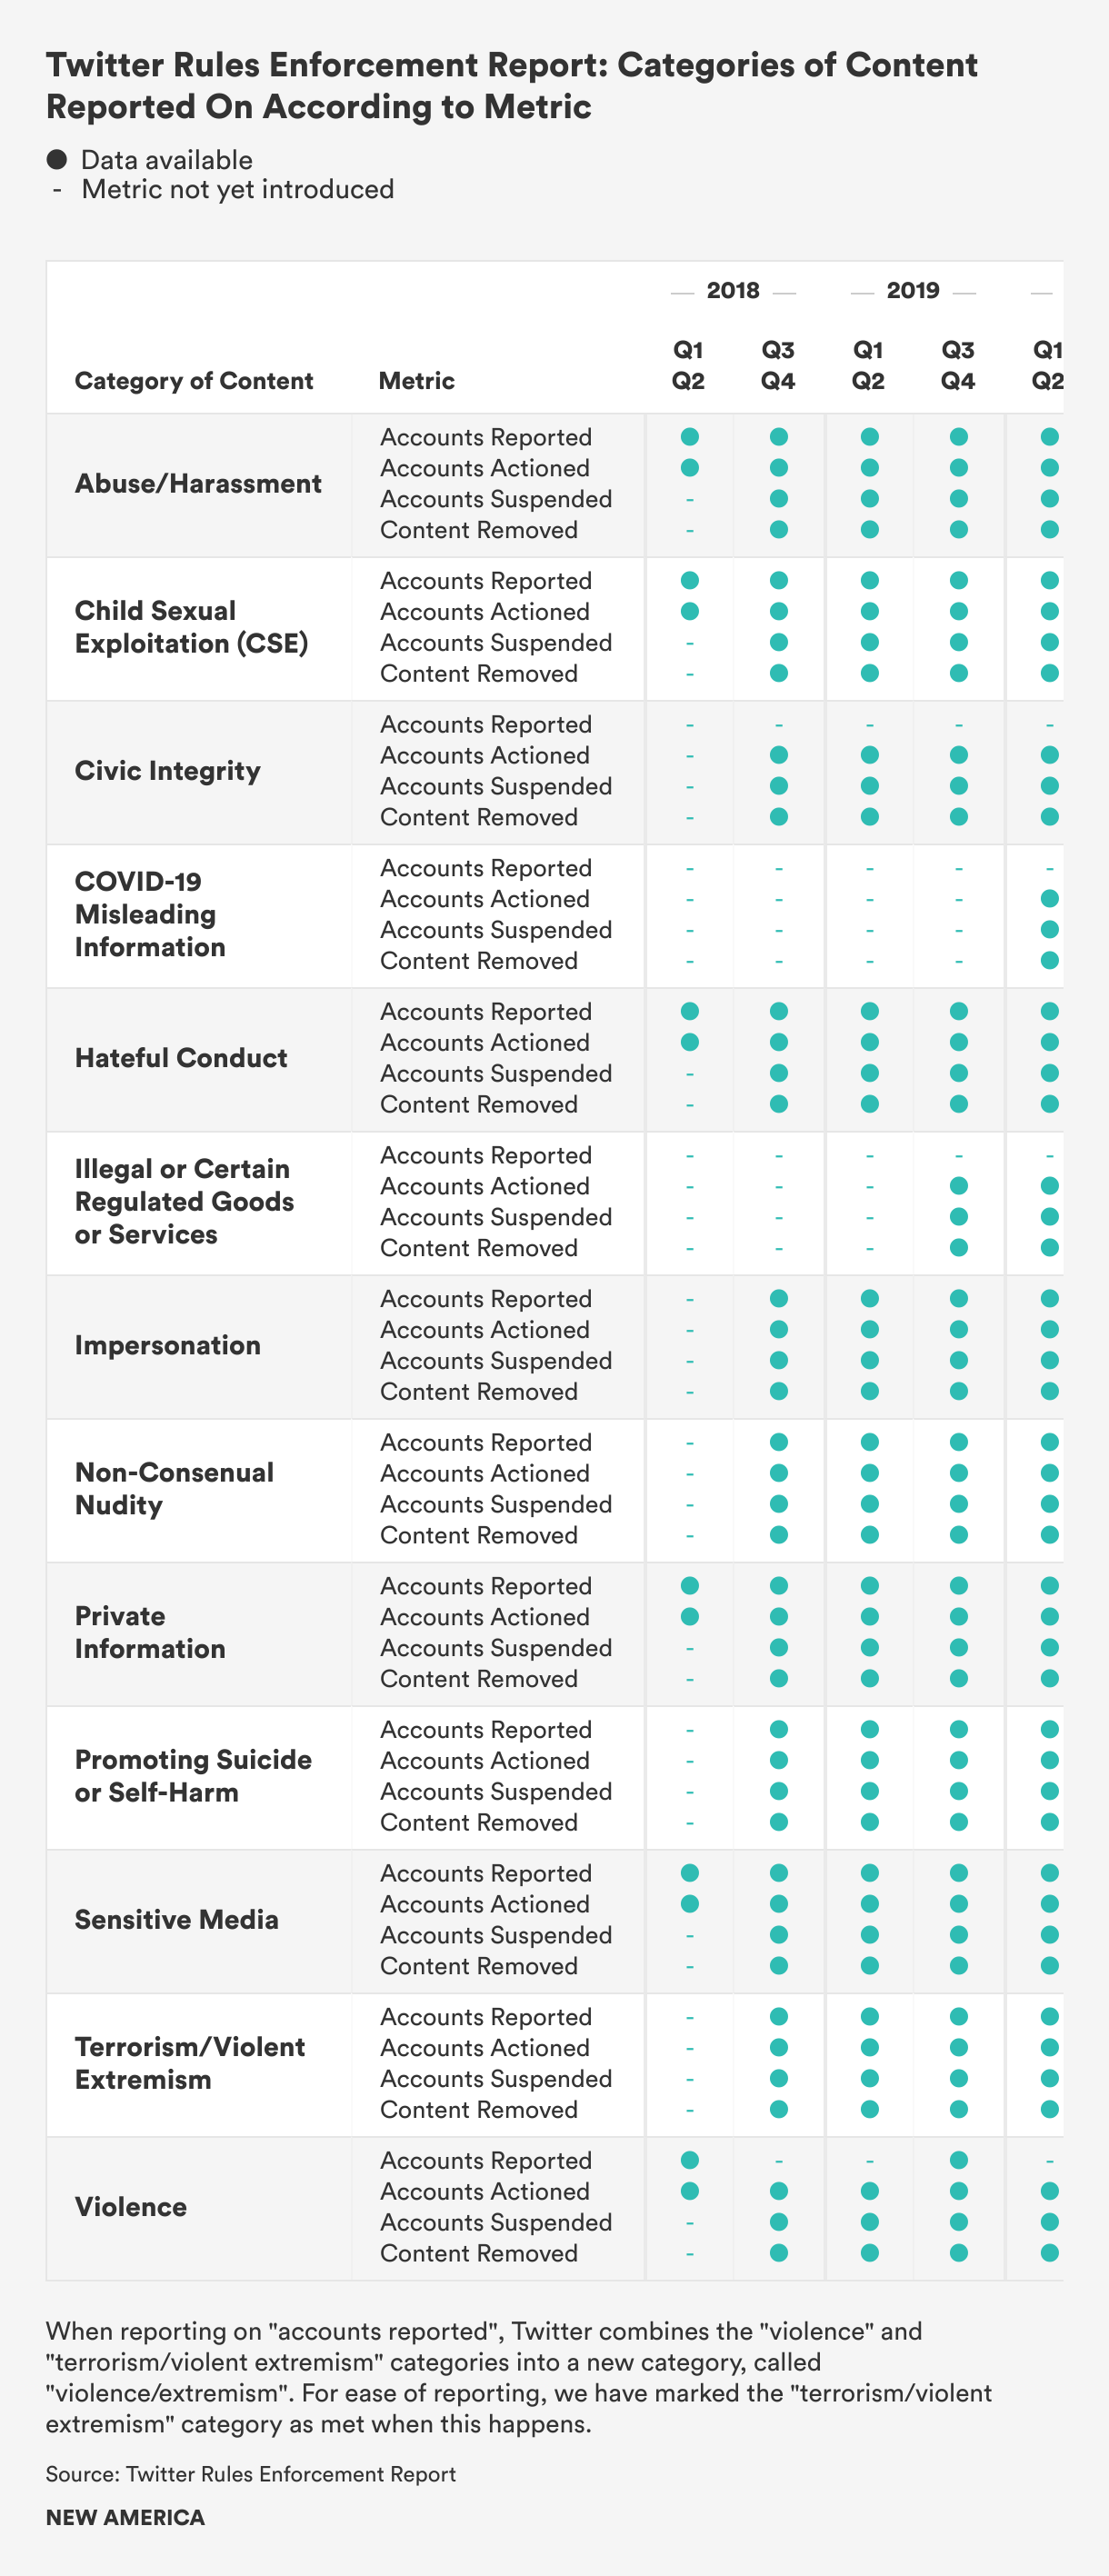
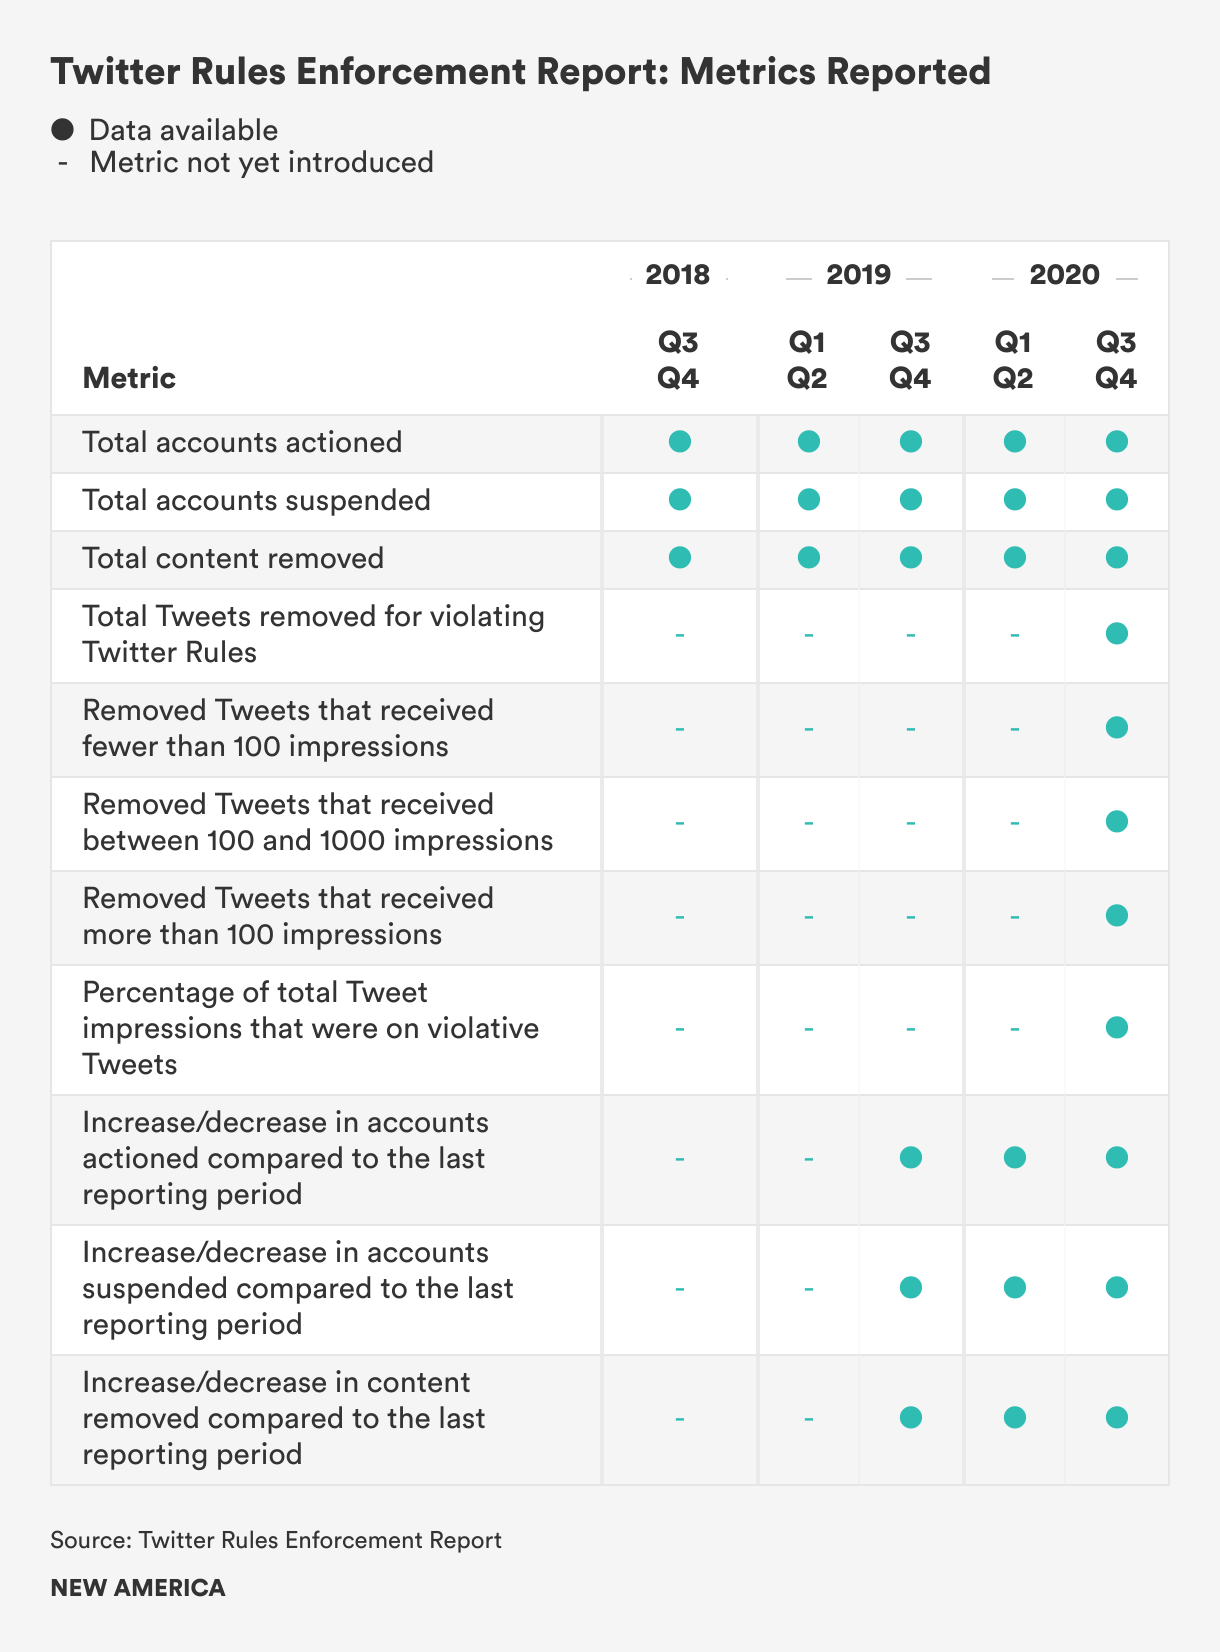
The charts below outline the categories of content and metrics that Twitter reports on its Twitter Rules Enforcement Report. These data points are broken down by time period in order to demonstrate when Twitter began introducing certain metrics and categories of content in its report.
Twitter was the third major internet platform to release a comprehensive transparency report outlining how it enforces its content policies. This report was first released in December 2018.
In August 2020, Twitter released its Rules Enforcement Report for July–December 2019 with updated transparency metrics that provide more granular data regarding their moderation of content areas. Now, Twitter’s reports include data under four metrics: Accounts Actioned, Accounts Suspended, Content Removed, and Actions Reported. Previously, there were only two main metrics in the report: Unique Accounts Reported and Unique Accounts Actioned. Twitter’s 14th and 15th reports, for July–December 2018 and January–June 2019 respectively, have been retroactively updated to fit the newer and more detailed reporting approach. In the context of Twitter’s reports, the term “actioned” refers to the range of enforcement actions that the company can take against a piece of content or an account, including removing the content or suspending the account.
As with Facebook and Instagram, these metrics are broken down by category of content. In the July–December 2019 report, Twitter began reporting on a new content area: Illegal or certain regulated goods or services. The most recent report for January–June 2020 features 13 distinct content areas which each fall into one of their three overarching policy categories of safety, privacy, and authenticity, including a category specifically for COVID-19 misleading misinformation.
Since 2018, Twitter has also reported on the total number of accounts it has actioned, the total number of accounts it has suspended, and the total amount of content it has removed. In the second half of 2019, it expanded these metrics to outline percentage increases or decreases in each of these three categories. In the last half of 2020, the company also began reporting aggregate data on the number of impressions removed Tweets received.
Notably, with the recent expansion of their reporting metrics, Twitter explicitly states their “support for the spirit of the Santa Clara Principles on Transparency and Accountability in Content Moderation,” of which OTI is a co-author, and their commitment to sharing more granular information about their content moderation efforts in the future.
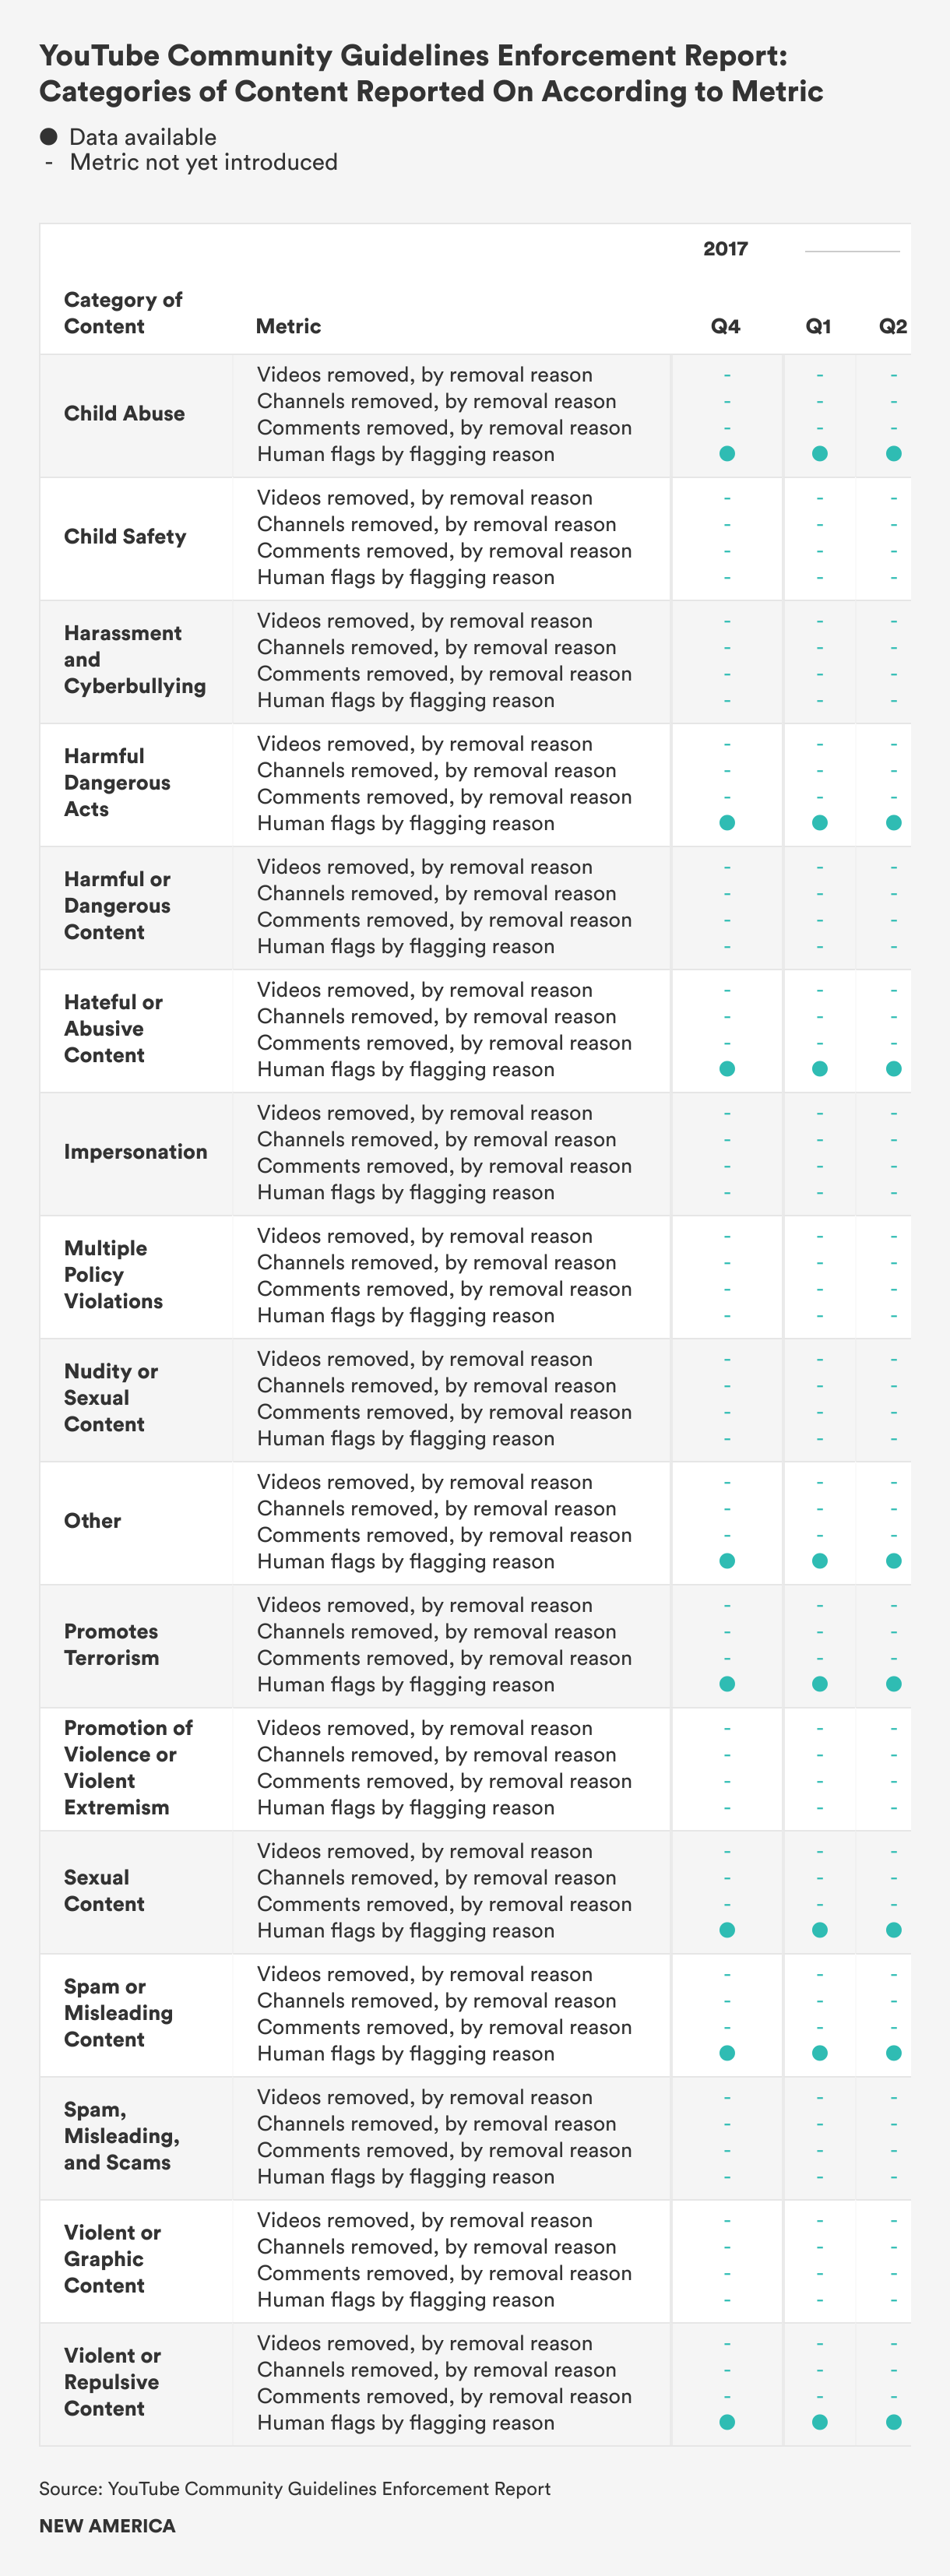
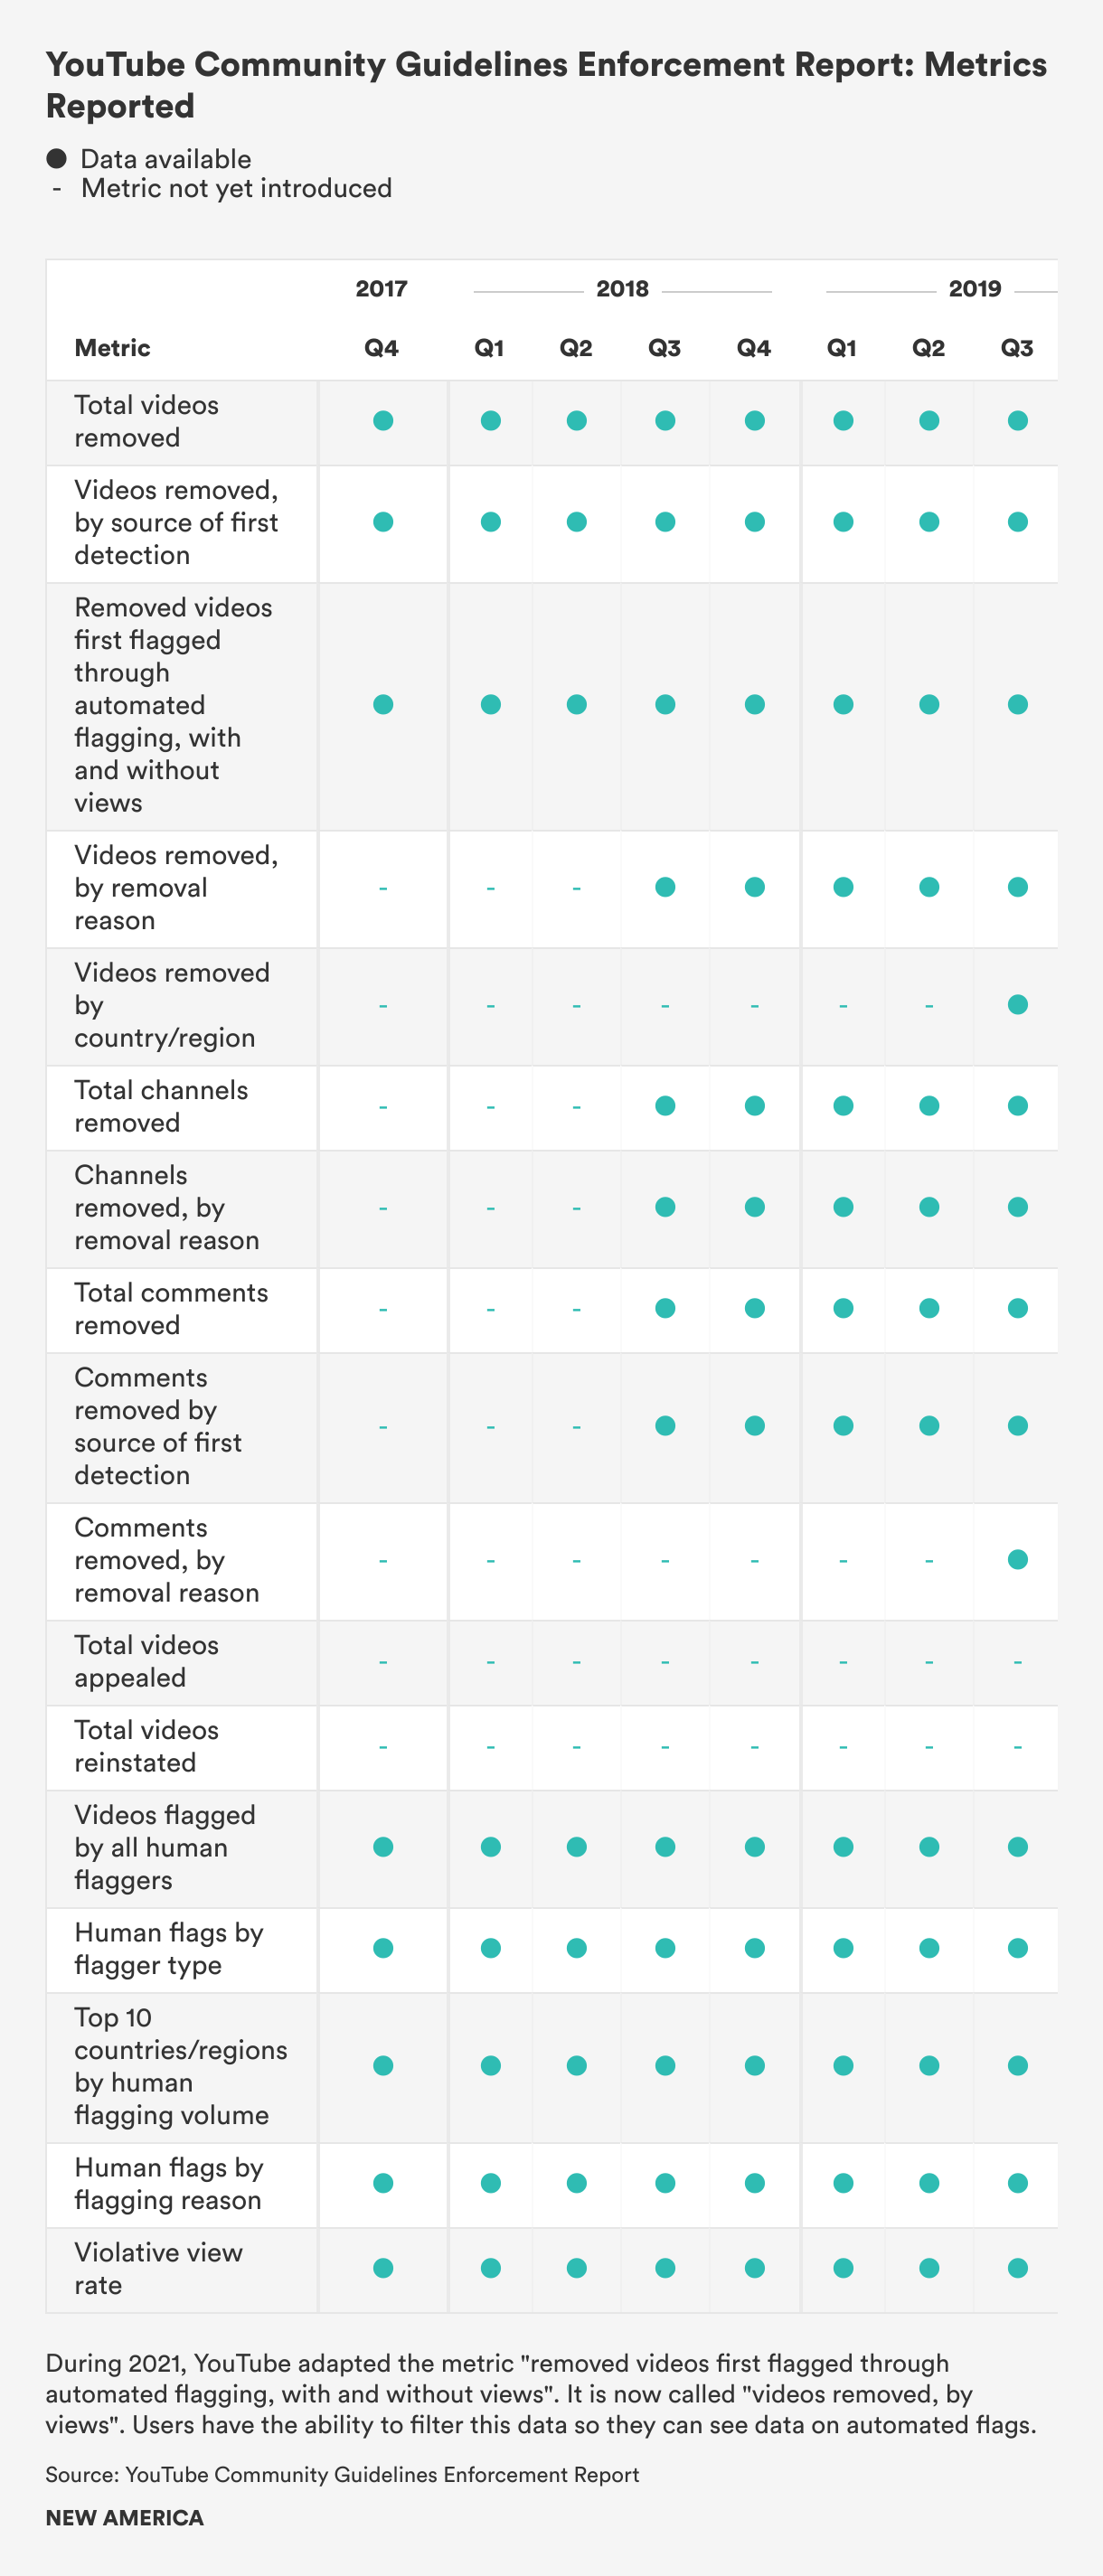
The first chart in this section outlines the different metrics that YouTube reports on in its Community Guidelines Enforcement Report and the categories of content that fall under these metrics. To enable comparison with other companies’ reports, the data has been organized according to category of content. YouTube’s report also includes metrics that do not include data that is broken down by category of content. These metrics, as well as the metrics that are included in the first chart, are outlined in the second chart in order to demonstrate the breadth of metrics offered in the report as well as indicate when they were introduced.
YouTube was the first major technology company to release a comprehensive transparency report outlining how it enforces its content policies. YouTube released this Community Guidelines Enforcement Report in April 2018, which included metrics such as videos removed, broken down by the total number and by the source of first detection. In its July-September 2018 report, YouTube introduced new metrics breaking down removed videos and channels by removal reason, and outlining the total number of comments removed. YouTube’s October-December 2019 report also included metrics and data related to appeals. To note, the metrics Video Removed, by Removal Reason and Channels Removed, by Removal Reason were introduced in September 2018. For ease of reporting, they have been included in the July-September 2018 table in this tracker. In 2021, YouTube introduced one new metric, Violative View Rate, which estimates the proportion of video views that violate the company’s Community Guidelines in a given quarter (excluding spam content). YouTube reported data for this metric for current and past quarters, dating back to Q4 2017.
Whereas Facebook, Instagram, and Twitter, publish data on the same metrics for each category of content included in their transparency reports, YouTube only includes data on categories of content that are relevant to the metrics that they report on in its Community Guidelines Enforcement Report. For example, when YouTube reports on the reasons humans have flagged content for violations, it breaks down the data in this metric by categories of content such as sexual content, spam or misleading content, and hateful or abusive content. However, categories of content such as impersonation, which are featured under other metrics, are not present in the reasons humans have flagged content metric, because impersonation is not a reason humans have chosen to flag content to YouTube, and therefore this category of content is not considered relevant to this metric.
As exemplified by the charts above, the practice of transparency reporting around content moderation has expanded and changed significantly since 2018. Below are a few takeaways related to transparency reporting around content moderation practices, and recommendations on how platforms and other stakeholders can improve these reporting practices going forward.
Content moderation transparency reports lack standardization: Although some platforms report similar content moderation metrics, such as the amount of content they removed and the number of appeals they received for content moderation decisions, there is generally a lack of standardization when it comes to the metrics these reports cover. While it is important for companies to have the flexibility to report metrics that provide insights that are unique to their services, it is also important for researchers, policymakers, and advocates to be able to compare platform efforts to moderate content, and the impact of those efforts. There are many existing civil society resources which outline what an effective content moderation transparency report should look like, including OTI’s Transparency Reporting Toolkit on Content Moderation, the Santa Clara Principles on Transparency and Accountability around Content Moderation, and Ranking Digital Rights’s Corporate Accountability Index. Internet platforms should use these guides to establish a baseline set of metrics they can all report on, and then build on these data points to provide service-specific data. Legislation can help establish these baselines, but policymakers must ensure that the reporting practices they mandate follow civil society recommendations and promote meaningful transparency around content moderation practices, rather than transparency for the sake of transparency.
Transparency reports are getting more granular, but are still missing key content category breakdowns: Over the past several years, platforms such as Facebook, Instagram, and TikTok have provided more granularity in their reporting by separately reporting on content categories such as terrorism, hate speech, and integrity and authenticity. These breakdowns are valuable and shed more light on how platforms moderate specific categories of content. However some platforms continue to lump categories of content together in a manner that obscures potentially valuable insights. For example, YouTube reports on its moderation of spam and misleading content together. While there may be technical challenges to collecting and segmenting this data on the backend, combining them prevents users and researchers from understanding how the company is tackling misleading content specifically. Going forward, companies should avoid reporting on content categories in groups. If they must report on categories of content in groups, companies should explain why this reporting structure is necessary. Additionally, companies should expand the categories of content they are reporting on to encompass the range of categories of content they moderate.
Transparency reports are a first step in providing meaningful insight into content moderation and curation practices: Transparency reports have become a critical method for internet platforms to communicate how they are moderating content and the impact of these efforts to a range of stakeholders. In the last two years, some platforms have used the transparency reporting format to report on a range of new and critical content moderation and curation issues. For example, TikTok used its bi-annual transparency report to provide period-specific data on how it is combating COVID-19 and U.S. election misinformation and disinformation and demonstrate how the company is promoting reliable information about these critical topics. Similarly, the company has begun reporting data on how it enforces its advertising policies in its transparency reports. Other companies, like Google and Facebook, have published separate reports or “ad libraries” with data on the advertisements they have run. These moves demonstrate how internet platforms are using the transparency reporting format to provide a range of additional disclosures. This is a good step, and we encourage companies to think about how the transparency reporting practice can be used to provide a broader range of disclosures around their content moderation and curation efforts. Additionally, companies should explore other formats for providing transparency to different stakeholders. For example, companies could author user-facing blog posts that provide qualitative descriptions of their content moderation and curation efforts and researcher-facing posts that outline how companies train their content curation algorithms. As companies explore these additional methods for promoting transparency, they should ensure that all of these resources are easily accessible and available in one central location, such as a transparency center.
Transparency reports are changing in response to legislative pressures: As the charts above indicate, companies have provided more granular data points related to certain categories of content over the past several years. In some instances, this has been in response to legislative and public pressure. For example, in 2021, TikTok introduced seven new metrics to its report, which emphasize the enforcement actions the company has taken against suspected underage accounts and fake accounts. Similarly, in Q2 2021, Facebook broke down its reporting on Child Nudity and Sexual Exploitation of Children to include separate data on child nudity and physical abuse content or child sexual exploitation content. While these reports do not explicitly mention that the addition and expansion of these metrics are in response to policymaker pressure, the metrics were introduced amid increasing legislative movement related to children’s safety online. Similarly, companies such as TikTok and Twitter have begun reporting on their efforts to tackle misleading information, during a time when lawmaker and civil society pressure on companies to demonstrate how they are combating this category of content were high. In this way, transparency reports can be a mechanism for companies to respond to external pressures around content moderation and communicate to certain stakeholders how they are addressing these content moderation issues.
Transparency reports offer curated insights: While transparency reporting is a valuable method for obtaining insight around how a platform moderates content on its services, it is important to recognize that as of now, transparency reports are proactively produced documents. As a result, companies have sole discretion to decide which metrics they report on, how they calculate the data they share with the public, and which metrics they do not report on. The recently released Facebook Files indicate that the company only removes between 3 percent and 5 percent of hate speech on its services. In its CSER, Facebook reports proactively removing between 80 percent and 90 percent of hate speech. As recent reports outline, both of these figures are correct, but they are based on measures of different things. Facebook has purposely chosen to share the data that paints the company in a more positive light, while obscuring the data that undermines the notion that the company takes strong action against hateful content. Going forward, civil society groups and researchers must press companies to report on more meaningful metrics that provide greater insight into the mechanisms of their content moderation operations. Additionally, as lawmakers in the United States and European Union consider mandating certain transparency reporting practices for internet platforms, they should also consider which metrics will generate the most valuable insights. Lastly, lawmakers and companies should work to establish viable data sharing structures which enable vetted researchers to access company data and provide independent analysis and oversight.
Policy Analyst, Open Technology Institute

Legal/Public Policy Intern, Open Technology Institute