
Global Findings
Across the Asian, European, and North American markets in our dataset, we (1) compare approximations for the total cost consumers can expect to pay for internet service; (2) examine how monthly prices change based on network technology; (3) compare monthly cost; (4) compare advertised download and upload speeds; (5) compare value, based on average monthly cost for comparable average advertised download speeds; and (6) examine the affordability of internet service plans, based on analysis of monthly prices at standardized tiers.
The Total Cost of Connectivity Depends on the Scenario
Many different components make up the total price that consumers pay for internet service. Internet service plans typically include a combination of one-time fees, monthly recurring fees, and, in certain circumstances, one-off fees for data consumption overages or contract termination fees based on advertised costs from providers’ websites. In the following table, we look at the average costs that consumers in each city can expect to pay for each of these components.
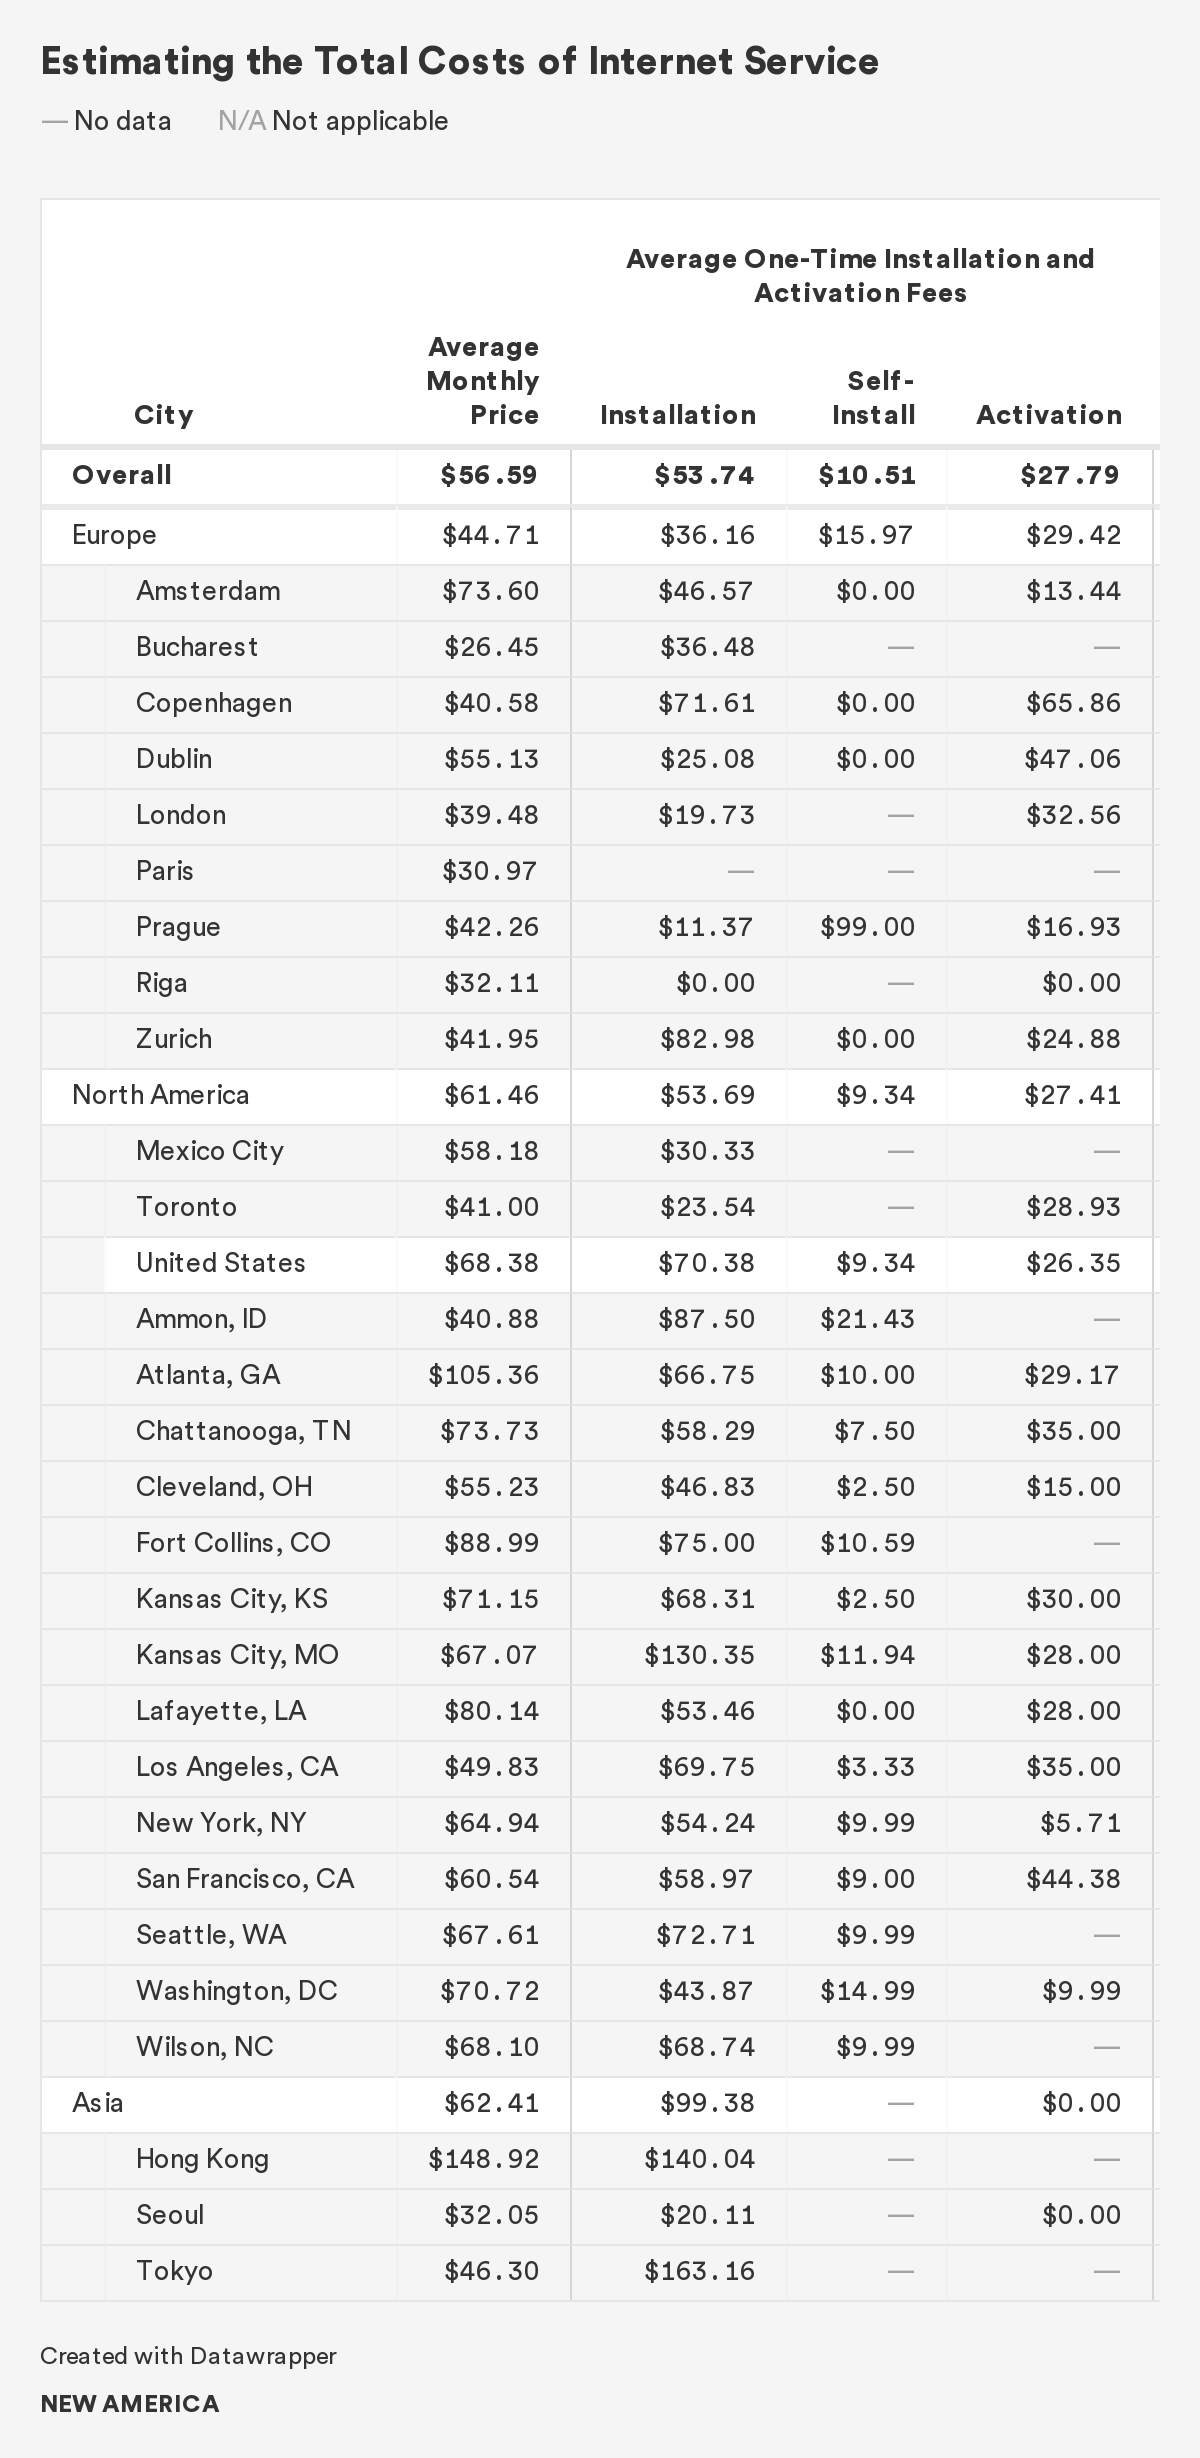
First, consumers pay a baseline monthly price for internet service. This price consists of either a promotional or a non-promotional rate. For the purposes of our analysis, we default to using a provider’s promotional price if available, and where unavailable, we adopt the non-promotional price for that plan.
Second, consumers pay additional fees to set up their service. They sometimes have the choice between paying a higher fee for professional installation that requires a technician or a lower self-installation fee for the consumer to set up their network themselves. Self-installation options are only available if a consumer’s home is already wired for service. Some providers charge an additional activation fee on top of installation fees. In our approximation of the total costs for internet service, we assume that the average consumer pays either a professional installation fee or self-installation fee, on top of an activation fee.
Third, consumers pay either monthly equipment rental fees for a modem and/or Wi-Fi router, or one-time fees upfront to purchase this equipment. We assume that the average consumer either rents or purchases their equipment, and that they require both a modem and Wi-Fi router for internet service because routers require a modem to connect to the internet, though sometimes a single device may be sufficient based on the individual consumer’s circumstances and the network requirements.1
Fourth, some providers have monthly limits on data usage and impose penalties if users go over this cap. Penalties can include overage fees and throttled, reduced speeds. We limit our analysis here to monetary penalties. These fees apply only if users exceed the data cap.
Fifth, providers often charge a one-time fee if consumers terminate their contracts early.
While total prices will vary based on the individual consumer’s scenario, we are able to examine a few baseline costs that apply to every consumer: monthly internet service, equipment, and installation/activation. We compare these approximations for total internet costs across four different scenarios: (1) consumers who opt for equipment rental and professional installation; (2) consumers who opt for equipment rental and self-installation; (3) consumers who opt for equipment purchase and professional installation; and (4) consumers who opt for equipment purchase and self-installation. In each of these scenarios, we assume that consumers pay the activation fee, too.
Consumers in Asia pay the most for these baseline costs, followed by consumers in the United States, and then those in Europe. These baseline costs are likely low average estimates for what consumers pay, especially because they exclude a litany of ancillary fees like taxes, surcharges, and other fees for “internet-related” items, as well as data overage penalties and contract termination fees when applicable. Our findings also rely on advertised prices and speeds, which may not reflect the actual prices consumers pay or the actual speeds they experience.2
In the first and second scenarios, consumers pay a monthly average of $84.37 ($68.38 for internet service plus $15.99 in equipment rental fees) in the United States, $46.83 ($44.71 for internet access plus $2.12 in equipment rental fees) in Europe, and $64.29 ($62.41 for internet service plus $1.88 in equipment rental fees) in Asia.
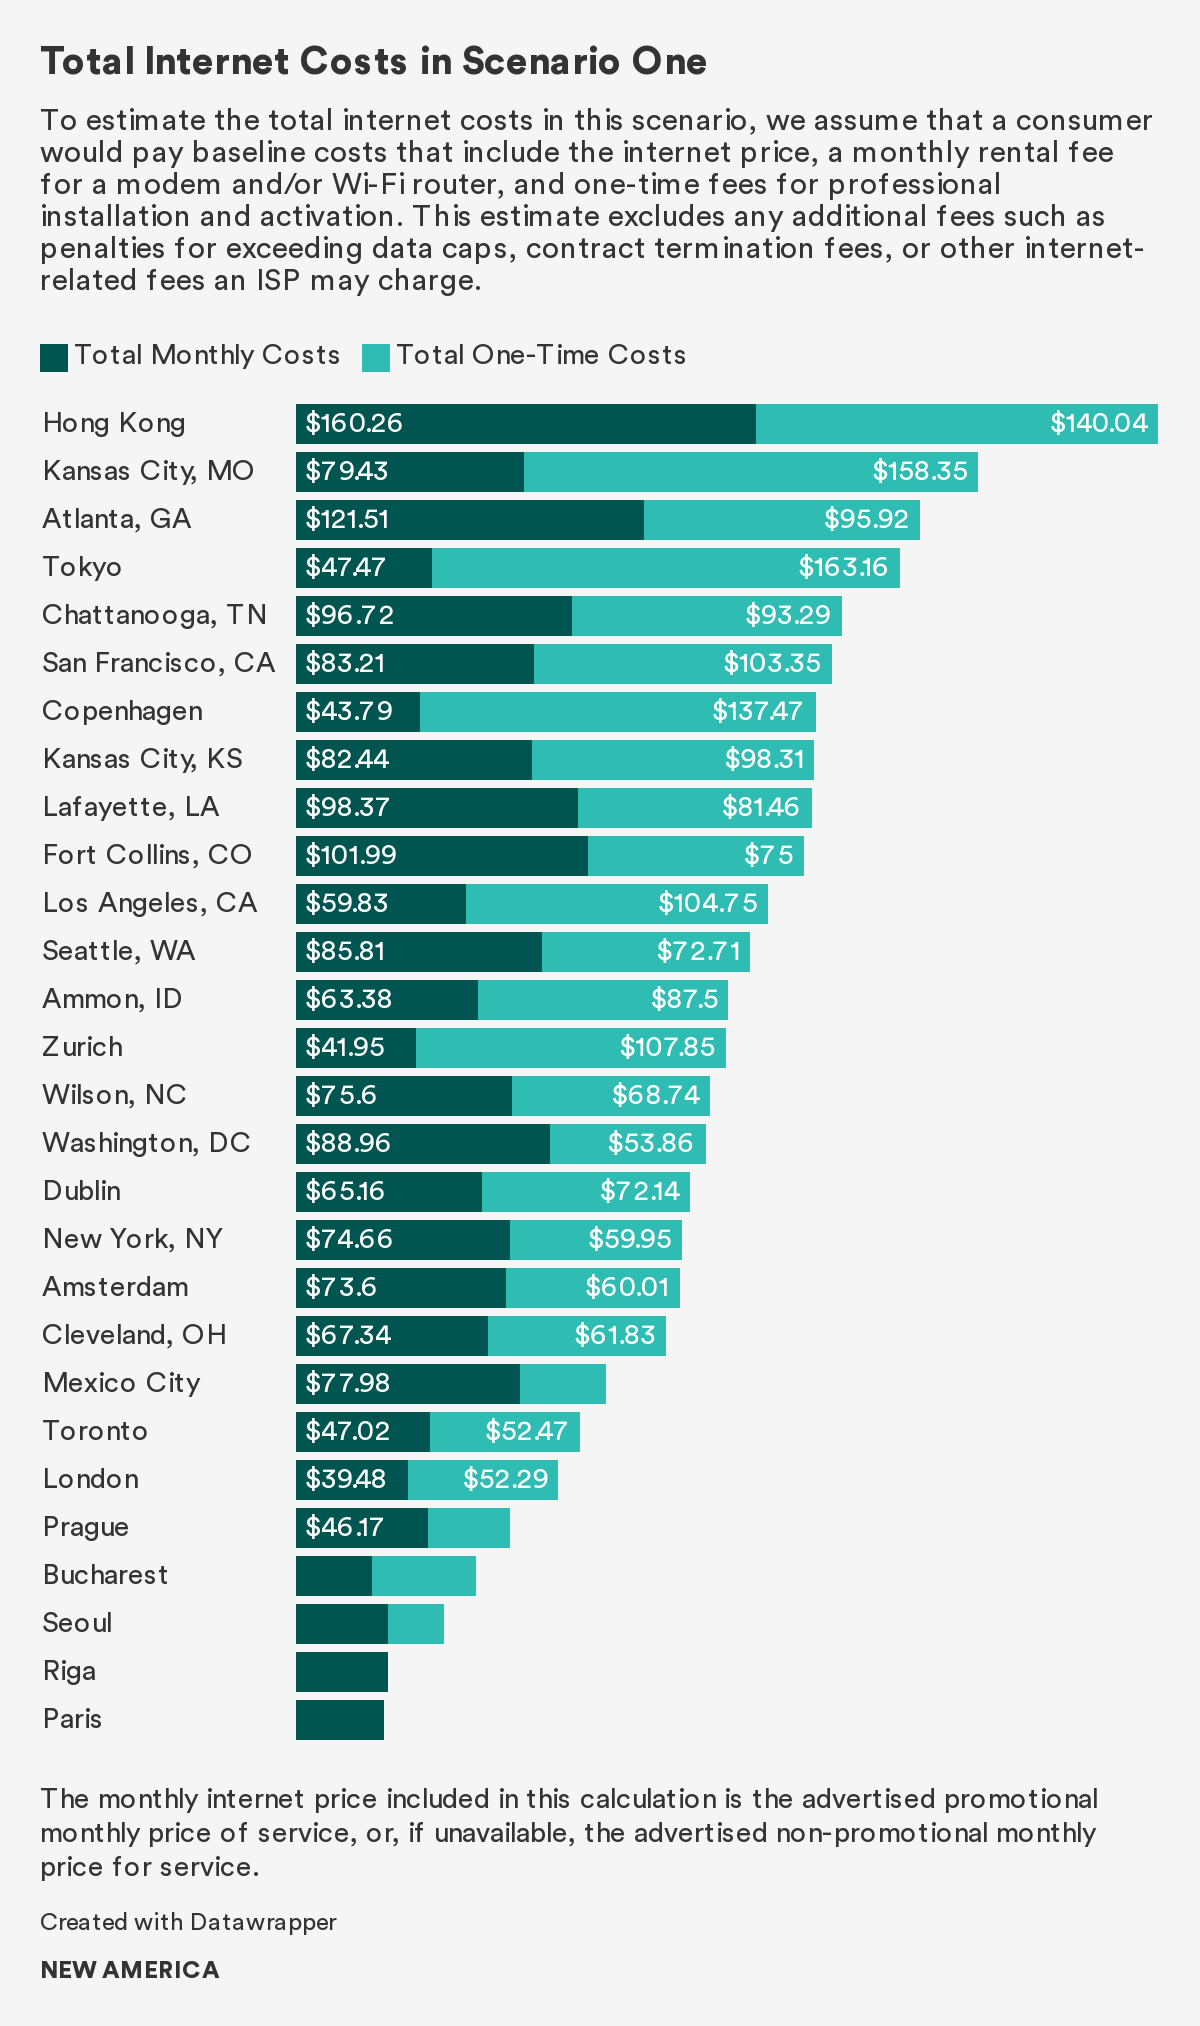
If consumers opt for professional installation, they pay an average one-time cost of $96.73 in the United States, $65.58 in Europe, and $99.38 in Asia. These one-time costs include professional installation and activation fees. Assuming consumers commit to a provider for a year, consumers pay on average $1,109.17 in the United States, $627.54 in Europe, and $870.86 in Asia for total internet costs annually if they choose to rent equipment and opt for professional installation. U.S. consumers in this scenario pay on average 77 percent more than European consumers, and 27 percent more than what Asian consumers pay.
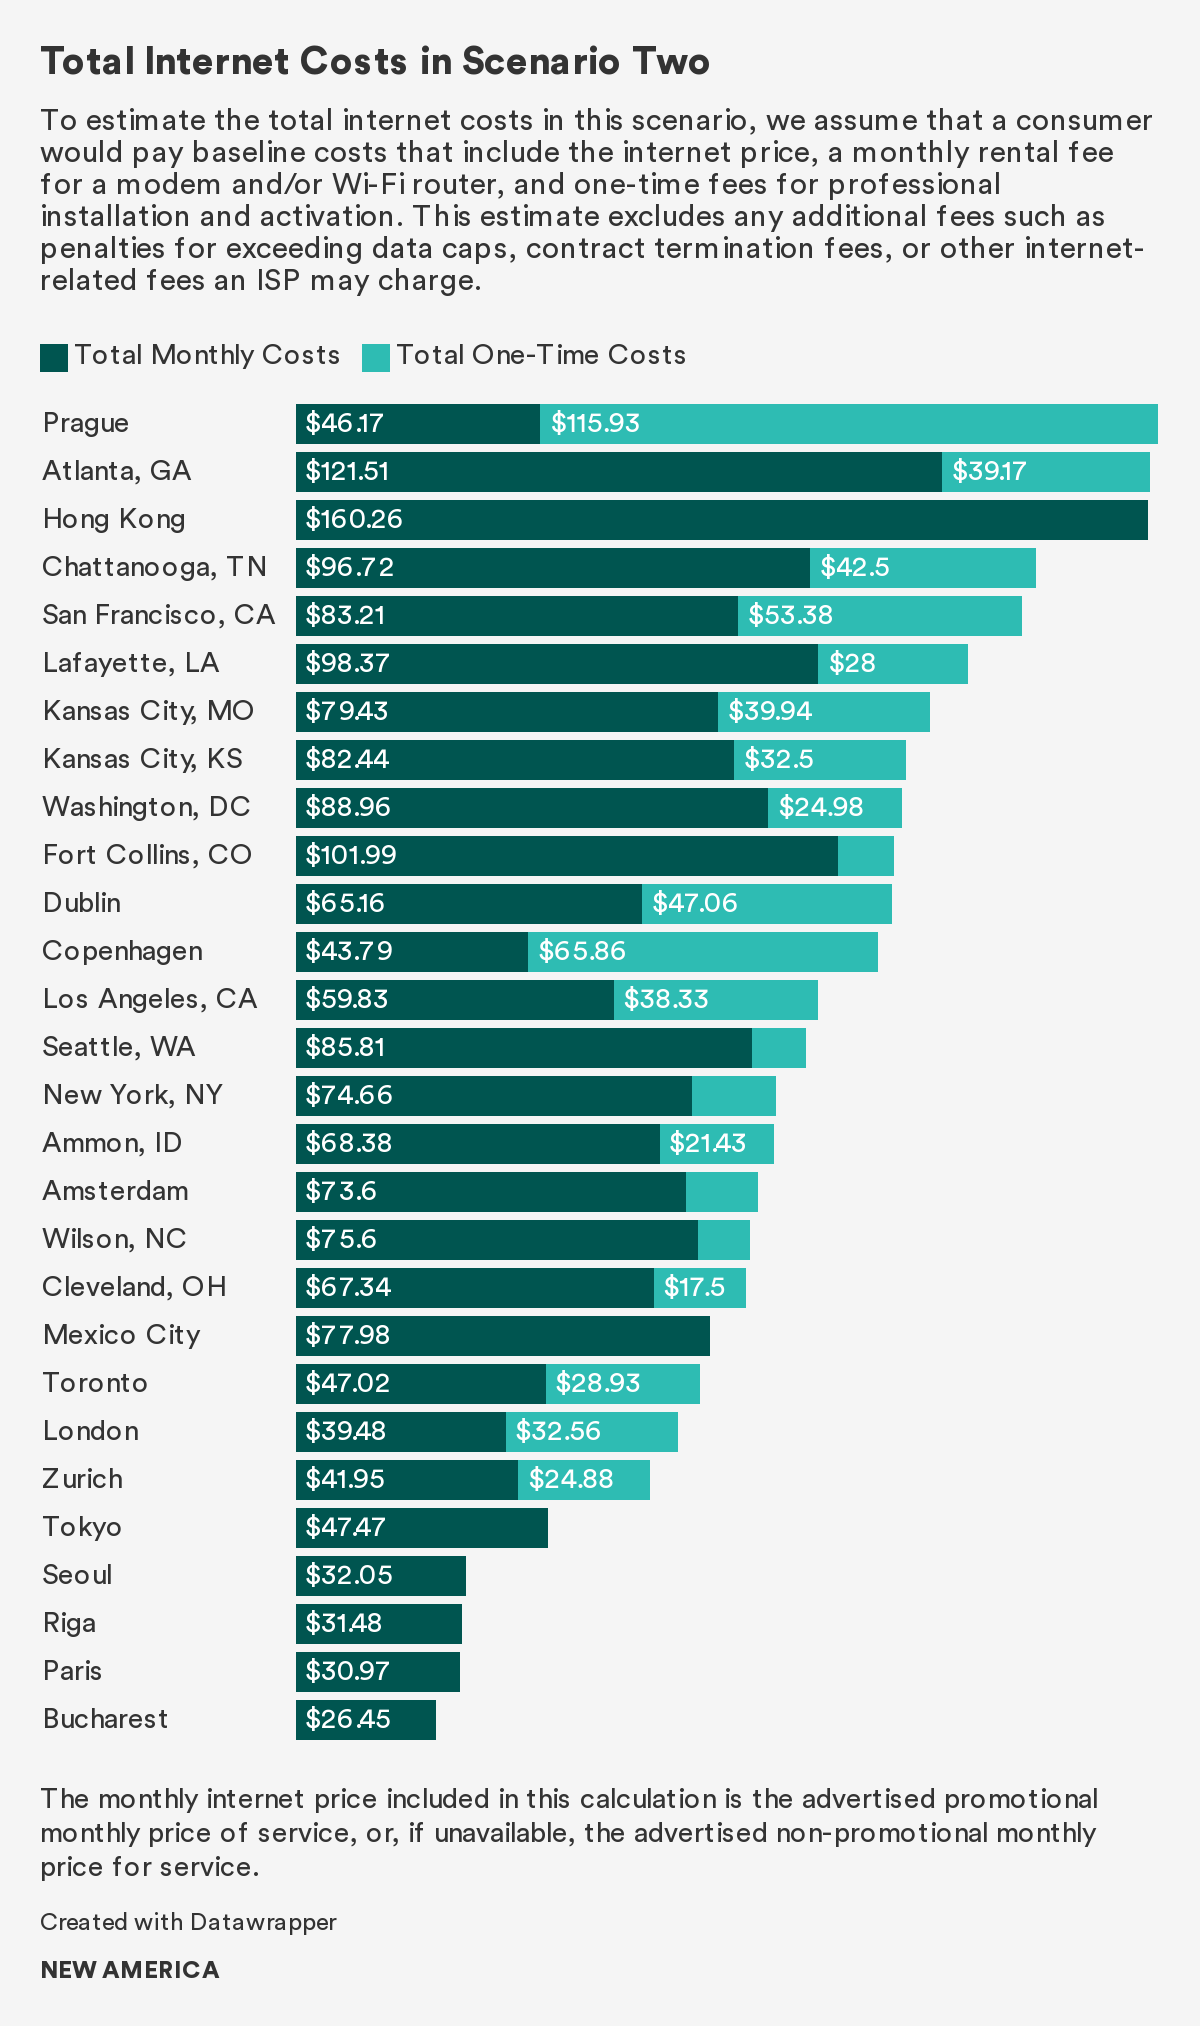
If consumers opt for self-installation, they pay an average one-time cost of $35.65 in the United States and $45.39 in Europe. No information on self-installation options was available for the plans in our dataset in Asia, so we exclude Asia in this analysis. These one-time costs include self-installation and activation fees. Assuming consumers commit to a provider for a year, consumers pay on average $1,048.09 in the United States and $607.35 in Europe for total internet costs annually if they choose to rent equipment and opt for self-installation. U.S. consumers in this scenario pay 73 percent more than European consumers.
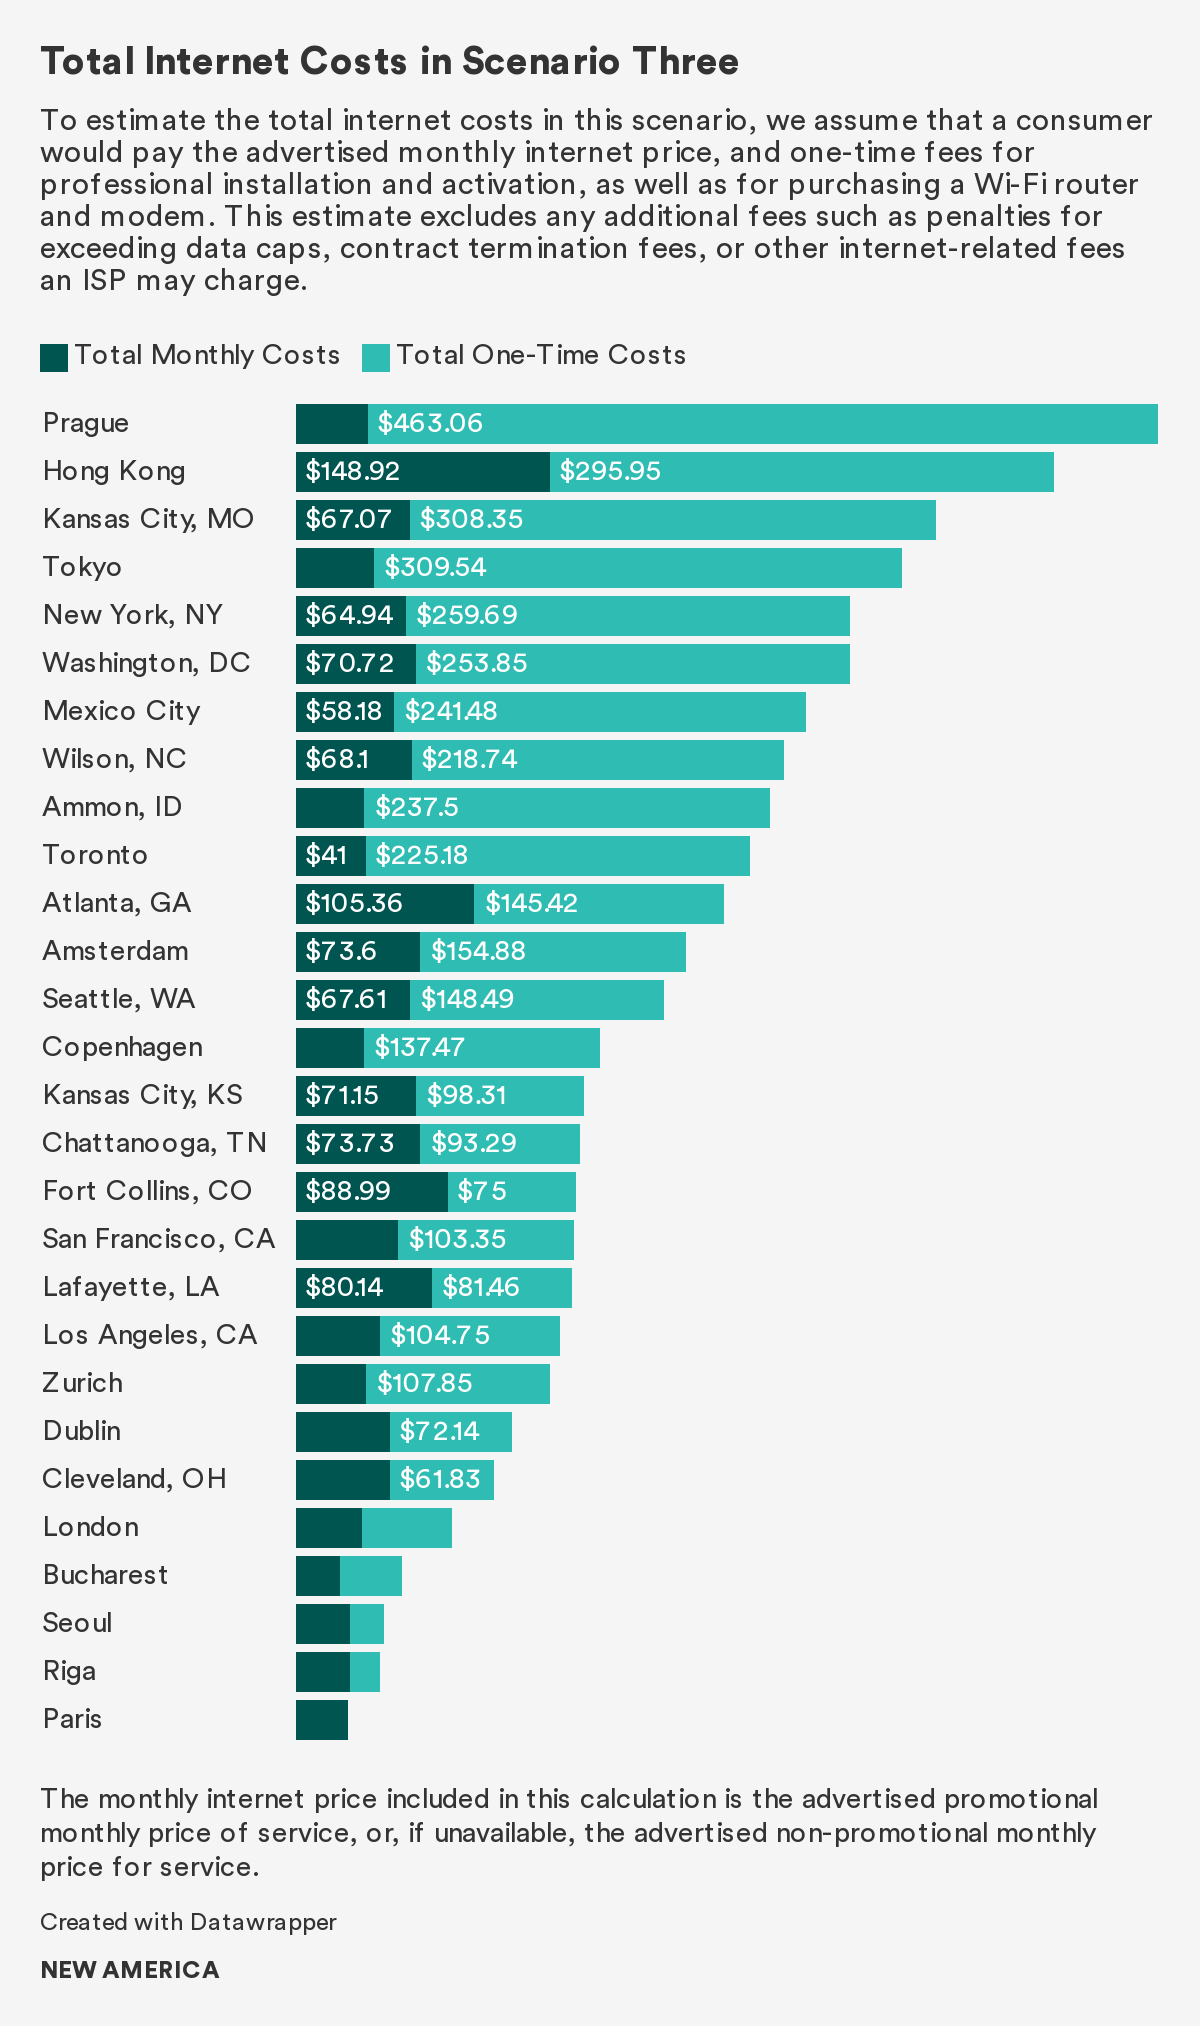
In the third and fourth scenarios, consumers pay a monthly average of $68.38 in the United States, $44.71 in Europe, and $62.41 in Asia.
If consumers opt for professional installation, they pay an average one-time cost of $223.40 in the United States, $251.80 in Europe, and $401.68 in Asia. These one-time costs include professional installation, activation, modem, and Wi-Fi router purchase fees. Assuming consumers commit to a provider for a year, they pay on average $1,044.10 in the United States, $788.32 in Europe, and $1,150.60 in Asia for total internet costs annually if they choose to purchase equipment and opt for professional installation. In this scenario, U.S. consumers pay 32 percent more than European consumers.
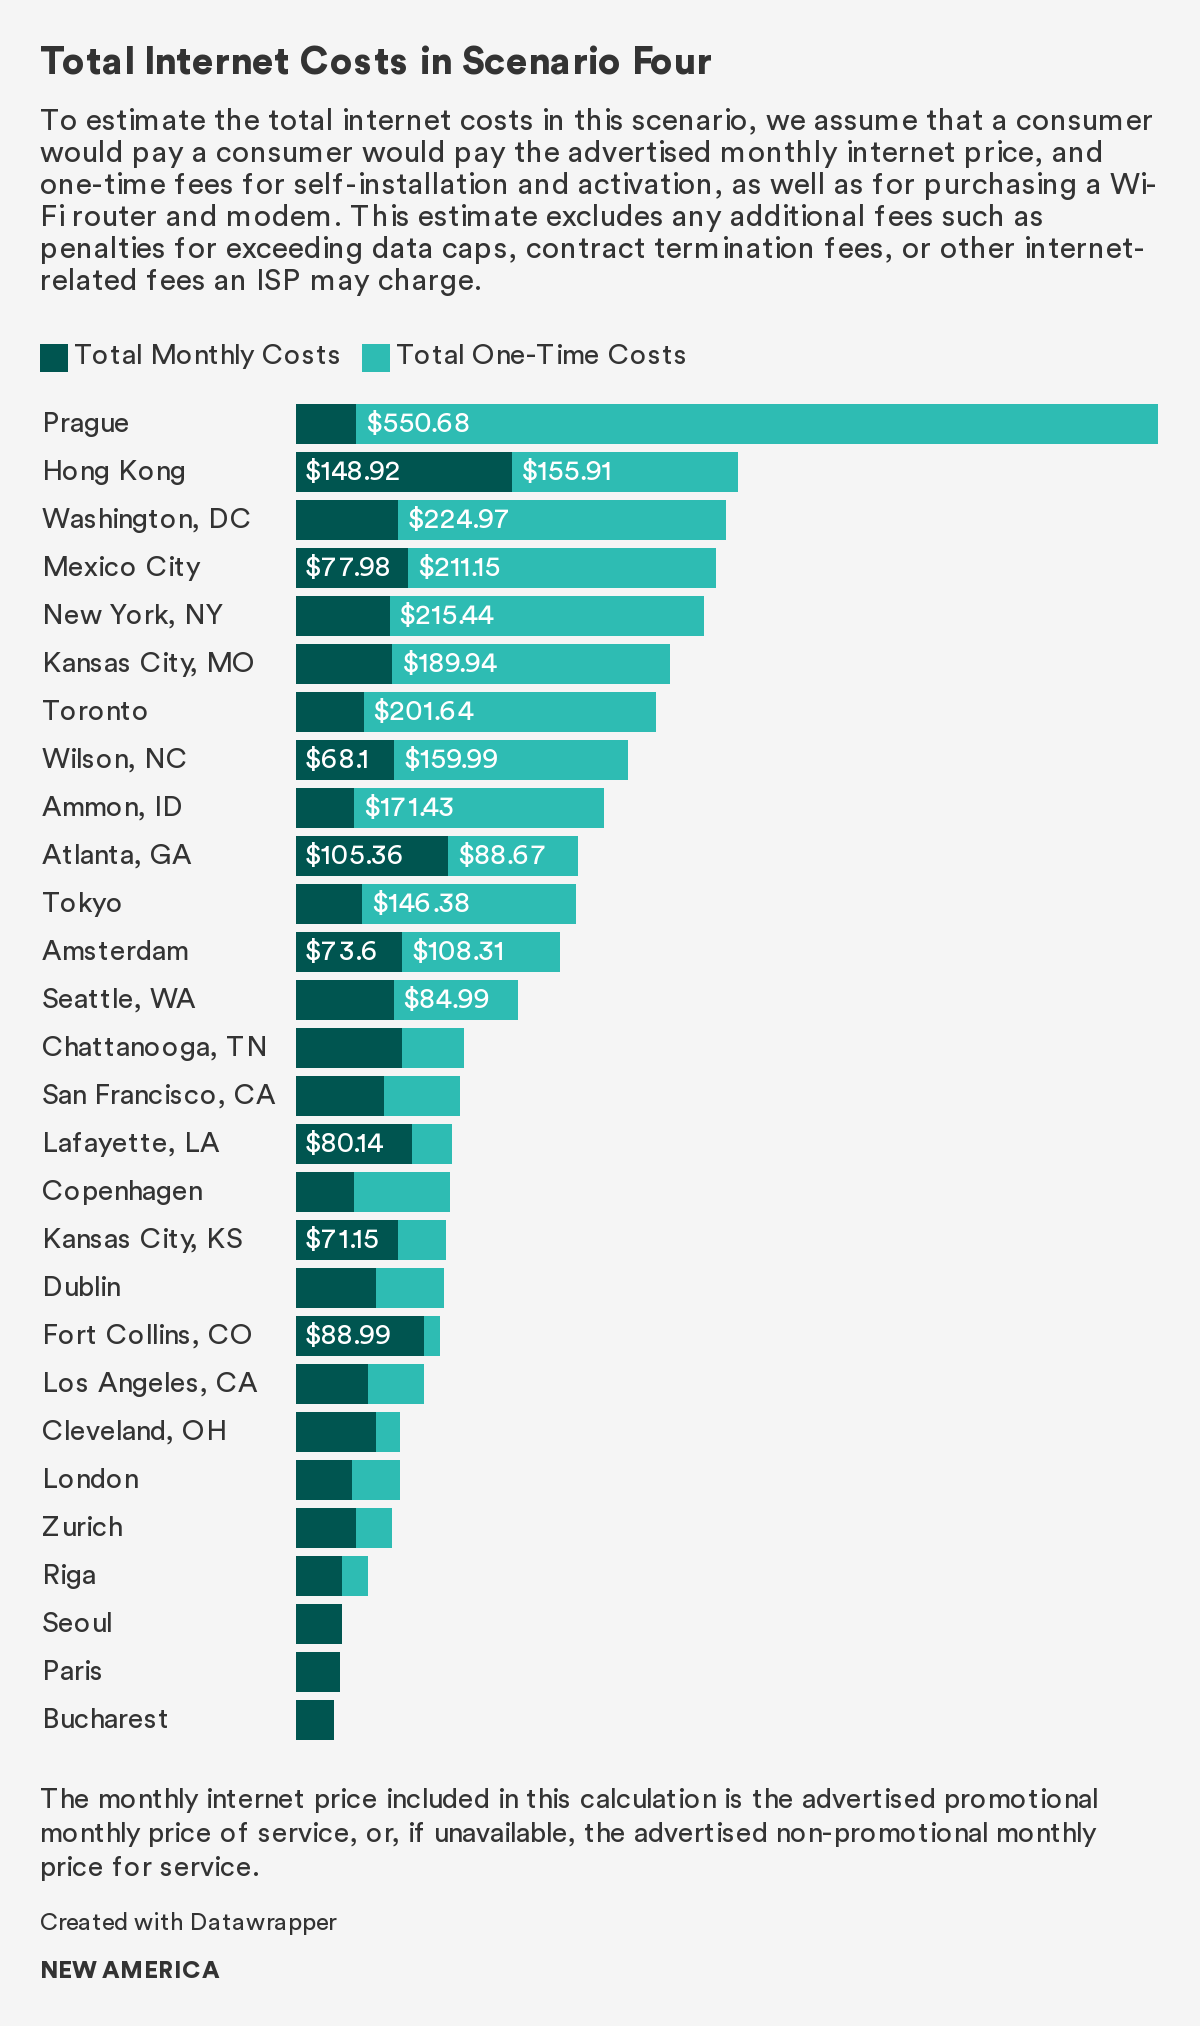
If consumers opt for self-installation, they pay an average one-time cost of $162.46 in the United States, $231.60 in Europe, and $302.30 in Asia.3 These one-time costs include self-installation, modem, and Wi-Fi purchase fees. Assuming consumers commit to a provider for a year, they pay $983.02 in the United States, $768.12 in Europe, and $1,051.22 in Asia for average total internet costs annually if they choose to purchase equipment and opt for self-installation. U.S. consumers in this scenario on average pay 22 percent more than European consumers.
Based on the cost differences across these four permutations of installation and equipment options, consumers in the United States and Asia generally benefit from cost savings if they choose to purchase equipment instead of renting it and if they choose self-installation instead of professional installation. ISPs, however, dictate whether these options are even available to consumers. Each ISP might not offer the option to purchase equipment or choose self-installation—and even when it is available, many consumers might choose the monthly rental option because it is cheaper in the short term than the large upfront cost of purchasing equipment. Nonetheless, though purchasing equipment may offer consumers long-term savings, there are also drawbacks, including that equipment offered by one provider may not be compatible with another provider’s network. We analyze each of these plan aspects independently in the “Focus on the Fees” section.
Prices Vary Across Network Technology
Monthly prices are consistently higher in the United States, regardless of network technology. Looking only at plans that relied on cable, DSL, and fiber technologies, we find that fiber is, on average, the most expensive internet option, followed by cable, then DSL.
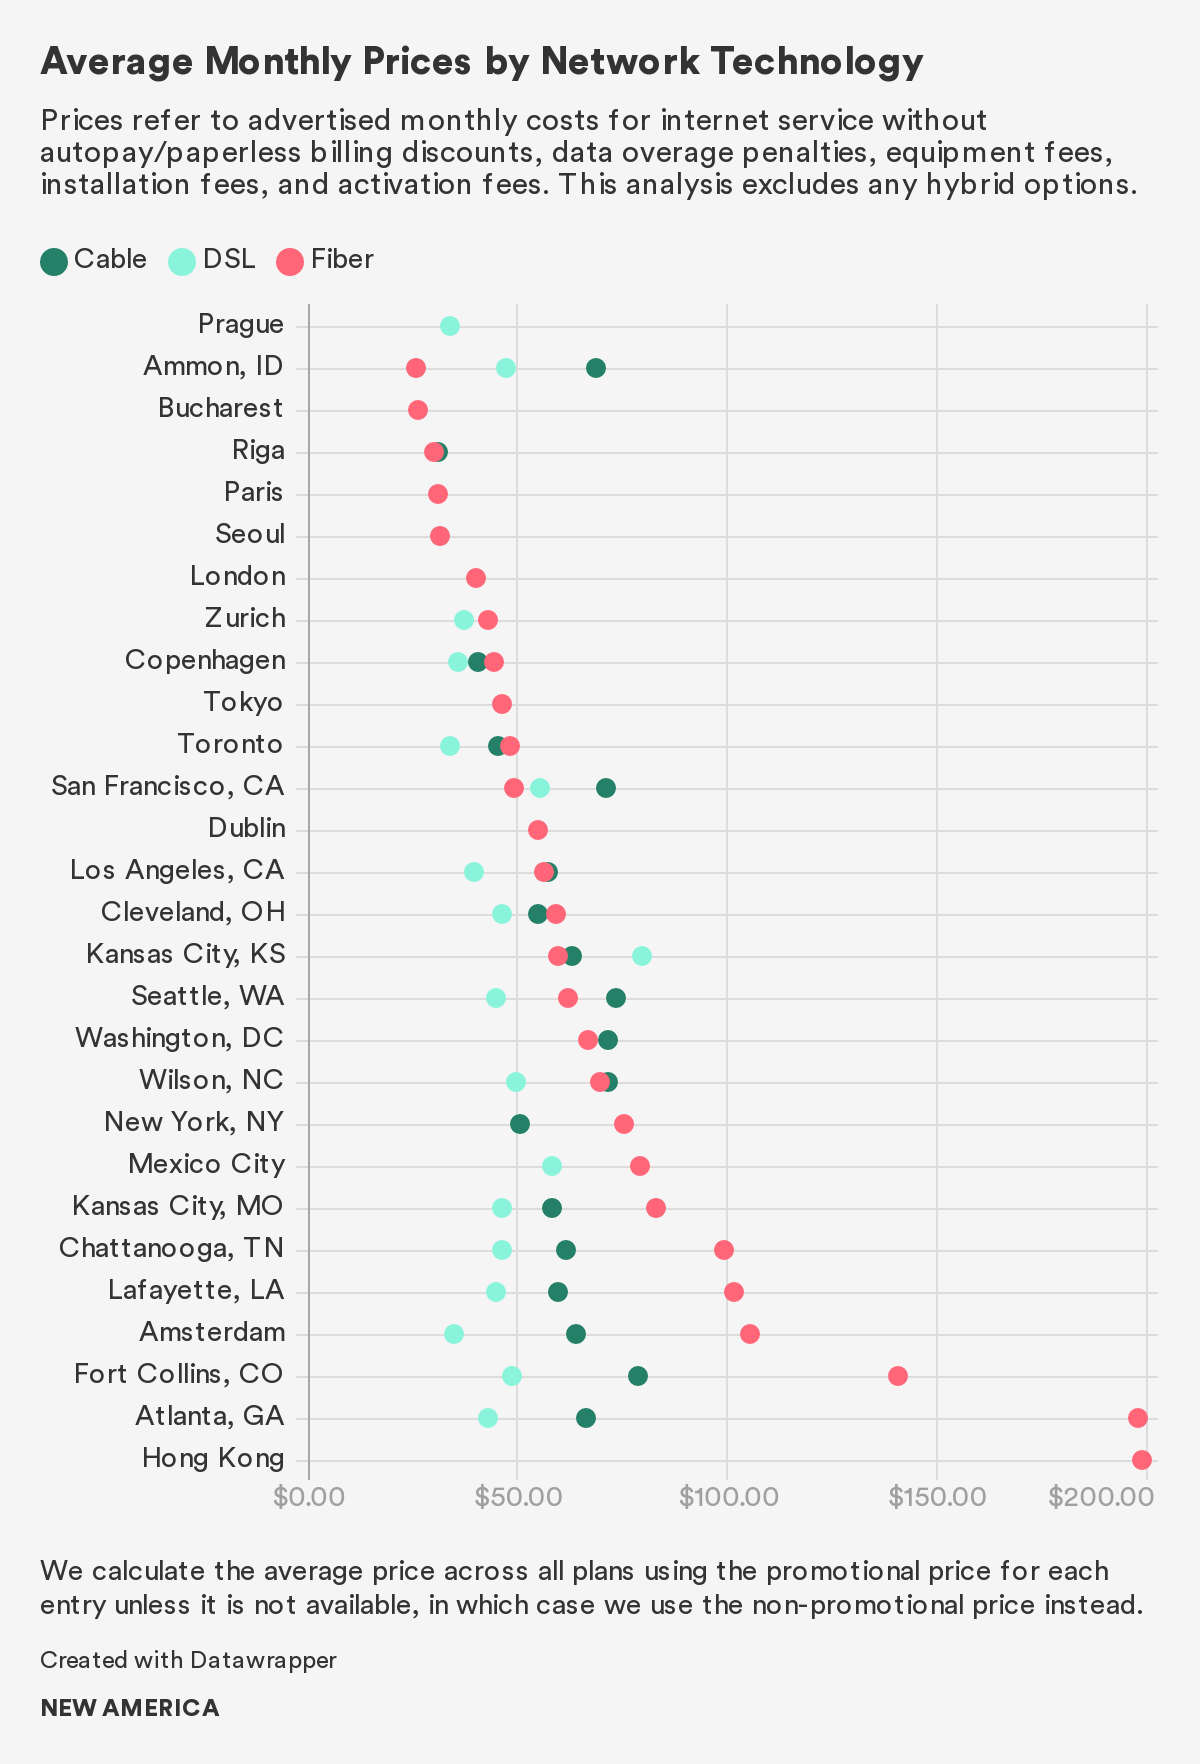
Advertised prices for DSL and cable plans are lower in Europe than in North America. The average price for a DSL plan in North America is $48.35, which is higher than the average price for DSL plans advertised in Europe, $35.53. The average price for DSL plans in the United States is $53.69, higher than both the North American and European averages. The average monthly price for a cable plan in North America is $60, compared to $41.45 in Europe. Cable plans advertised in the United States average $66.13 per month, again higher than the average price for cable plans in Europe. No cities in Asia within our dataset advertise DSL or cable plans.
Finally, for fiber-based plans, Europe has the most affordable average monthly price. The average European price for a fiber plan is $47.63, followed by Asia at $66.47. North America has the most expensive fiber-based plans with an average of $77.01. The average price for a fiber plan in the United States is $79.92, the third highest average for a fiber-based plan by country within our dataset. Bucharest advertises the lowest-priced fiber-based plans on average at $26.45, 44 percent of the average price for fiber plans in San Francisco, the U.S. city with the lowest average price for fiber-based service within our dataset.
These pricing trends generally align with penetration rates. Higher fiber prices appear to be associated with lower fiber penetration rates. As of 2019, fiber penetration in the United States falls below the average for countries that are part of the Organisation for Economic Co-operation and Development (OECD).4 Seven OECD countries within our dataset—Denmark, France, Japan, Latvia, Mexico, the Netherlands, and South Korea—have higher fiber penetration rates than the United States. South Korea has the highest penetration, with fiber accounting for 81.65 percent of all fixed broadband connections. Notably, countries where fiber makes up a greater percentage of fixed broadband advertise lower costs for fiber-based plans.5 In 2019, the OECD reported that cable accounted for 33.6 percent of all fixed broadband connections, and DSL-based fixed broadband service accounted for 35.0 percent.6 These penetration rates provide a general idea of how market shares are split among fiber, cable, and DSL options. We might expect prices for fiber-based plans to fall as more options for fiber-based plans become available, but researchers have highlighted how in many areas, providers have upgraded their infrastructure only if they face local competition.7
Advertised Prices are Highest in the United States
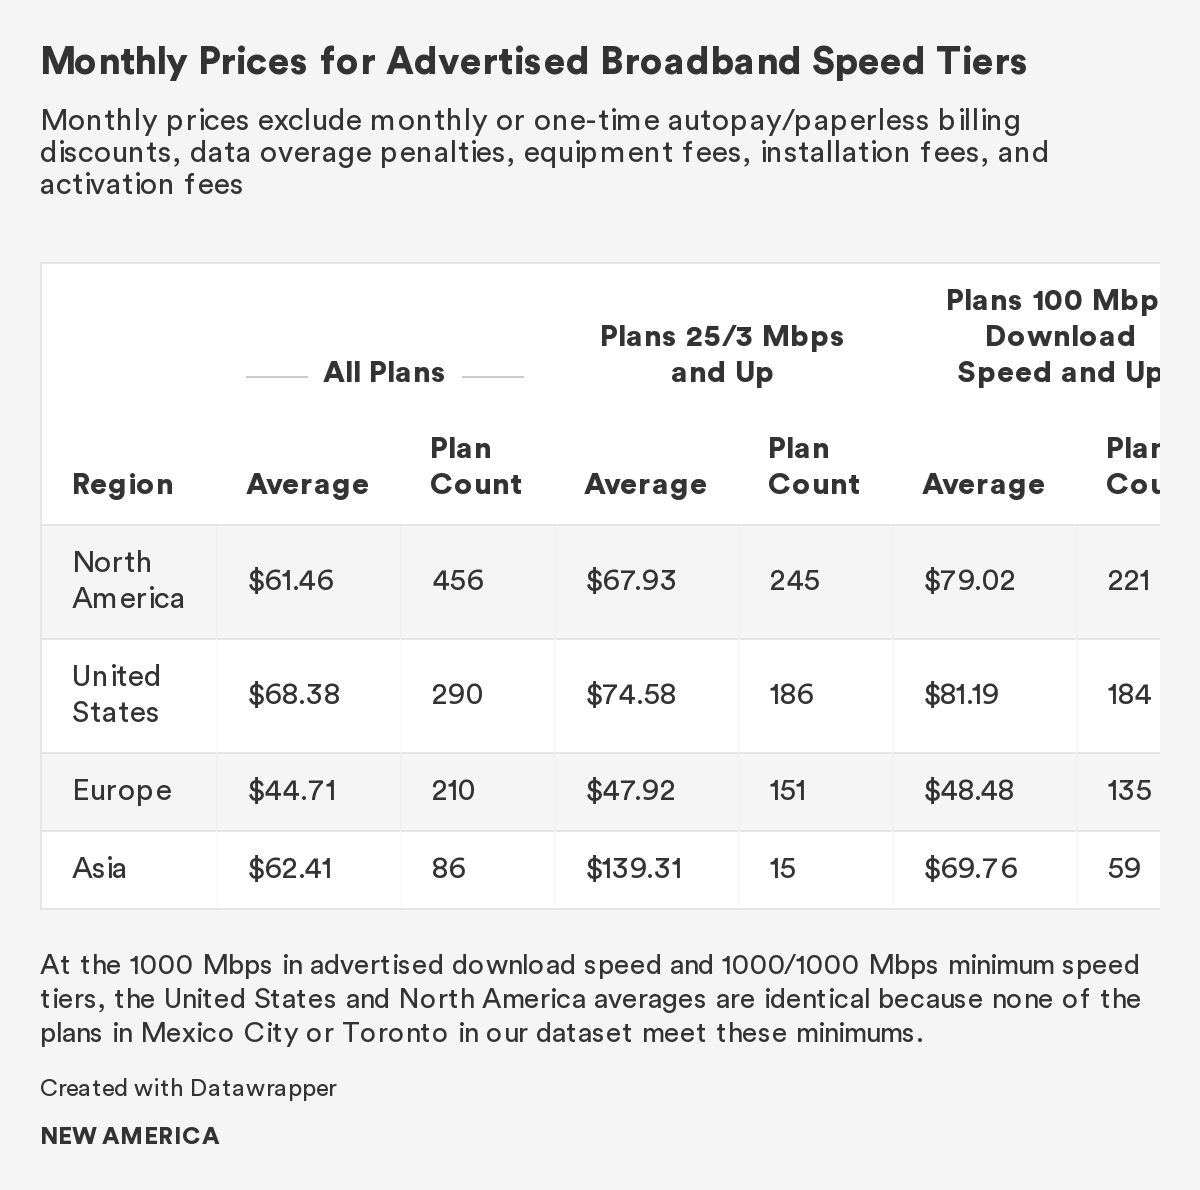
U.S. consumers pay the highest average costs out of any region in our dataset. The average monthly price in the United States is $68.38—higher than the average price for all of North America at $61.46, Europe at $44.71, and Asia at $62.41.8 The median price in the United States is $50, higher than the median price for all of North America at $49.99, Asia at $46.25, and Europe at $38.85.
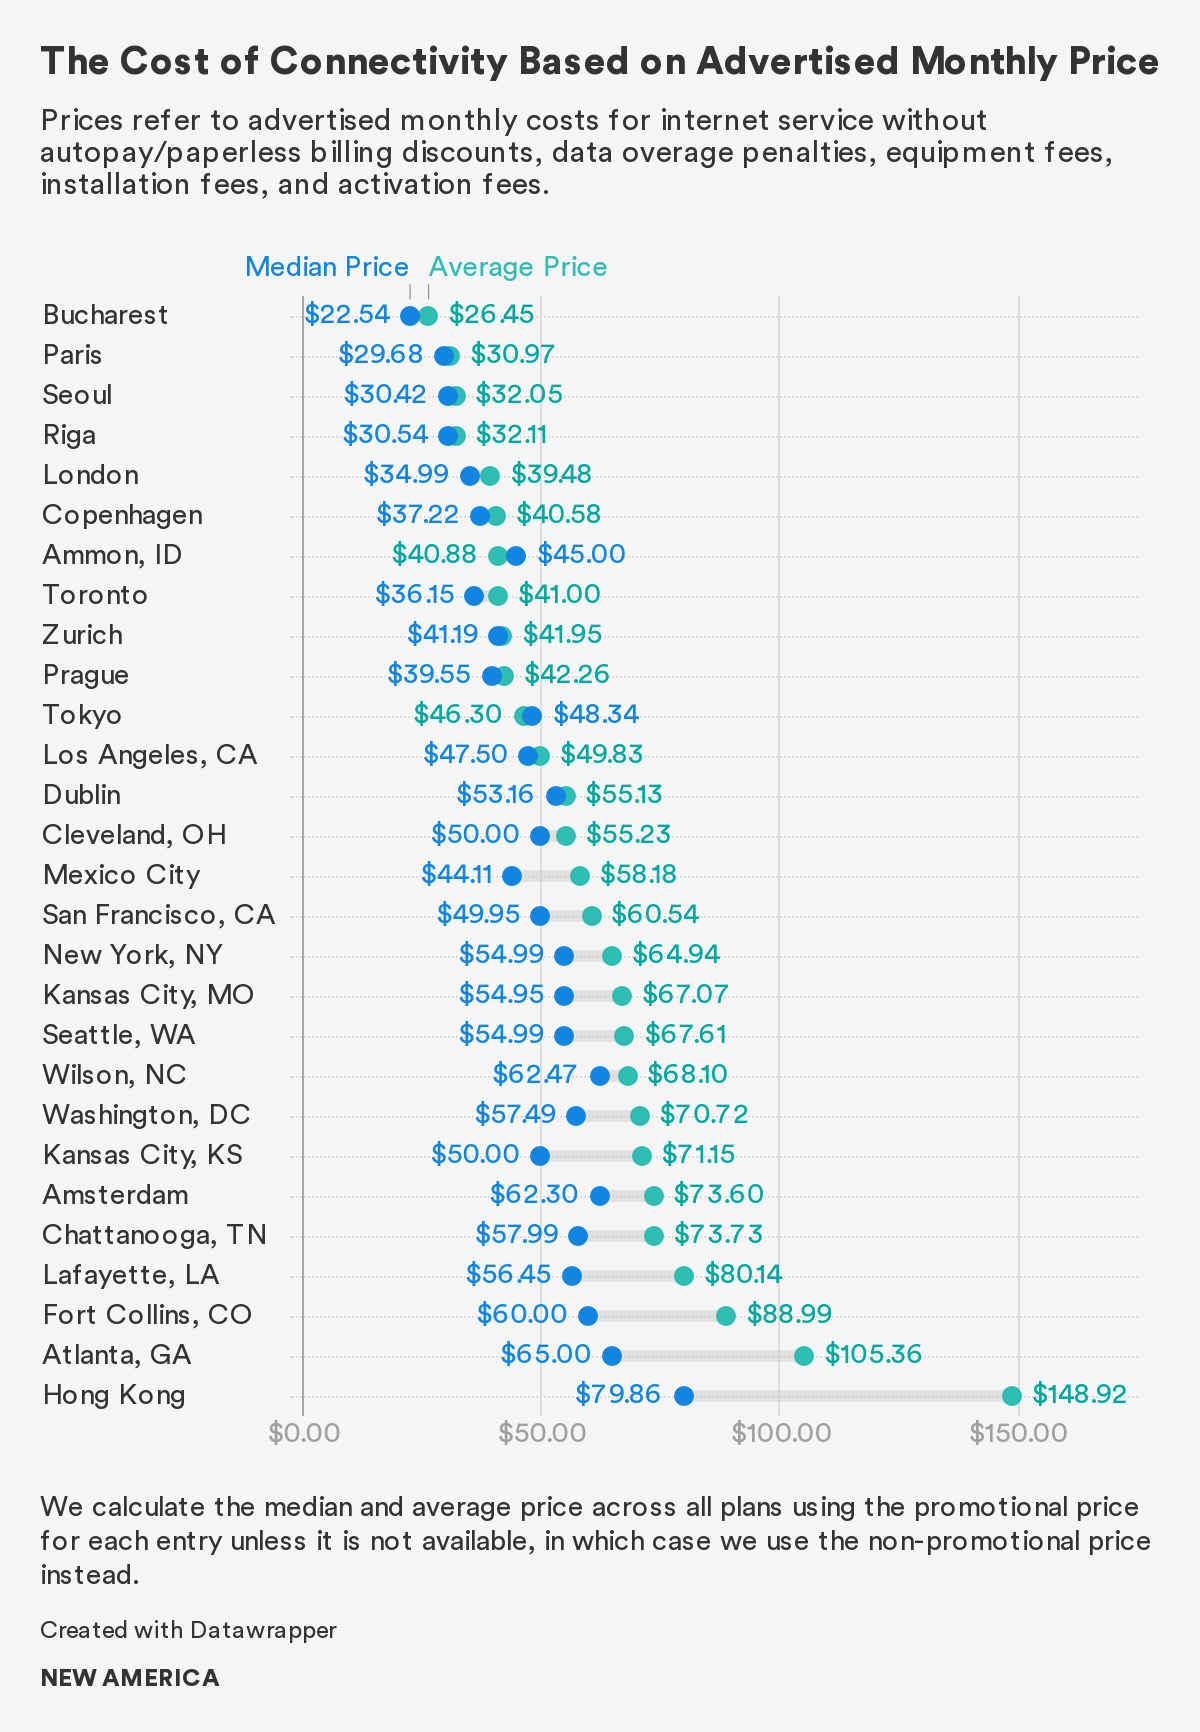
Based on our dataset, the most affordable average monthly prices are located in Asian and European cities. Just three U.S. cities rank in the top half of cities when sorted by average monthly costs. The most affordable U.S. city—Ammon, Idaho—ranks seventh. The overwhelming majority of the U.S. cities in our dataset rank in the bottom half for average monthly costs.
Notably, our study’s average U.S. price is higher than the $50 average found in the recent Cable.co.uk study, most likely because of the difference in sample sizes. The Cable.co.uk study only includes 27 U.S. internet plans, whereas ours looks at 290. However, our study’s U.S. median, $50, is lower than the $66 median in a recent Wall Street Journal study.9 We can attribute this discrepancy to a difference in methodology: To calculate this number, the Wall Street Journal looked at reported costs from consumers’ bills, and included "internet-related fees" like equipment costs, bundled plans, and standalone internet plans, and a wider geographic range. In an attempt to compare closer equivalents, we combine our median price with the median monthly equipment rental fees. The median price and the median Wi-Fi router rental fee, $5, add up to $55, and the median monthly price and the median modem rental fee, $13, add up to $63. If we compare the latter number with the Wall Street Journal’s median price finding, our numbers are only $3 apart.
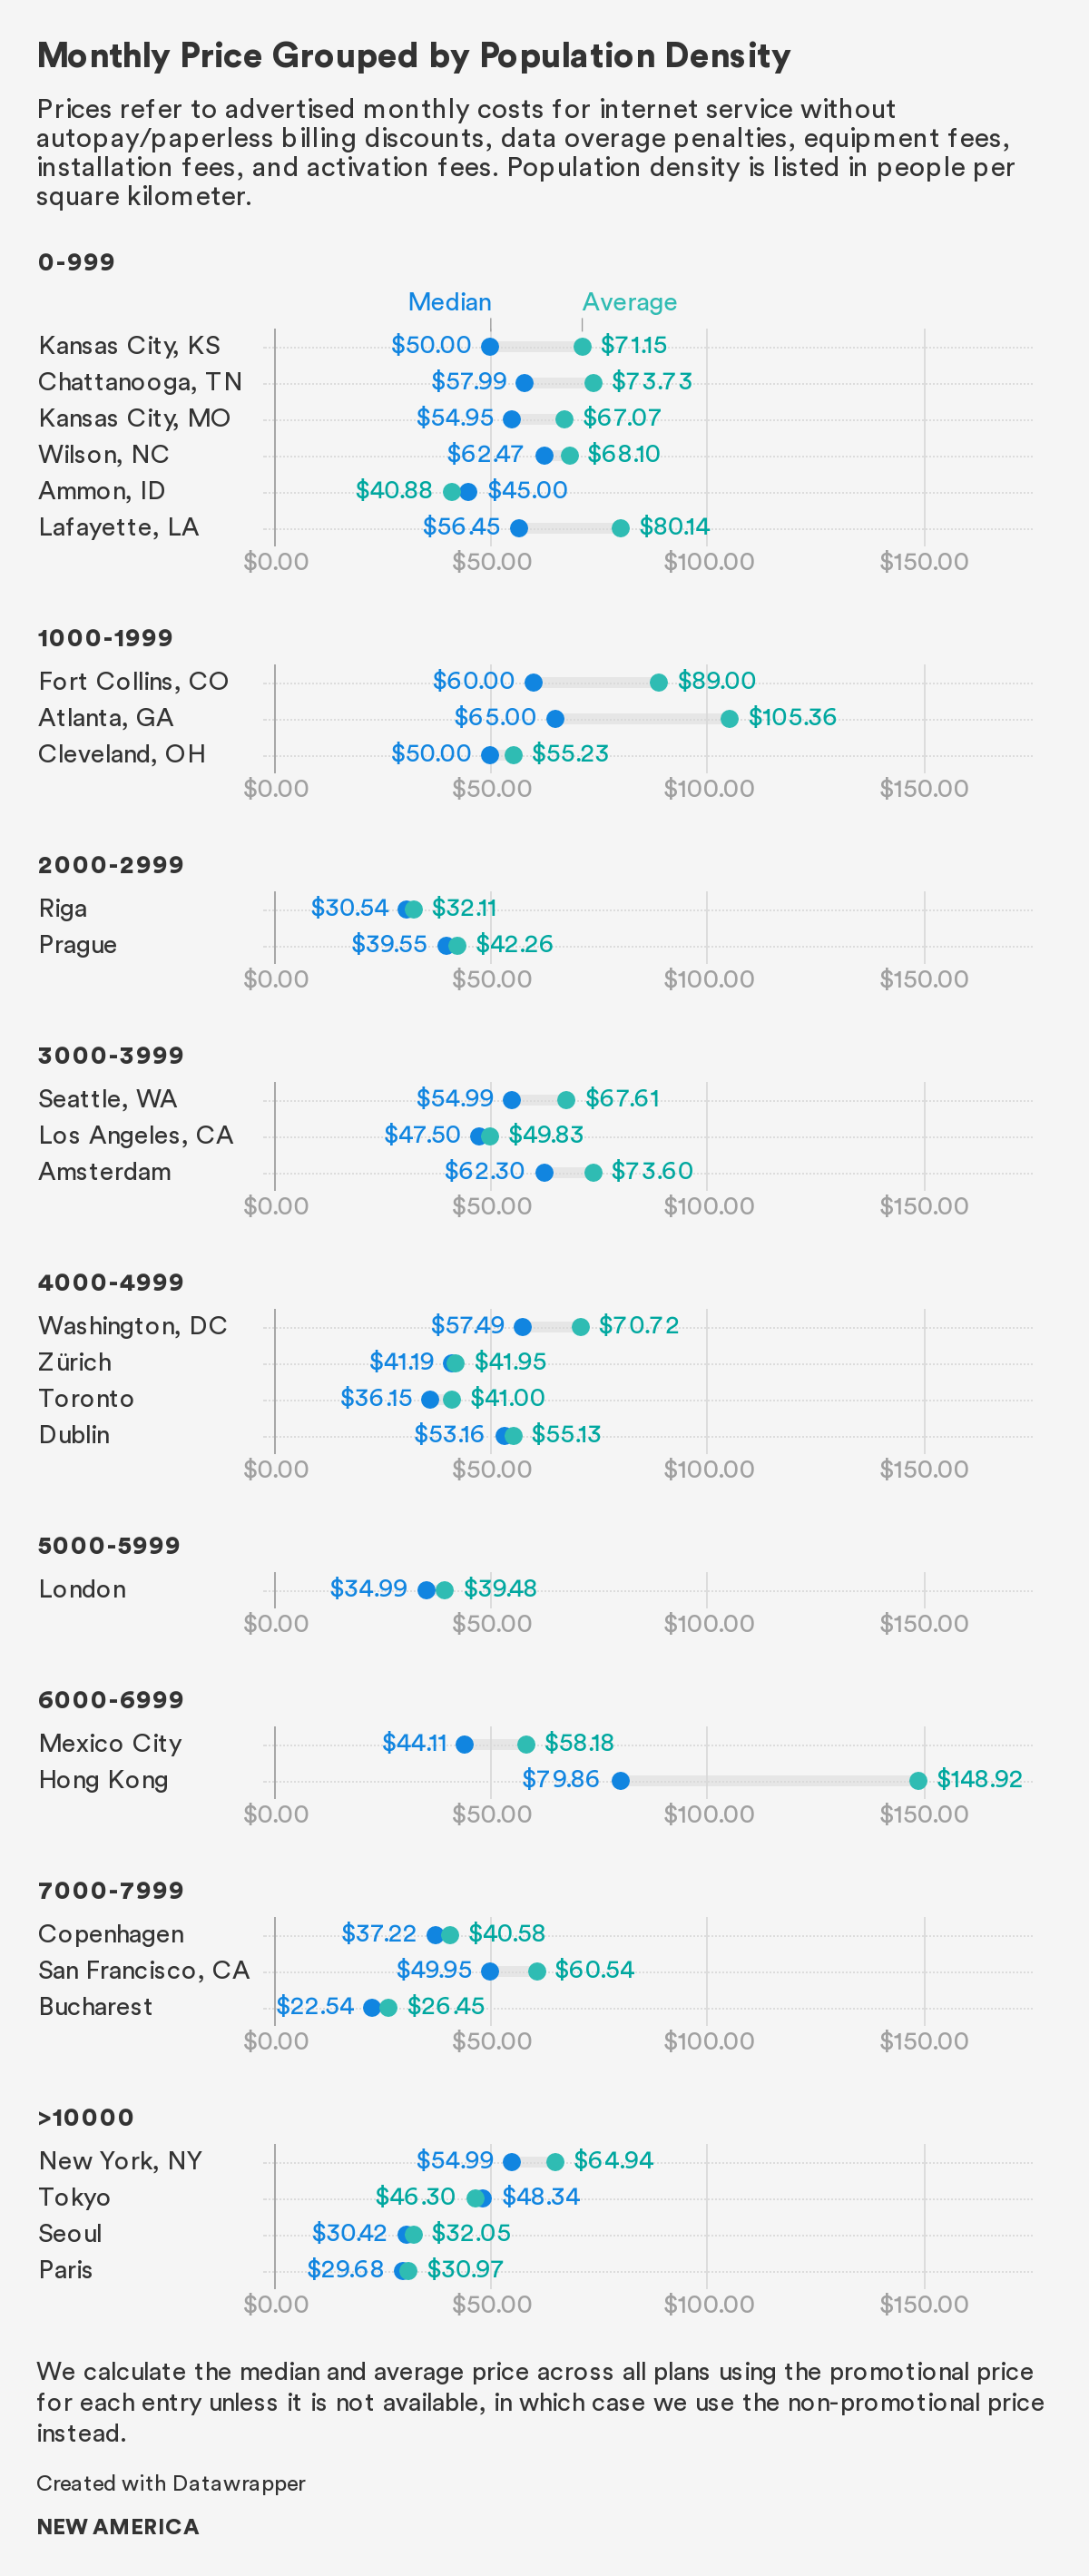
When we control for differences in population densities, we find that cities in the United States generally offer more expensive options compared to cities abroad. We compare cities within population density ranges in increments of 1,000 people per square kilometer, up until 10,000 people per square kilometer—at which point, we group the four cities that exceed this population density (New York, Tokyo, Paris, and Seoul) together. As the chart reveals, Dublin, Toronto, Washington, D.C., and Zurich all have similar population densities, but the average price is notably higher in Washington, D.C. Similarly, Bucharest, Copenhagen, and San Francisco have comparable population densities, but San Francisco’s median and average prices are the highest.10
Advertised Speeds are Highest in Asia
Comparing overall averages, Asian markets have the fastest advertised download and upload speeds, followed by those in the United States, then Europe.
Asian markets have the fastest average advertised download speeds at 713.43 Mbps. By comparison, the U.S. average is 482.77 Mbps, whereas the overall average for all North American cities in our dataset is 336.80 Mbps. The U.S. median is significantly slower, however; at 150 Mbps, it indicates that some U.S. consumers have slower advertised download speeds than the average might suggest. In fact, because the dataset of advertised download speeds is skewed to the right, the median speeds are more representative of the majority of plans than the average in this particular scenario. The U.S. median and average are faster than Europe’s, which are 100 and 230.72 Mbps respectively.
Asia also leads on advertised upload speeds at 713.33 Mbps.11 By comparison, the U.S. average is 354.02 Mbps, which is higher than the average for all North American cities in our dataset, 249.82 Mbps. The U.S. median, however, is 15 Mbps, which indicates that some U.S. consumers have slower advertised upload speeds than the average might suggest. Because the dataset of advertised upload speeds is skewed to the right, the median speeds are more representative of the majority of plans than the average in this particular scenario. The U.S. average is faster than Europe’s at 138.29 Mbps. By median advertised upload speeds, Asia leads with 500 Mbps, followed by Europe at 40 Mbps, and the United States at 15 Mbps.
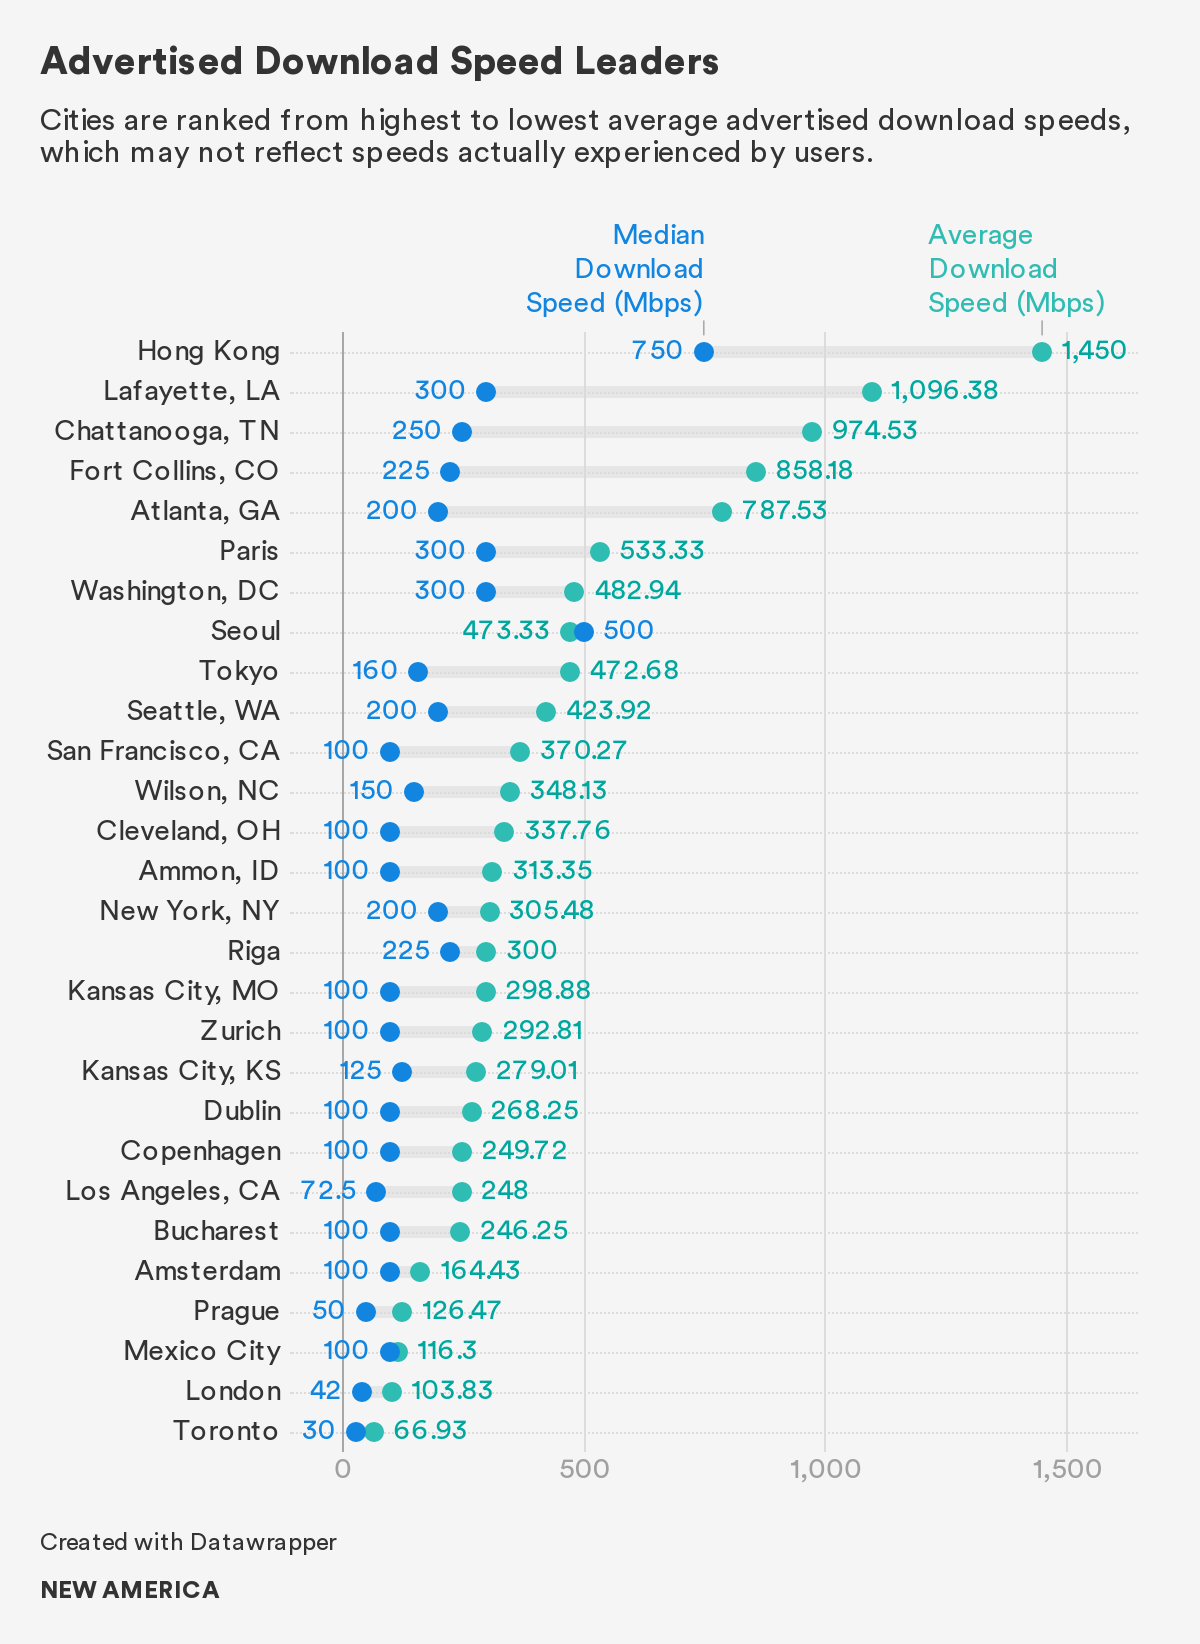
Ranking cities by average advertised download and upload speeds shows that while an international city leads the board on download speed, some U.S. cities are not far behind the fastest download speeds advertised by providers in international cities—and on average advertised upload speeds, a U.S. city leads the board. While Hong Kong leads the board on advertised download speed with an average of 1,450 Mbps, the next four cities in the top five are all U.S. cities: Lafayette, La., Chattanooga, Tenn., Fort Collins, Colo., and Atlanta. The former three U.S. cities all offer municipal network options. The fastest of the three, Lafayette, La., however, comes in at an average advertised download speed of 1096.38 Mbps behind Hong Kong, nearly 25 percent less.
While Hong Kong leads the board on advertised download speed with an average of 1,450 Mbps, the next four cities in the top five are all U.S. cities: Lafayette, La., Chattanooga, Tenn., Fort Collins, Colo., and Atlanta.
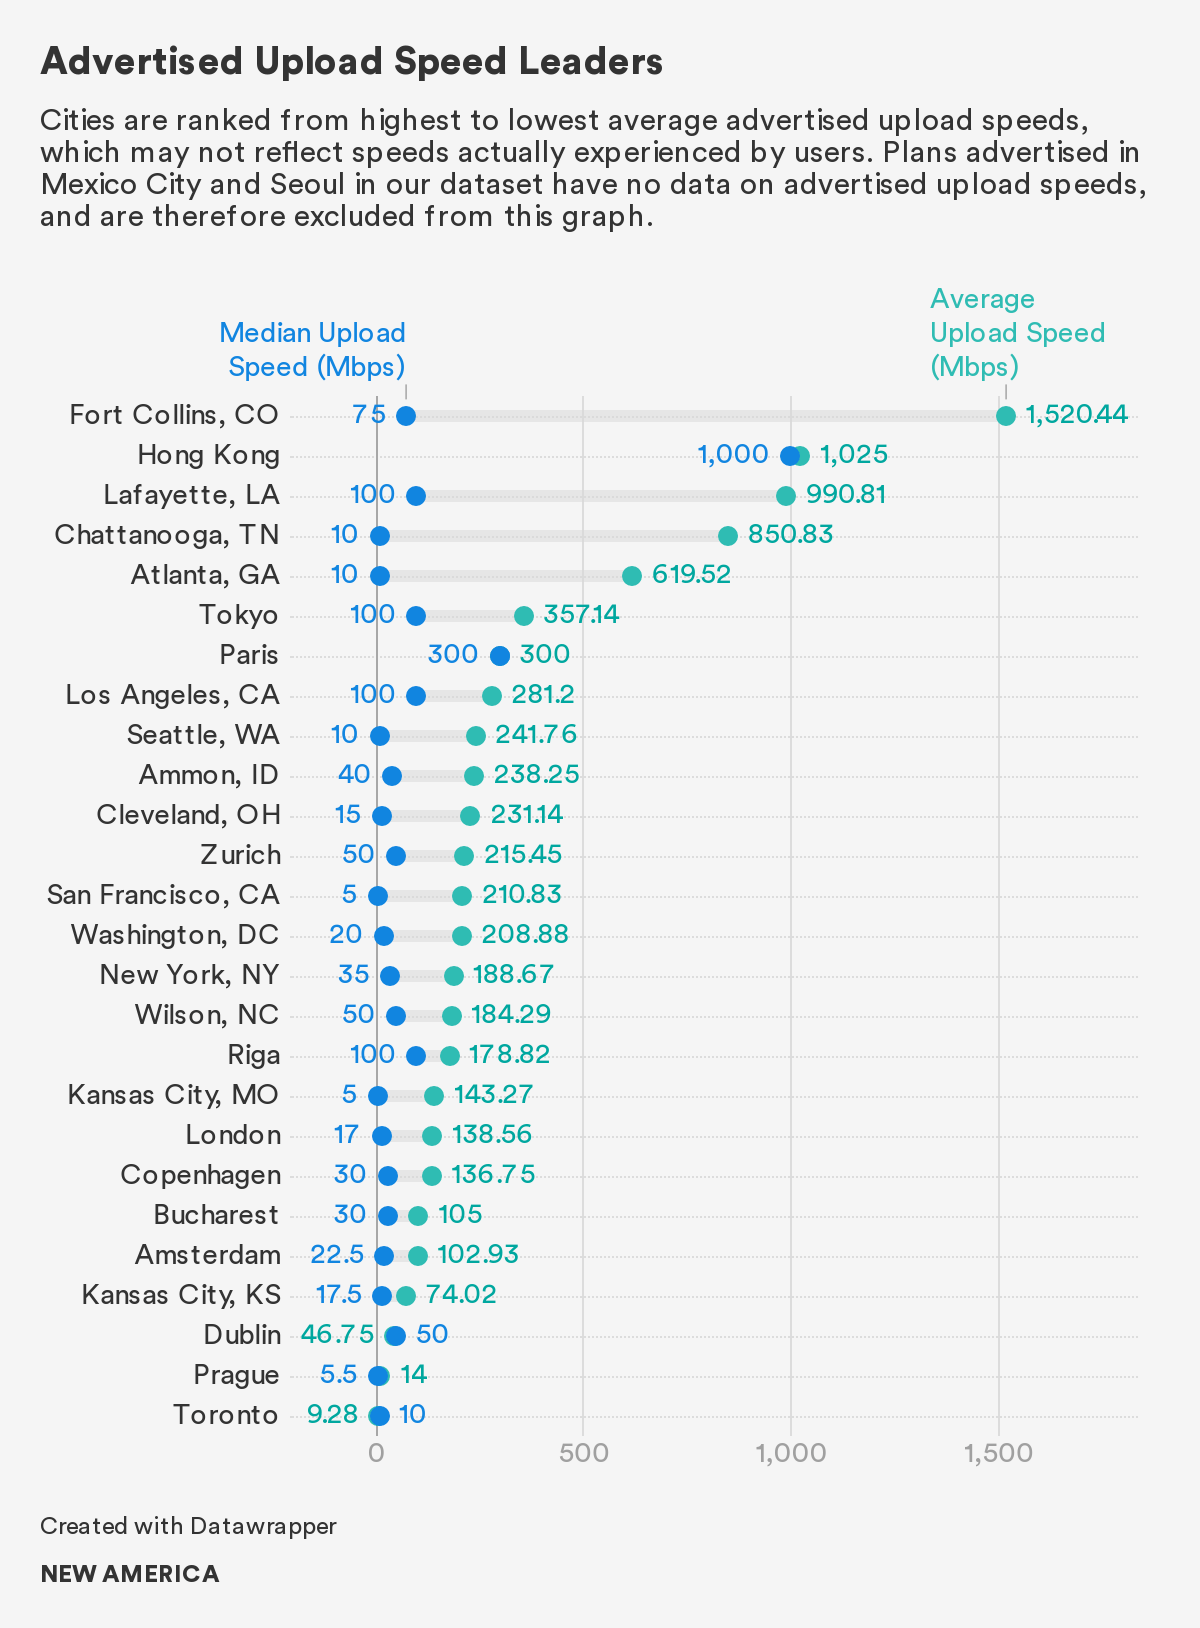
On advertised upload speed, Fort Collins leads the board with an average speed of 1520.44 Mbps, 496.44 Mbps more than Hong Kong. After Hong Kong, Lafayette, La., Chattanooga, Tenn., and Atlanta round up the top five in average advertised upload speeds.
Asia Leads on Cost-for-Speed Value
In this section, we standardize for differences in advertised speeds by examining the relationship between cost and advertised download speed. We take the average monthly price divided by average advertised download speed to calculate the average price per Mbps that ISPs advertise in each city. This analysis is our best approximation of cost at comparable speeds, but it is limited by the reality that advertisements may not reflect the actual price that a consumer pays or the speeds that they experience.12 We are also unable to standardize for other variables, including ancillary fees, data caps, and upload speeds.
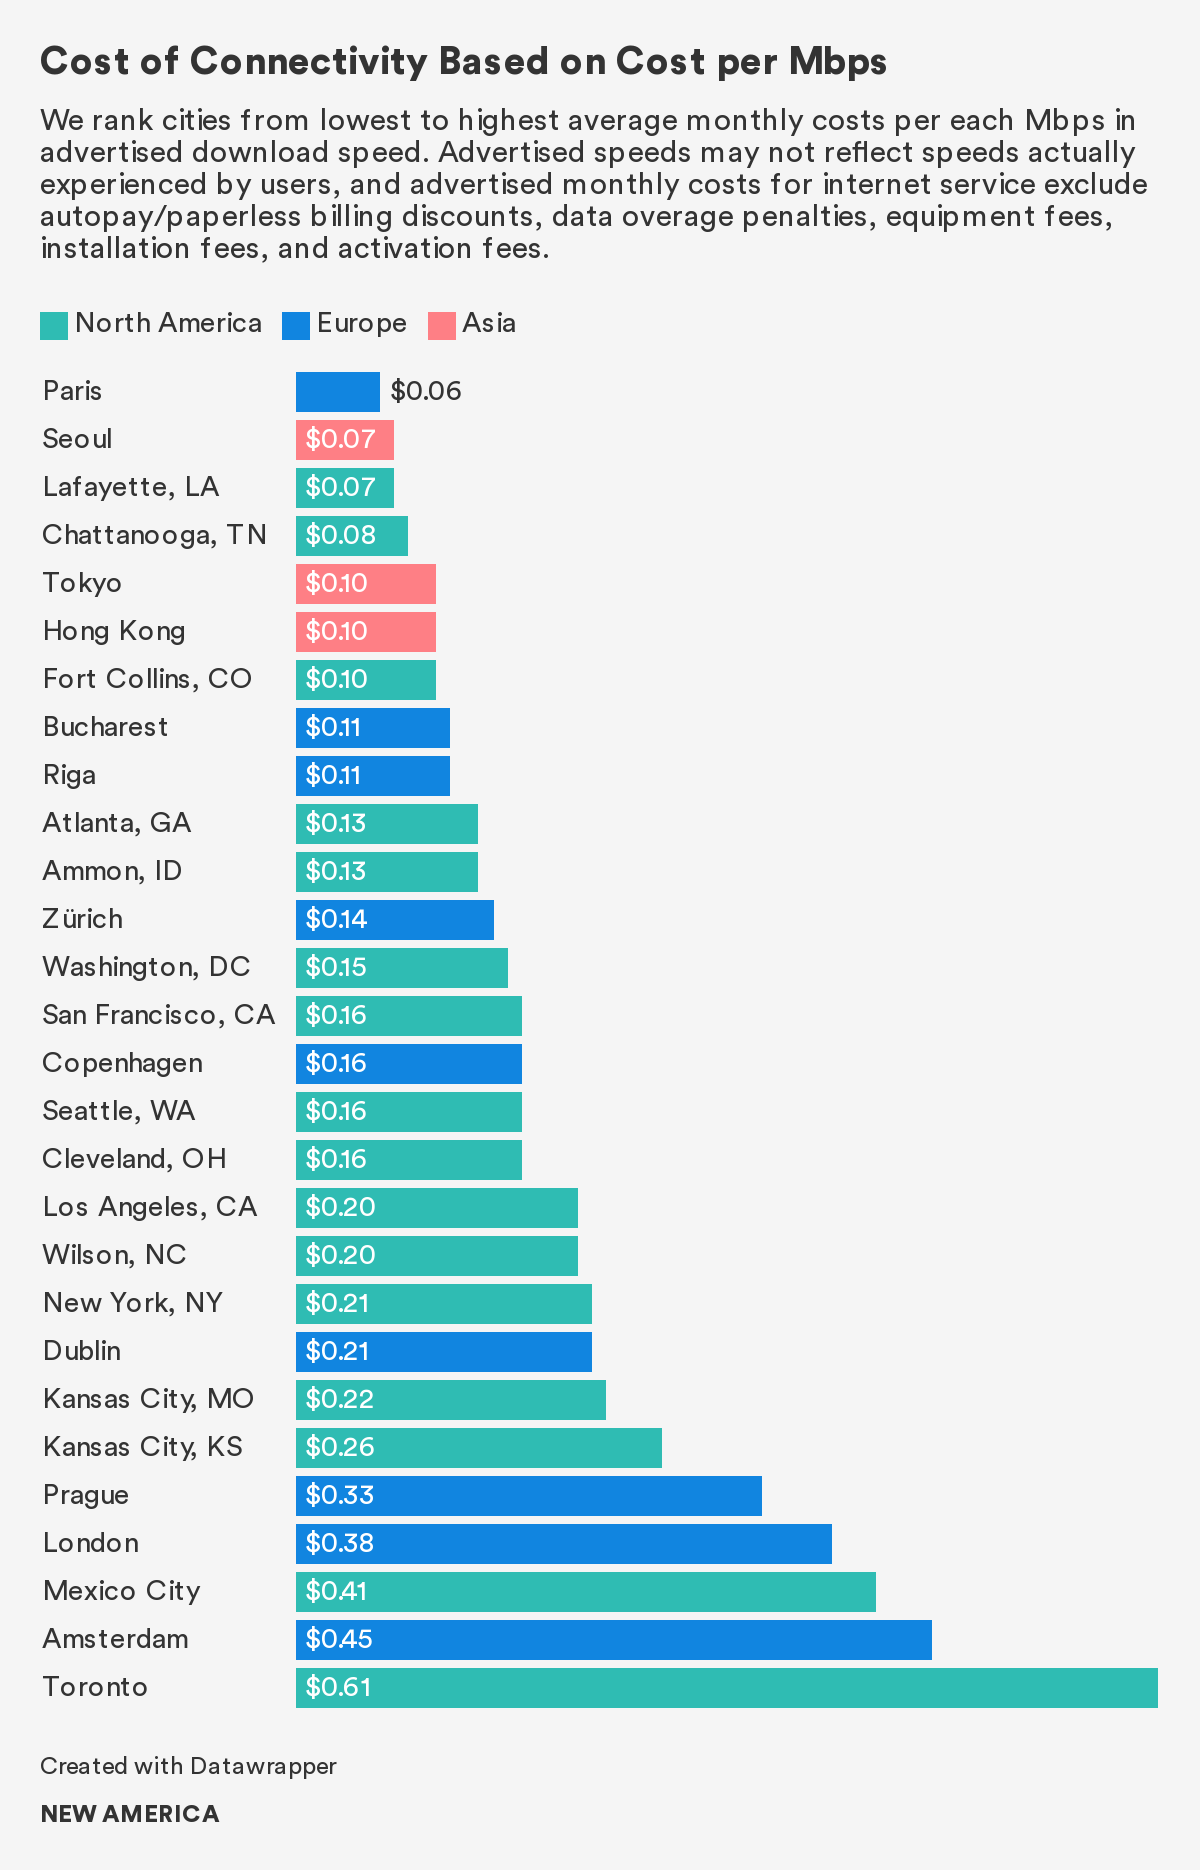
Examining the relationship between monthly prices and speeds based on advertised metrics reveals that Asian providers advertise the lowest costs for comparable speed. U.S. consumers pay $0.14 on average for each Mbps in advertised download speed, which is less than the overall North American average at $0.18 and the European average at $0.19. Consumers in Asia, however, get the most value by far—they pay just $0.09 for each Mbps in advertised download speed on average.
Standardizing for price differences across advertised download speeds shows that Lafayette, La., offers as much value on average as Seoul. Chattanooga, Tenn. is only a penny behind Lafayette and Seoul by this metric. By the same metric, Fort Collins, Colo. is on par with both Tokyo and Hong Kong.
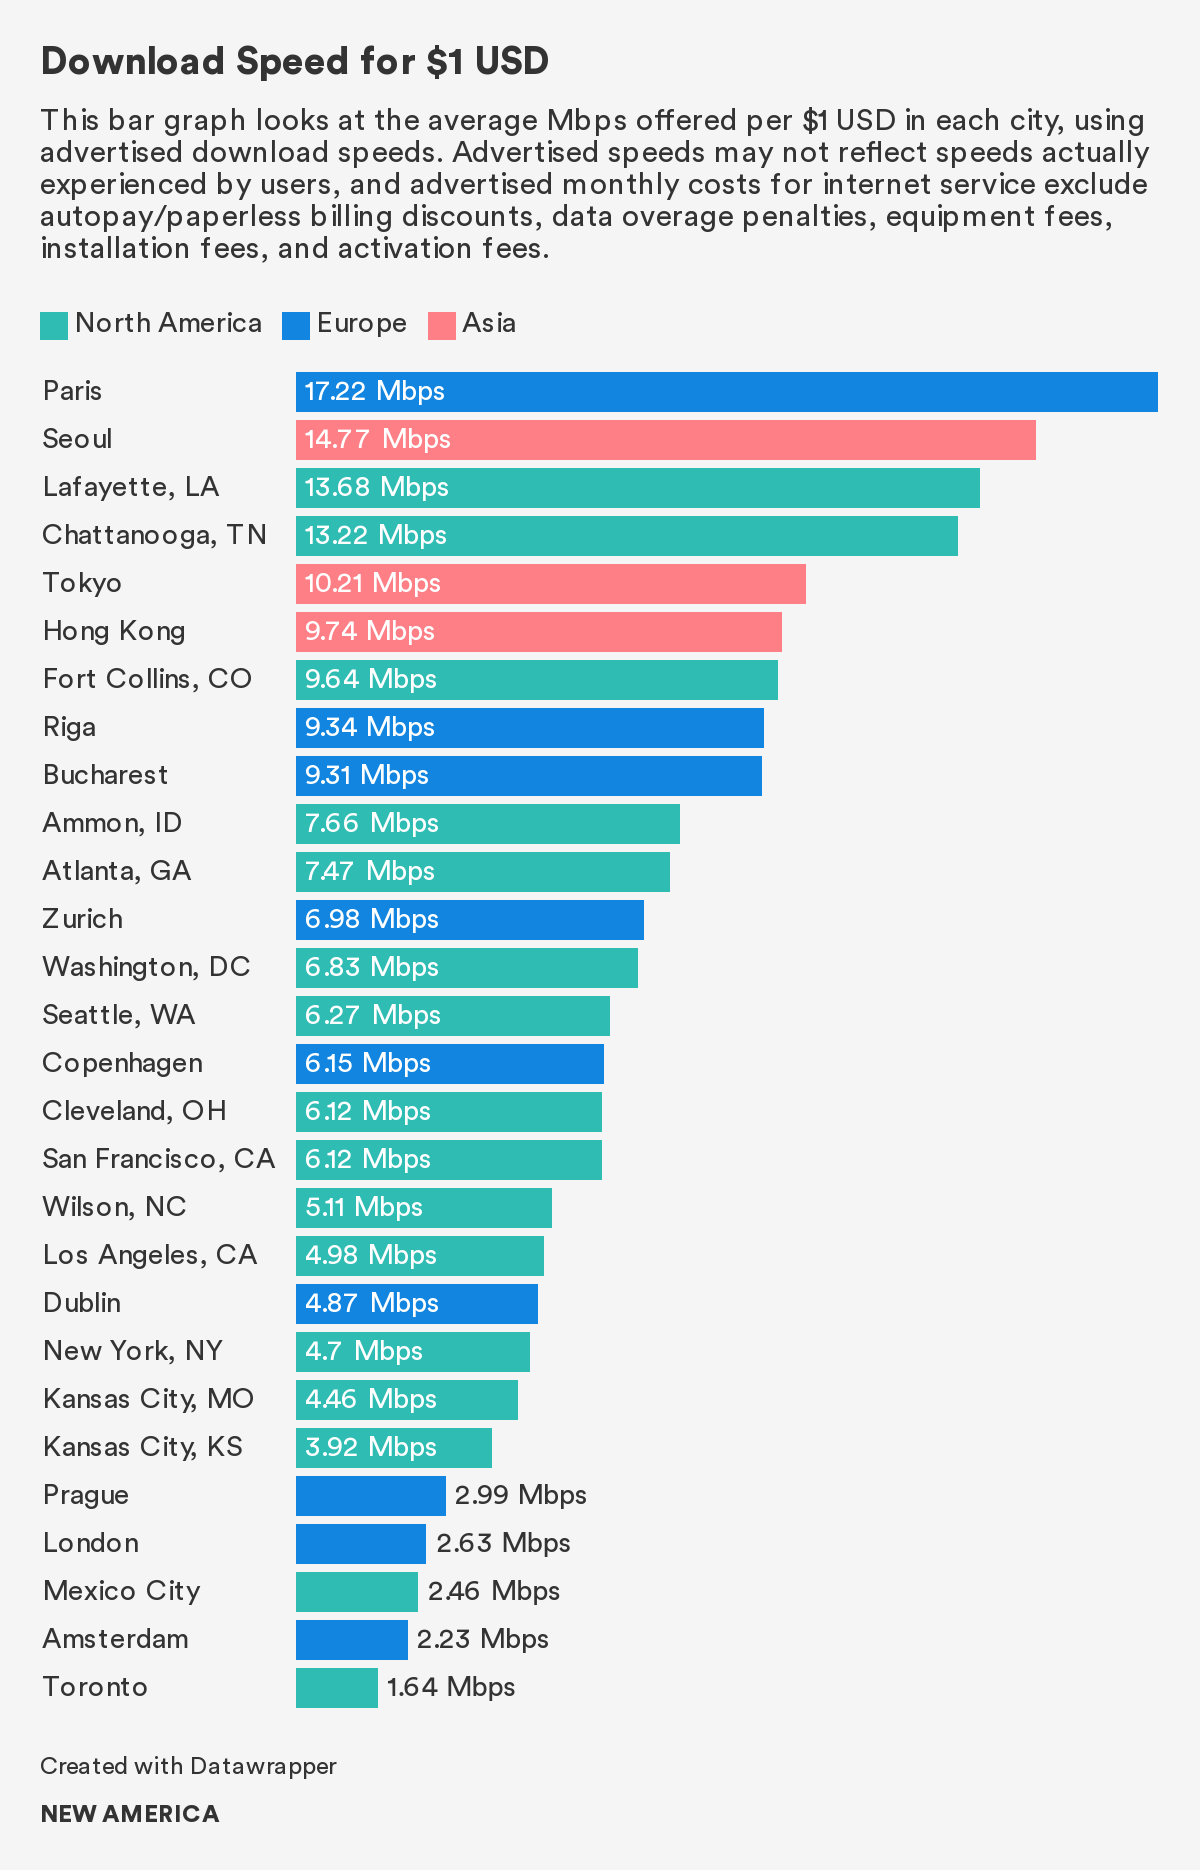
Looking at the average Mbps offered per $1 USD using advertised download speeds in each city, Paris and Seoul lead the board at 17.22 and 14.77 Mbps respectively. Chattanooga, Tenn. and Lafayette, La. are close behind, however, and Tokyo rounds out the top five speed leaders. That Chattanooga and Lafayette are so close to Paris and Seoul in terms of average download speeds advertised for $1 demonstrates the value that municipal networks can bring to communities.
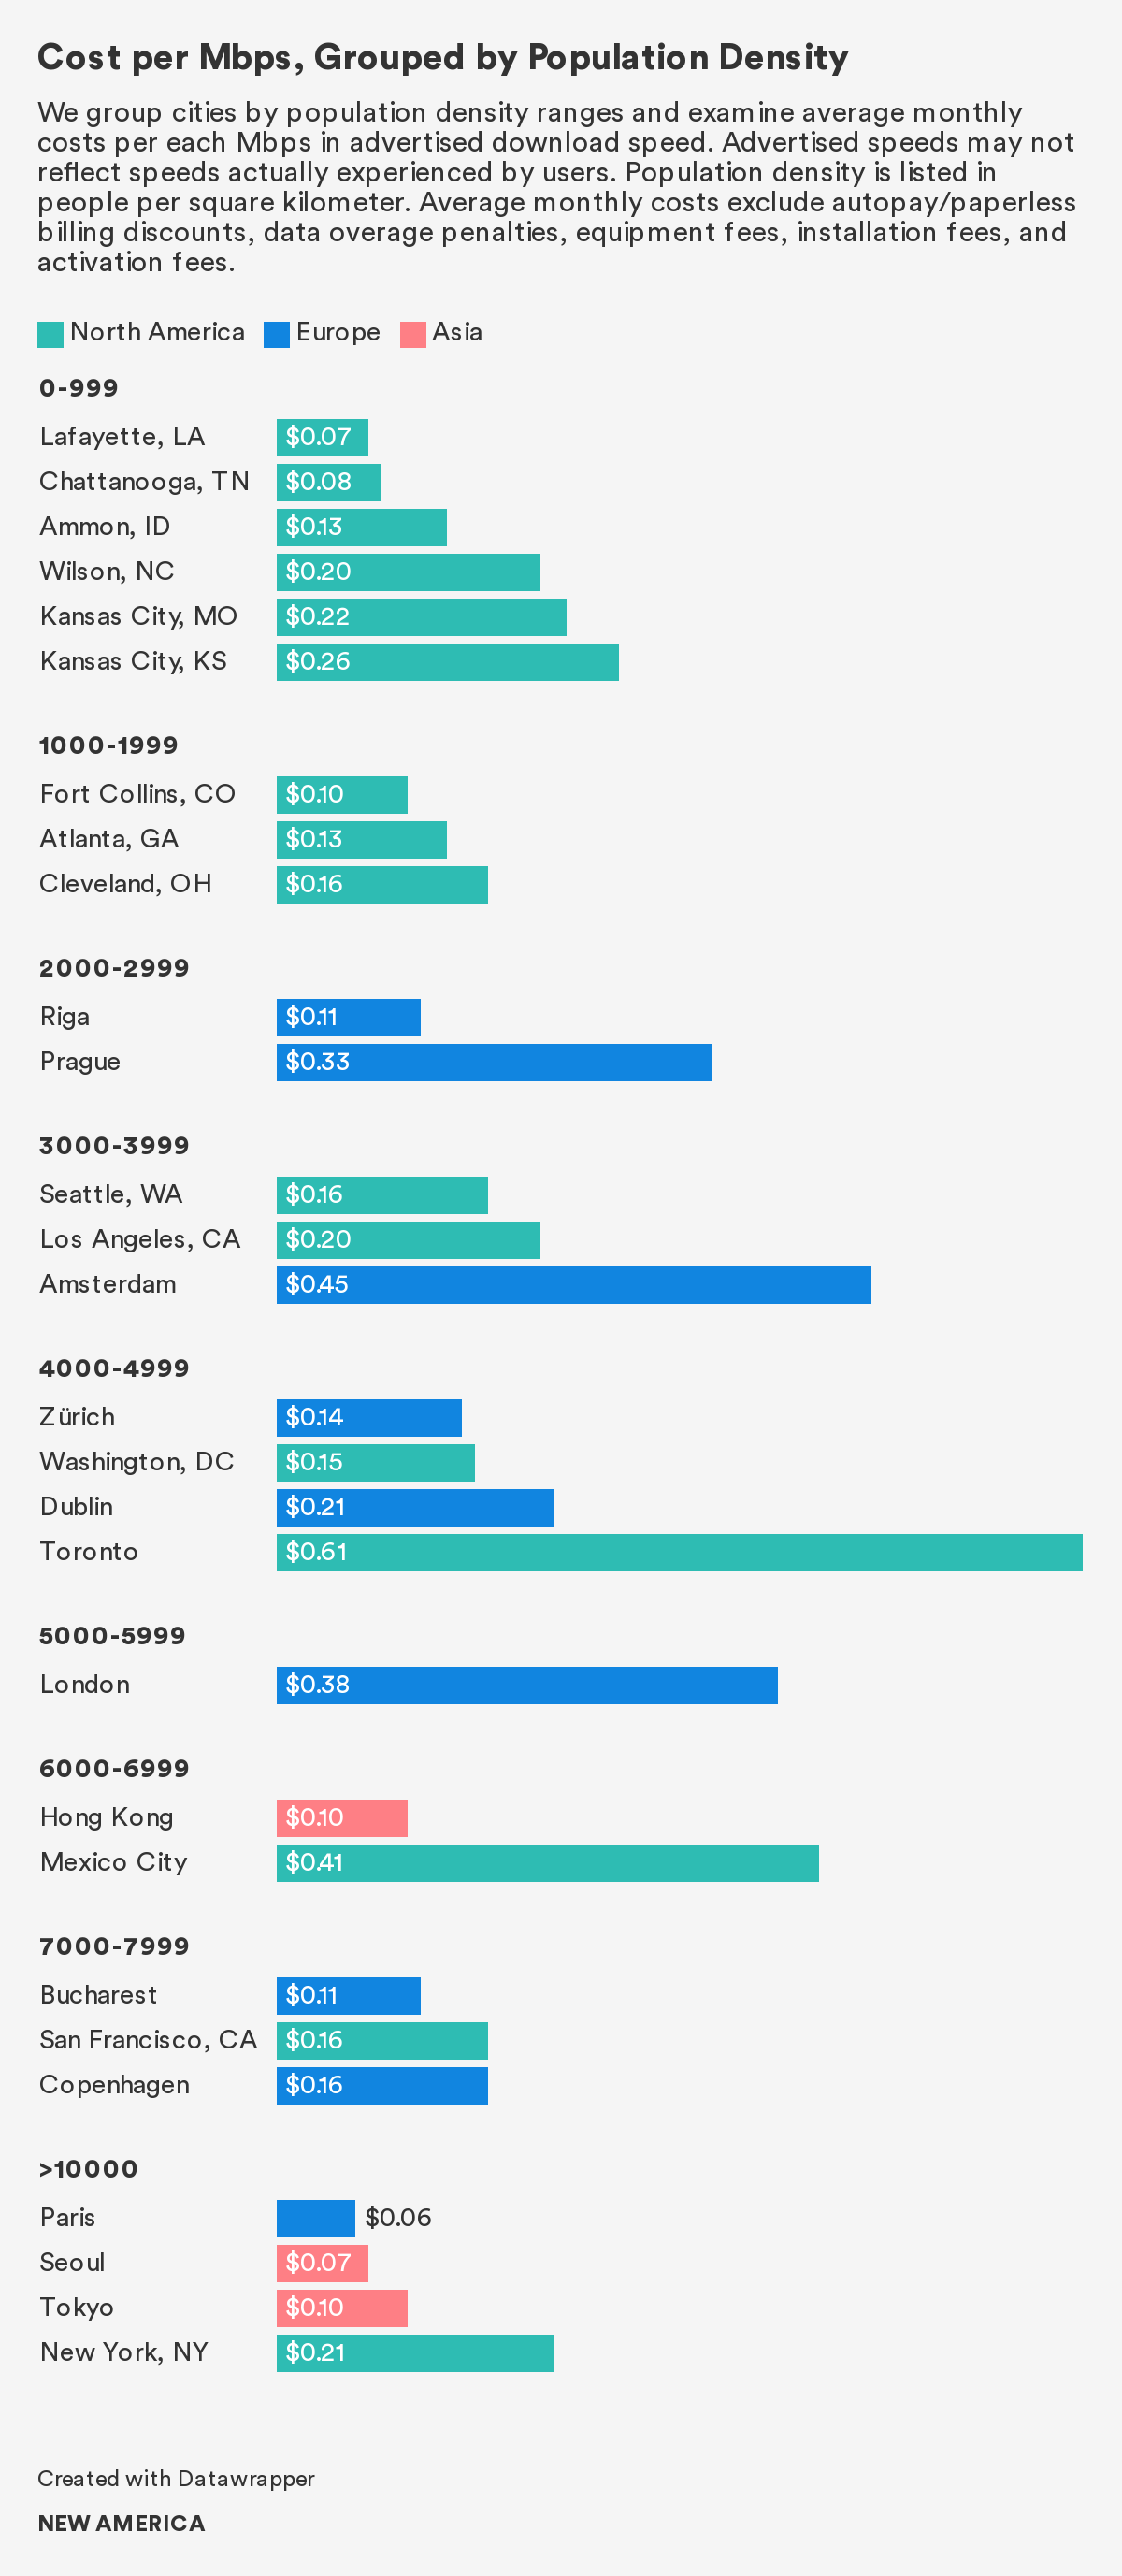
However, standardizing costs and speeds while also factoring in differences in population density reveals that U.S. providers on average advertise similar prices for similar speeds as European providers. For example, Washington, D.C. is almost on par with Zurich, with only a penny’s difference in average advertised costs per Mbps between the two comparably dense cities. Similarly, Bucharest, Copenhagen, and San Francisco all average advertised costs per Mbps within a five-cent range.
Europe Leads in Broadband Affordability
In this section, we examine monthly prices at advertised speeds that meet minimum broadband tiers to determine a measure of affordability. This analysis reveals that, on average, broadband access is most affordable in Europe. This finding generally holds when we examine the average monthly price for plans that meet 25/3 Mbps, 100 Mbps download, 100/100 Mbps, 1,000 Mbps download, and 1,000/1,000 Mbps minimum advertised speeds—all various benchmarks that have emerged in the U.S. broadband policy context.13 Many advocates have called to raise the minimum broadband definition to 100 or 1,000 Mbps download benchmarks, both of which OTI supports.14 Symmetrical download and upload speeds are also important because users are often content creators, too.15 We look at each of these benchmarks to understand how affordability changes within each minimum speed tier.
Europe consistently leads with the most affordable average monthly price within each minimum speed tier. Depending on the speed tier, either Asia or the United States has the most expensive average price.
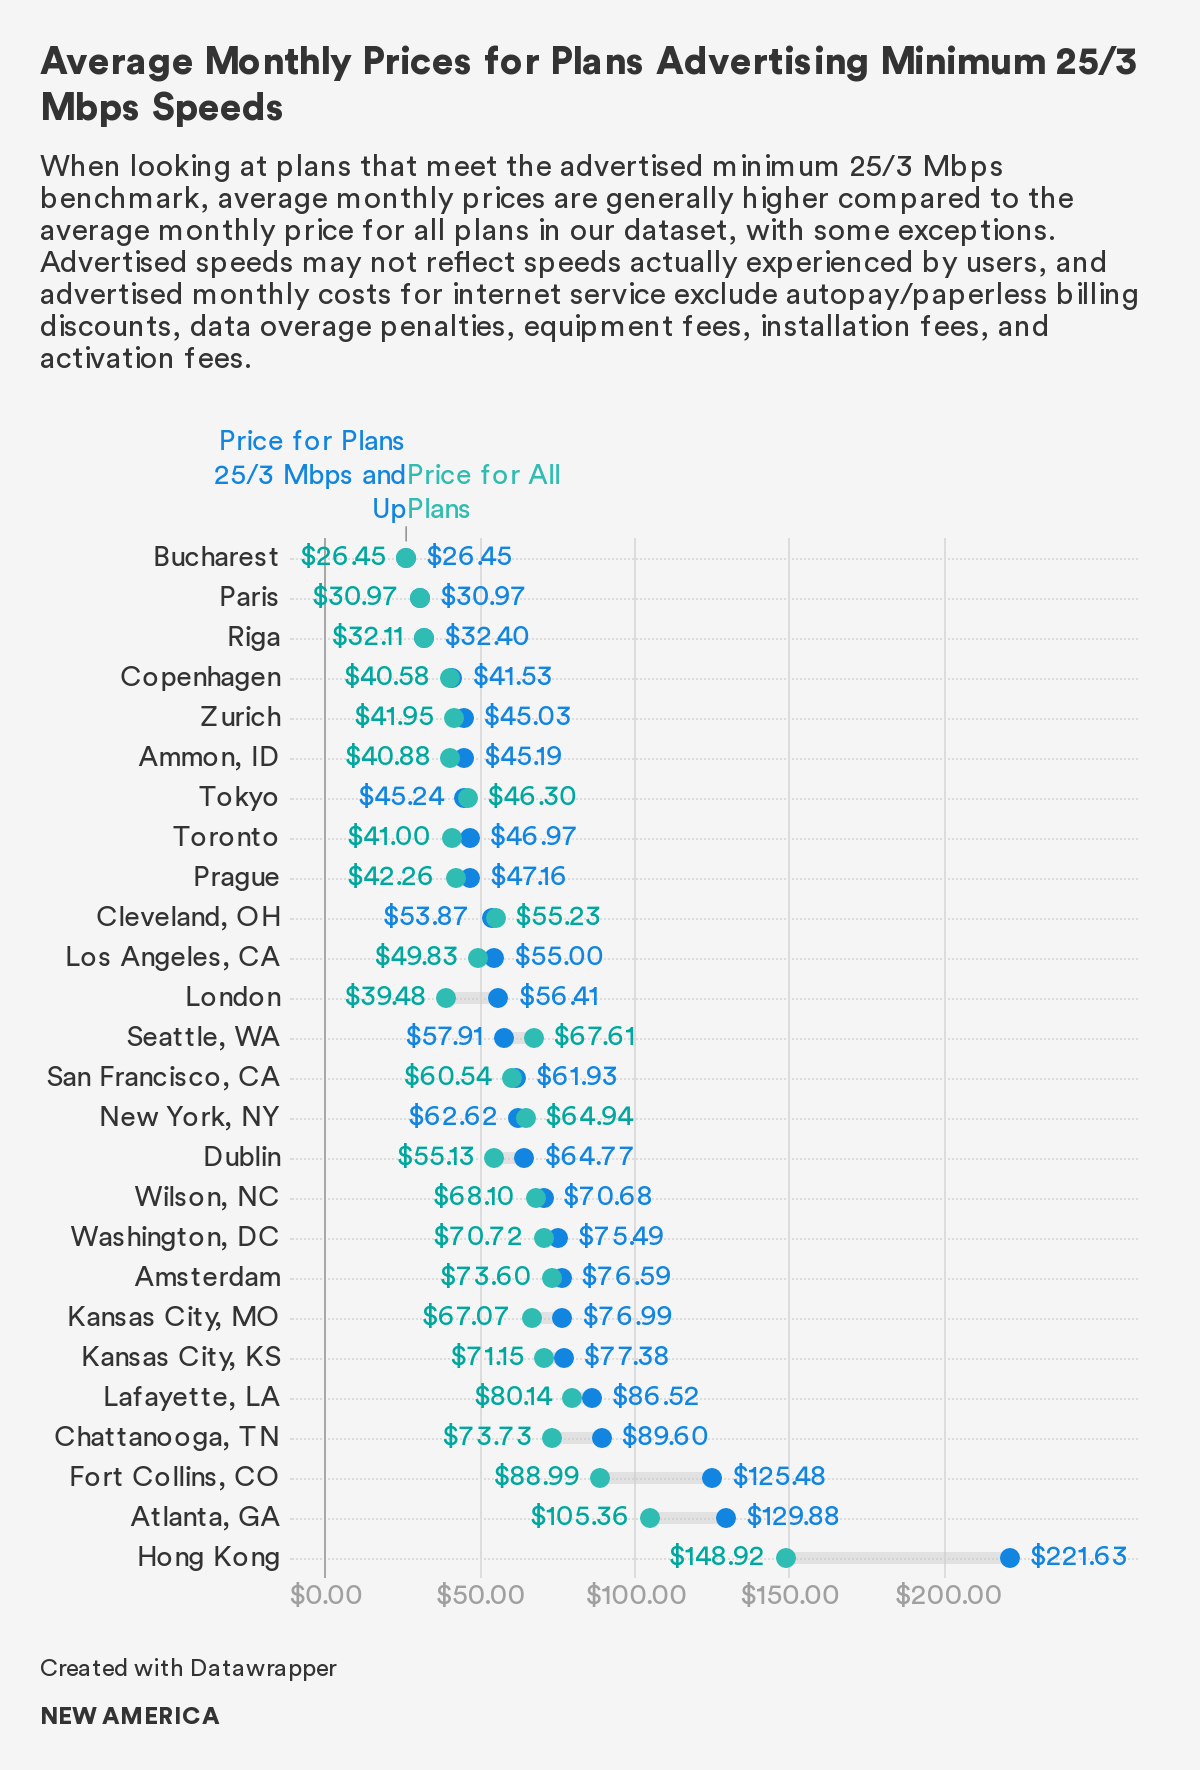
At the 25/3 Mbps minimum benchmark, Europe has the most affordable average monthly price, followed by the United States and Asia. The top five most affordable cities in this speed tier are all in Europe. Eight out of 10 most expensive cities in our dataset are U.S. cities in the 25/3 Mbps minimum speed tier. Ammon, Idaho is the most affordable U.S. city in this speed tier, and it ranks sixth globally at $45.19—71 percent more than Bucharest's average monthly price at $26.45.
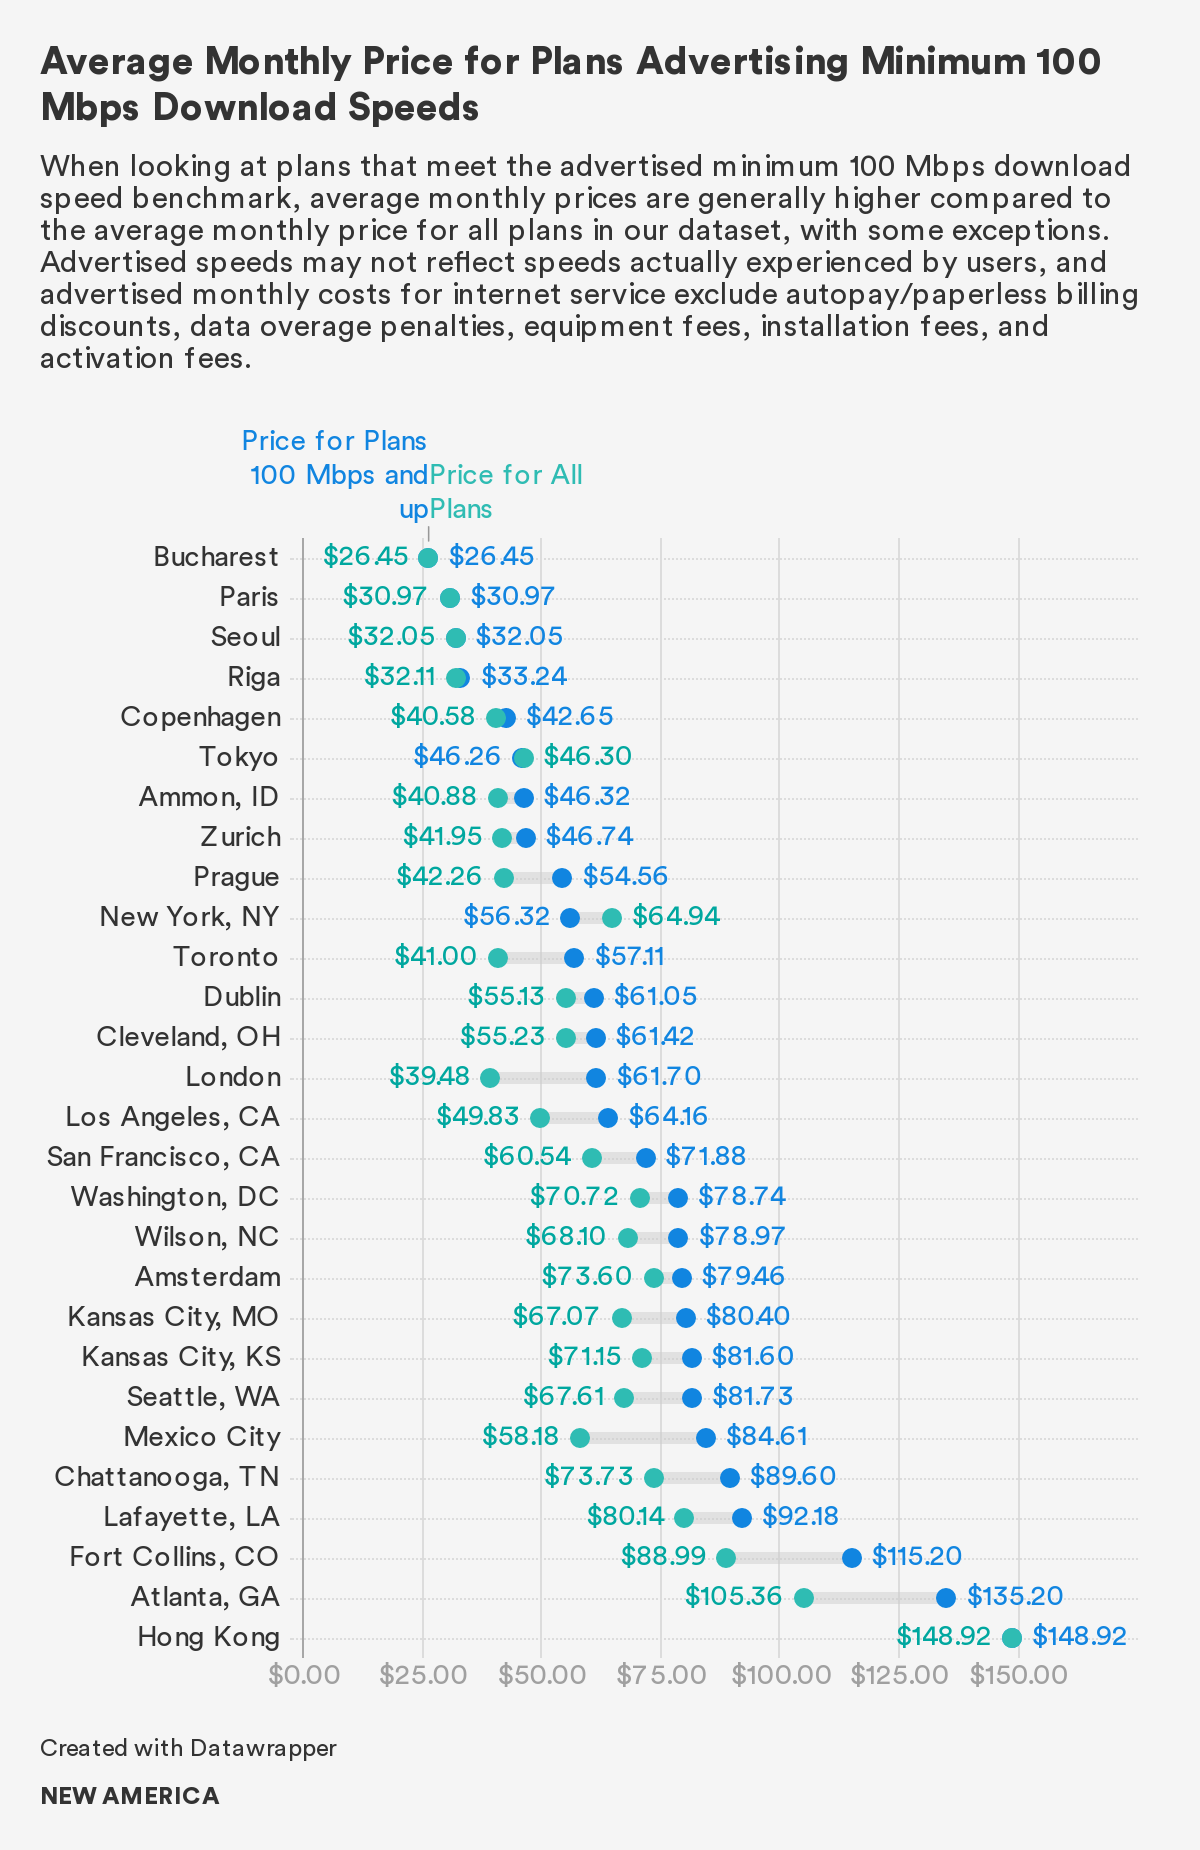
“When you factor in price at [100 Mbps] speed,” FCC Commissioner Jessica Rosenworcel has written, “the United States is not even close to leading the world.”16 Our findings support this statement. At the 100 Mbps minimum download speed tier, the United States has the most expensive average monthly price, followed by Asia and Europe. Eight of the 10 most expensive cities in this speed tier are in the United States.
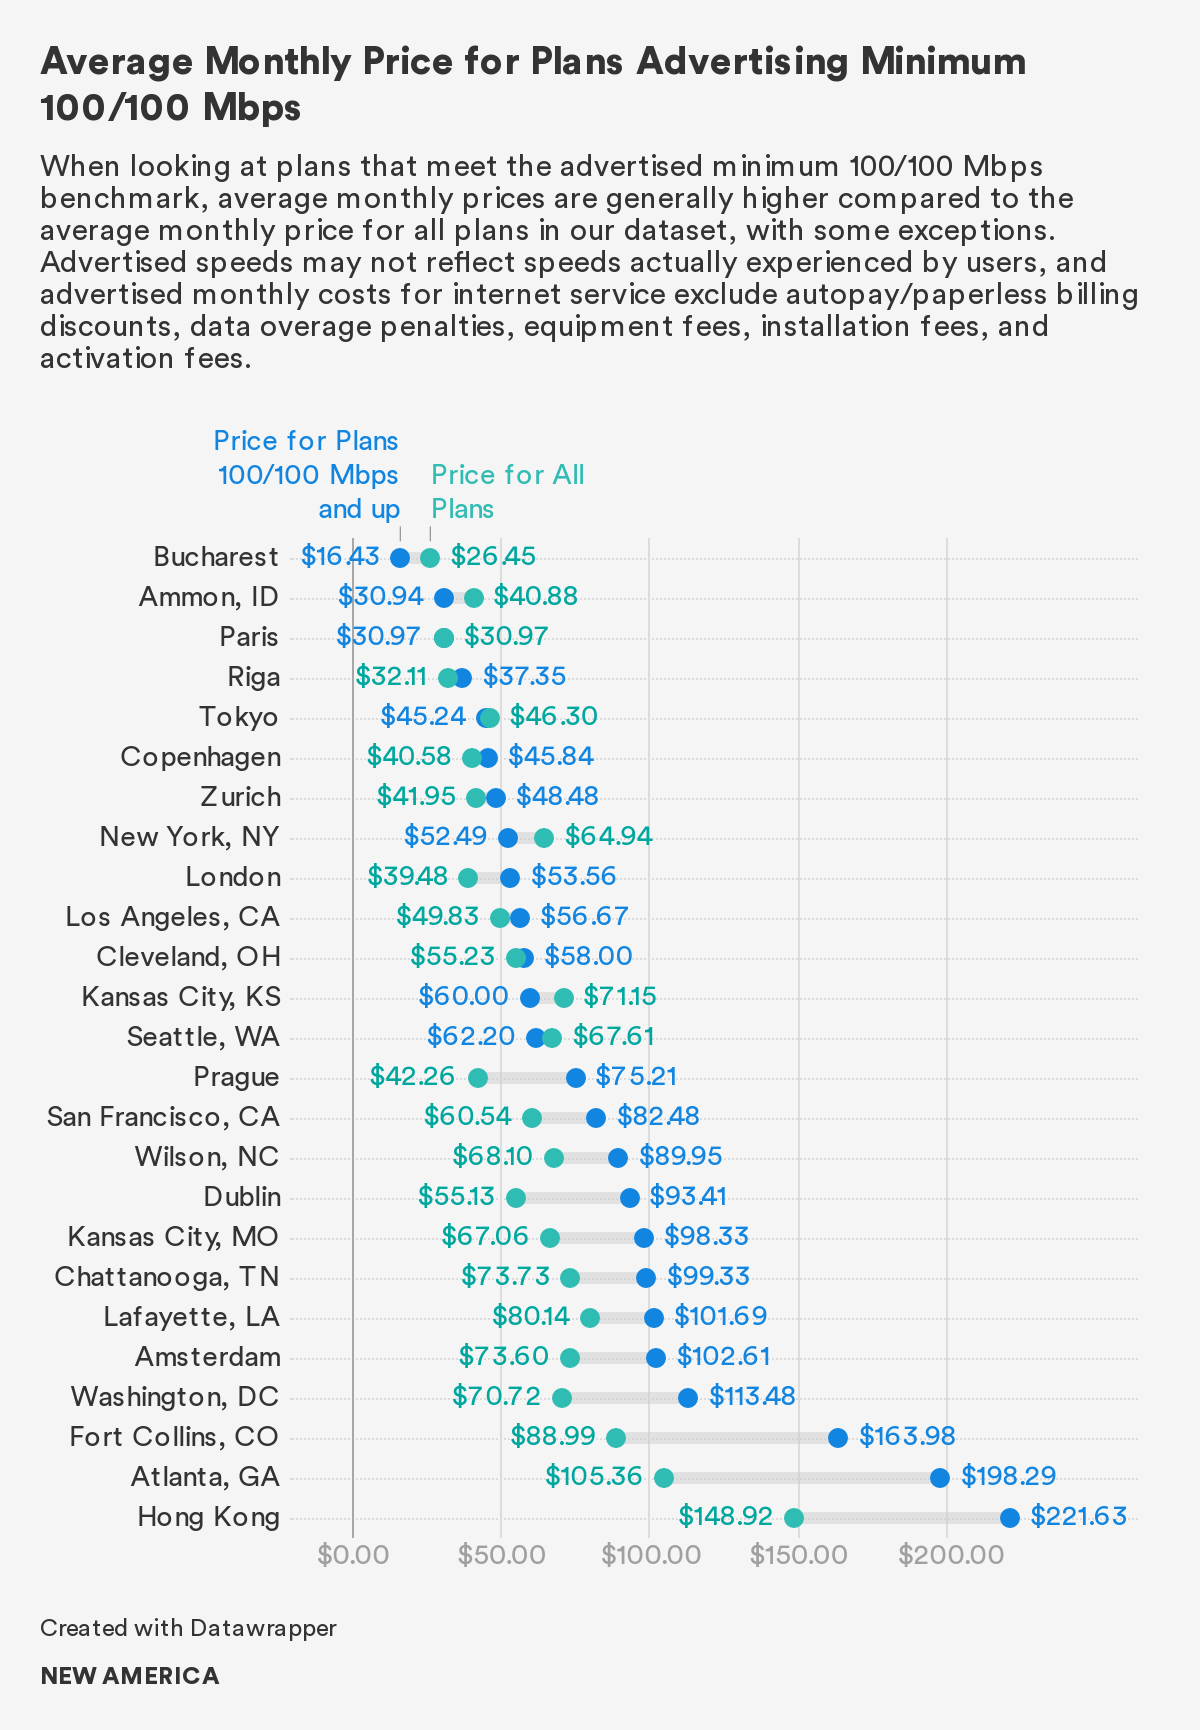
The United States trails in affordability at the 100/100 Mbps minimum speed tier, too. Six out of the 10 most expensive cities in this speed tier are U.S. cities. Only two cities in the top 10 most affordable cities are U.S. cities: New York, ranked eighth at $52.49, and Los Angeles, ranked 10th at $56.67. Compared to the most affordable city in this speed tier, Bucharest at $16.43, New York and Los Angeles are over twice as expensive. Asia is the most expensive on average, followed by the United States and Europe.
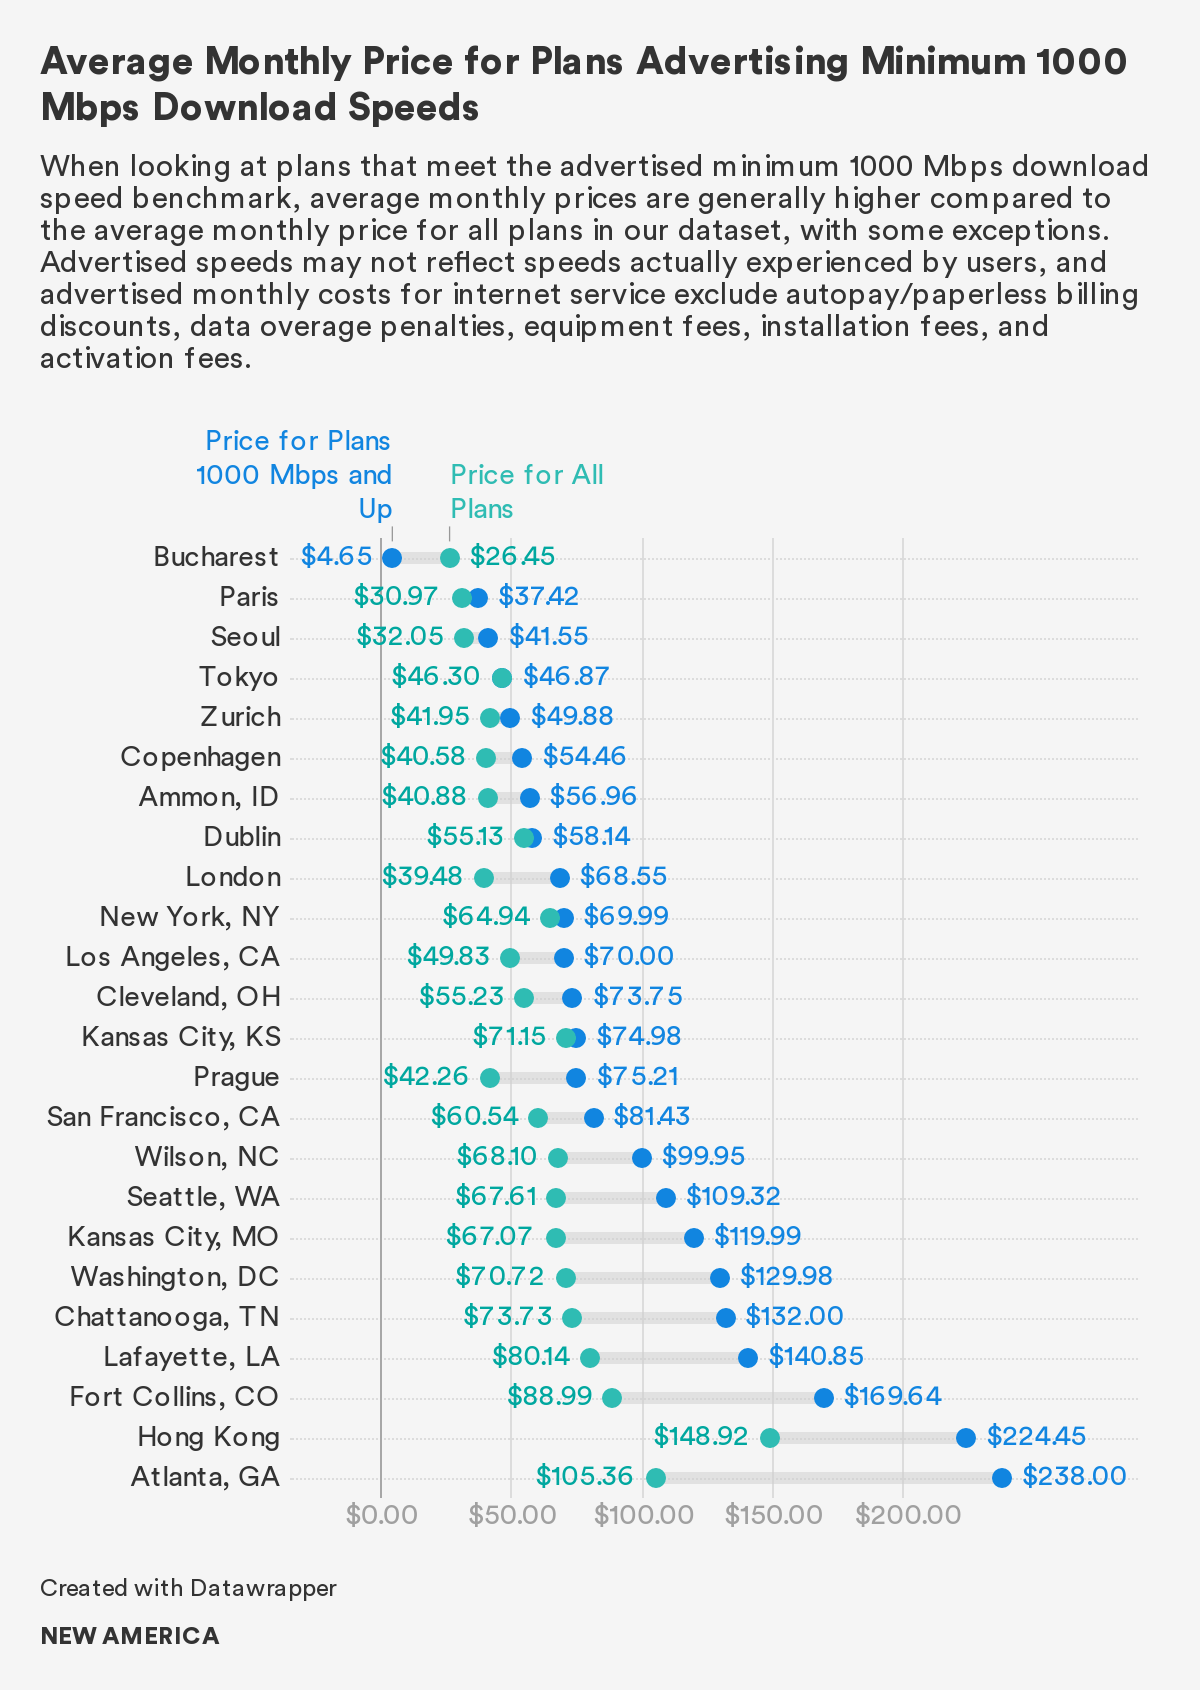
Comparing regions, Asia is the most expensive on average at the 1,000 Mbps minimum speed tier, followed by the United States and Europe. Comparing cities, however, nine of the 10 most expensive cities in this speed tier are U.S. cities; Atlanta tops the board at $238. Notably, Atlanta’s average is over 50 times more expensive than Bucharest’s at $4.65.
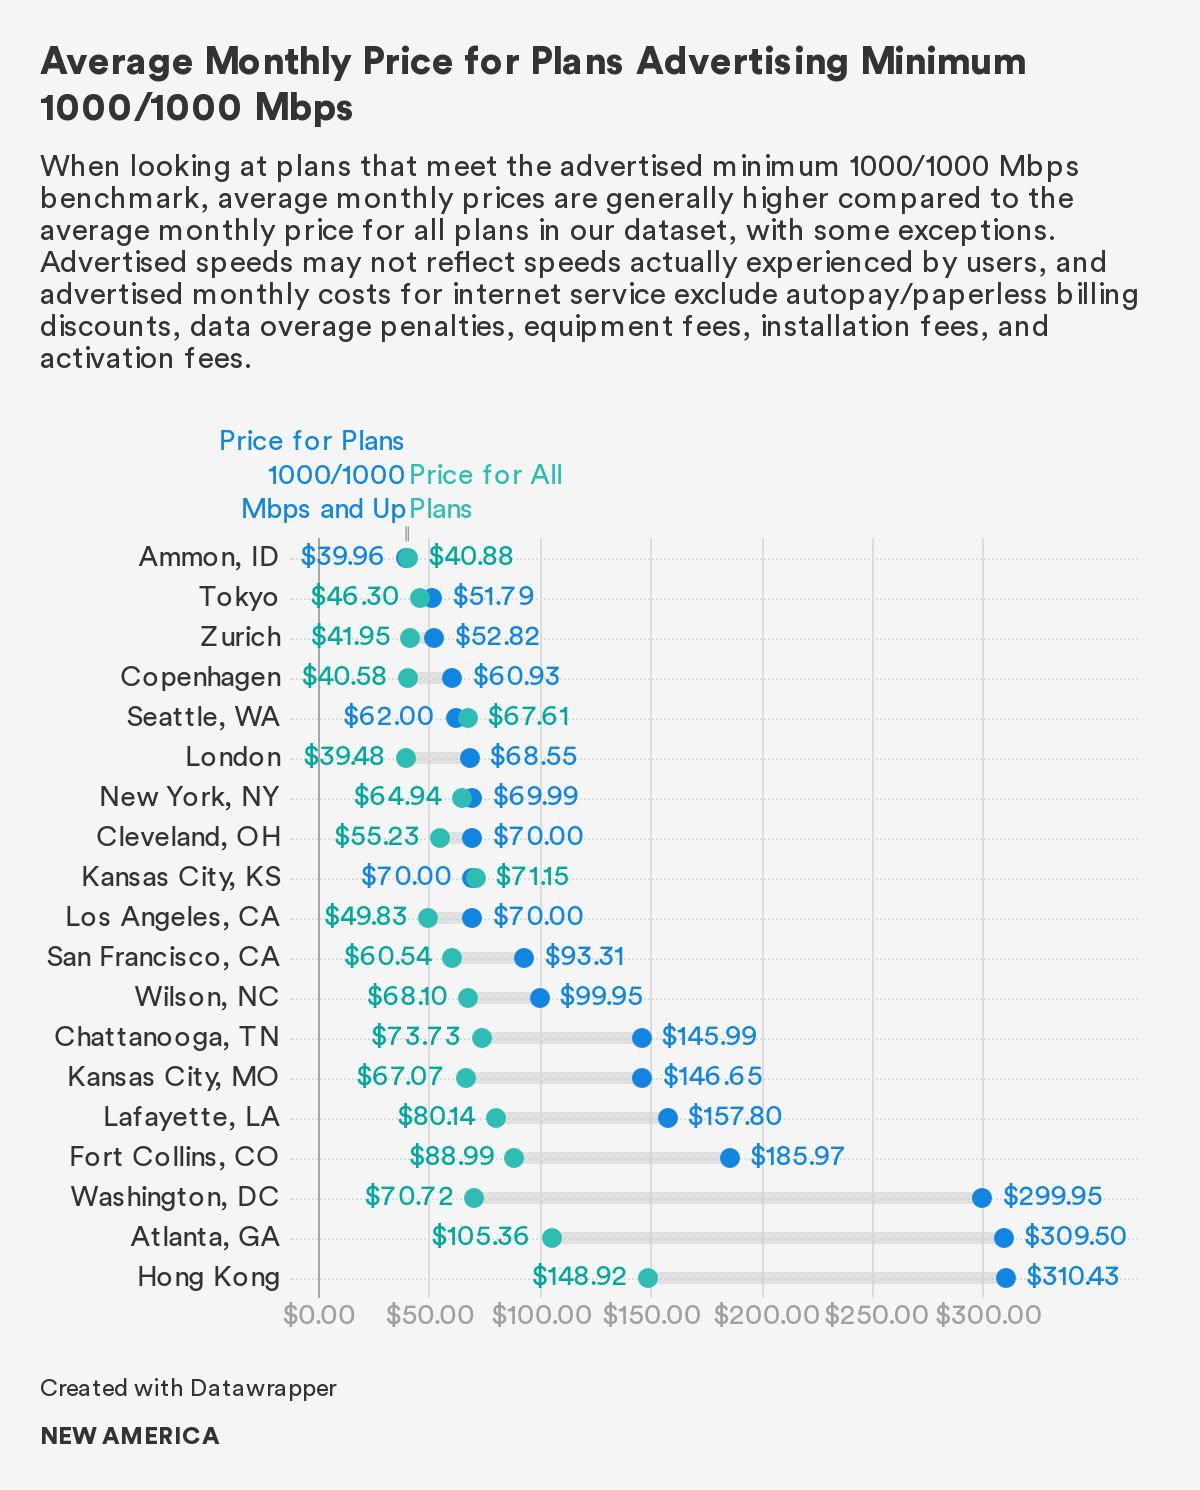
At the 1,000/1,000 Mbps minimum speed tier, Europe is the most affordable on average, followed by the United States and Asia. The U.S. average is $131.70, which is 134 percent more than the European average at $56.37.
Citations
- More information on the differences between a modem and router are detailed in the “Focus on the Fees” section.
- Advertised data provides the best publicly available information on internet pricing in the United States, as no government agency collects this information.
- The estimate for Asia is limited by the lack of data on self-installation fees among Asian providers and activation fees for Hong Kong and Tokyo providers in our dataset. In addition, our dataset does not include information on Wi-Fi router purchase fees in Seoul or Tokyo and modem purchase fees in Hong Kong or Seoul because providers in our dataset do not advertise them. As a result, this estimate for total one-time costs a consumer in Asia would pay for self-installation and equipment purchases only includes the average modem purchase fee in Tokyo.
- Fiber penetration in the United States is 15.55 percent, while the average among OECD countries is 26.81 percent. “OECD broadband statistics update,” Organization for EconomicCo-operation and Development, March 3, 2020, source
- The United States has the most expensive average and median monthly prices for fiber-based plans coming to $79.92 and $57.99 whereas in South Korea, which has the highest in fiber penetration rate according to the OECD, fiber-based plans cost on average $31.71 a month and median monthly prices are $30.42. Within our dataset, Denmark, France, Latvia, and Japan, which among the OECD countries rank higher in fiber penetration rates than the United States, also have lower monthly prices for fiber-based plans on average and median than the United States. Organization for Economic Co-operation and Development, “OECD broadband statistics update.”
- Organization for Economic Co-operation and Development, “OECD broadband statistics update.”
- See, e.g., H. Trostle and Christopher Mitchell, Profiles of Monopoly:Big Cable and Telecom, (Institute for Local Self-Reliance, July 2018), source
- Hong Kong’s average monthly internet price of $148.92 represents an outlier that pulls the average for Asia upward.
- Inti Pacheco and Shalini Ramachandran, “Do You Pay Too Much for Internet Service? See How Your Bill Compares,” Wall Street Journal, December 24, 2019, source
- See Appendix A for population density sources.
- Seoul is excluded from this calculation because the plans in our dataset did not include information on advertised upload speeds.
- In the absence of government collection of pricing data or ISP disclosure of their records, advertising remains one of the best available sources of public information on internet pricing.
- Similar to our analysis on monthly internet prices, we look only at the monthly price that ISPs advertise for internet access and exclude monthly or one-time autopay/paperless billing discounts, data overage penalties, equipment fees, installation fees, and activation fees in our analysis on monthly internet prices.
- Amir Nasr, Eric Null, Joshua Stager, Reply Comments of New America’s Open Technology Institute, GN Docket No. 18-238, WC Docket No. 11-10, (October 1, 2018), source
- Users require higher upload speeds to ensure they have enough capacity to run a query on a search engine, post or send a picture, or communicate with someone via video conferencing. Often, users are performing multiple tasks at once, making upload speeds even more important. See, e.g., Becky Chao, Sarah Morris, Amir Nasr, Eric Null, Joshua Stager, Comments of New America’s Open Technology Institute, GN Docket No. 18-238, GN Docket No. 18-231, WC Docket No. 11-10, September 17, 2018, source ; Christine Ottoni, “Content creators can do more with the fastest Internet,” Ting Wake Forest News, Ting, April 3, 2019, source ; Peter Christiansen, ed. Cara Haynes, “What Is a Good Download and Upload Speed?” HighSpeedInternet.com, June 2, 2020, source ; and Alex Bybyk, “What is a good upload speed for streaming?” Restream, August 19, 2019, source
- Statement of Commissioner Jessica Rosenworcel, Dissenting, “Fourteenth Broadband Deployment Report Notice of Inquiry,” Rosenworcel Dissenting Statement, adopted August 8, 2018, released: August 9, 2018, 14, source