Table of Contents
- Executive Summary
- Introduction: Past, Present, and COVID
- Methodology and Definitions
- Housing Loss and Poor Data
- Housing Loss in the United States: Our National Rankings and Maps
- Housing Loss in Forsyth County, North Carolina
- Housing Loss in Maricopa County, Arizona
- Housing Loss in Marion County, Indiana
- Policy Recommendations
- Conclusion
Housing Loss in Marion County, Indiana
“I had raw sewage in my basement. I refused to pay rent. They evicted me.” – Shelter Operator, citing a client.1
Introduction
Indianapolis is one of the largest cities in America, with a rich Black history. Like so many Midwestern centers, it blends innovation with a production economy and seeks to find balance with the smaller towns and rural communities with which it trades people, services, and culture. Also, like so many locations in the Great Migration region, Indianapolis struggles with rapid economic progress against the backdrop of segregation and systemic racism.
How are these economic and racial dynamics bound up with housing, a fundamental human right that for so many across the United States is under threat? To answer that question, researchers from New America’s Future of Property Rights program teamed up with New America – Indianapolis and the Institute for American Thought at Indiana University-Purdue University Indianapolis (IUPUI) to analyze five years of Marion County eviction, mortgage foreclosure, and tax foreclosure data. We also interviewed government officials, housing advocates, educators, and representatives in nonprofit organizations, government housing agencies, community development corporations, social service centers, nonprofit legal services, real estate firms, and policy institutes to gain an in-depth understanding of local issues related to housing loss. We wanted to know how often residents were losing their homes—whether through eviction, foreclosure, or other mechanisms—who were most at risk of losing their homes, where within the county this loss was most acute, why people were losing their homes, and what happened when they did. These diverse interviews evoked an array of common themes steeped in a history of wage stagnation, racial segregation, and gentrification.
However, in the midst of completing this research, the world changed. As the COVID-19 pandemic swept across the United States, it rapidly became clear that we would release this report at a time when millions of Americans are without jobs and at risk of losing their housing. This report became more than a way to show historic housing loss, but a tool city leaders could use to better predict where the hardest-hit neighborhoods of their city may be.
The root causes of housing loss are only being exacerbated by the COVID-19 crisis in Marion County. And as many have predicted, the wave is coming: On August 14, evictions resumed in Marion County for those who do not live in subsidized affordable housing, and the CARES Act eviction moratorium for federal public housing, housing choice vouchers, FHA-insured multifamily properties, and multifamily-assisted properties expired on July 25. On September 1 the Centers for Disease Control (CDC) announced a nationwide ban on evictions until the end of the year. However rent will still be due on January 1, and thus far the government has not offered rent forgiveness and only limited relief.
For several months the U.S. Census Bureau has been conducting a weekly Household Pulse Survey focused on tracking the fallout from the pandemic. In Indiana, the Pulse Survey conducted between July 16 and July 24 found that 24 percent of households were housing insecure, meaning that they either missed their rent or mortgage payments last month or believe they will not be able to pay this month, and that 50 percent of households reported that at least one person in their household has lost employment income. Further, the Bureau of Labor Statistics reported in June that Marion County had an unemployment rate of 12.3 percent, almost triple the rate in June 2019. Taken together, it is clear that this economic snapshot does not bode well for already struggling households in Marion County.
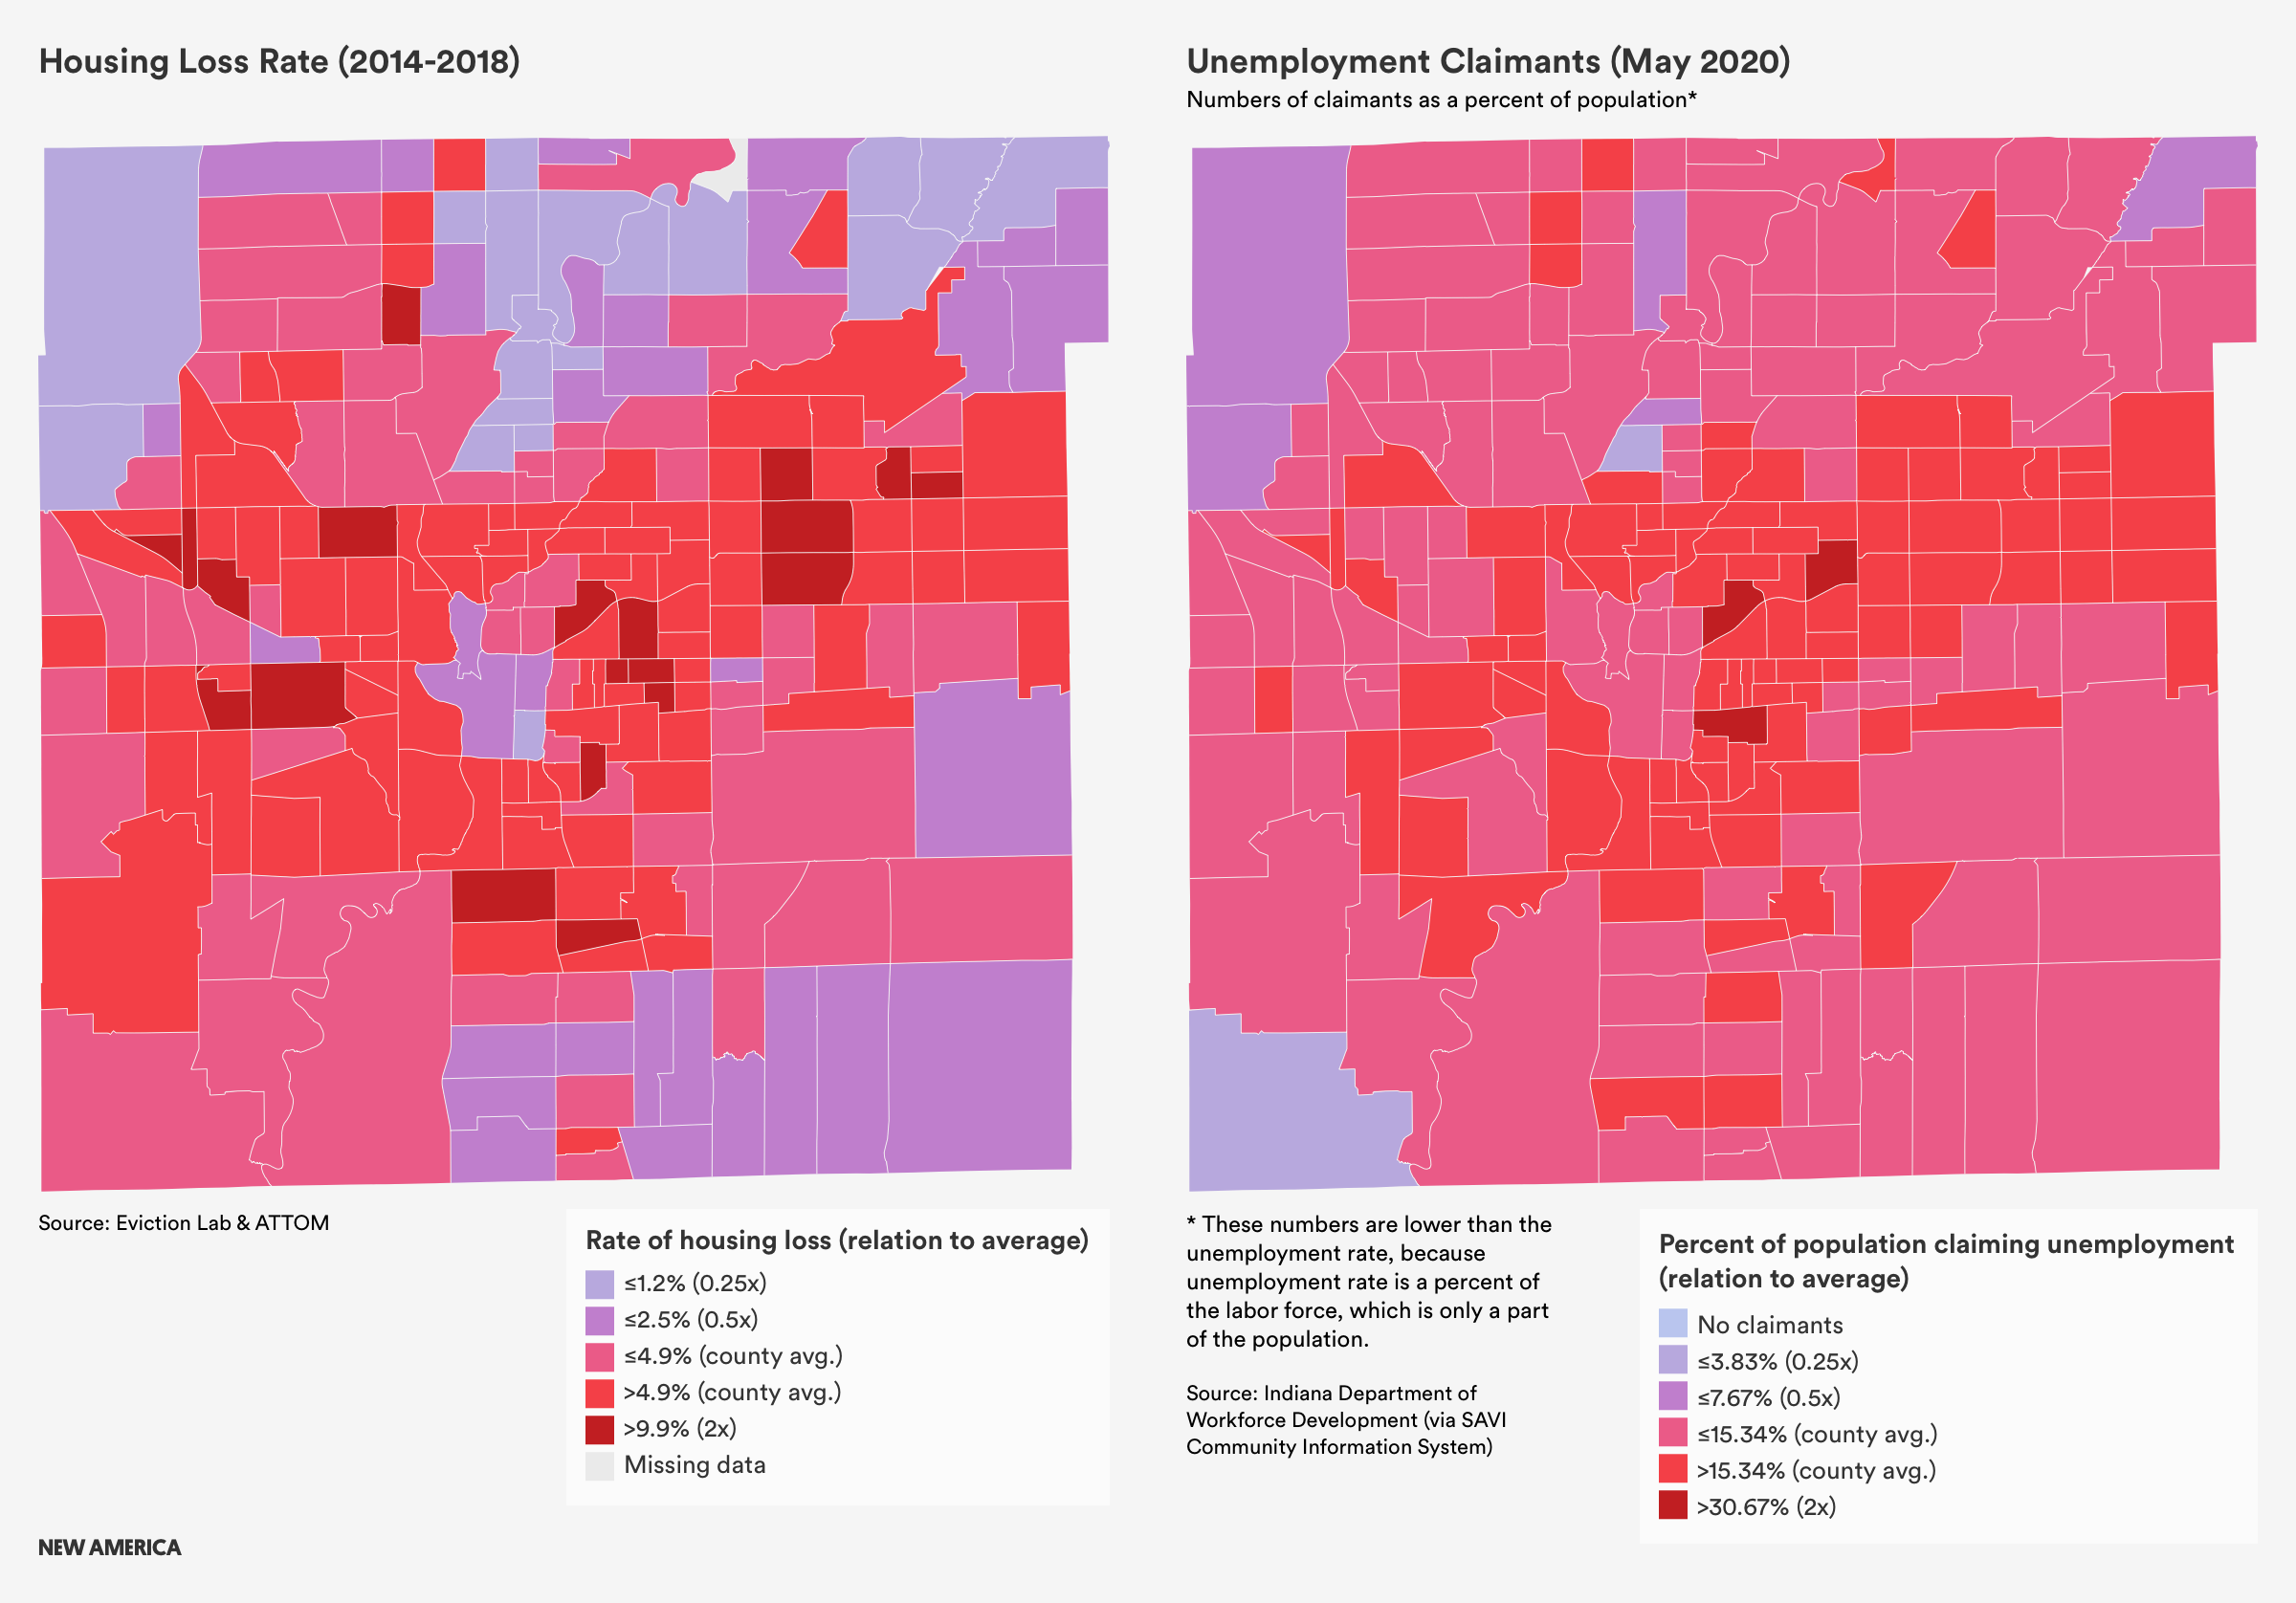
In a SAVI mapping project from Indiana University’s Polis Center, census tract-level accounting of unemployment claims helps to spatialize pandemic-related job loss in a similar manner to how our housing loss index spatially visualizes displacement. Several of the tracts with the highest numbers of unemployment claims are also included as high housing loss tracts within our index. Tracts particularly hard hit by pandemic-related unemployment and housing loss tend to be clustered in the mid-north neighborhoods, and on the east side. Some tracts with high job loss had 2014-2018 eviction rates between 15 and 30 percent and housing loss rates ranging between two to three the county average, before the pandemic.
The pandemic may have shone a light on the scope of potential housing loss in Marion County, but as this report shows, the crisis has been there all along.
Background and Context
On the edge of “flyover country,” a sprawling residential and economic hub stretches across Central Indiana. This is Marion County—Indiana’s most populous county with nearly 1 million residents. The county is more or less coterminous with Indianapolis, which is the state’s capital and largest city, and is the epicenter of Indiana’s economic activity. Indianapolis alone accounts for approximately one-third of Indiana’s gross domestic product.
The city is the 17th largest by population in the United States, and the 16th largest by square mileage. In terms of area, Indianapolis is actually larger than its Midwestern cousin, Chicago.
A consolidated city-county government, known as Unigov,2 manages Marion County, with the exception of four municipalities—Beech Grove, Lawrence, Southport, and Speedway—which retain full autonomy. Because Unigov artificially expands the municipality’s population and square mileage, Indianapolis sometimes feels like a small-time town with big-city problems.
To understand housing instability and loss in Marion County, it is critical to understand the county’s socioeconomic history.
During the Great Migration of the early twentieth century, many Black Americans in the South migrated to northern cities in search of opportunity—including to Indianapolis—where they faced racial discrimination in education, employment, politics, access to social amenities, and housing. As a result of segregation, many of these new residents were concentrated along and to the north of Indiana Avenue, and large portions of the city were redlined, preventing scores of Black families from purchasing homes.
Various policies and trends radically shaped Marion County during the latter half of the twentieth century. For example, consolidation via Unigov added 250,000 residents to Indianapolis overnight, and wealthier, white residents fled from the city center to newly created suburban communities. The acreage of agricultural land in the county decreased dramatically, while Marion County lost approximately 60,000 jobs between 2000 and 2010. The midcentury establishment of IUPUI, northwest of Monument Circle and the central business district, as well as the building of the interstate that cuts through downtown, led to the physical destruction of Black communities along Indiana Avenue.
Over the past few decades, new growth downtown, spurred in part by an increased tax base and federal loan eligibility resulting from Unigov, has driven younger residents back to the city center. Sustained political will from the Indianapolis Mayor’s Office, as well as the established presence of the NCAA and other high-powered sport organizations, has also significantly driven Indianapolis’ redevelopment.
Gentrification and displacement, while certainly a historical phenomenon, is also ongoing. Today, neighborhoods surrounding downtown, such as Fountain Square to the southeast, are experiencing renewed investment. And the Super Bowl Legacy Project, resulting from Indianapolis hosting Super Bowl XLVI, is responsible for the revitalization of neighborhoods, especially on the Near Eastside. Often, the result is that low-income individuals are pushed further away from the amenities, jobs, and services of downtown in order to find affordable housing.
Aside from corporate sports, other major industries in the region include education, manufacturing, and health care, as the city is headquarters for both Anthem and Eli Lilly and Company. There is also an emerging technology sector in Indianapolis, especially with Salesforce, a cloud-based software company, establishing a large office in 2017, and the 16 Tech Innovation District opening its first building on its 60-acre campus in August 2020.
While the transformation of the Marion County economy has contributed to new job growth for high-skilled workers, many low- and middle-income earners have been left behind. In Indianapolis, between 2000 and 2016, high-income earners saw income growth of 5.8 percent, while middle-income workers saw their annual earnings decrease by 8.5 percent. This decrease in middle-income wages is at least partially explained by Indiana’s shift away from manufacturing: Between 1969 and 2014 Indiana lost around 31 percent, or 200,000, manufacturing jobs. As a result, many workers have become reliant on low-wage work in the food service and retail industries; a 2018 report on economic opportunity in Central Indiana found that two-thirds of job growth in the region between 2006 and 2016 was in low-wage industries. While low-wage workers have seen income growth of 4.9 percent during the last two decades, these wages are not high enough to afford the cost of living, which has increased faster than wages.
How, Where, and When Are People Losing Their Homes?
Marion County experienced a housing loss rate, accounting for both evictions and foreclosures, of 4.9 percent between 2014 and 2018. Roughly 17,500 households lost their homes each year during this time frame.
Evictions: Approximately 46 percent of households in Marion County rent their homes, yet these households account for 75 percent of all housing loss in the county. The overall rate of eviction for renter households in Marion County was 6.8 percent between 2014 and 2018.
According to interviewees, the most common reason for eviction is the inability to pay rent, and our quantitative analysis indicates an association between rent-burdened households and higher rates of eviction. We also heard anecdotal evidence regarding retaliatory evictions after tenants contacted local authorities about inhabitable rental units or unfair rental practices.
Personal crises, notably loss of income, or an unexpected expense, such as car repair or a medical emergency, can easily result in a low-income household missing rent. Many families lack adequate emergency savings, and local rent relief programs are inaccessible to many. Low-income renters often cannot gather the necessary documents to qualify for assistance, or find the time for an application appointment.
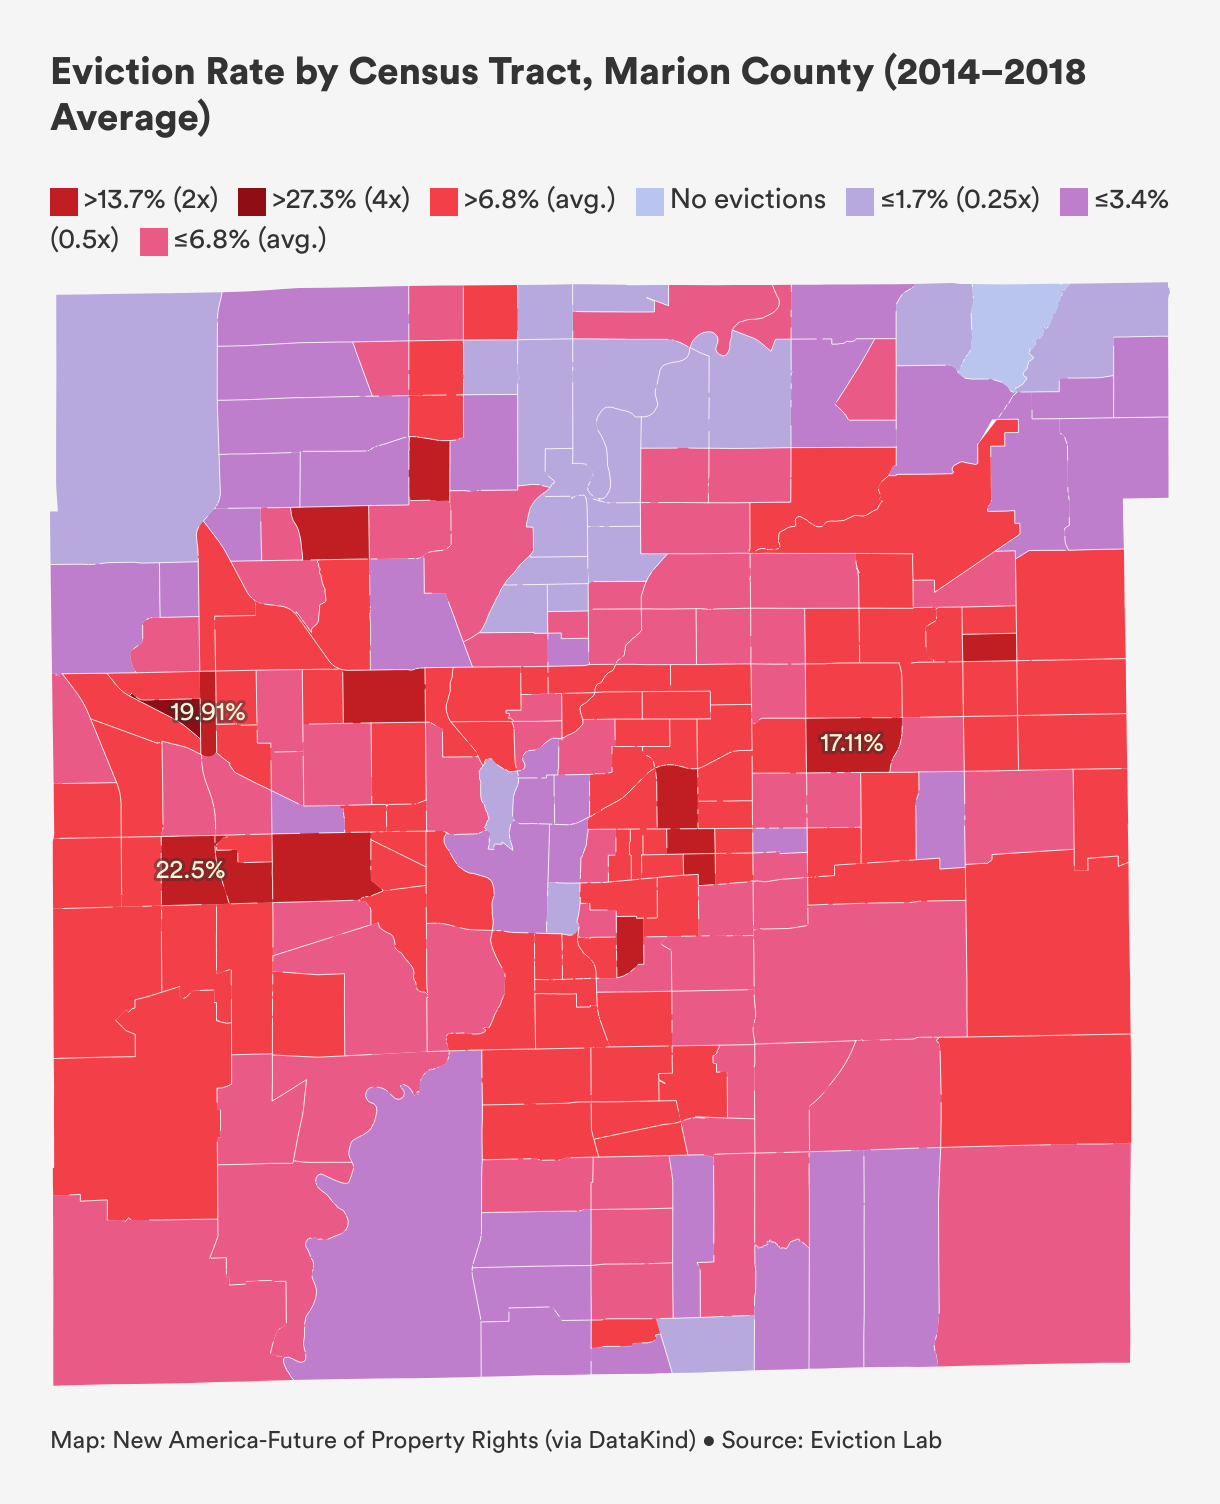
Generally, census tracts experiencing above-average rates of eviction are located on the periphery of downtown Indianapolis. These tracts are also home to more Black households, the demographic group with the second-strongest association with evictions, behind Latinx households. Tracts directly south of downtown that record high rates of eviction, however, are home to large percentages of white households. These findings suggest that neighborhoods surrounding Mile Square suffer significant rates of home loss, regardless of race.
Yet the two tracts with the highest rates of eviction between 2014 and 2018 are located in Wayne Township, to the west of downtown Indianapolis.
The worst tract for evictions, with a shocking rate of 34 percent—meaning that more than a third of renters are evicted every year—lies just outside the enclave of Speedway. Wedged between I-465 and I-74, the tract is roughly 50 percent Black and 14 percent Latinx. Most significantly, the median household income in the census tract is $54,757, about 20 percent higher than the county average. Tracts with higher incomes generally show lower rates of eviction, so why does this relatively wealthy tract express the highest eviction rate in Indianapolis?
The only clue we could find was a 2013 article in the Indianapolis Star that highlights habitability issues within the Heather Ridge Apartments, a 204-unit complex in the census tract. According to the report, the apartments’ owner was ordered by the Indianapolis Housing Authority to repay over $500,000 due to welfare fraud. The public housing authority found that the owner was not providing adequate housing for residents with housing choice vouchers, a violation of the program’s requirements. Management was also illegally billing these residents for past-due utility bills. Because Indiana lacks “just cause” eviction laws, which stipulate acceptable reasons for which a landlord can pursue eviction, landlords often evict tenants simply for contacting local officials about substandard living conditions or unfair rental practices. It is possible that tenants in the Heather Ridge Apartments were evicted for withholding rent due to habitability concerns, however this is only a guess and more research is needed to understand the exceptionally high eviction rate within this census tract.
The second hardest-hit census tract in Wayne Township reported an eviction rate of 22.5 percent. This tract also does not appear to include distressed neighborhoods or large percentages of marginalized populations, which show strong associations with housing loss. Located about halfway between the racetrack and Indianapolis International Airport, the tract reports a median household income of $56,050 and 80 percent of housing units are owner-occupied. In fact, the census tract is majority-white, the racial group most weakly associated with eviction in Marion County according to our analysis.
Mortgage Foreclosures: The foreclosure rate for owner-occupied households with a mortgage in Marion County was 2.7 percent between 2014 and 2018. Mortgage foreclosure accounted for 25 percent of all housing loss in Indianapolis during this five-year span, resulting in the displacement of over 3,700 households per year.
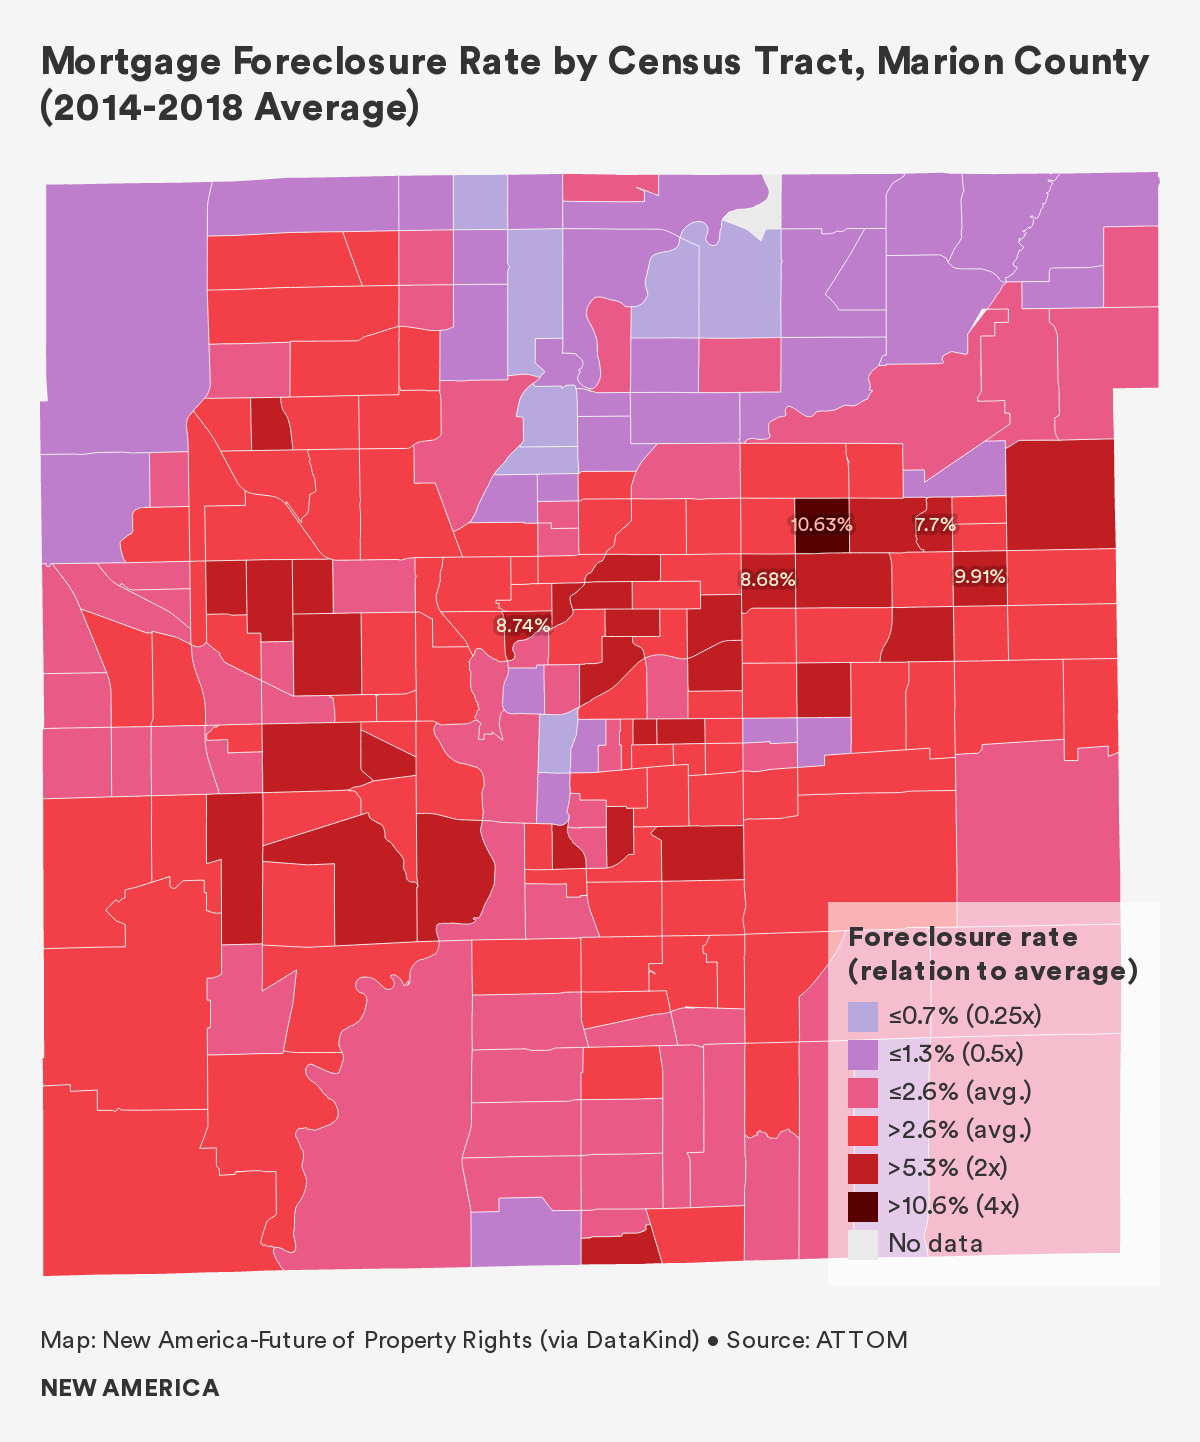
A number of census tracts in Marion County experienced foreclosure rates significantly above the county average. Most of these tracts are located along a tilted "V" shape, starting on the northwest side, dipping down along I-465, and then stretching up and across the city from the southwest side to Lawrence on the northeast side. Some tracts record rates as high as 7 and 8 percent. Hard-hit tracts to the north, and especially to the northeast, of downtown Indianapolis are home to higher percentages of Black households, and report both high poverty rates and low property values. Mortgage foreclosure rates to the south of Mile Square, in more white neighborhoods, are lower but still significant at 4 to 5 percent.
The census tract with the highest foreclosure rate in the county—10.6 percent—sits in the northeast township of Lawrence. The tract’s population is 75.5 percent Black and 9.6 percent Latinx, the median household income is $31,327 and approximately 30 percent of households live below the poverty line. Only 26 percent of homes are owner-occupied.
The University of Minnesota’s Displacement and Concentration of Low Income mapping project found that between 2000 and 2016, this census tract lost 489 units of homeownership and gained over 350 rental units. The number of vacant housing units also skyrocketed by over 300, providing some evidence of the spiraling impacts of foreclosure on neighborhood health. Census tracts adjacent to this high housing loss tract also saw the loss of thousands of homeownership units, and a rapid growth of either rental replacements or housing units sitting vacant.
The tract with the second highest foreclosure rate, at 9.9 percent, sits near the county’s eastern edge. The tract has a median household income of $46,196, near the county average, and is 55 percent Black, 15 percent Latinx, and 22 percent white.
Similar to the geography of evictions in Marion County, the far north as well as the southeast township of Pike generally record the lowest eviction rates. This finding is unsurprising: Census data indicates that these areas are wealthier and whiter, with households living in more expensive homes.
Tax Foreclosure: Typically, tax foreclosure occurs after long-term non-payment of property taxes, usually over the course of several months or years. Indiana is a “tax lien state,” meaning that investors bid on liens for tax-delinquent properties at public auctions. After a sale, the original property owner is given a period of time to “redeem” the tax lien, or pay off back taxes, and keep the property. Otherwise, ownership of the property is transferred to the investor. Generally, the redemption period is one year in Indiana.
Data provided by the Marion County Auditor’s Office unfortunately does not differentiate between owner-occupied properties, rental properties, and commercial or industrial properties. We were not able to calculate the tax foreclosure rate among homeowners without a mortgage—the demographic inherently at risk of tax foreclosure—as a result. Nonetheless, a map indicating tax foreclosures per total owner-occupied households in each census tract between 2014 and 2018 provides valuable insights.
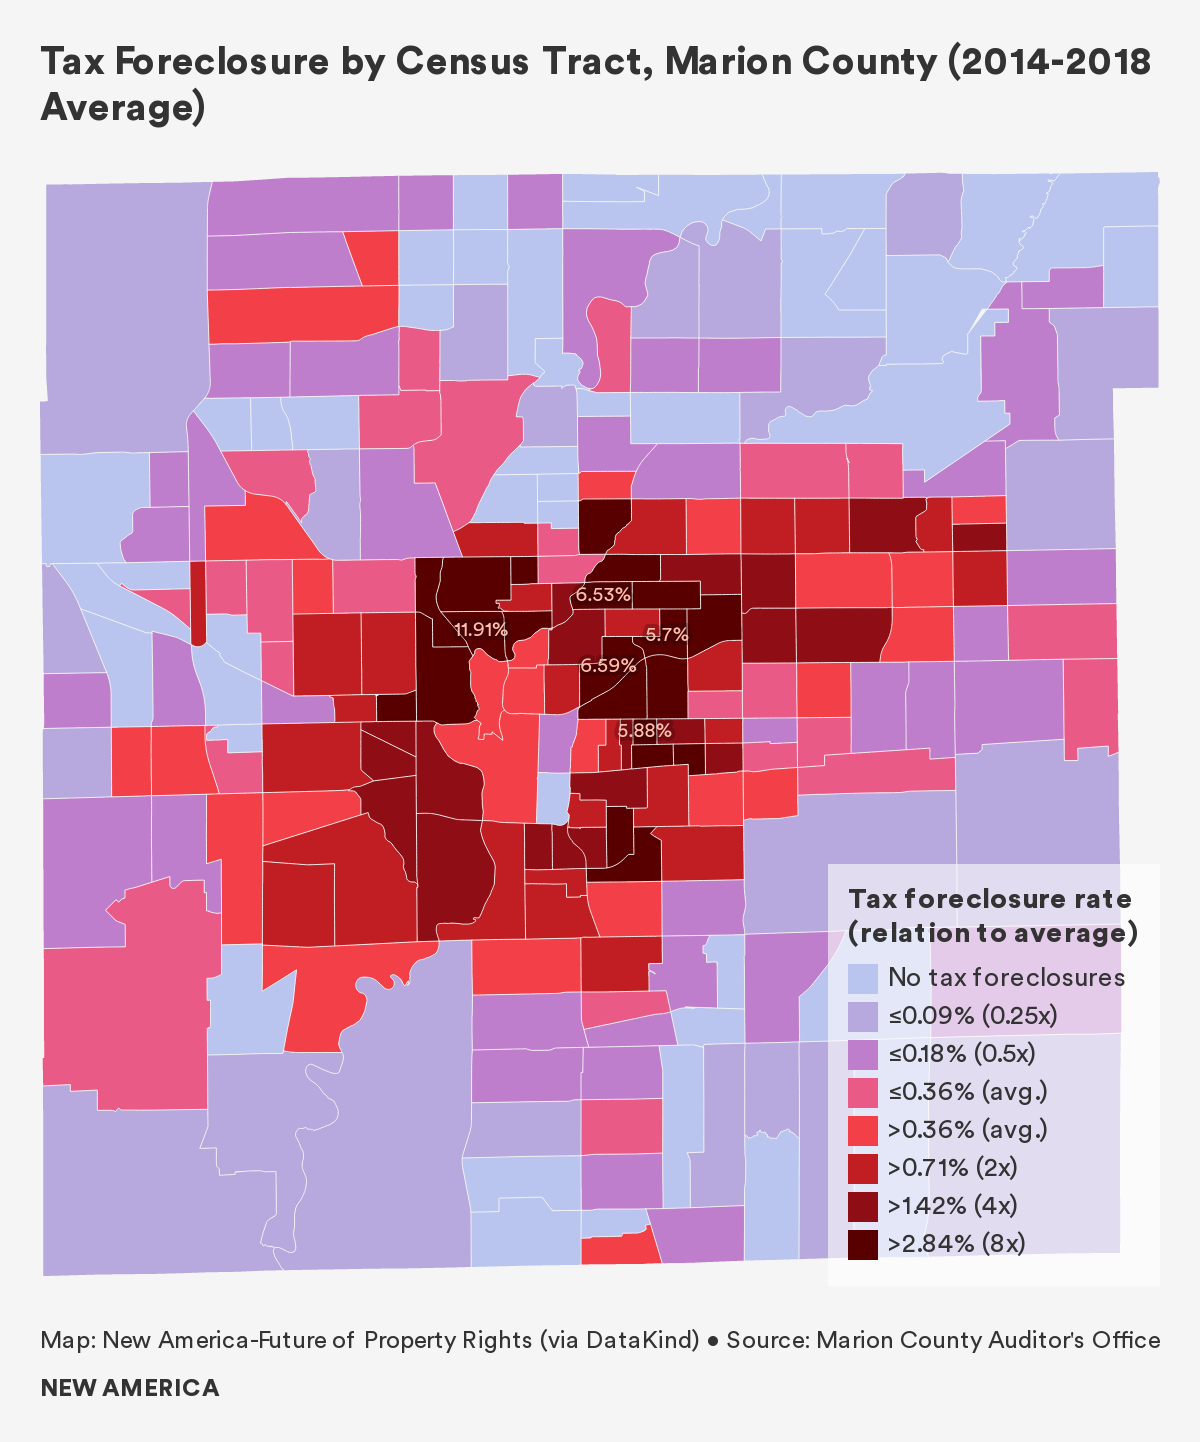
Geographically, tax foreclosures occurred in a ring surrounding downtown Indianapolis, with one tract expressing a rate at nearly 12 percent. There were a number of tracts with no data reported, which may mean there were no foreclosures during the time period but this should not be assumed without verification. This ring of foreclosures aligns with previously redlined areas of the city, and our data shows that census tracts with more non-white households experienced higher rates of tax foreclosure.
A focus on Black homeownership and tax foreclosure has been prominent in other research across the country. Black Americans have paid a disproportionate amount of property tax as a result of the purposeful overvaluation of their properties in many American cities. As a result, Black homeowners have lost their homes through tax foreclosure in cities such as New Orleans, Chicago, Detroit, and Philadelphia. Local research in Marion County is needed to determine if Black homeowners are paying more in property taxes than their white counterparts.
According to a 2015 article in the Indianapolis Star, tax foreclosures are a long-term consequence of the bursting of the U.S. housing bubble in 2008. Families, banks, and various other actors abandoned roughly 10,000 Marion County properties since the Great Recession, and the data suggests the trend continued well into the next decade.
Many of these tax-foreclosed properties now sit vacant or abandoned, with investors—many from outside of Indianapolis—significantly responsible for this blight. Maps built by OpenIndy and Renew Indianapolis indicate that neighborhoods such as the Near North, Martindale-Brightwood, and the Near East Side are acutely affected. These areas overlap to a considerable degree with our tax foreclosure map: Local census tract 3512, in particular, reported a tax foreclosure rate of 11.9 percent, and sits directly to the south of Crown Hill National Cemetery, on the southside of I-65.
Our Housing Loss Index in Marion County:3 In order to measure housing loss that includes both evictions and foreclosures, we first calculated each census tract’s housing loss rate. The housing loss rate combines the total number of evictions and the total number of mortgage foreclosures in a given census tract, and then normalizes that sum by the total number of renters and the total number of homeowners with a mortgage within the census tract.

We then converted the housing loss rate into a housing loss index by comparing a given census tract’s housing loss rate to the county average. A census tract with a housing loss index of 1 experiences a housing loss rate equal to the county average, while an index of 3 indicates that the tract experiences a housing loss rate that is three times the county average.
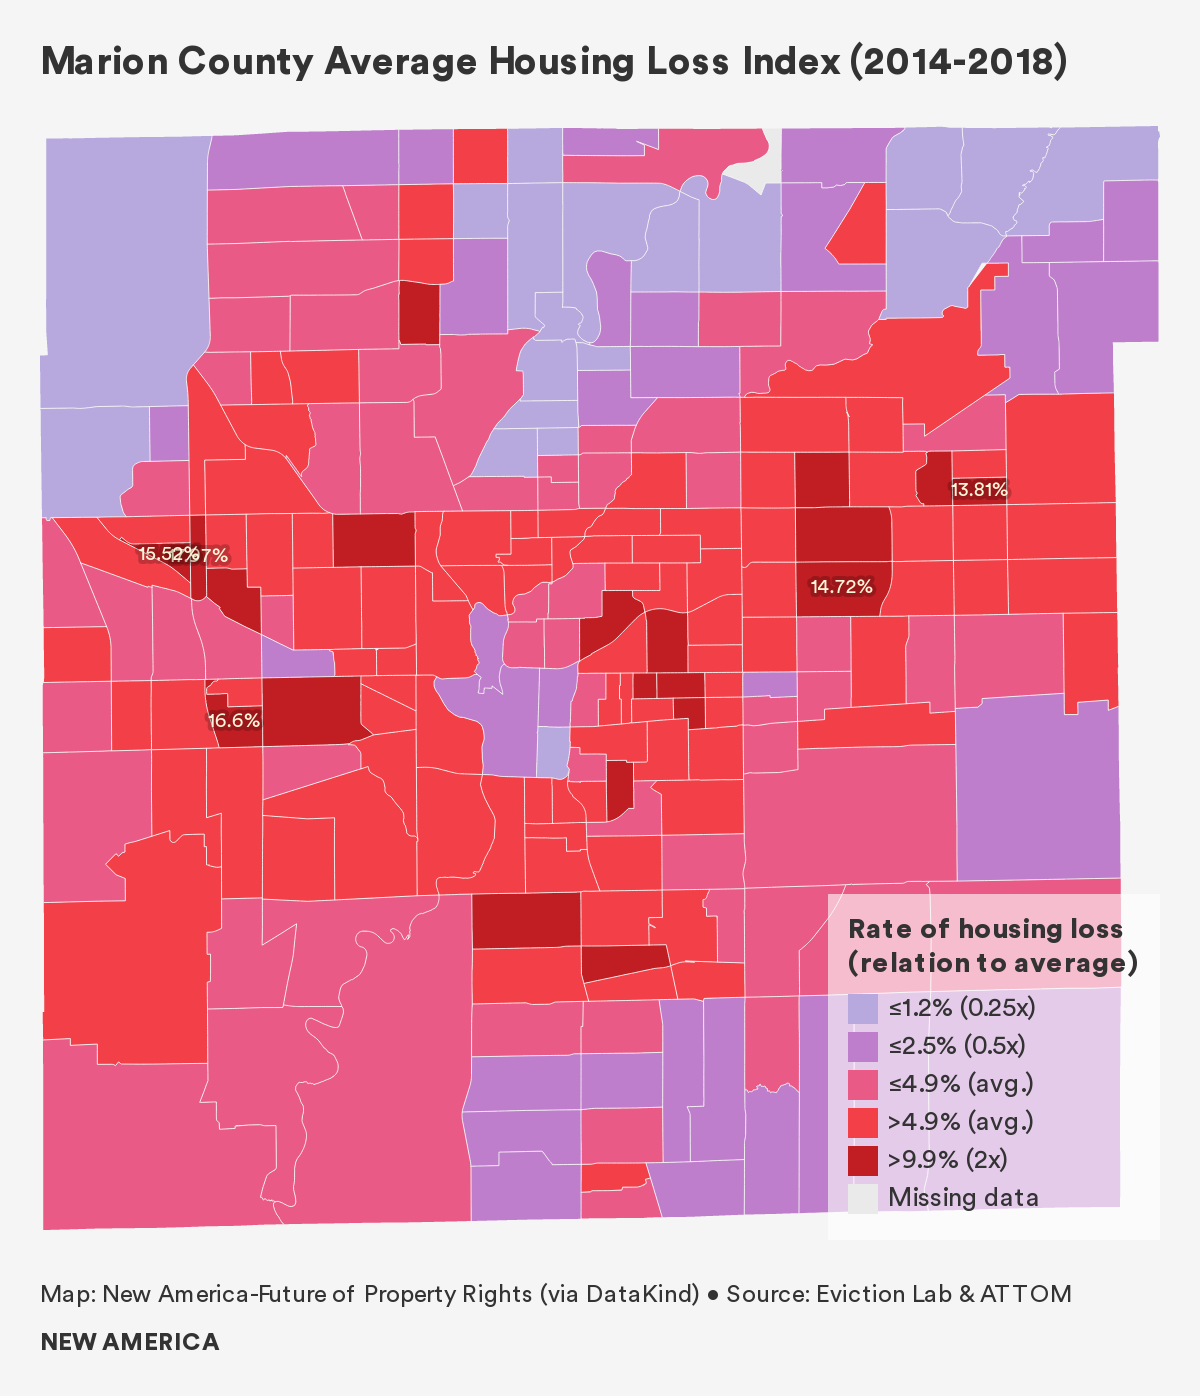
Overall, two townships—Wayne and Center—exhibit the most acute housing loss, as a few tracts in these areas report rates of loss two to three times the county average. A few census tracts in Warren, Lawrence, and Perry townships express rates double the county average, as well.
This band of housing loss stretching east to west through the middle of the county is no coincidence. Local stakeholders observed that when people are displaced, they move laterally, and almost never north or south. Research shows that displacement is often a neighborhood-wide phenomenon, and so it is unsurprising that tracts in this middle band appear so vulnerable.
The census tract with the highest rate of loss in Marion County is located in Wayne Township, and actually sits in both Indianapolis and the enclave of Speedway. Long and narrow in shape, the tract experienced housing loss at a rate 3.6 times the county average between 2014 and 2018. The tract reports a median household income of $30,883, and 31.1 percent of the population lives below the poverty line. Renters comprise 84 percent of all households, and the tract is 50 percent Black and 23 percent Latinx.
Two other tracts on the west side experienced housing loss rates three or more times the county average. The first, adjacent to the west of the hardest-hit census tract, reports a median household income of $54,757, about 20 percent higher than the county median. While this tract’s foreclosure rate is in line with the county average, its eviction rate is extremely high, as discussed above. The second tract sits slightly to the south, between the neighborhoods of Keystone Manner and Lynhurst. The tract reports a median household income of $31,548, and 30.5 percent of the population lives below the poverty line. The tract is 56 percent Black, 23 percent Latinx, and 20 percent white. Notably, almost 40 percent of the tract’s population is foreign born; quadruple the county average.
Who is Losing Their Home?
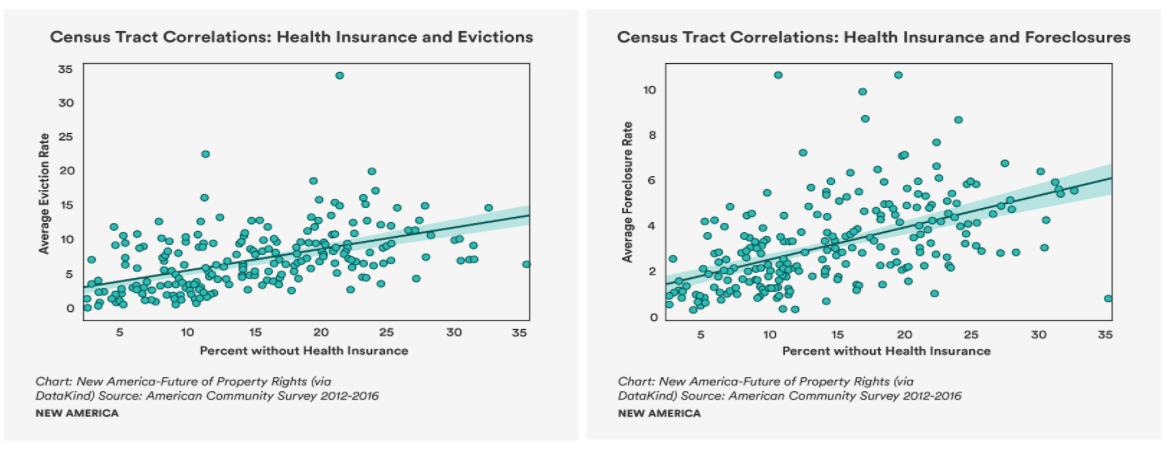
We found a strong positive relationship between lack of health insurance and housing loss. In fact, of the 20 socioeconomic and other variables examined, both evictions and foreclosures were most strongly associated with a lack of health insurance, showing the truth of the adage: “one health scare away from being out on the street.” Many low-paying jobs do not provide health insurance, and this finding suggests that these at-risk households are generally housing cost-burdened and/or low-income, or cannot pay for housing and medical treatment following an unexpected emergency.
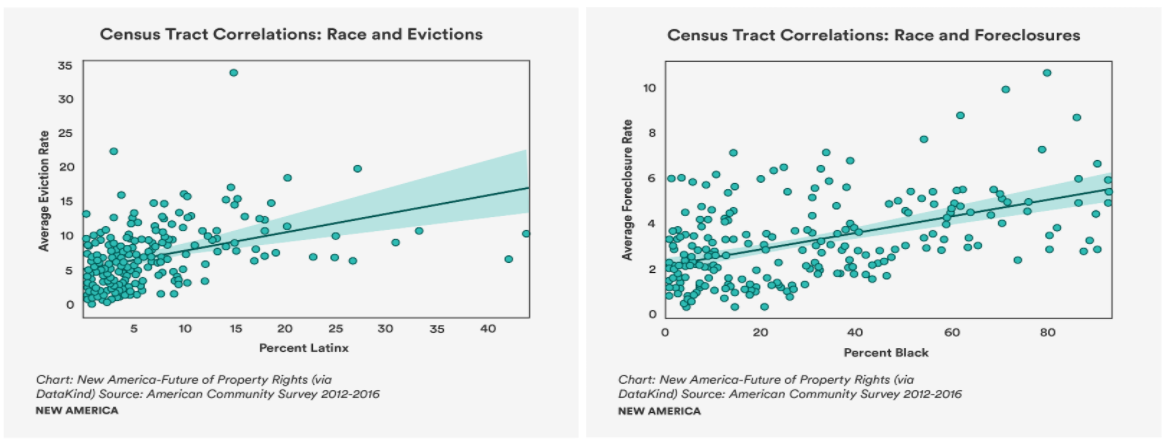
Census tracts with predominantly non-white residents, and in particular Latinx residents, had higher rates of housing loss than predominantly white census tracts. Interestingly, Latinx households were more strongly associated with eviction than Black households, whereas Black households were more strongly associated with foreclosure than Latinx households.
Unsurprisingly, we found that census tracts with a higher proportion of rent burdened households experienced higher levels of evictions and foreclosures. We also found that census tracts with lower property values and lower monthly housing costs had higher rates of both evictions and foreclosures: This finding suggests that even lower-priced housing may be out of reach for low-wage workers.
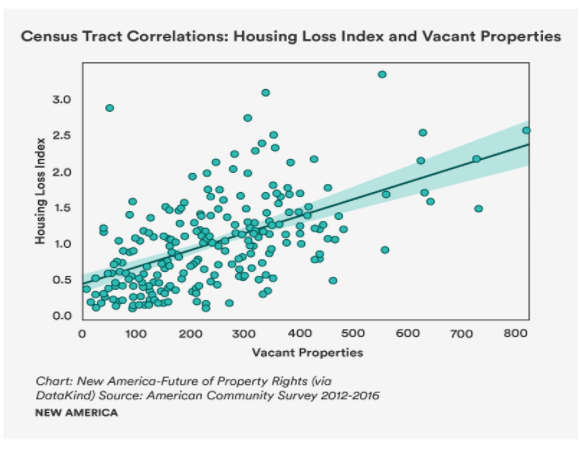
Notably, census tracts with larger numbers of vacant properties have higher rates of home loss, in particular evictions. In other words, evictions are happening at a greater rate in blighted or run-down neighborhoods. We did not find this strength correlation in our other deep dive cities, indicating that blighted properties are a larger issue in Indianapolis than elsewhere.
Tracts with higher shares of older adults living alone had a negative association with housing loss, suggesting that older adults are less likely to lose their homes. This finding is surprising, as senior citizens often rely on fixed incomes, leaving them at risk for any increase in housing costs. Many older adults are also burdened by the costs of medical care, ostensibly creating difficulty in making housing payments.
Why Are People Losing Their Homes?
“People are working multiple jobs to be able to afford basic housing” – Housing Nonprofit Director4
While interviewees mentioned several underlying reasons for housing vulnerability, the three factors most frequently discussed were low wages, the lack of affordable—or even available—housing stock, and the “habitability trap,” or the toxic combination of landlord-friendly laws, widespread habitability issues, and the common practice of tenants withholding rent to force or pay for repairs.
Low Wages: The transition from middle class manufacturing jobs towards low-wage work in sectors like hospitality, food service, and retail has resulted in high rates of poverty for many residents in Marion County. The National Low-Income Housing Coalition observes that a household in Marion County must earn at least $12.87 per hour in order to afford a one-bedroom apartment, and $16.03 an hour in order to afford a two-bedroom apartment. However, just over a quarter of all residents earn $17 or less per hour, and seventeen percent of all households in Marion County earn an income below the poverty threshold. The situation becomes more complex, however, when taking race into consideration. Only 13 percent of white residents earn poverty wages, while 20 percent of Blacks and 34 percent of Latinx do. Median income for white households is over $53,000, while Blacks earn $32,000 and Latinx earn $33,000 per year. This disparity in incomes has real consequences for affording housing in Marion County.
With a median income of $46,000, the average white worker in Marion County can afford to pay just over $1,000 per month for housing. Those who pay more than 30 percent of their income are considered cost burdened. Due to racial disparities in income, a Black household earning their median income of $32,000 can only afford an apartment that costs $800 per month, well below the fair market rent (FMR) of over $900 for a two-bedroom apartment.
While housing costs have been rising, wages have remained stagnant. Indiana University found that wages increased only 5.3 percent between 2012 and 2017, while housing costs for renters increased 11.3 percent during the same period.
Affordability and Availability: According to the National Low Income Housing Coalition, Indiana has 38 affordable units for rent per 100 extremely low-income renter households across the state. As a result, almost half of all renter households in Marion County spend more than 30 percent of their incomes on rent and so are considered rent-burdened. A further 26 percent are extremely housing cost burdened, paying more than half of their incomes towards housing.
Due to severe underfunding, more than 100,000 Marion County residents whose incomes qualify them for either public housing or housing choice vouchers are not being served. In 2018, the Indianapolis Housing Agency provided 9,389 households with assistance, via 688 public housing units and 8,701 housing choice vouchers. However, if half the county’s 169,000 renter households are housing cost burdened, and there are only 9,389 housing vouchers, that means more than 75,000 renter households are being neglected.
This acute shortage in affordable rental stock leaves Indianapolis’s many low-income tenants with scarce options. Landlords can easily take advantage of desperate renters as a result, charging inflated prices for substandard units, and sometimes renting without a lease, paving the way for quicker evictions.
Minority Homeownership in Indianapolis
The overall homeownership rate in Indianapolis is 54 percent. Among white households, 64 percent are homeowners. For Black residents, however, that rate falls to 34 percent. Mechanisms driving this disparity include low credit scores among Black residents, rising home values in Black neighborhoods, housing discrimination, and a lack of intergenerational property ownership.
In the recent Community Credits Needs Assessment, the Indiana University Public Policy Institute (PPI) found significant disparities in home purchasing power for Black and Latinx residents when compared to their white counterparts. PPI also found that Black residents in majority Black neighborhoods face the most barriers to homeownership, as they are least likely to apply for home mortgage loans, and most likely to be denied following an application.
Ten percent of Black and 13 percent of Latinx potential homebuyers were rejected for loans in majority-non white neighborhoods, white buyers were rejected only 8 percent of the time. In majority-Black neighborhoods, however, the proportion of rejected loan applications by Black buyers rose to 14 percent, showing ongoing disparities—and perhaps discrimiation—in lending practices based on neighborhood.
In a settled case against the First Merchants Bank, allegations of lending discrimination based on race led to a settlement in which the bank, in partnership with the Fair Housing Center of Central Indiana, will work to expand lending opportunities in majority-Black neighborhoods.
Overall, the widespread lack of property ownership leaves Black and Latinx residents more vulnerable to variability and inequality within the Indianapolis rental market.
The Habitability Trap: In Indiana, landlords are required to maintain fit and habitable housing, however, this requirement is not well enforced in Marion County. In the report Indiana’s Eviction Problem, an attorney with Neighborhood Christian Legal Clinic explains that the Marion County Public Health Department is only authorized to investigate habitability complaints if the complaining tenant is still living in the unit. As a result, landlords are incentivized to evict tenants who complain in order to avoid inspections and fines.
Indianapolis news media have covered the city’s rampant habitability issues in rental homes over recent years, drawing attention to the prevalence of the problem, especially in poor neighborhoods with many single-family homes and duplexes for rent.
According to local practitioners, habitability issues are concentrated in low-income areas, where housing stock is old and home values are low. Landlords who own multiple properties often charge rents similar to what renters pay in middle- and upper-income neighborhoods. Landlords in these low-income areas may be inclined to “milk” their properties by deferring maintenance in order to maximize short-term returns. This impacts renters who are then obligated to pay rent for apartments that are not suitable for habitation.
Tenants may think that landlords who do not repair maintenance issues have violated their responsibilities in the lease agreement, but in fact Indiana tenants must pay rent regardless of housing conditions. Tenants who withhold rent payments due to habitability issues are therefore at risk for eviction.
To provide some support to tenants who report habitability issues, the Mayor of Indianapolis proposed an ordinance early in 2020 instituting fines on landlords who retaliate against tenants who report issues to the Public Health Department. The city-county council passed the proposal, giving Marion County renters a small amount of protection against negligent landlords. However, the state legislature attempted to overrule the new ordinance by passing a bill that would have micromanaged the tenant-landlord relationship at the state level. Due to the COVID-19 pandemic, the governor of Indiana vetoed the bill, but housing rights advocates are concerned this bill will be reintroduced after the pandemic is over. This concern is reinforced by a long history of the state legislature passing several “bad bills” that prohibit local governments from passing policies that would protect renters.
Out-of-Town Investors and Marion County
“I’ve got buyers from California, New York. They’re all swarming to Indiana because you can get a deal. You can buy a neighborhood.” – Indianapolis Realtor5
Low property ownership rates and cheap and substandard housing stock in poor, marginalized neighborhoods have provided opportunities for outside investors to enter into the Indianapolis rental market, particularly after the subprime mortgage crisis of the mid-2000s.
Between the 2008 financial crisis and 2015 there were more than 19,000 properties in Indianapolis sold at the county’s tax sale auction, raising over $152 million in revenue. Of these homes, over 2,800 were sold twice, and one in five were abandoned by 2015.
The Indianapolis Star reported that the tax liens tied to abandoned or foreclosed properties were often purchased by large, out-of-state investors—from at least 31 states. One San Diego, California based company, Mt. Helix, acquired hundreds of homes through the county tax sale program.
Many of these investors who purchased tax liens were not focused on owning property, but sought the increased interest they hoped to accrue from the original property owners. As a result, they often left their properties to fall into disrepair.
What Happens After People Lose Their Homes?
“[The kids are] having heavy behavioral issues, heavy attendance issues… and so much of it is due to the fact that mom is always trying to secure money for rent” – Elementary School Social Worker6
The effects of housing loss are not isolated. The staggering impacts of displacement and housing instability on a community—not just the individuals and households directly displaced—include health and stress impacts, education, homelessness, and neighborhood neglect.
Health and Stress, or “Crisis Mode”: Crisis mode is both a cause and an impact of housing vulnerability and loss. According to a local shelter manager, housing is simply the “top of a pyramid” regarding household costs; others include transportation, food, healthcare, and childcare. These expenses are usually interconnected, and a disruption in transportation, for example, can impact the income earning capacity for a family. This interruption is a catalyst for a seemingly endless struggle to afford necessities.
The potential for variable earnings, and the reality of little savings leads to vulnerability for housing loss. One shelter manager remarked that for struggling families it was “hard to build back up because you’re constantly fighting that push down.” Housing loss in particular seems to catalyze a downward spiral. As long as families maintain housing, it may be possible to maintain a certain level of stability. Displacement, however, can mean switching school districts, leaving behind social networks, moving further away from work, or relocating to an area of town without access to public transportation.
The process of finding new housing can be especially difficult and time-consuming for low-income renters. Anyone with poor credit, a criminal record, or an eviction filing on record will struggle significantly with a housing search, and likely be forced to settle for substandard housing. One mother of four young children recalled spending well over 150 hours looking for new housing after being evicted twice in a four-month period. Many larger families also find their options limited, as many units have only one or two bedrooms. Overcrowding is often the result.
For those who rely on housing choice vouchers, the search for new housing may be even more complicated. The Indiana State Legislature has banned local governments from passing laws that would prohibit source of income discrimination laws, meaning landlords can refuse to rent to someone if they are housing voucher recipients. For voucher holders, this results in limited housing options, and when housing is available it is often in resource-poor neighborhoods. In a 2014 audit, the Fair Housing Center of Central Indiana found landlords refusal to rent to voucher holders to be pervasive, with 82 percent of landlords participating in this form of discrimination.
Children and Education: During the 2017–2018 school year, over 75,000 students in Central Indiana transferred schools. A majority of these transfers were from charter schools throughout the region, however, Indianapolis public schools have a transfer rate of over 30 percent. This indicates that many students in the city have their education disrupted each year. Children who receive free or reduced lunch account for two-thirds of the transfers, showing how income-status is linked to school stability.
Not only does housing insecurity impact school stability, but the complex consequences of housing loss contribute to disparities in school funding as well. While local property taxes in Indiana account for school funding to a lesser extent than other states, areas with high housing instability, vacancies, and blight still contribute less funding for neighborhood schools as a result of lower property values.
This has racial and spatial consequences in funding within Marion County. Three quarters percent of Indianapolis Public School (IPS) students are non-white, while only 27 percent of neighboring Beech Grove School District students are non-white. A 2019 report on education funding found that there was a $3,000 per student difference in funding between IPS and neighboring district Beech Grove City, with IPS students suffering as a result.
In Marion County there is no good data showing how many school transfers are due to housing loss, however based on key informant interviews, the relationship between evictions and school transfers appears significant. According to a local shelter case manager, evicted families are often forced to find housing in parts of the city that belong to a new school district, particularly the underfunded IPS. The significant implications of housing loss on educational achievement warrant further research.
Homelessness: Housing instability may result in homelessness if households are unable to quickly find new housing. In 2019, two-thirds of those experiencing homelessness in Marion County were housed in emergency shelters, 26 percent in transitional housing, and 7 percent were unhoused. A quarter of those without permanent housing are families—living in motels, with family members for a period of time, in shelters, or on the street.
The racial disparities of those experiencing homelessness are again clear in the county. While Black residents make up only 30 percent of the population, they account for over 60 percent of those experiencing homelessness.
As in other places, homelessness in Marion County can be chronic and intergenerational, with a single instance of housing loss spiraling into a lifelong struggle passed down from parents to their children. A case manager at a local homeless shelter recalled providing intake for a woman who came to the shelter with her children. The woman had remarked that she herself had been in that same shelter when she was a child. She had struggled with housing insecurity as a child, and her children were now experiencing it too.
Neighborhood Neglect: Indianapolis alone has over 6,800 abandoned properties. Often unkempt, these eyesores continue to harm disenfranchised communities by devaluing their land, decreasing the tax base, and increasing crime, as found in a 2017 report by Community Blight Solutions. The Indianapolis Star found that non-resident property investors own around 40 percent of all abandoned homes in the city, preventing community organizations from rehabilitating them. The Fair Housing Center of Central Indiana has three ongoing legal challenges against Fannie Mae, Bank of America, and Deutsche Bank alleging they market and maintain properties differently in majority Black neighborhoods than majority white neighborhoods.
We found that neighborhoods with large amounts of vacant properties also experience higher rates of evictions and foreclosures.
Foreclosures contribute to this rise in investment property ownership in Marion County, as the county’s tax sale program allows for investors to purchase some homes for as little at $500. Foreclosed properties can be lucrative for investors who purchase them cheaply, put relatively little money into them, and turn them into either rental units or predatory rent-to-own contracts. Many of these homes then suffer from continued disinvestment and thousands of code violations. The Indianapolis Star found that one particular San Diego-based real estate company, which owns over 600 properties in Indianapolis, has three times as many code violations as any other property owner.
A local housing advocate expressed concern that investors who purchase multiple properties through the county tax sale program lack interest in the overall condition of the neighborhoods in which they are purchasing properties. This drives underinvestment in developing amenities or providing quality housing in these areas.
Policy Recommendations
Marion County’s housing problems, sustained through previous generations, will continue into the future unless city and state leaders act. Protecting renters, especially those who are financially vulnerable, can help prevent a housing loss-driven downward spiral, and contribute to the economic stability and growth of the city.
City of Indianapolis leaders in both public and private sectors are striving toward inclusive economic growth. However, issues stemming from property investors profit driven actions that harm the health of the communities in which they own property. This contributes to low-income residents financially struggling, and hinders city efforts to create more equitable growth and opportunity among all residents and neighborhoods throughout the city.
Certain policy solutions were voiced across all three of our case study locations; we included these commonly proposed solutions in our policy recommendations section, as we believe them to be broadly applicable across the country. These recommendations include but are not limited to: improving housing loss data; expanding the social safety net and increasing wages; expanding affordable housing options through voucher programs, trust funds, and tax credit programs; and increasing parity between landlords and tenants, for example by improving tenants legal rights. In addition, below are three policy recommendations that were unique to our Marion County case study.
Incentivize Property Maintenance: The City of Indianapolis should consider partnering with the Department of Business and Neighborhood Services (BNS) and Marion County Public Health Department to ensure all landlords are registered with the city’s Landlord Registration Program. The city currently requires landlords to register, however the registry remains incomplete. With over 160,000 renter households in the city, maintaining an updated landlord registry is essential to ensuring proper maintenance of units. Landlords that have repeated code violations should have their certificate of occupancy revoked until issues are resolved.
Establish Property Ownership Tracking Programs: Creating government programs that track who is purchasing property within Marion County would help decision makers better understand trends in low-income and gentrifying areas, where there is risk for exploitation. These policies should require buyers to declare at point of purchase if the property will be owner-occupied or rented, which may help to ensure landlords are registered.
Amend the Marion County Tax Sale Program: Marion County should immediately amend their ongoing tax sale program. The county should consider policies that would prioritize the sale of these homes to nonprofit organizations working to build more affordable housing and to rehabilitate neighborhoods. The county should also prohibit the sale of properties through this program to landlords who do not have an established history of renovating and providing quality housing, and should consider restricting sales to out-of-town purchasers.
Conclusion
We began this research in 2019 to examine housing loss across the United States, and at a localized scale in Marion County. We could have never predicted that we would release our report in the midst of an unprecedented crisis, with tens of millions of Americans at risk for eviction and foreclosure as a result of the economic fallout of a global pandemic.
We have seen firsthand in the last few months how policy measures can help keep people in their homes. These policies, including nationwide moratorium on evictions, foreclosures, and utility shut-offs, deferments on mortgages, rapid expansion of federal housing voucher programs, and direct rent relief through local public housing authorities have helped to prevent a wave of housing loss that we believe is coming as programs begin to expire.
However, these policies must be targeted to communities most in need, and so we need to know who those communities are, and where they live. While the economic shocks resulting from COVID-19 are unique, we do believe that past housing loss provides an indication of future housing loss, even in these unprecedented times. As such, we hope this granular examination of where exactly evictions and foreclosures are most acute, and which communities are traditionally most impacted, will help municipal leaders and advocates direct outreach and resources in this time of crisis.
The COVID-19 pandemic may have elevated the urgency of eviction and foreclosure, but housing loss is a scourge even in times of relative calm. We must develop long-term policies to combat this systemic ill.
We also acknowledge that, in Marion County, the work is not done. More research is needed to better understand the relationship between out of state property owners and housing loss, assess the impacts of gentrification, and develop pathways for tenants to assert basic habitability rights without being evicted.
Citations
- From an interview with the authors.
- Unigov is short for “unified government.”
- In order to generate an indicator of housing loss based on the total number of evictions and mortgage foreclosures, we created two new variables: housing loss rate and housing loss index. The housing loss rate reports the total number of evictions and mortgage foreclosures as a proportion of the total number of renters and homeowners with a mortgage in a given geography (here, Census tract). The housing loss index reports the housing loss rate by Census tract as a proportion of the mean (average) housing loss rate across the entire county. As a benchmark for interpretation, a housing loss index of 1 indicates that the Census tract under consideration has a housing loss rate equal to that of the county average, while an index of 3 indicates that the Census tract has a housing loss rate that is three times the county average.
- From an interview with the authors.
- From an interview with the authors.
- From an interview with the authors.