Congressional Staffers’ Job Satisfaction, Career Trajectories, and Compensation
These 30,000-foot, chamber-wide changes in legislators’ priorities have certainly impacted staff pay in Congress. But the trends themselves do not reveal how individual staffers experience work in Congress, and how that experience affects their career prospects and salary. Here, we rely on our Congressional Capacity Surveys (CCS) that integrate information from publicly available payroll records with specific details on staffers’ educational and professional backgrounds, knowledge of policy and legislative procedure, and political and social identities. The data from nearly 800 staffers responding to both CCSs better reveal how their personal and professional characteristics are associated with future career trajectories, job satisfaction and sense of belonging, and salary. We assess and compare job satisfaction and career trajectories across several categories: employer’s party, chamber, office type, staffers’ own ideology and party identity, job responsibility, seniority, and demographics.1
Staffers’ Employing Offices
Our sampling process intentionally screened Washington, D.C.-based staff who can reasonably be expected to impact the policymaking and representational responsibilities across a variety of employing offices. In other words, we focused our attention on political appointees working on Capitol Hill.
Table 1 shows that three in five staff work on the House side, despite House members outnumbering senators by more than four to one. There are more staff per members in the Senate, though both chambers have roughly the same number of committees with similar jurisdictions.
Table 1 | Staffers by Employing Office (Percent)
| 2017 | 2019 | Combined | ||
|---|---|---|---|---|
| Chamber | House | 58 | 60 | 59 |
| Senate | 42 | 40 | 41 | |
| Office Type | Personal | 69 | 69 | 69 |
| Committee | 24 | 27 | 25 | |
| Party leadership | 6 | 5 | 5 | |
| Party | Democrats | 44 | 55 | 49 |
| Republicans | 56 | 46 | 51 | |
| Primary Responsibility | Communications | 10 | 15 | 13 |
| Legislative | 74 | 70 | 72 | |
| Political leadership | 16 | 15 | 16 |
Notes: Cells are weighted frequency percentages. Rounded percentages may not sum to 100 percent.
Employing offices follow a familiar pyramid structure based on the hierarchy of offices on Capitol Hill. Seven in 10 staffers work in members’ personal offices, whereas only one in 20 work in party leadership. The combined party breakdown is split evenly, with Republican offices employing more staff in 2017 when they were the majority in the House, and vice versa for Democrats in 2019. The weighted employing office frequency patterns in Table 1 suggest our survey respondents are representative of staffer population level data.
Staffer Race and Gender Identity
Between all of these employment categories, about 6,500 political-appointee staffers work on Capitol Hill,2 Even so, the most common demographic profile for a typical staffer is a white male with a bachelor’s degree who works as a legislative assistant in a majority party House members’ personal office. In general, there is a longstanding and significant underrepresentation of Black, Indigenous, and people of color (BIPOC) among Hill staff. For example, people of color only made up 14 percent of all top House staff3in 2019 and 11 percent of top Senate staff in 2020. Though these numbers are still low—and are lower than the percentage of BIPOC in the greater American population—they both represent significant improvements in recent years.4
This fact is borne out by a conversation with a senior House committee staffer in 2017. When one of the authors pointed out that she was the first Black woman he interviewed among the nearly 50 interviews he had conducted among House and Senate senior staff, she noted that:
I'm the first African-American staff director of this committee…When they say it's “the last plantation,”5 they're not that far off. Unfortunately, I'm normally one of very few African Americans at the table for most high-level policy discussions.
This anecdote is most certainly true in a general sense, but extremely difficult to dig further into using survey methods. Precisely because white staffers make up the overwhelming share of those within the institution, our survey samples of BIPOC staff are simply too small to present detailed breakdowns of responses by identity. Therefore, our inability to use this survey data to speak to issues of race in Congress and the potential impacts—beyond rough estimates at demographics in most cases—is, itself, a result of the severe diversity problem within the institution.
The data presented here are from our external data provider, LegiStorm. What we present is limited by the format and manner in which these data have been collected.6 Despite their shortcomings, however, these data reveal that the population of congressional staff is considerably more white than the population they serve.
Table 2 presents the racial and ethnic demographics of the 6,505 congressional staffers in the 2019 Congressional Capacity Survey sampling frame. Overall, Democratic offices employ 73 percent Caucasion staffers. Republican staffers are almost exclusively Caucasion at 94 percent. In total, BIPOC staffers represent less than seven percent of all Republican staff, and just over one quarter of Democratic staff. In contrast, the U.S. census estimates that only 60.1 percent of the U.S. population is white, non-Hispanic.
Table 2 | Staffer Race and Ethnicity, by Party (Percent)
| Race/Ethnicity | Democrats | Republicans | Difference |
|---|---|---|---|
| Caucasian | 73 | 94 | -21 |
| Black | 12 | 2 | 10 |
| Hispanic | 7 | 2 | 5 |
| Asian-American/Pacific Islander | 7 | 2 | 5 |
| Arab/Persian | 1 | < 1 | < 1 |
| American-Indian/Alaska Native | < 1 | < 1 | < 1 |
| Biracial | < 1 | 0 | < 1 |
Notes: N = 6,505 staff meeting our sampling criteria, described in detail in section 6.2.
Using this same external data provided by LegiStorm, we report congressional staff gender by party in 2019 in Table 3. Democratic staff are evenly split, whereas males are overrepresented among Republican staff.
Table 3 | Staffer Gender, by Party (Percent)
| Democratic | Republican | |
|---|---|---|
| Male | 50 | 60 |
| Female | 50 | 40 |
Notes: N = 6,505 staff meeting our sampling criteria, described in detail in section 6.2.
As with the race and ethnicity information, here we are limited to LegiStorm codes identifying staffers exclusively with a binary salutation of “Mr.” or “Ms,” which does not fully reflect staffer gender identity. As such, these data do not speak to the significant issues of representation of gender non-conforming and trans people in Congress.
In the 2019 CCS, we ask a more nuanced question regarding gender identity: One out of 249 staffers that answered this question self-identified as trans and zero staffers self-identified as non-binary, or opted to self-describe using the free text field provided.
Analysis of our survey respondents does reveal important differences in legislative staff by gender. Female staffers are substantially more likely to hold jobs of mid-level seniority, such as legislative assistant. But, women are less likely to serve in senior positions like CoS or legislative director than their male counterparts.7 These results are similar to studies showing women face significant challenges rising through the staff hierarchy on Capitol Hill.
Table 4 | Staffer Seniority, by Gender (Percent)
| 2017 | 2017 | 2019 | 2019 | |
|---|---|---|---|---|
| Male | Female | Male | Female | |
| Senior | 22 | 17 | 33 | 22 |
| Mid-level | 55 | 67 | 56 | 69 |
| Junior | 22 | 16 | 11 | 9 |
Notes: Cells are weighted frequency percentages. Rounded percentages may not sum to 100 percent.
Staffers’ primary responsibility is gendered as well. Table 5 shows the percentage of men and women in different roles. While female staffers served in legislative functions at similar rates in 2017 and 2019, they were substantially more likely to serve in communications and less likely to serve in the political leadership functions, which are often the most highly compensated and powerful within an office.
Table 5 | Staffer Responsibility, by Gender (Percent)
| 2017 | 2017 | 2019 | 2019 | |
|---|---|---|---|---|
| Male | Female | Male | Female | |
| Political Leadership | 18 | 11 | 17 | 11 |
| Legislative | 74 | 75 | 70 | 71 |
| Communications | 8 | 14 | 14 | 17 |
Notes: Cells are weighted frequency percentages. Rounded percentages may not sum to 100 percent.
Staffer Age and Tenure on Capitol Hill
The CCS and the associated payroll data for staffers in our sample reveal several intuitive and surprising results. We know staff age and tenure have been declining on Capitol Hill since at least the mid-1990s.8 Here, we dig deeper to reveal what individual factors are associated with age and tenure.
Table 6 reveals that the typical staffer is between 26 and 30 years old. Capitol Hill is staffed primarily by Millennials. Roughly 60 percent of the congressional staffer population is under the age of 35, and 75 percent under 40 years old. Most members are Baby Boomers, but less than 10 percent of their staff are of the same generation.9
Table 6 | Staffer Age (Percent)
| 2017 | 2019 | Combined | |
|---|---|---|---|
| Under 25 years old | 15 | 13 | 14 |
| 26-30 | 25 | 27 | 26 |
| 31-35 | 18 | 22 | 20 |
| 36-40 | 14 | 17 | 15 |
| 41-45 | 11 | 9 | 10 |
| 46-50 | 5 | 6 | 6 |
| 51-55 | 5 | 3 | 4 |
| 56-60 | 3 | 2 | 2 |
| 60 or older | 4 | 1 | 3 |
Notes: Exact age is binned to maintain respondent confidentiality. Cells are weighted frequency percentages. Rounded percentages may not sum to 100 percent.
Staffers can’t grow old in their jobs if they don’t stay very long. In 2019, the average tenure for staff on Capitol Hill is 3.1 (SD = 1.9) years, which may vary between 2.9 and 3.3 for the full population of staffers due to sampling uncertainty.10 Despite that short time in the institution, staff hold multiple positions within an office and may move between offices. Just over half of staffers in our survey held three separate or more job titles, and two-thirds have worked for at least three separate employing offices. Results not shown here show that tenure in the job does not vary much across different employing offices.
However, the number of years working in Congress does vary meaningfully for senior staff and for those in political management positions. Figure 6 is a box-and-whiskers scatterplot for tenure in Congress by the three primary responsibilities in a Washington, D.C. personal office. The median communications and legislative staffers’ tenure have roughly three years of experience on the Hill each, reflecting the overall average. However, communications staff are more concentrated around the average tenure.
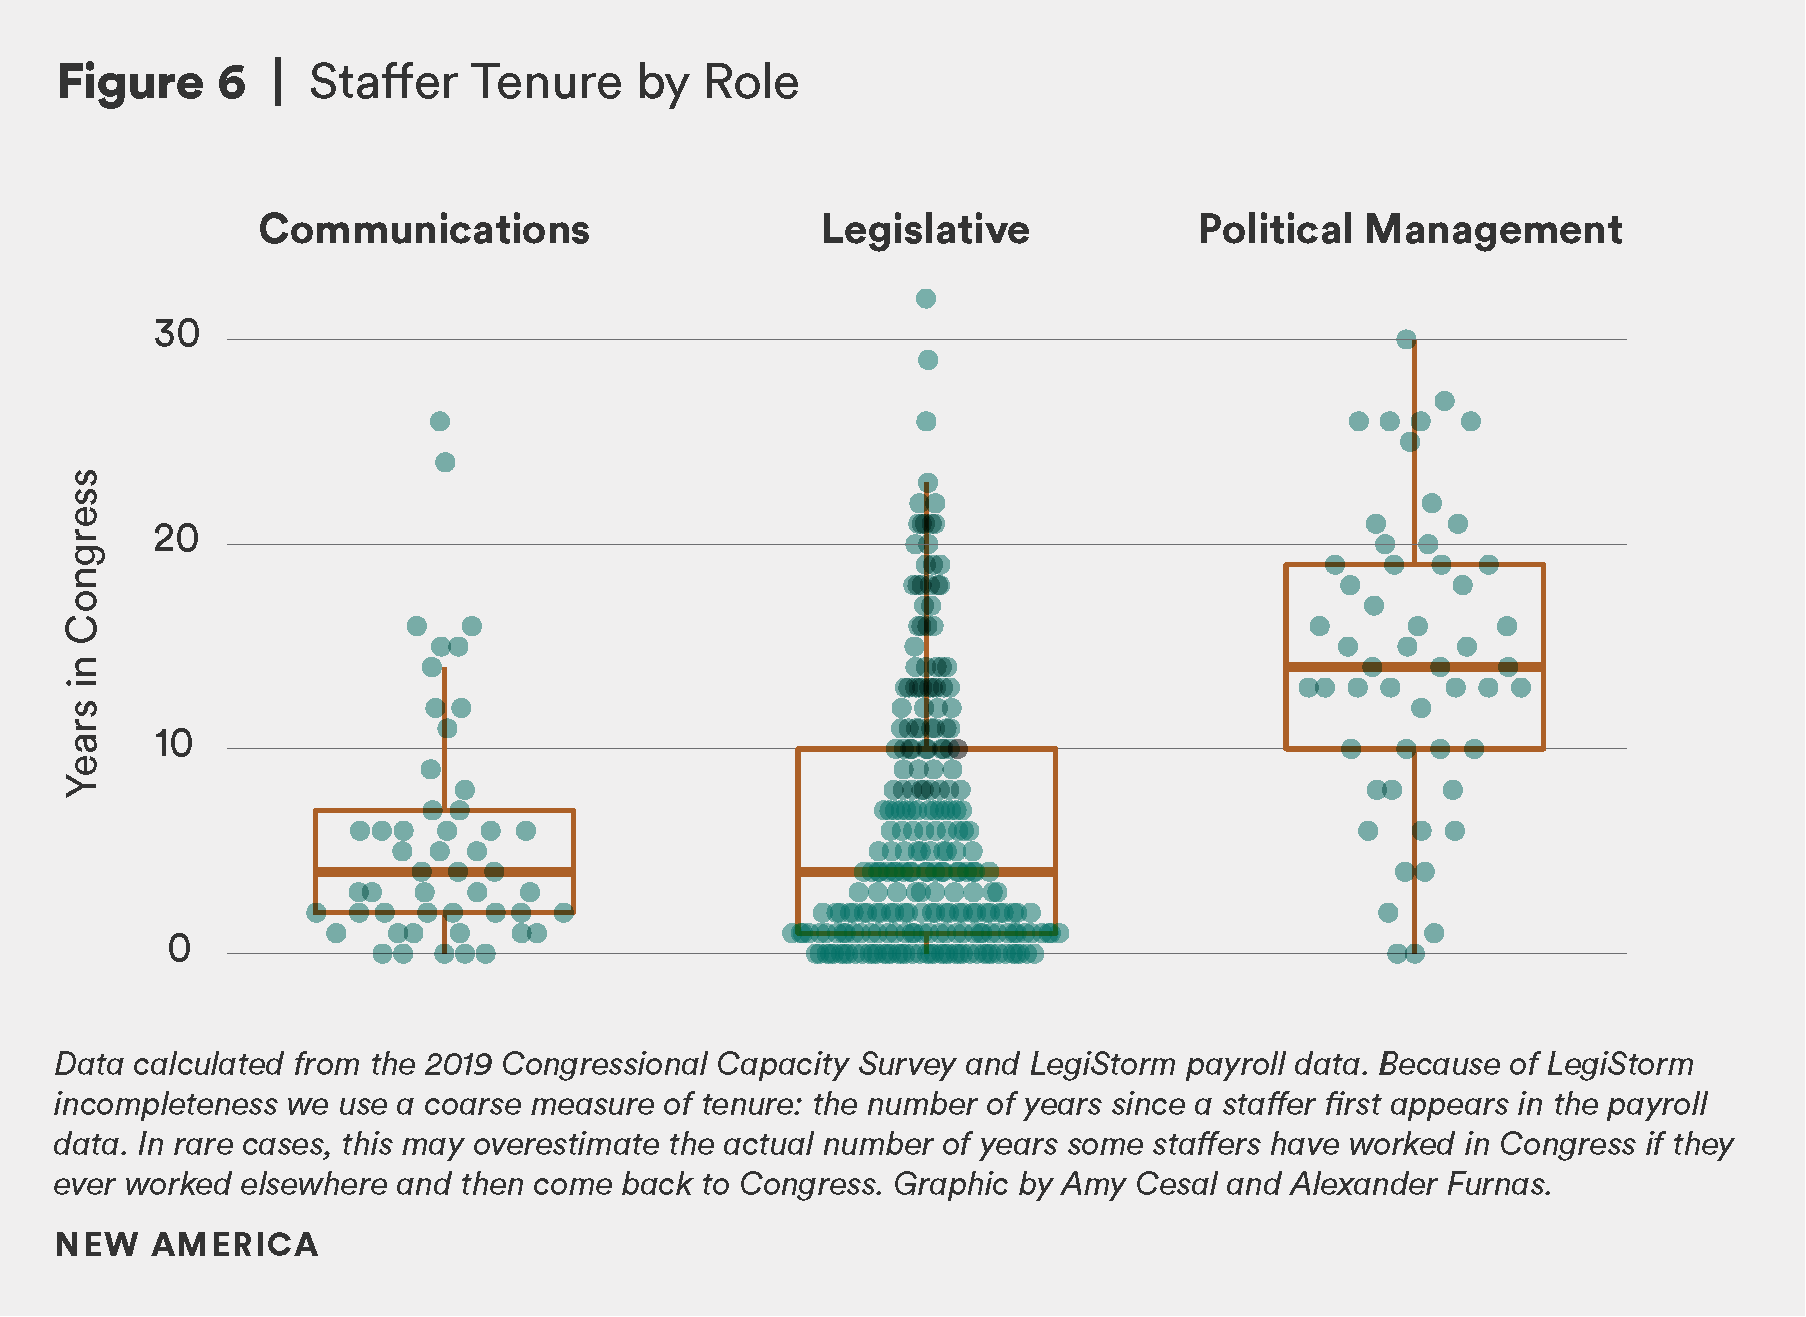
Alternatively, staff in the upper quartile (e.g., those above the box) have at least 10 years of experience in Congress. But these long-serving legislative staffers are not the norm. The concentration of staff around the bottom quartile reveals that most staff that manage policy portfolios in Congress have only one or two years of experience. That is, roughly one-third of legislative staffers have not yet served the duration of a single Congress.
Senior staffers in political management positions on the other hand are highly experienced in Congress, as may be expected. The typical staffer in a political management role has spent more than 14 years on Capitol Hill, and the outliers above the 75th percentile have been on the Hill for 20 or more years. This experience is greater than the typical member, who in the 116th Congress has served 8.4 (House) or 10.1 (Senate) years.11
Career Trajectories on Capitol Hill
Most staff work in Congress for very little time compared to most professions.12 And, they typically get started with an unpaid or low-paying internship. Though the House and Senate have recently set aside money outside the MRA and SOPOEA to fund internships, most current mid- and senior-level staffers were not eligible for them when they got their start. And, though these funds are a step in the right direction, the House makes only enough money available for one FTE intern per office at a rate of $15 per hour; the Senate internship money can fund two FTEs.13
In addition, anecdotal evidence from interviews and conversations with current staffers suggests that many started their internships after graduating college. This practice amounts to unpaid or extremely low-paid labor, but no publicly available evidence exists to know how common the practice is. As a consequence of the sellers’ labor market we document above, it is not surprising that staff are willing to accept unpaid work as a foot in the door.
Just over half of all respondents started their congressional staff careers as interns. Table 7 shows a fairly sharp decline from 2017 to 2019, though that may be due to the Democrats’ net gain of 41 seats in the 2018 elections. With 90 new members of the House and nine freshman senators, it is likely that new members recruited a disproportionately large number of staff from the campaign trail or from previous elected offices.
Table 7. Staff Starting in Congress as Interns
| 2017 | 2019 | Combined | |
|---|---|---|---|
| No internship | 41 | 50 | 46 |
| Internship | 59 | 50 | 55 |
Notes: Cells are weighted frequency percentages. Rounded percentages may not sum to 100 percent.
The overwhelming majority of staff who did start with an internship did so without any pay. Table 8 reveals that more than four in five (83 percent) started with an internship in Washington, with only 10 percent starting in a district or state office. Unpaid internships outnumber paid internships at nearly four to one (ratio: 3.7:1). That is, 79 percent of internships on Capitol Hill are unpaid, a rate almost twice that of the private sector.14 All told, more than two of every five staffers on Capitol Hill started their careers as unpaid employees of the legislative branch.15
Table 8 | Paid and Unpaid Internships in Congress
| 2017 | 2019 | Combined | |
|---|---|---|---|
| Washington, DC office | 57 | 72 | 64 |
| District or state office | 15 | 5 | 10 |
| With campaign | 5 | 4 | 5 |
| Washington, DC office | 19 | 17 | 18 |
| District or state office | 1 | 0 | 1 |
| With campaign | 2 | 2 | 2 |
Notes: Cells are weighted frequency percentages. Respondents include only those responding “internship” reported in Table 3. Rounded percentages may not sum to 100 percent.
Of course, internships offer valuable work experience and exposure to how Congress works, and Congress (as well as other government and nonprofit employers) is not bound by the Fair Labor Standards Act, which applies only to for-profit employers. Furthermore, Congress is generally exempt from the labor laws it enacts, and is bound only by its own rules, constitutionally. Each chamber has adopted some workplace protections such as those for sexual harassment, but the rules typically permit members to hire and fire staff as they please. In principle, though, there is nothing stopping employing offices from following labor law guidelines for congressional interns, especially because they so frequently mark the beginning of staffers’ careers.16
In addition to being unpaid, internships are frequently the product of networking opportunities, which further limits access to future careers on the Hill. According to the senior staffer who is “normally one of very few African Americans at the table,” despite efforts on the Hill to conduct outreach, there are often fewer professional network opportunities for prospective BIPOC interns, compared to their white peers.
We try to do pipeline stuff. So we work with [Historically Black Colleges and Universities,] and the caucuses.17 All the caucuses have programs, like fellowship and internship programs… I think you have to be very intentional about it because you know that only some people are getting into the internships in the first place. So you just have to be very intentional about it. We do significant outreach and try to make sure we're always letting people know.
More precise data on interns and their experiences was not available for this study, as LegiStorm data on interns and entry-level positions are not available and very few or no interns responded to the CCS survey. However, a study conducted by Dr. James Jones estimates that in the summer of 2019, the House of Representatives’ intern class was 64 percent white, 13 percent Black, 5 percent Hispanic/Latino, 11 percent Asian/Pacific Islander, 0 percent Native American, and 3 percent Middle Eastern/North African.18 Ultimately, the dependence on unpaid internships for future careers on Capitol Hill suggests that they act as a significant obstacle to developing a more diverse legislative workforce.
Internships are how most staffers enter Congress. How do they exit? The low pay and long hours (see below) are associated with the decades-long trend that staffers’ tenure in Congress is decreasing. But the aggregate data do not speak to the reasons why staff leave or where they plan to go. The CCS permits us to dig deep into individual staffers’ intent to stay or leave Congress, and if they leave, where they anticipate going.
Table 9 reveals that 65 percent of staffers plan to leave Congress within five years. But on Capitol Hill five years is a professional lifetime. More than two of every five staffers plan to leave within just two years. That is, 43 percent of staff plan to depart by the end of the Congress in which they are employed. In the business and nonprofit world, an organization expecting to lose nearly half its workforce by the end of its industry’s normal business cycle would be considered a colossal failure. Congress, on the other hand, is reducing staffers’ pay while expecting unusually long hours.
Table 9 | Intent to Leave Congress (Percent)
| 2017 | 2019 | Combined | |
|---|---|---|---|
| Within 1 year | 10 | 18 | 14 |
| 1-2 years | 34 | 23 | 29 |
| 3-5 | 33 | 30 | 32 |
| 6-10 | 20 | 15 | 18 |
| More than 10 | 12 | 14 | 13 |
Notes: Cells are weighted frequency percentages. Rounded percentages may not sum to 100 percent.
Only a small proportion of staff—6 percent across both surveys—anticipate working in Congress until they retire. Roughly half intend to stay in government or in public service more broadly. The remaining 43 percent plan to move into the private sector in some capacity. In 2019, staff in Democratic offices (64 percent) were about twice as likely to want to stay in public service than their Republican counterparts (36 percent).
Table 10 | Ideal Next Career Step (Percent)
| 2017 | 2019 | Combined | |
|---|---|---|---|
| Likely retire | 7 | 5 | 6 |
| Move into private sector | 45 | 41 | 43 |
| Stay in government | 48 | 54 | 51 |
Notes: Cells are weighted frequency percentages. Response of “Don’t know” or “other” excluded. Rounded percentages may not sum to 100 percent.
Among those staff who envision staying in government in some capacity, more than half (55 percent) hope to stay in Congress. Therefore, the conditional probability that a person plans to both stay in government and continue working in Congress (rather than seek any other option in the public or private sector) is only 28 percent. Another way to look at these results: Congress is an unattractive employer in the long run for nearly half of the respondents who want to continue their careers in public service, and almost two of every five staffers overall.
Moreover, Table 11 shows the intent to stay in Congress declined from 62 percent in 2017 to 48 percent in 2019, a more than 14 percentage point drop. Staff are slightly more likely to want to move to a different office, which is consistent with Capitol Hill norms and research suggesting that experience for multiple members improves staffers’ professional reputations.19
Table 11 | Next Step if Staying in Government (Percent)
| 2017 | 2019 | Combined | |
|---|---|---|---|
| Stay in Congress, same office | 30 | 22 | 26 |
| Stay in Congress, different office | 32 | 26 | 29 |
| Move to the White House | 13 | 13 | 13 |
| Move to federal agency | 19 | 24 | 22 |
| Move to state government | 2 | 7 | 5 |
| Other | 4 | 8 | 6 |
Notes: Cells are weighted frequency percentages. Respondents include only those responding ”stay in government” reported in Table 6. Rounded percentages may not sum to 100 percent.
Roughly one-third of the staffer sample hopes to use their experience on Capitol Hill to move to the executive branch. Only about one in twenty plan to go to state and local government or some other form of government service, respectively.
Staff seeking to exit public service for the private sector mostly want to land on K Street. In Table 12, roughly half of the staffers who want to go into the private sector want to be a lobbyist.20 It’s no wonder, since staff can expect to earn at least three times as much as a lobbyist, and maybe more depending on their experience.21 No other option even comes close, with the general response of working at a think tank or university—which typically requires advanced credentials or decades of distinguished public service—coming in a distant second.
Table 12 | Next Step if Moving to Private Sector (Percent)
| 2017 | 2019 | Combined | |
|---|---|---|---|
| Government relations / lobbying / policy advising | 50 | 46 | 48 |
| Research / think tank / university | 10 | 19 | 15 |
| Start your own business unrelated to politics or government | 6 | 6 | 6 |
| Election campaign / campaign consulting | 2 | 2 | 2 |
| Political party organization (DNC, RNC, RNCC...) | 2 | 1 | 2 |
| Other (different industry, graduate / law school...) | 30 | 26 | 28 |
Notes: Cells are weighted frequency percentages. Respondents include only those responding “move into private sector” reported in Table 6. The “Other” residual category includes several response options that are inconsistent across 2017 and 2019. Rounded percentages may not sum to 100 percent.
The conclusion to draw here is that Congress—with its declining pay, demanding expectations, and short job tenure—is subsidizing the lobbying industry. For the most part, working on the Hill is an entry-level position for K Street, rather than a stepping stone for a career in public service. Members of Congress pay little attention to these trends so long as their immediate staffing needs are met, and staff use their brief experience on the Hill as a résumé boost. The taxpayers foot the bill, and special interests come out on top.
Workload and Job Satisfaction
Congressional staff are overworked and underappreciated. The average staffer works more than 50 hours per week and earns less than $40,000 per year. Table 13 reveals that in both Congresses about two-thirds of all staffers work more than 50 hours per week, and one in five work more than 60 hours. These kinds of wages and hours put the median staffer on par with truck drivers and oil-rig roustabouts.22
Table 13 | Number of Work Hours Per Week (Percent)
| 2017 | 2019 | Combined | |
|---|---|---|---|
| < 40 hours | 2 | 1 | 1 |
| 40-49 | 31 | 36 | 33 |
| 50-59 | 46 | 43 | 44 |
| 60-69 | 15 | 14 | 15 |
| 70 + | 6 | 5 | 5 |
Notes: Cells are weighted frequency percentages. Rounded percentages may not sum to 100 percent.
It is common for Washington offices to remain open during normal business hours fitting the district, and members typically expect staff to be present while in session or at after-hour events. Congress today, if they meet at all, typically do so Tuesday through Thursday. When Congress finds itself negotiating “must-pass” bills, the chambers can only act after party leaders reach 11th-hour agreements. As late evening and even weekend votes have become more common given shorter and fewer legislative work weeks—one impact of the Contract with America-inspired shift for members to “go home” as much as possible—it has become increasingly common for staff to be expected to work extended hours. These kinds of tasks are not common outside the congressional workplace, and are considered to be part of the job.
This extra time is not separately compensated. Coupled with relatively low annual salaries, this atmosphere contributes to the common view that staff are under-appreciated and that they need to leave the institution. Given the pressures of a sellers’ labor market on Capitol Hill and the strong norm of loyalty toward the boss, few staff feel empowered to work a typical nine-to-five work week.
Work hours are not distributed equally across all levels of seniority, though. More than one-third of senior staff—defined here as those with supervisory authority, such as CoS, committee staff director, legislative director, and the like—work more than 60 hours per week on average.
Table 14 | Number of Work Hours Per Week, by Seniority (Percent)
| 2017 CCS | 2017 CCS | 2017 CCS | 2019 CCS | 2019 CCS | 2019 CCS | |
|---|---|---|---|---|---|---|
| Junior | Mid-level | Senior | Junior | Mid-level | Senior | |
| < 40 hours | 0 | 3 | 0 | 0 | 2 | 0 |
| 40-49 | 34 | 34 | 18 | 32 | 42 | 23 |
| 50-59 | 44 | 48 | 45 | 59 | 41 | 43 |
| 60-69 | 13 | 11 | 26 | 9 | 11 | 25 |
| 70 + | 9 | 4 | 11 | 0 | 4 | 10 |
Notes: Cells are weighted frequency percentages. Rounded percentages may not sum to 100 percent.
Despite the long hours and low pay, staff at least superficially report that they are satisfied with their work, as shown in Table 15. Based on interviews and informal conversations with current and former staff, working in Congress—even though today’s “Executive-dominated” politics remains the focal point of any and all issues of the day—is exciting, prestigious, and stimulating.
Table 15 | Job Satisfaction: Staffers’ Sense of Belonging In… (Percent)
| Your Office? | Congress? | Institutional Deficit | |
|---|---|---|---|
| Very strong | 36 | 23 | -13 |
| Strong | 40 | 38 | -2 |
| Neither weak nor strong | 15 | 24 | 9 |
| Weak | 8 | 13 | 5 |
| Very weak | 1 | 2 | 1 |
Notes: This question was only asked in 2019. Cells are weighted frequency percentages. Rounded percentages may not sum to 100 percent.
Contrary to studies that ask direct questions about job satisfaction23 that are known to invite socially desirable responses, the 2019 CCS instead asked about staffers’ sense of belonging.24 The sense-of-belonging concept has been shown to more accurately reflect employees’ non-conscious feelings of engagement with their employers. And, more importantly, it is a superior measure to distinguish workers’ feelings of job satisfaction toward their specific employing unit and the employer more generally.25
Our results bear this out. More than three-quarters of staff feel a strong or very strong sense of belonging to their own office, suggesting staff feel engaged with their boss’s vision and strategy. In a recent study of a national sample of workers in a variety of industries, roughly 40 percent of people say they feel isolated. So, that only one in four staffers feel as if they do not belong in their employing office is a sign that the congressional workplace is doing something right. This is a puzzle: If employing offices do well to develop employee engagement, then why leave after only three years?
We asked staff to also rate their sense of belonging to the institutional as a whole, and the results offer some insight. Only about 60 percent of staffers feel very strongly or strongly to the institution as a whole. Given the low pay and the fact that Congress necessarily undergoes an institution-wide reorganization every two years, the relatively low sense of connection to the institution is not strong enough to retain staff.
We refer to the difference in sense of belonging to staffers’ own office and to Congress-at-large as the “institutional deficit.” In the last column of Table 11, we see a 15-point drop-off for staff who feel strongly or very strongly. In contrast to studies reporting relatively strong job satisfaction in Congress, this deficit suggests staffers’ connection to their jobs is on par with the typical worker in the national population. This is important because work in Congress assumes a strong public service motivation. Public service motivation is strongly correlated with a willingness to forego the material benefits offered in the private sector.26 Thus, work in Congress is a public service perfect storm: Rapidly declining wages, long hours, and the ever-present media and public perception that Congress is broken all make the K Street swamp an enticing career move.
Moreover, the relatively high sense of belonging to one’s employing office is not equal for traditionally underrepresented staffers. Table 16 reports the same office-to-Congress institutional deficit, but in relative terms for BIPOC and female staffers. In this table, the strong and weak categories are collapsed for simplification. In the cells are relative frequency percentages for each ethnic and gender category. The net deficit is the difference in institutional deficits between whites and people of color and between men and women, respectively.
Table 16 | Institutional Deficit for Minorities & Women
| Ethnicity | Ethnicity | Ethnicity | Gender | Gender | Gender | |
|---|---|---|---|---|---|---|
| BIPOC | White | Net Deficit | Female | Male | Net Deficit | |
| Strong / very strong | -23 | -14 | -9 | -19 | -12 | -7 |
| Neither strong nor weak | 20 | 8 | 12 | -2 | -2 | 0 |
| Weak / very weak | 3 | 6 | 3 | 0 | 0 | 0 |
Notes: This question was only asked in 2019. Cells are difference in weighted relative frequencies. Rounded percentages may not sum to 100 percent.
For the full population of staffers, the institutional deficit for sense of belonging is 15 percent in Table 15. However, the deficit for BIPOC staffers is a much higher 23 percent, for a net loss of 9 points. In other words, those staffers’ connection to Congress is much lower than the average employee nationwide. The same is true for women staffers, whose net deficit loss is 7 points. The number of women in the House and Senate has increased in recent years—most notably in 1992 and 2018—to be more descriptively representative of the population as a whole, but the data suggests that female staffers still experience lower feelings of belonging.
Staffer Knowledge and Expertise
An important implication of the high turnover and low tenure among congressional staff is that they have less time within the institution to develop specialized expertise that would make them more effective at their jobs. The CCS asks staffers several detailed knowledge questions to assess procedural knowledge about the institution and their policy knowledge in highly salient policy areas: health and budget. In other words, the CCS embeds a “pop quiz” within the survey on institutional procedures that are specifically tailored to the chamber in which they work. These factual questions could easily be Googled or quickly researched via CRS report, particularly as participants independently answered the survey questions online, but they are intended to measure instantaneous recall of highly specific questions that typically comes with higher order training and experience.
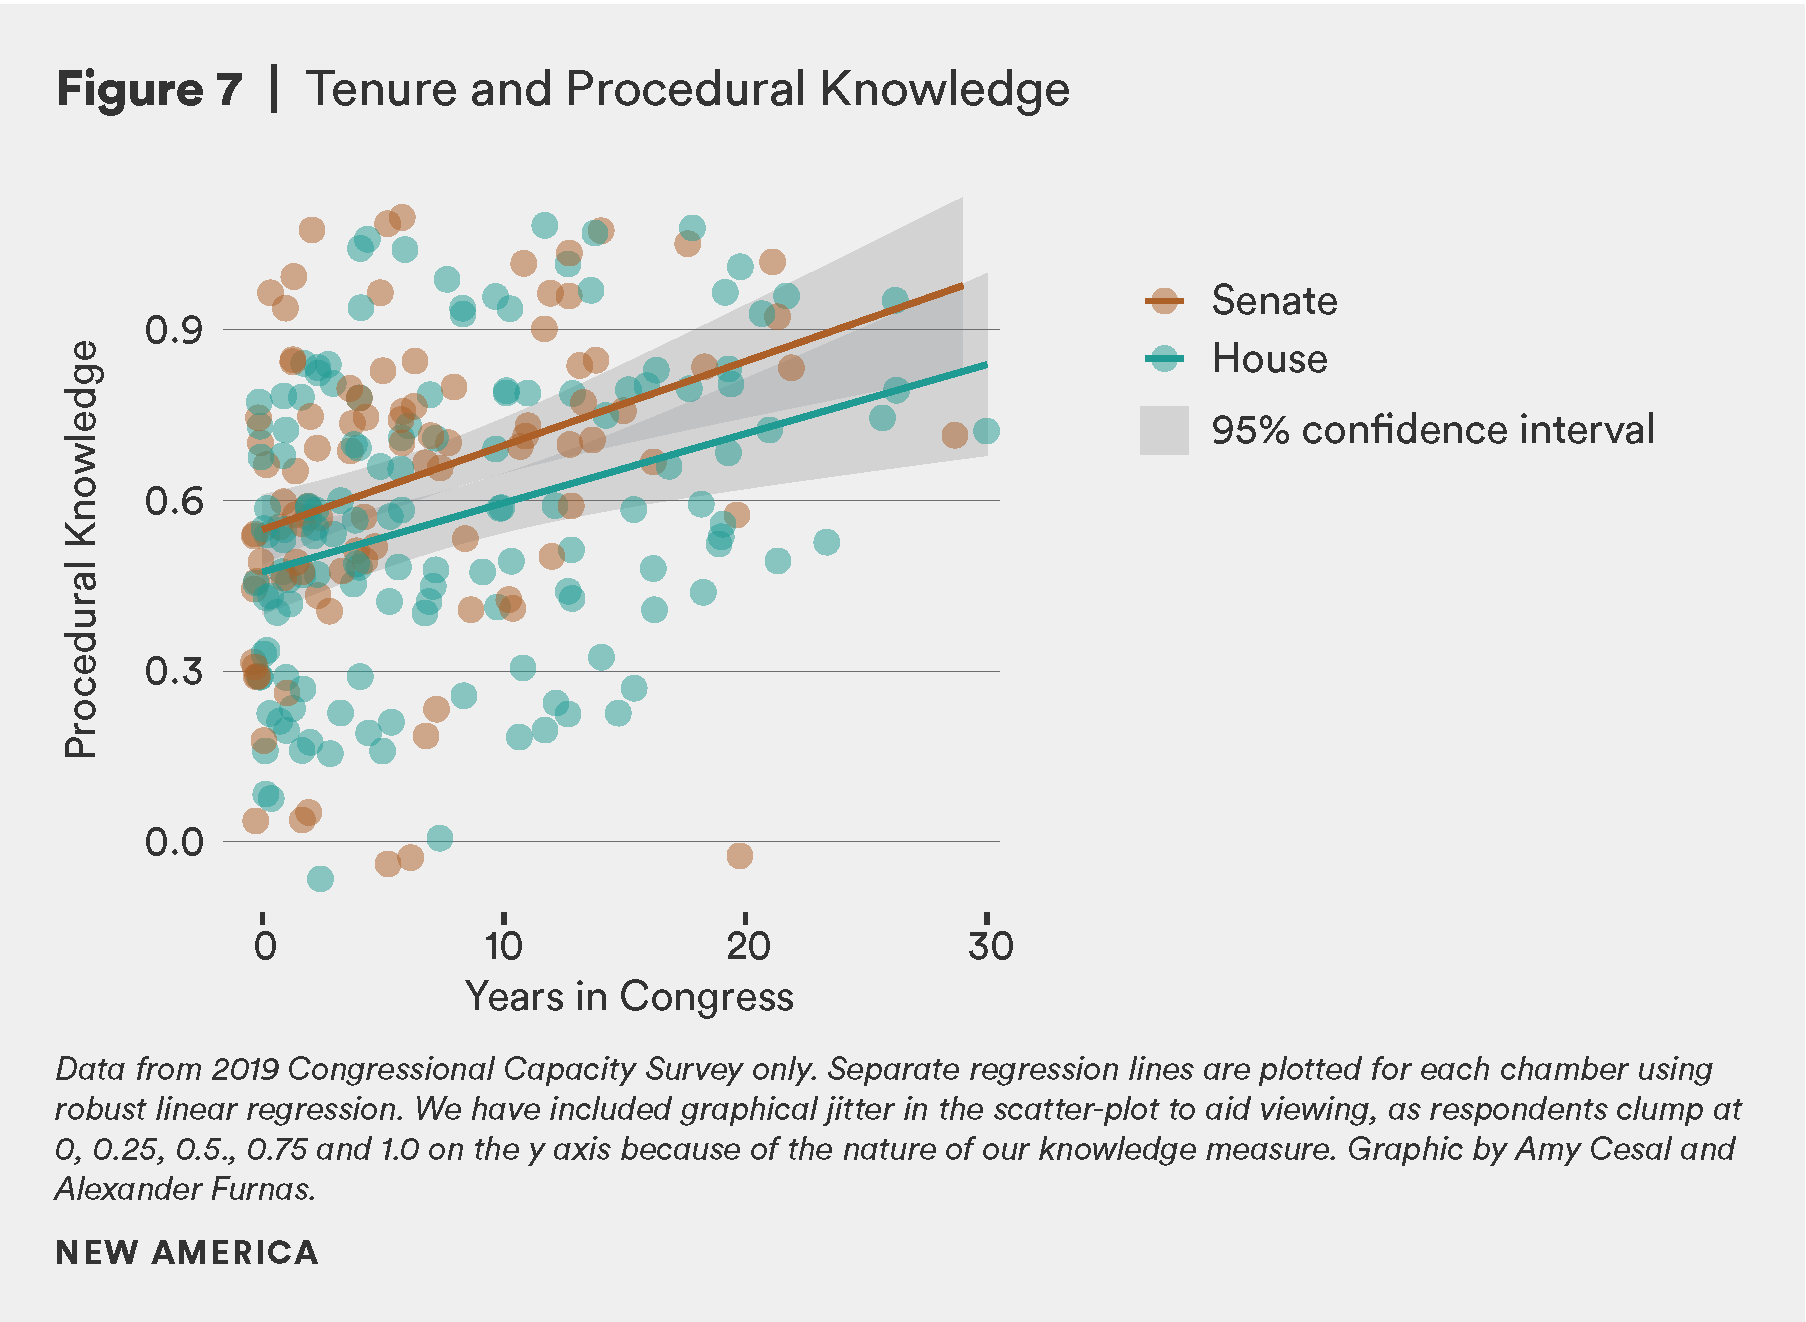
Our procedural knowledge batteries are made up of four questions such as “What does it mean to invoke ‘martial law’ in the House?” and “When does a cloture motion ripen?” We then construct knowledge variables using the percentage of answers in the battery that a staffer answers correctly.27
Figure 7 displays the relationship between staffers’ procedural knowledge and their tenure working in Congress. We find a robust relationship between time spent in the institution and staffers’ level of knowledge of the procedural intricacies of the institution. Interviews we conducted in 2017 bore out the importance of particularly knowledgeable staffers, skilled in legislative procedures at helping members of Congress achieve their policy goals. In addition, recent research notes that members with long-serving staffers are particularly effective, and that staffers have a measurable impact on their bosses’ agendas.28
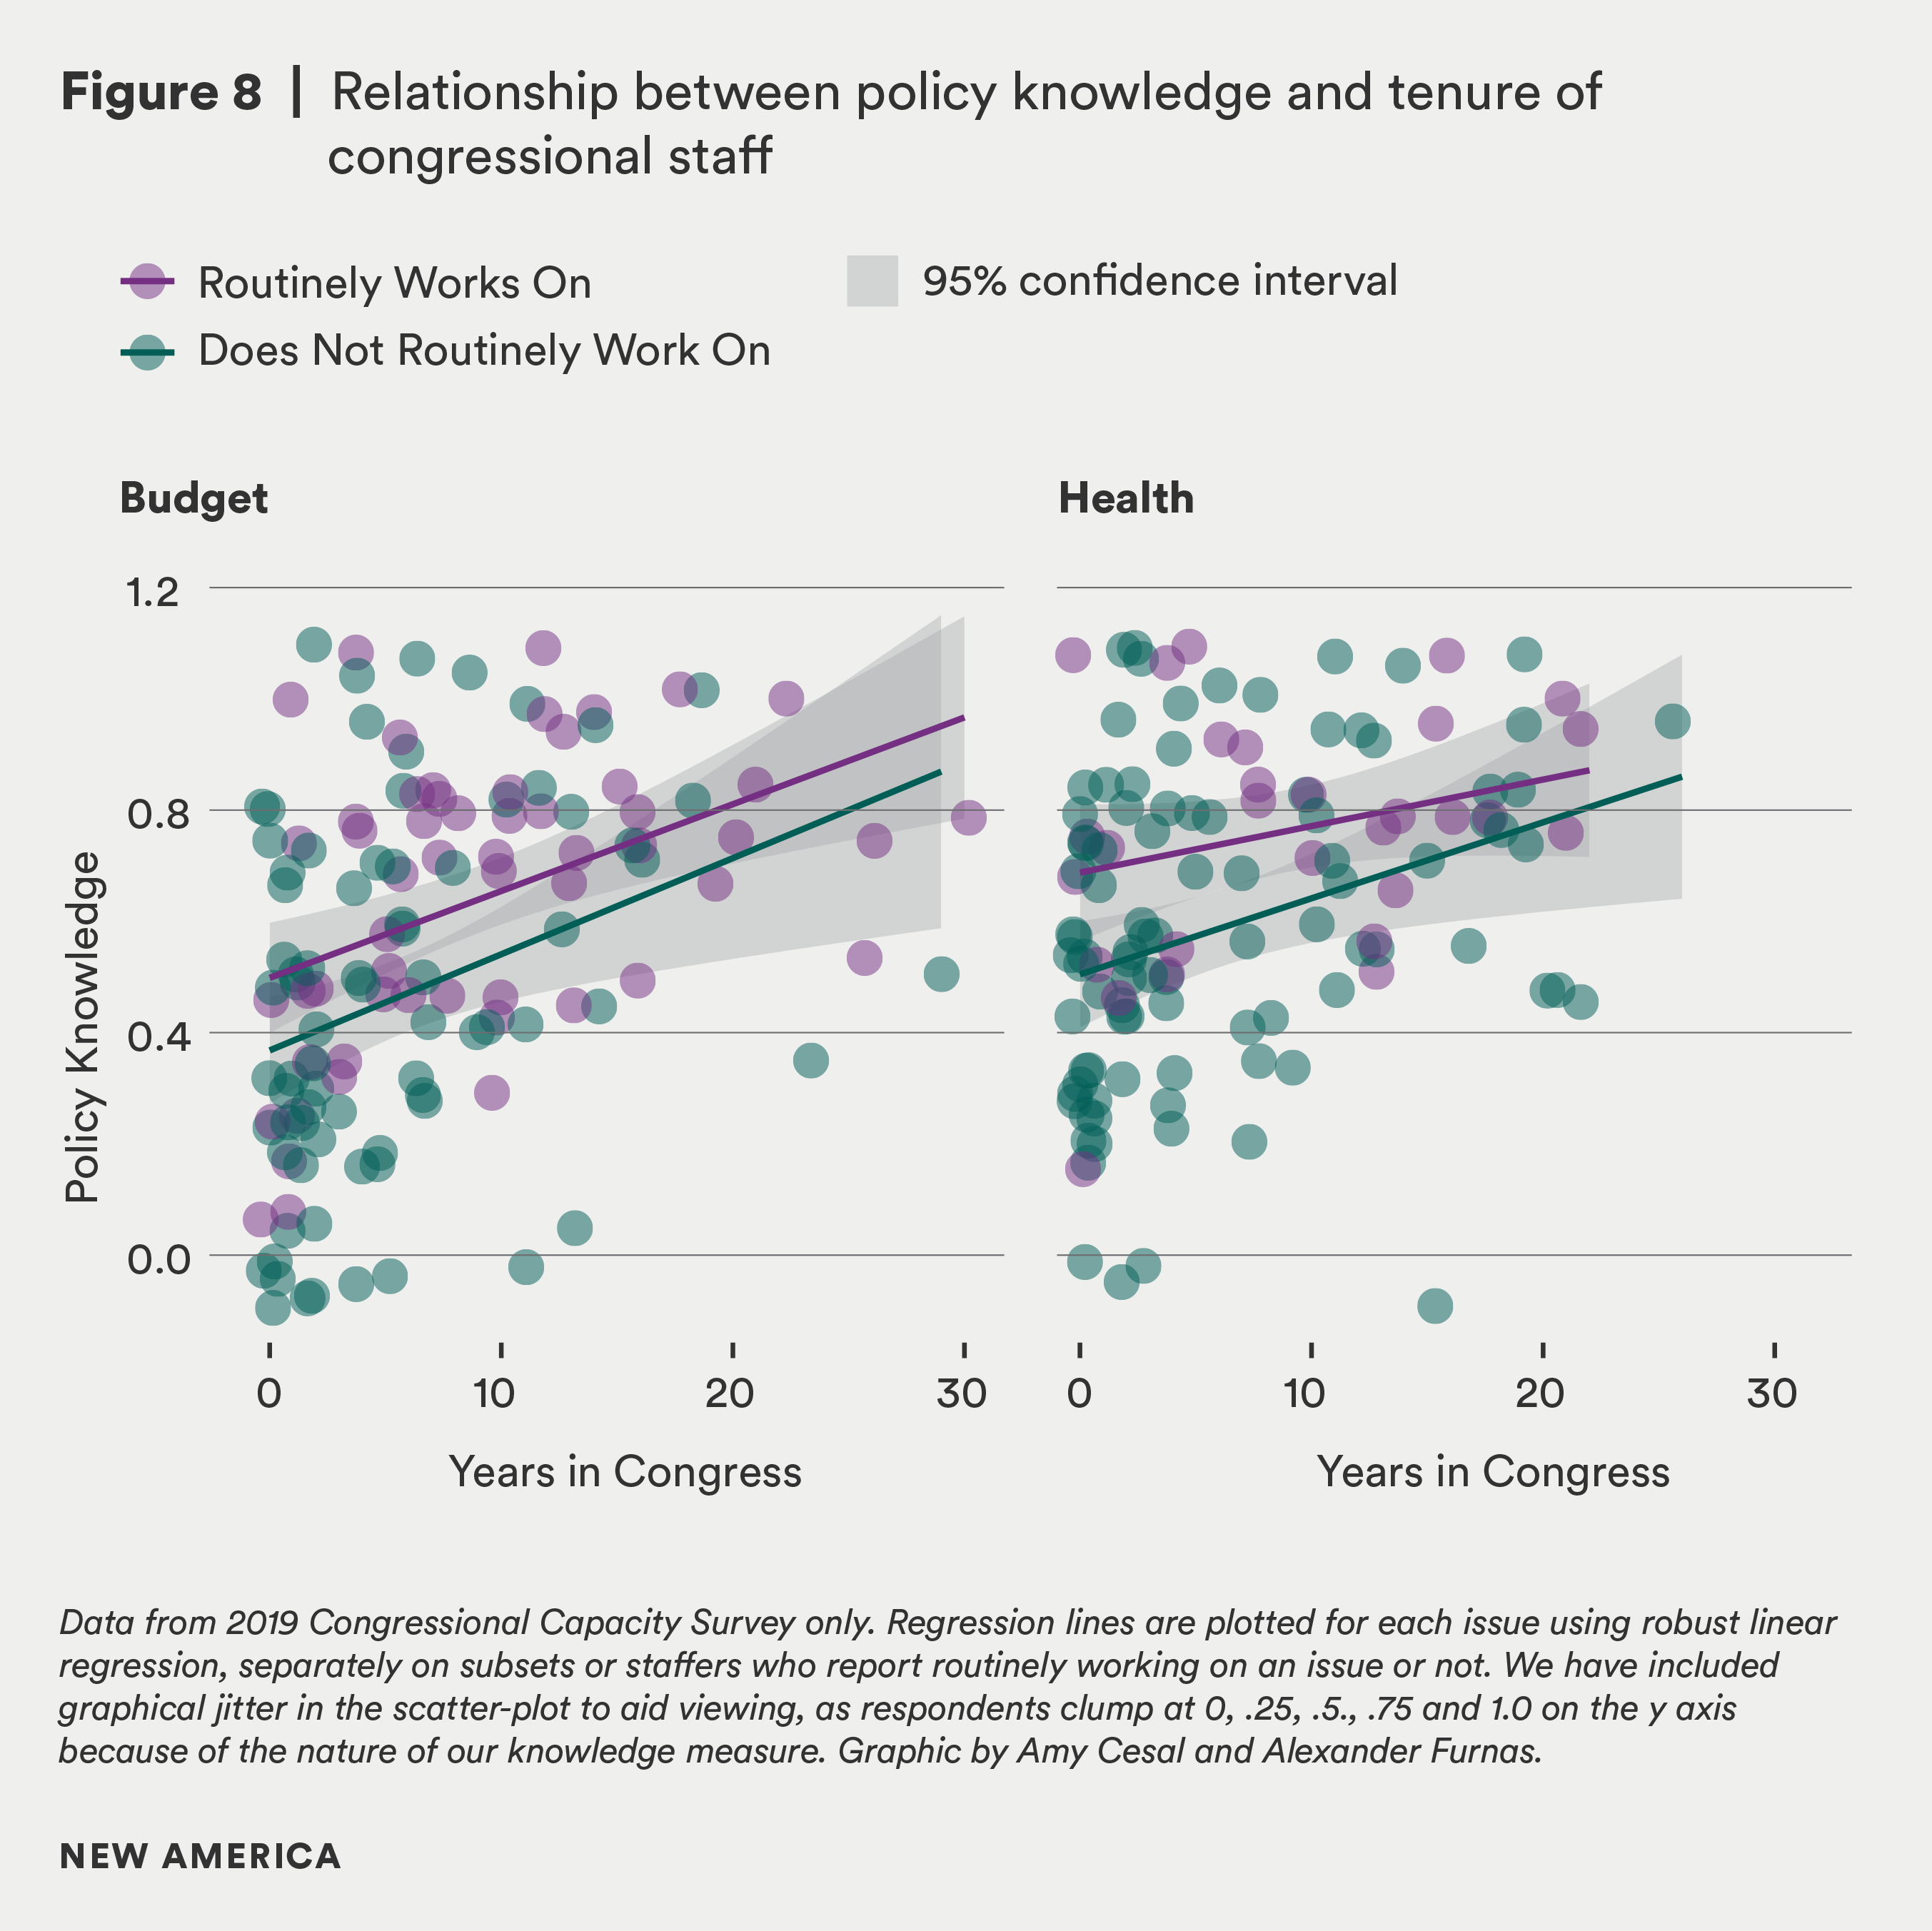
We assess knowledge of policy issues using the same approach we used to measure procedural knowledge. We had issue area experts draft four multiple-choice question batteries on budget and health issues (e.g. “About what percent of the federal budget is allocated through the annual appropriations process?” and “In 2017, total spending on health care in the US is ____, with roughly ___ spent on hospital care.”), and staffers were scored according to the percentage of questions they answered correctly.
We find a similarly strong relationship between tenure and knowledge of policy issues, shown in Figure 8. For both health and budgetary issues, staffers who have worked in the institution longer are more knowledgeable about the issues. This relationship holds whether staffers report routinely working on the issue they were asked about or not. Staffers who work on budget or health on a regular basis do tend to be more knowledgeable than those who do not, which may be unsurprising. As we show above, staff tenure tends to be very short, so most staffers do not accrue enough experience to have advanced policy knowledge, even on those topics within their issue portfolio.
Not only do staffers rarely stay in the institution long enough to develop deep institutional and substantive expertise, they are often tasked with extensive portfolios which limit their ability to focus on a given issue. The typical legislative staffer works on between two and six issues on a daily basis. In most offices the “expert” staffer on an issue must still spread their attention across multiple other issue responsibilities.
This is particularly troubling given that these staffers routinely meet with lobbyists, advocates, and group representatives that spend all of their time focusing on a single issue that affects their interests. As a result, staffers are at an information and expertise disadvantage in almost every meeting they take with outside stakeholders.29 This information asymmetry can have a profound effect on how decisions are made.
While the typical staffer routinely works on almost a half-dozen issues, Figure 9 shows fully 25 percent report working on seven or more issues regularly. This enormous breadth in policy domain responsibility is as concerning as it is consistent with evidence of the shrinking size of members’ policy shops. These smaller teams force individual legislative staffers to cover ever-broader ranges of topics, which necessarily sacrifices the time and attention they can dedicate to any one issue on behalf of constituents.
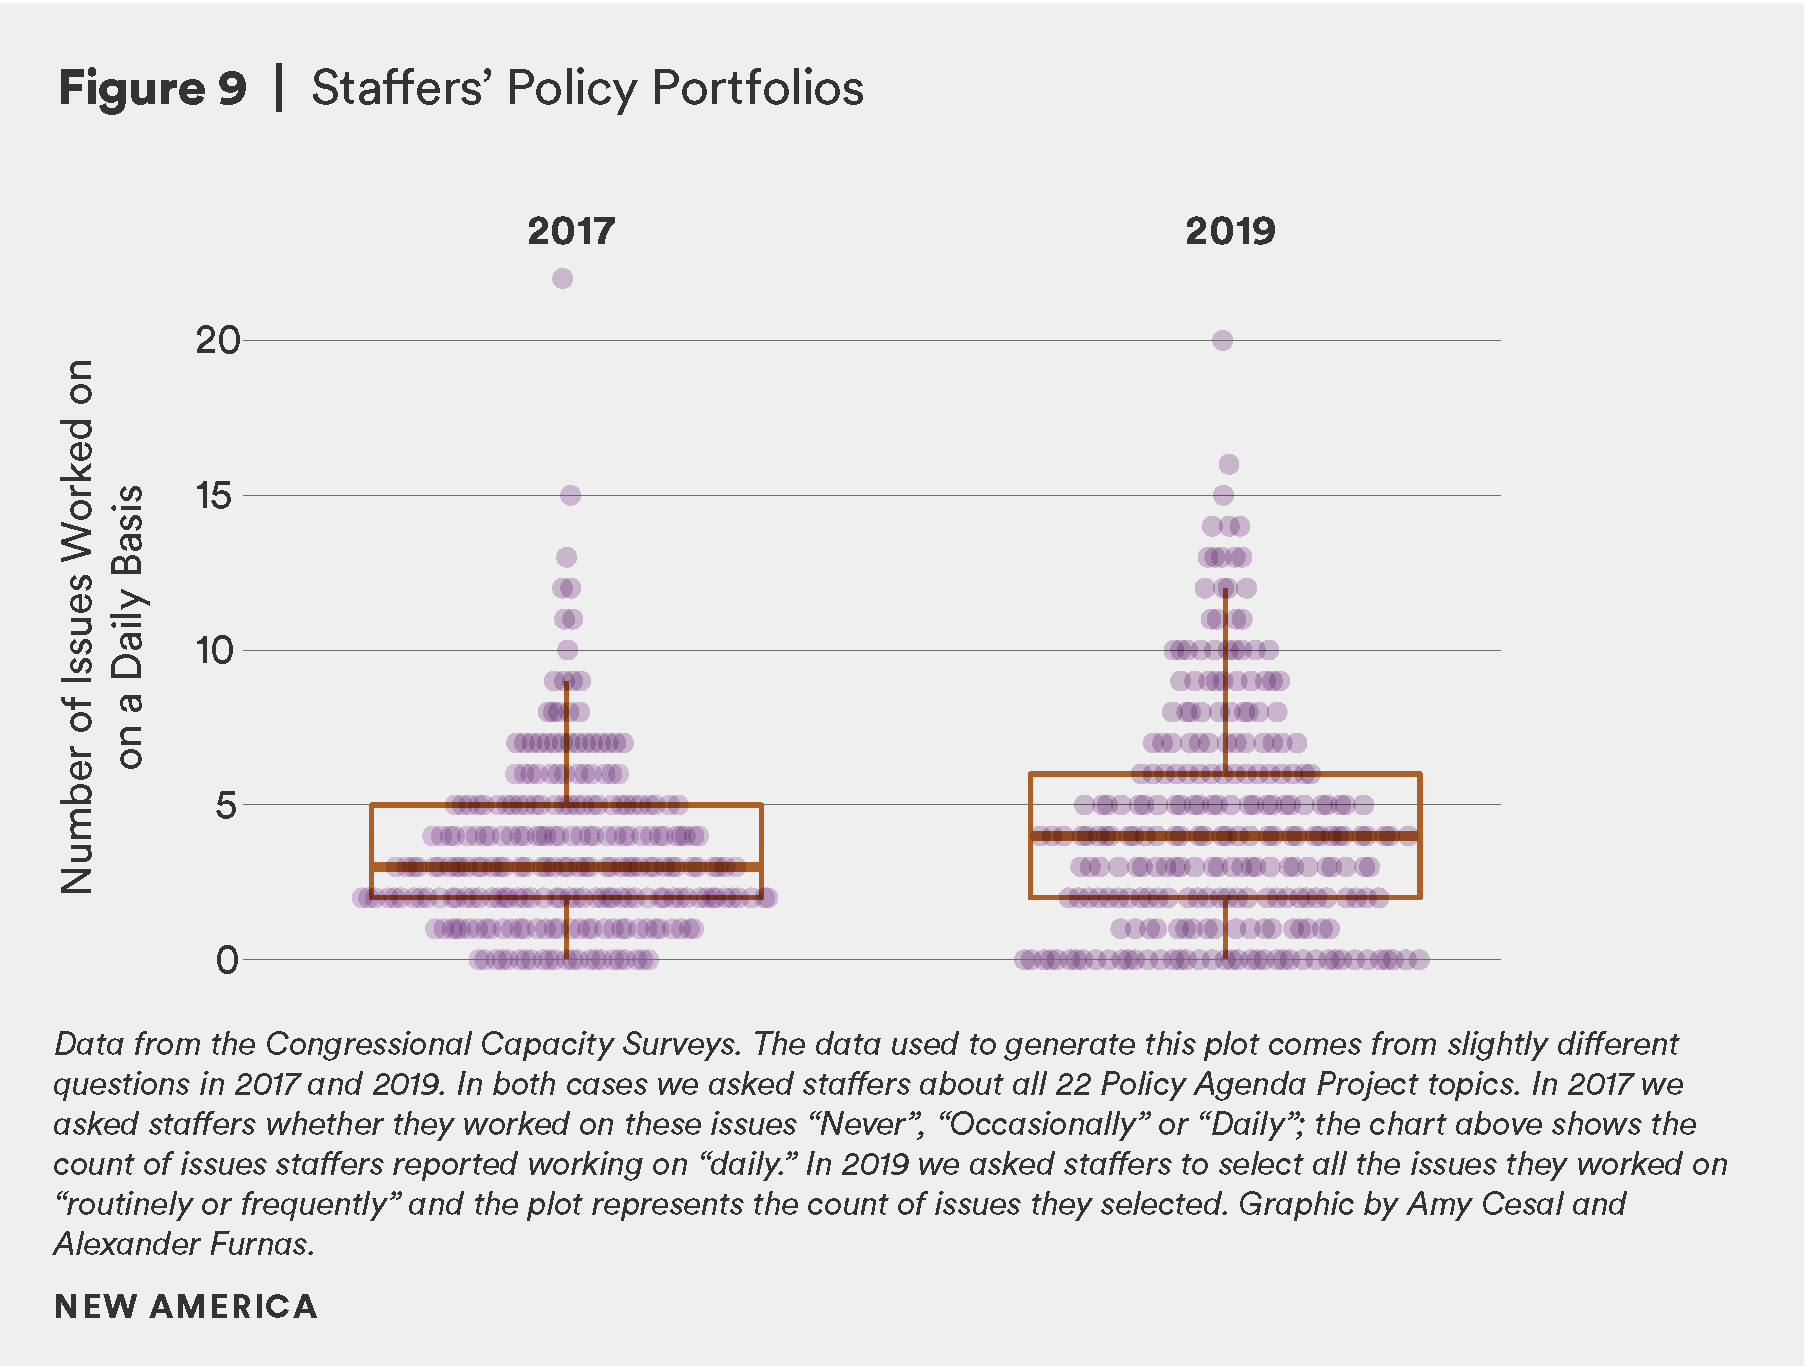
The consequence of shrinking policy shops and expanding portfolios is that these staffers are not only being drawn to K Street for the pay, but also for the ability to focus on a narrower set of issues. They are drawn to develop expertise in a single space, which, for most, is more satisfying work.
Staffer Partisanship and Ideology
It is of course natural that staffers have their own partisan and ideological identities that are in line, yet distinct from their bosses. Staff are not ideological superconductors who perfectly reflect the opinions of their employers. But, to date, we don’t know how distinct their ideology and partisan commitments are from that of their bosses.
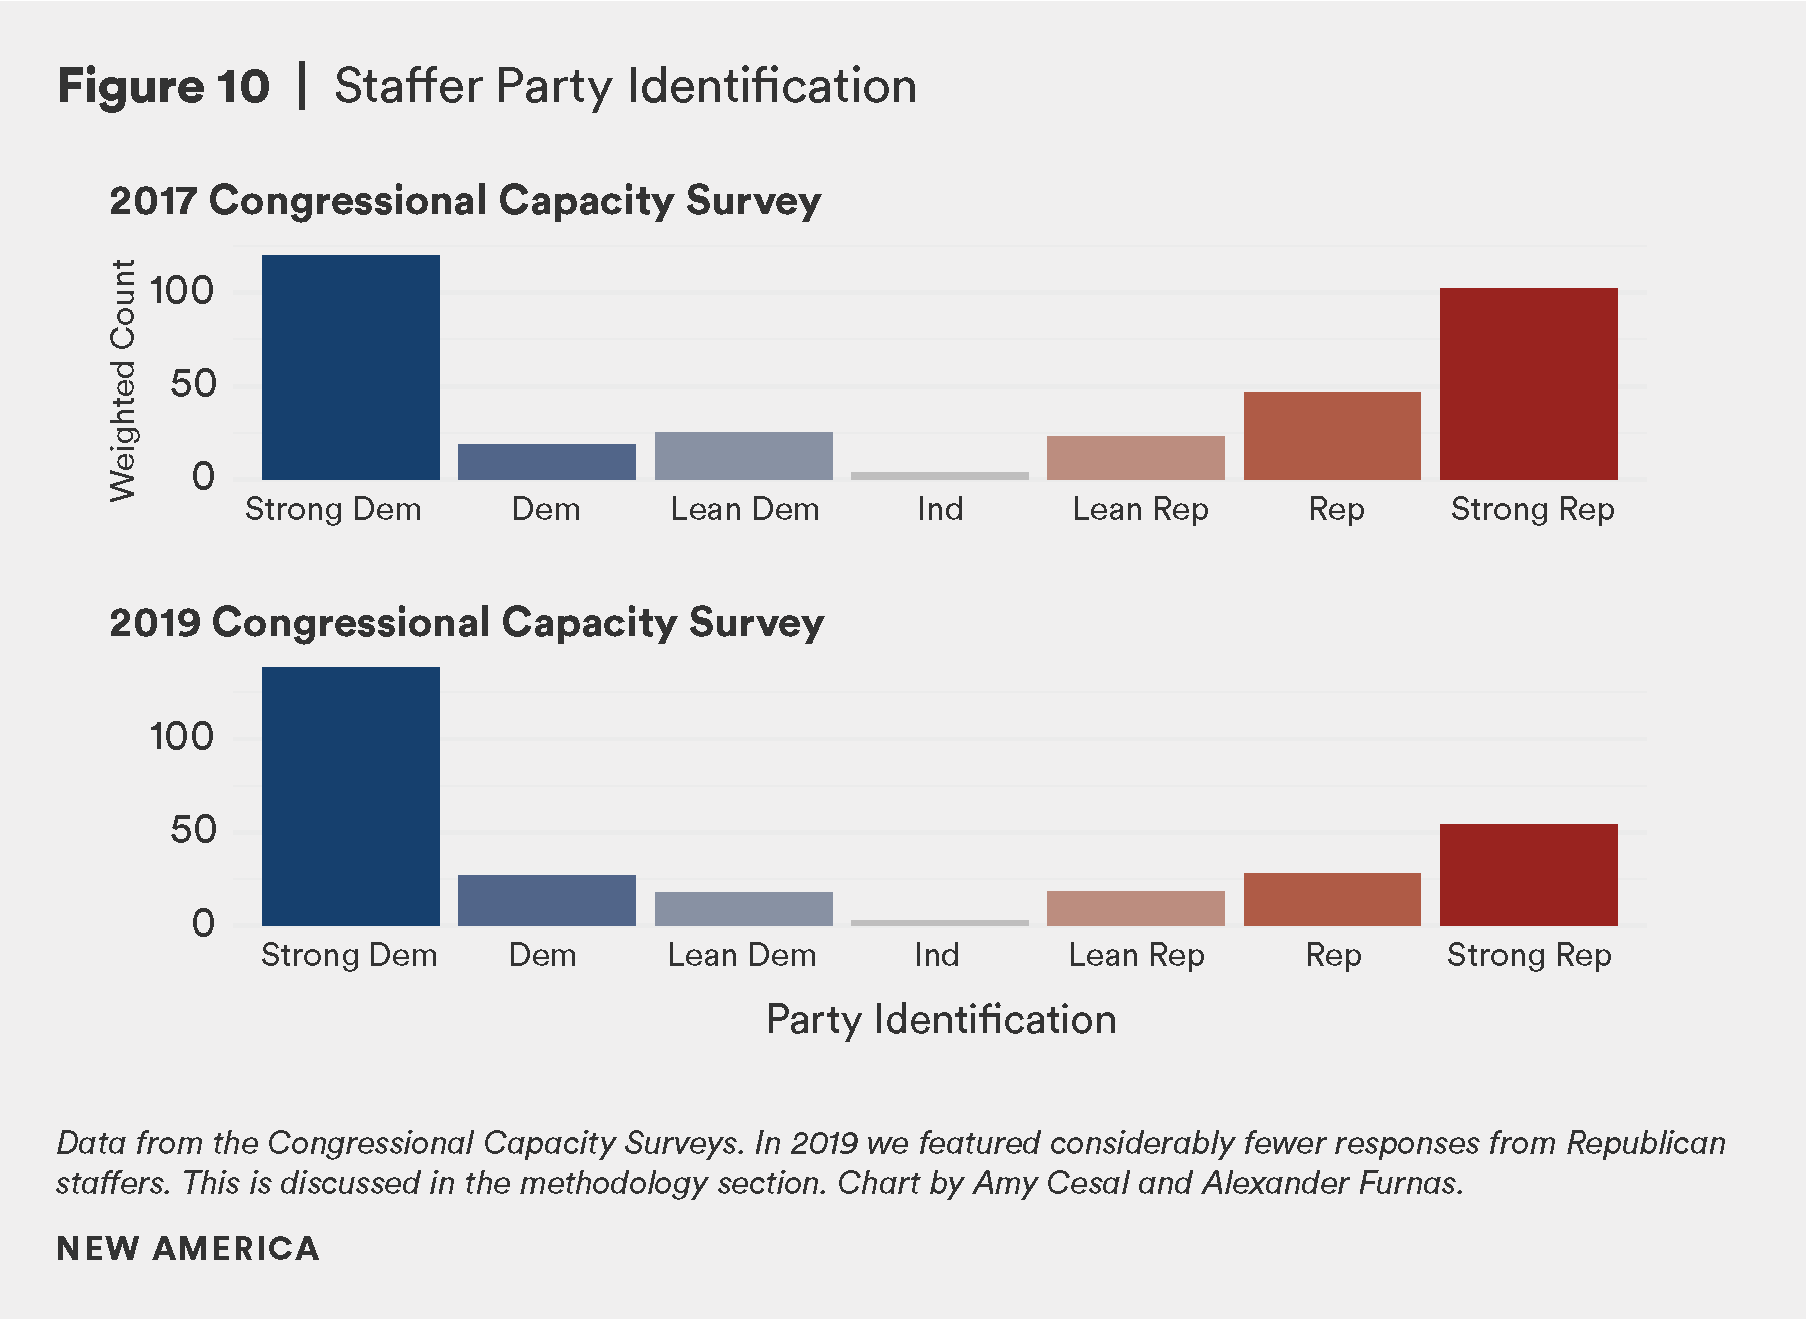
We ask staffers to report their partisanship using the discipline-standard battery, which measures if they generally think of themselves as Republicans, Democrats, Independents, or something else. If they select either major party, they are then asked whether they consider themselves a “strong” or “not very strong” Republican or Democrat. If respondents select independent or other, they are asked whether they think of themselves as “closer to the Democratic or Republican party.” These responses are recoded into the seven-point party identification scale shown in Figure 10 below.
Compared to average voters who self-report relatively weak attachments to both parties, congressional staffers are highly partisan. This is consistent between the two waves of data, with 65 percent of staffers identified as strong partisans in both. Approximately 73 percent of Democrats think of themselves as strong Democrats, compared to only 63 percent strong Republicans.
More importantly, Figure 11 shows that consistently strong partisanship translates into a high degree of ideological polarization. We measured ideology as a latent scale based on a standard five question battery about the size, scope, and role of government. Details on this measure are included in the methodology section.
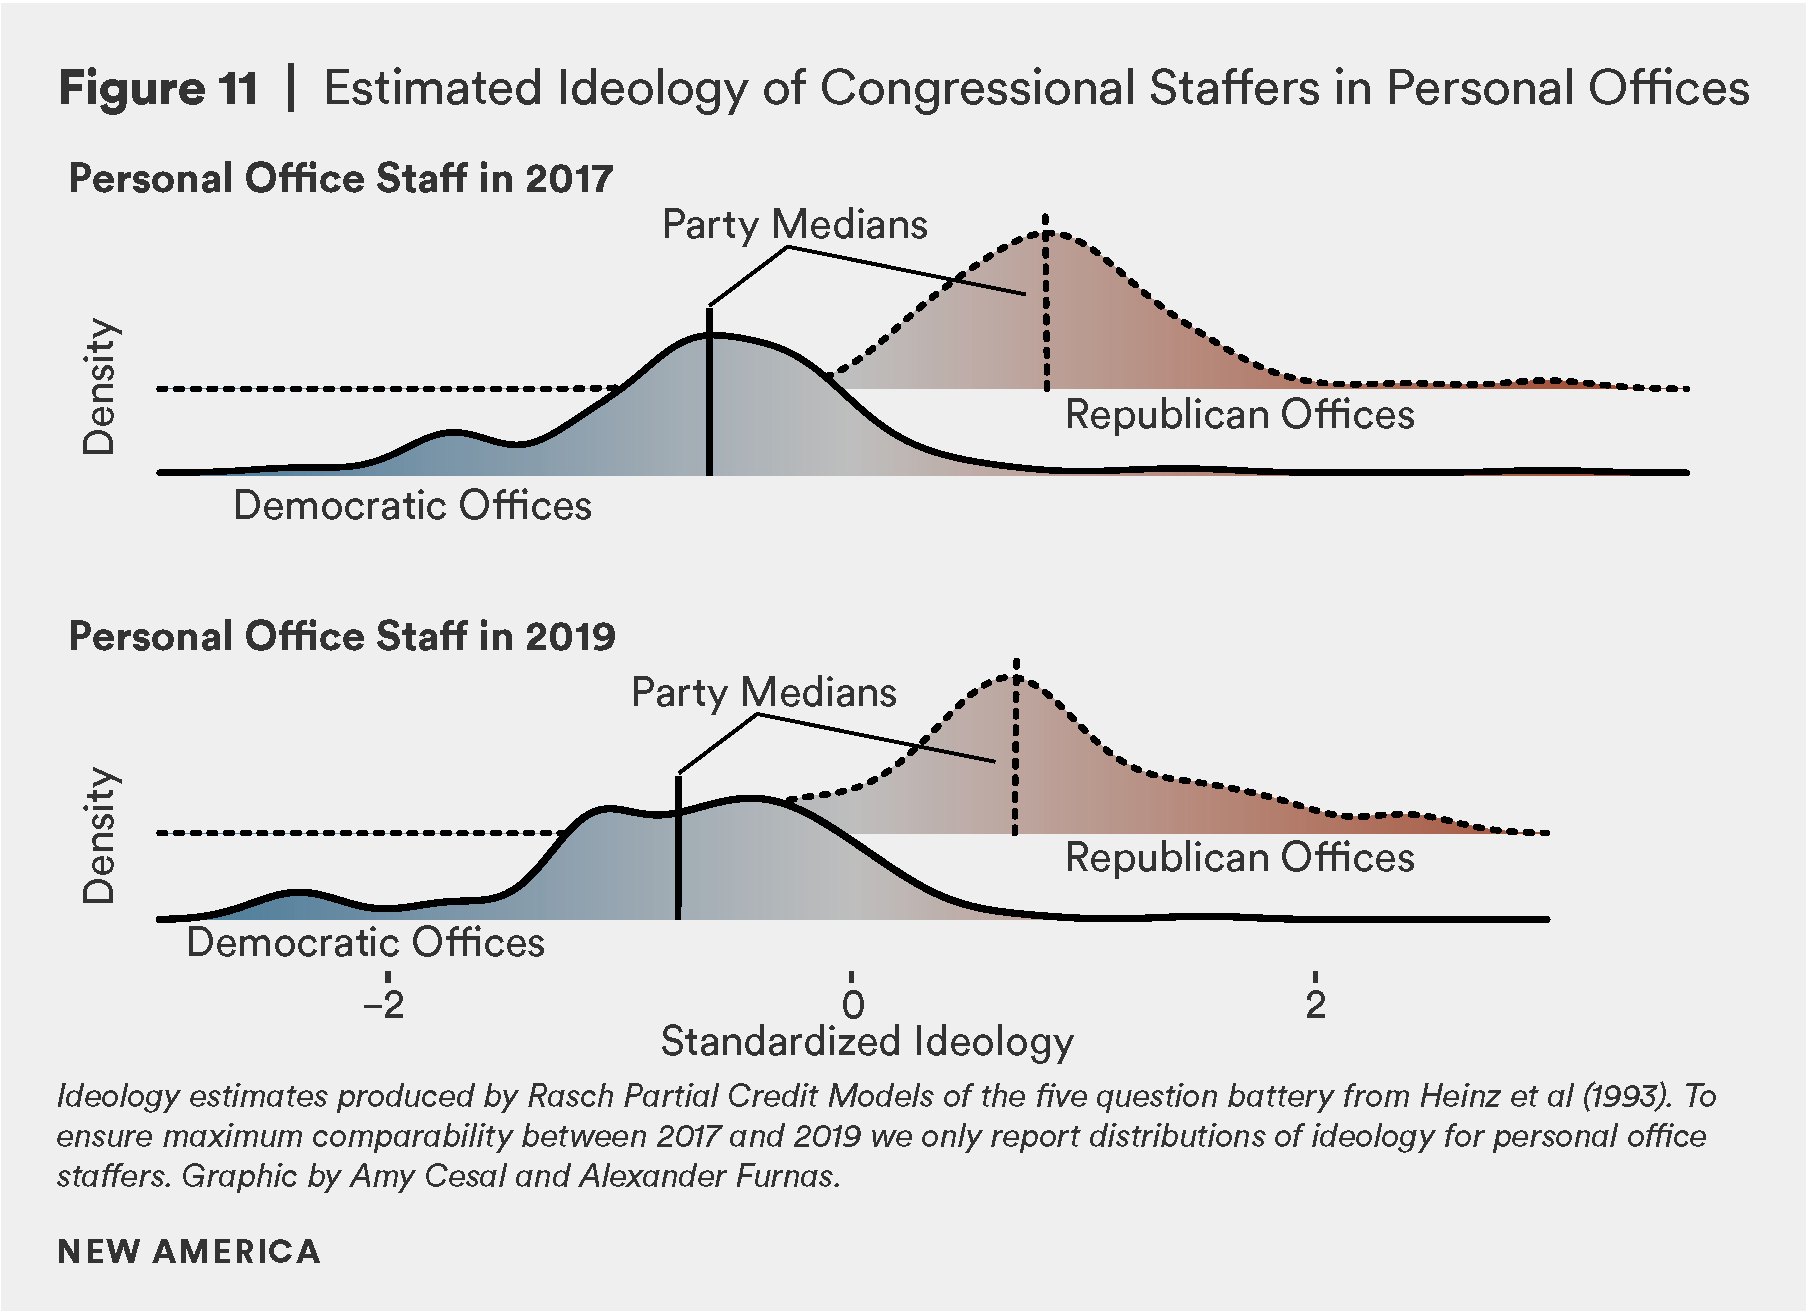
We observe relatively little overlap in the empirical distributions of staffers in offices of different parties.30 Not only do staffers strongly identify as partisan, they appear to hold consistently different positions from each other. This may not be surprising on its face, but does reinforce the fact that the congressional staffer labor market is partisan. Staffers’ own ideological orientations within their respective parties are distributed relatively normally.
Congressional dysfunction may not be driven simply by partisan animus, or the need for partisan politicians to generate clear distinctions between themselves and their opponents. Rather, the lack of bipartisanship and the concomitant gridlock may, at least in part, be driven by the fact that staffers who are hired to make the institution function substantively disagree about the role of government in addressing large issues like health care, consumer protection, and inequality. These results are particularly troubling since strong ideology and party identity are associated with exclusively using information from partisan-aligned sources.31
Citations
- The topline results we present are based on N ≈ 441 (5.2%) in 2017 and N ≈ 355 (5.4%) in 2019. All calculations use post-stratification weights to better approximate the sample’s representativeness and to improve the validity of our measures. See methodology section for greater detail.
- See appendix for a more detailed discussion of who qualifies as a “staffer” for the purposes of our analysis among the more than 11,000 employees on the Hill.
- Elsie L. Scott, Karra W. McCray, Donald Bell, Spencer Overton, Racial Diversity Among Top U.S. House Staff, (Washington, D.C.: Joint Center for Political and Economic Studies, 2018). source
- LaShonda Brenson, Racial Diversity Among Top Staff in Senate Personal Offices, (Washington, D.C.: Joint Center for Political and Economic Studies, 2020). source
- This phrase was first used in 1978 by Senator John Glenn in reference to the fact that federal workplace laws do not apply to Congress, which also decreased protections for staff against racial discrimination. James Jones, “John Glenn and the ‘Last Plantation,’” The Hill, December 9, 2016. source ; Lawrence Lerner, “Sociologist James Jones Dubs Congress America’s Last Plantation,” Rutgers University – Newark, April 21, 2017. source
- Here we only present racial, ethnic, and biological sex demographics for the 6,505 staffers in our 2019 survey sampling frame because similar data for 2017 is over 90 percent incomplete. The source is LegiStorm, which assigns a racial identity for congressional staff. Without knowing LegiStorm’s exact coding procedure, we recognize this to be an extremely problematic measure, as it may not accurately reflect the racial or ethnic self-identification of staffers themselves. Unfortunately, self-identification measures are not available for a census of congressional staff (Approximately 40 out of 355 CCS 2019 respondents identified as BIPOC), so we reluctantly use these data, albeit sparingly and with caution.
- Melinda N. Ritchie and Hye Young You, “Women’s Advancement in Politics: Evidence from Congressional Staff,” forthcoming The Journal of Politics, 2020.
- Casey Burgat, PhD dissertation. (College Park, MD: University of Maryland, 2019).
- Jennifer E. Manning, Membership of the 116th Congress: A Profile (Washington, DC: Congressional Research Service, 2019).
- 95% confidence interval about the mean.
- Manning, 2019.
- Note the roughly three-year tenure we report here is working in Congress overall, not in a single position or office. According to the Bureau of Labor Statistics, national average tenure per job is 4.2 years. Employee Tenure Summary, (Washington, D.C.: U.S. Bureau of Labor Statistics, 2018). source.
- See: Tim LaPira and Alexander Furnas, “Paying Congress’s interns a living wage is a good idea. Paying professional staff one is even better,” Vox, December 13, 2018. source
- Michael J. Gaynor, “43 percent of internships at for-profit companies don’t pay. This man is helping to change that,” The Washington Post, January 15, 2019. source
- Pr(Unpaid | Internship) = 79% unpaid internship × 55% any internship = 44%.
- Wage and Hour Division, “Fact Sheet #71: Internship Programs Under the Fair Labor Standards Act,” (Washington, D.C.: Department of Labor, 2018). source
- Though not explicit in this pull-quote from the interview transcript, it is clear that this staffer is referring to the Congressional Black Caucus, the Congressional Hispanic Caucus, and the Congressional Asian Pacific Islander Caucus from earlier in the interview.
- James R. Jones, The Color of Congress: Racial Representation Among Interns in the U.S. House of Representatives, (Washington, D.C.: Pay our Interns, 2020). source
- Jacob M. Montgomery and Brendan Nyhan, “The Effects of Congressional Staff Networks in the US House of Representatives,” The Journal of Politics 79, no. 3 (2017).
- It is not important here if their intended job would require formal lobbying disclosure, just that they intend to seek a job in the field of government relations, government affairs, policy advocacy, or related.
- LaPira and Thomas, 2017.
- See: “Average Commercial Truck Driver Hourly Pay,” Payscale. source and “Average Roustabout Hourly Pay,” Payscale. source
- Life in Congress: Job Satisfaction and Engagement of House and Senate Staff, (Washington, D.C.: Congressional Management Foundation and the Society for Human Resource Management, 2017). source
- Robert J. Fisher, “Social Desirability Bias and the Validity of Indirect Questioning,” Journal of Consumer Research 20, no. 2 (1993).
- Alan M. Saks, “Antecedents and consequences of employee engagement,” Journal of Managerial Psychology 21, no. 7(2006); Alan M. Saks, “Antecedents and consequences of employee engagement revisited,” Journal of Organizational Effectiveness: People and Performance 6, no.1 (2019); James K. Harter, Frank L. Schmidt, and Theodore L. Hayes, “Business-Unit-Level Relationship Between Employee Satisfaction, Employee Engagement, and Business Outcomes: A Meta-Analysis,” Journal of Applied Psychology 87, no. 2 (2007).
- James L. Perry, “Measuring Public Service Motivation: An Assessment of Construct Reliability and Validity,” Journal of Public Administration Research and Theory 6, no. 1 (1996); Adrian Ritz, Gene A. Brewer, and Oliver Neumann, “Public Service Motivation: A Systematic Literature Review and Outlook,” Public Administration Review 76, no. 3 (2016).
- We find substantively similar results when we use more complicated latent variable measures based on these same batteries.
- Crosson, Lorenz, Volden, and Wiseman, 2020.
- Richard L. Hall and Alan V. Deardorff, “Lobbying as Legislative Subsidy,” American Political Science Review 100, no. 1 (2006).
- These ideological distributions are relatively constant between the two waves of data collection, however in the 2019 sample we do observe slightly higher variance in the distribution of ideology within Democratic offices. This may reflect the fact that Democrats both picked up seats in more conservative districts like Calif. 40, and elected more progressive representatives like in N.Y. 14).
- Alexander C. Furnas, PhD dissertation (Ann Arbor, MI: University of Michigan, 2020).