Table of Contents
Maricopa County, Arizona
“Rental assistance is something that has been happening forever, so it should be something that there is a clear process for.” – Housing advocate, Phoenix1
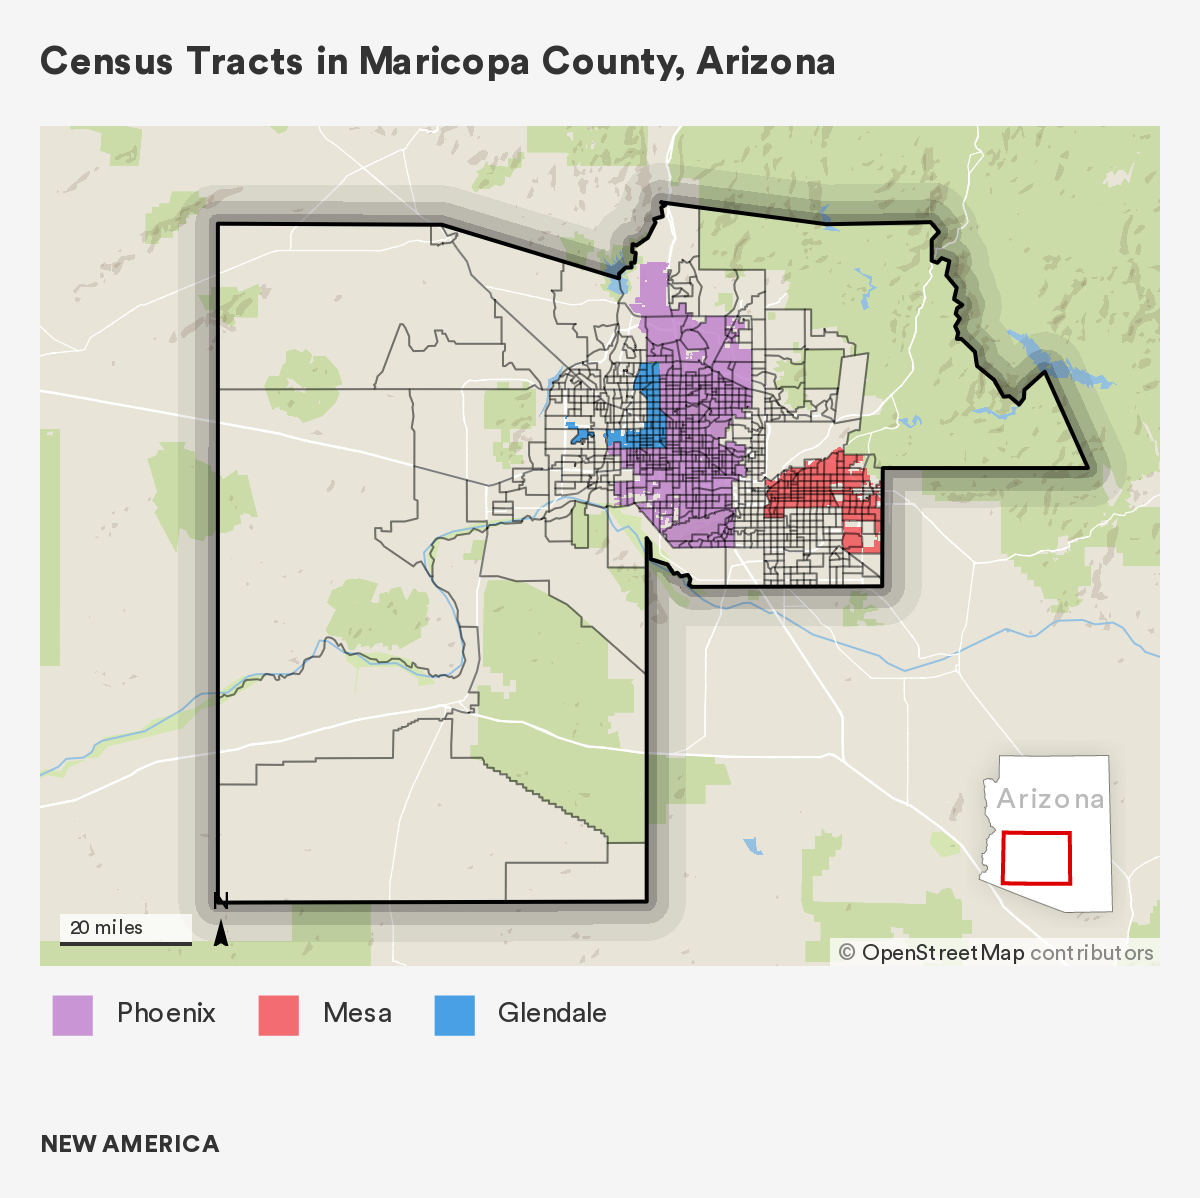
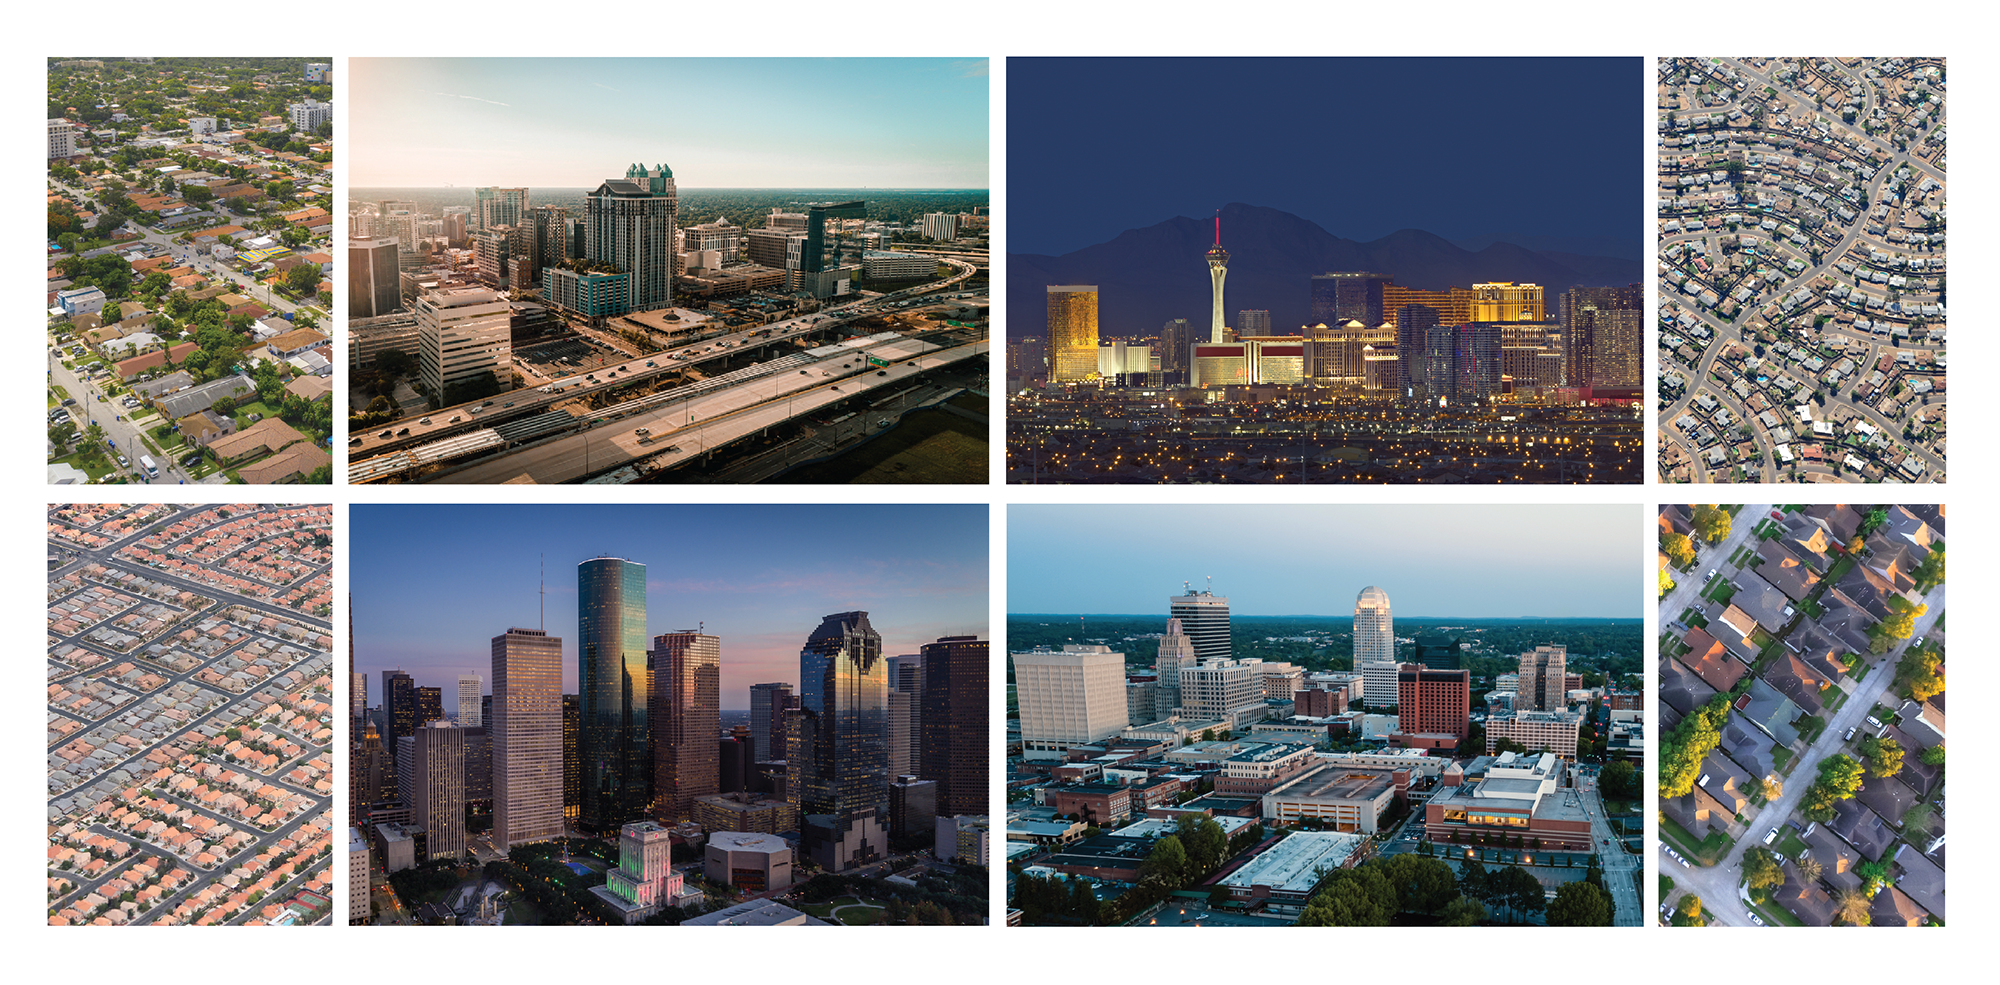
Nearly 4.5 million people, or 60 percent of Arizonans, live in Maricopa County, the fourth-most populous county in the United States. Built around Phoenix, the state’s capital and largest city, the metropolitan area sprawls out into the Valley of the Sun. To the east of downtown Phoenix sits Mesa, the largest suburb in the United States, with a population of nearly 520,000 people. Other major cities include Tempe, Scottsdale, Glendale, and Chandler.
Despite considerable economic growth and diversification following the Great Recession, socioeconomic challenges persist in Maricopa County. Approximately one-third of Maricopa County identifies as Latinx, and the county is also home to a significant Native American population, one of the largest in the United States. These groups, along with the Black community, have long suffered from discrimination in housing, education, employment, and transportation. And a large wealth gap and income disparity continue to worsen, as many people either work for minimum wage in the service sector, or in high-income, knowledge-based jobs.
Forty-two percent of those surveyed in the Phoenix-Mesa-Chandler Metro Area expect to experience an eviction or foreclosure in the next two months.
Maricopa County is currently experiencing a peak in confirmed and probable COVID-19 cases, with topline numbers far exceeding those recorded in the spring and early summer of 2020. Due to the ongoing recession, the county unemployment rate was 7.2 percent in November 2020, double the level of joblessness during the same time in 2019. Housing insecurity also remains acute, as results from the Census Bureau’s Household Pulse Survey indicate that 42 percent of those surveyed in the Phoenix-Mesa-Chandler Metro Area expect to experience an eviction or foreclosure in the next two months.
When and Where Are People Losing Their Homes?
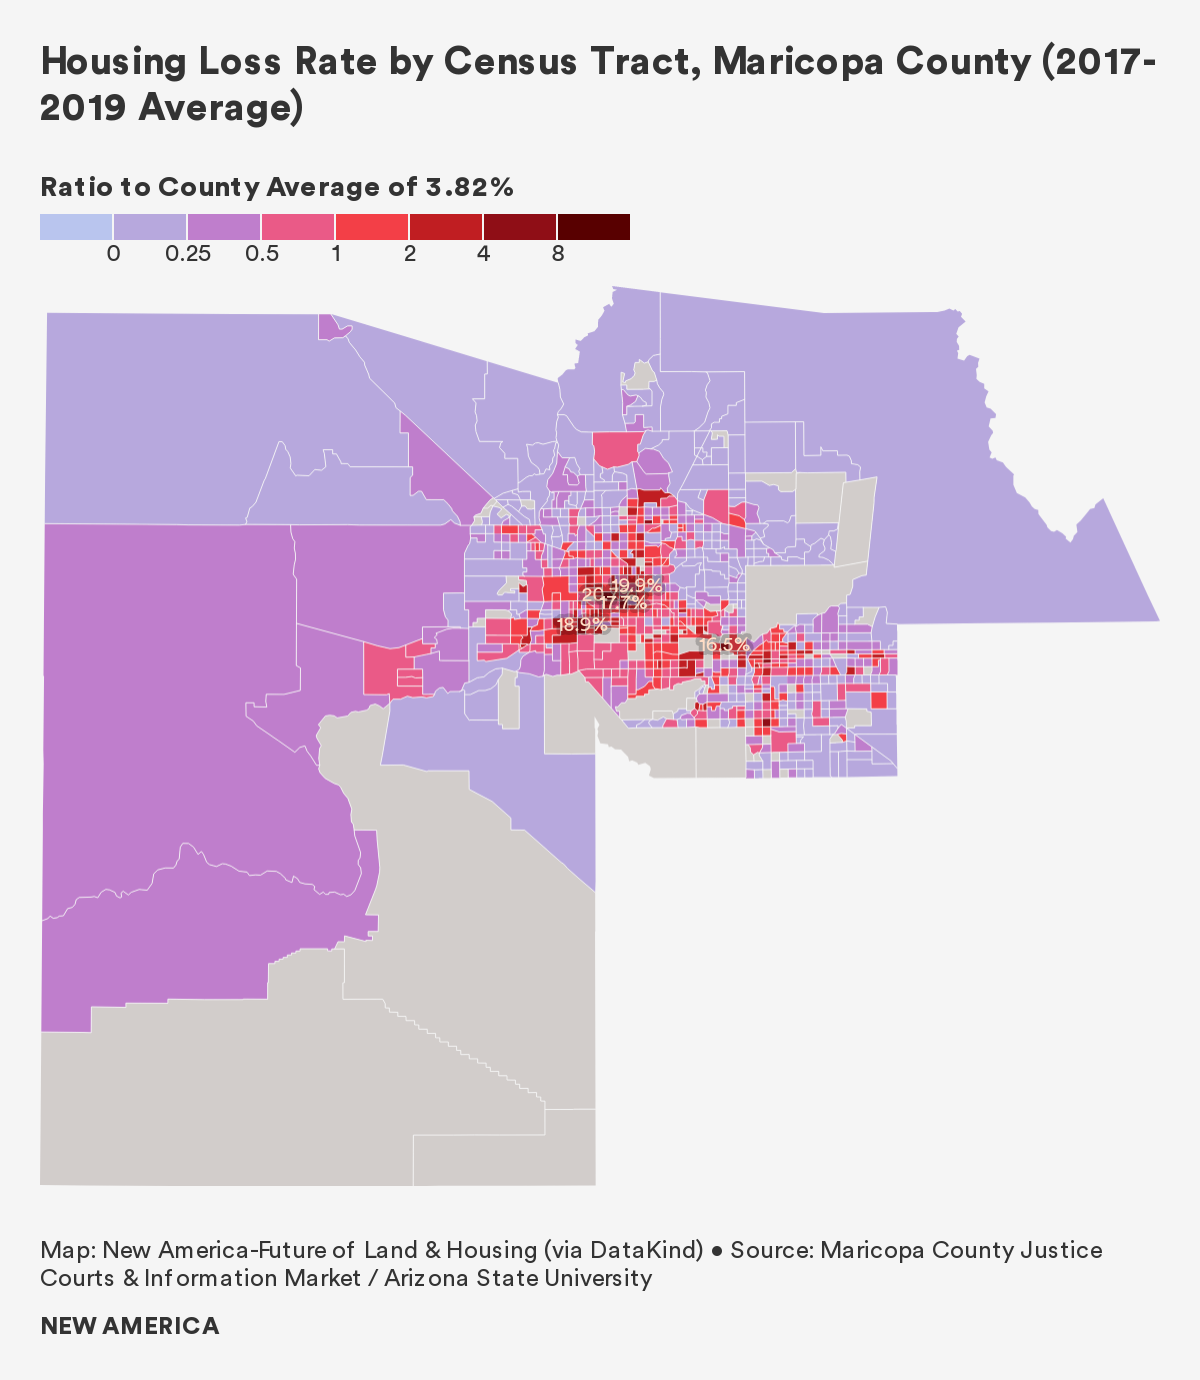
Overall Housing Loss: Maricopa County residents experienced housing loss at a rate of 3.8 percent between 2017 and 2019, meaning that nearly 380,000 county residents lost their home during this period. This rate is a significant jump from the 2014-2016 rate of 2.7 percent, and is driven largely by an increase in evictions just before the onset of the pandemic.
The census tract with the highest average housing loss rate is located between Phoenix and Glendale, along Grand Avenue. Over one-fifth of all households in this tract lost their homes each year during our study period. Several other tracts close by, in the Maryvale and Alhambra neighborhoods of west Phoenix also expressed high rates of displacement, between 10 and 19 percent. In general, these neighborhoods are home to a significant Latinx community and lower-income households.
A few areas in Tempe and northern Mesa also experienced rates of displacement that were three to four times the average in Maricopa County. Many of these census tracts have significant Latinx populations, low median household incomes, and high poverty rates, but most notable is the presence of mobile home parks in two Mesa tracts. In particular, 64 percent of residents in census tract 4207.07 live in mobile homes, and the tract has a loss rate just under 13 percent. During our previous research, we heard from interviewees that mobile home residents are particularly vulnerable to home loss, although this relationship must be explored further.
Another census tract in the far north of Phoenix expressed an average home loss rate of 15.6 percent. Located near the Autumn Ridge neighborhood, the tract has a median household income of $30,777, or half the county average, and 25 percent of residents live below the poverty line. Similar to the tracts in Mesa, this census tract has a sizable mobile home park.
Evictions: Only one-third of Maricopa households rent, and yet evictions account for 96 percent of housing loss between 2017 and 2019. During this three-year period, more than 360,000 renters were evicted, resulting in an average eviction rate of 7.6 percent. This is an enormous topline statistic, and the eviction rate increased noticeably, as well, when compared to the 2014-2016 average of 6.2 percent.
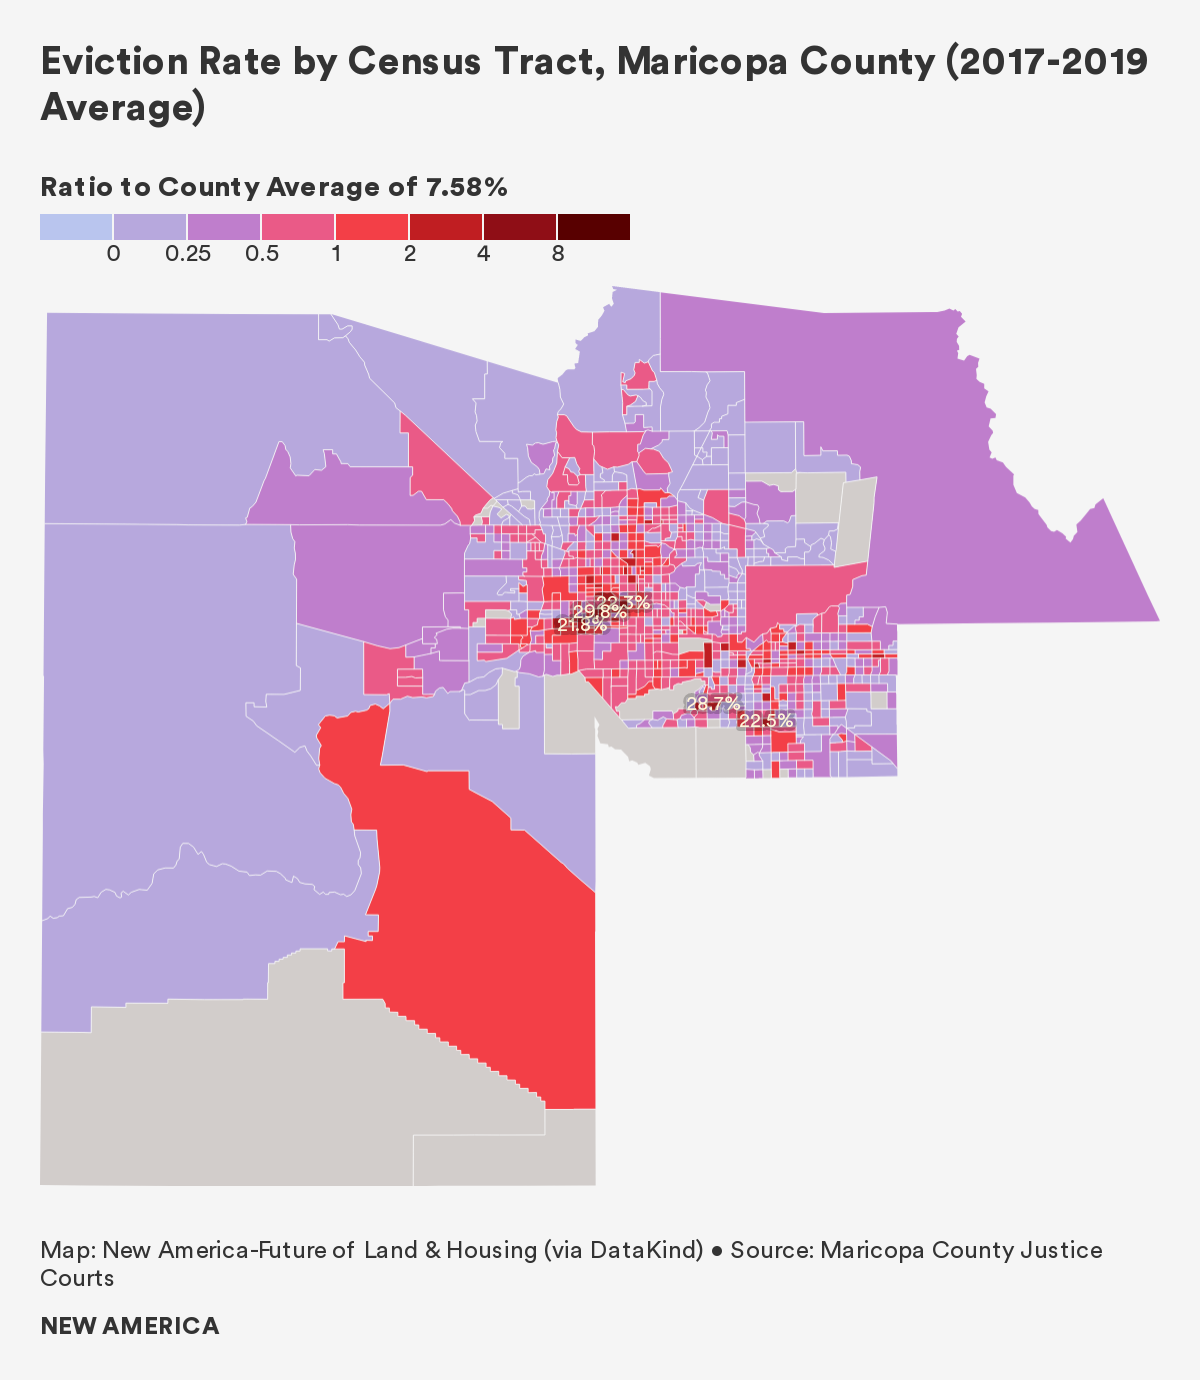
Very high eviction rates were clustered to the north and west of downtown Phoenix, in the direction of Glendale. These neighborhoods, including Maryvale and Alhambra, are home to a significant Latinx population, and characterized by low-income, renter households. In some census tracts within Maryvale, the eviction rate hovered between 20 and 25 percent, while one tract expressed a rate just under 30 percent, meaning that nearly one in three renters was evicted each year.
A tract in southwest Tempe experienced an eviction rate at 29 percent, the second highest in the county. Surprisingly, the median household income in this census tract is $111,691, nearly double the city average. The tract is also 70 percent white, a racial group that usually experiences fewer evictions in the county.
A few other census tracts in Tempe also expressed rates two to three times the country average—near Sky Harbor International Airport, and in the northeast and southeast of the city. It is also worth noting that a large number of tracts running along East Main Street in Mesa experienced evictions at a rate one-and-a-half to two times the county average. East Main Street is also home to a significant number of manufactured housing communities.
The Eviction Lab at Princeton University has been tracking evictions filings in Maricopa County since the start of the pandemic.2 Filings dropped sharply in April 2020, and increased very slowly for the rest of the year. Overall, Eviction Lab has recorded 23,490 filings since March 15, 2020, approximately half the normal amount. State- and national-level eviction moratoriums, along with increased government aid, is likely contributing to this decline in filings.
A Spotlight on Summer Evictions
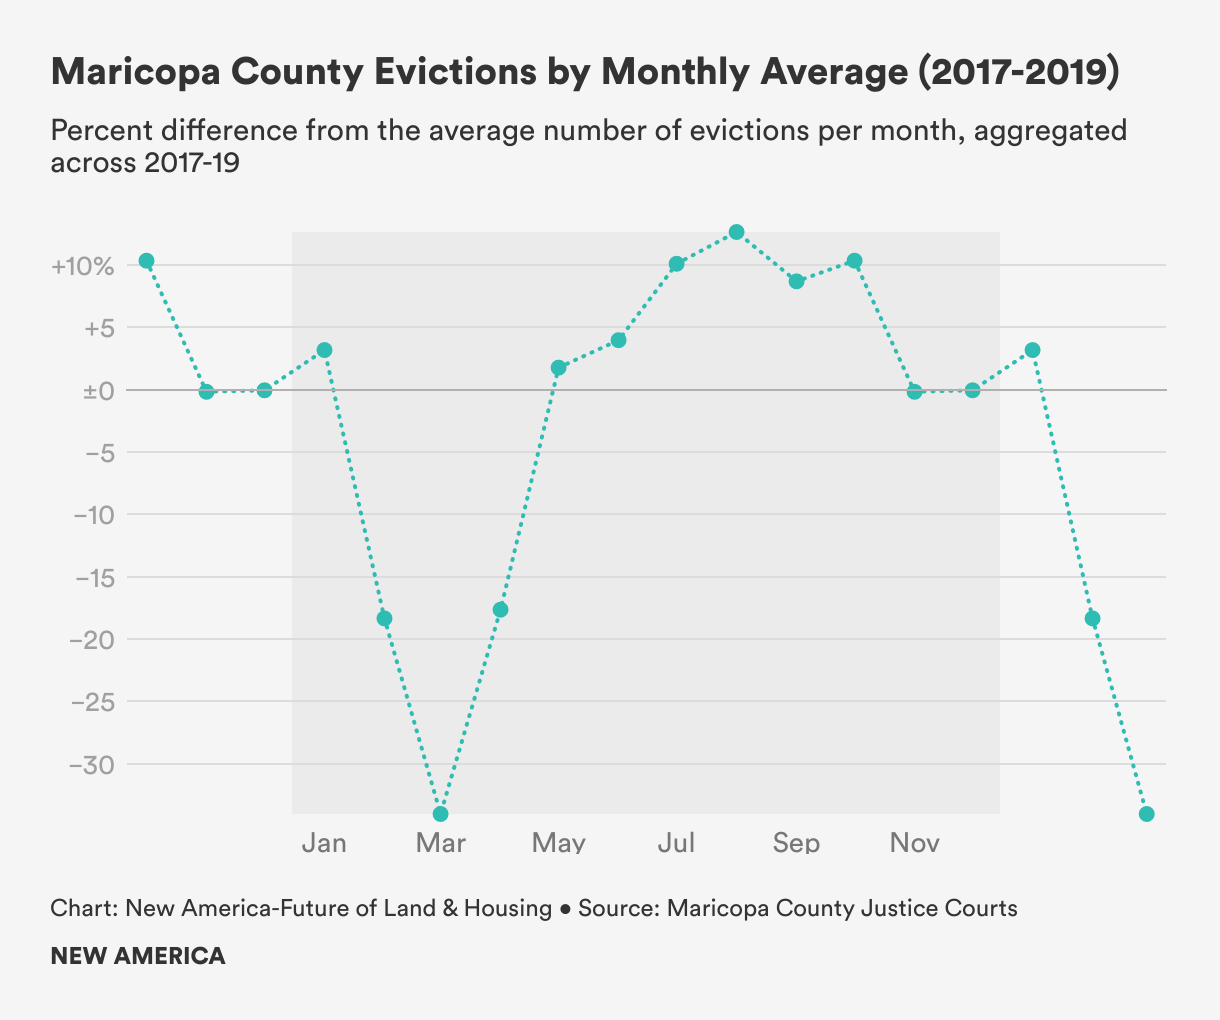
Evictions in Maricopa County drop steadily from January to March and then climb steadily until they peak during the scorching Arizona summer. Based on our analysis, August had the highest average number of evictions between 2017 and 2019, with 4,204. This spike is a 53 percent increase over the average low in March, at 2,740 evictions.
We speculate that three factors could drive uptick during warmer months: 1) the financial burden of high utility costs on renters;3 2) the financial burden of childcare and groceries during summer vacation on renter families; and 3) high demand for rental housing during the summer, causing landlords to move forward with evictions.
Mortgage Foreclosures: Homeowners are significantly less at risk of housing loss than renters in Maricopa County. Around two-thirds of housing units are owner-occupied in the county, but mortgage foreclosures accounted for only 4 percent of all housing loss in our three-year study period. Maricopa County had the lowest foreclosure rate of any county in our study, with just over 5,300 households, or .3 percent, experiencing foreclosures.
We calculate a 60 percent decline in the average mortgage foreclosures rate when comparing the periods 2014-2016 and 2017-2019. Given the impact of the Great Recession on the Phoenix real estate market, which recorded a foreclosure rate of 5.9 percent in 2007-2008, this is a significant finding. In the Valley of the Sun, at least, the long-term impacts of the last recession may be diminishing.
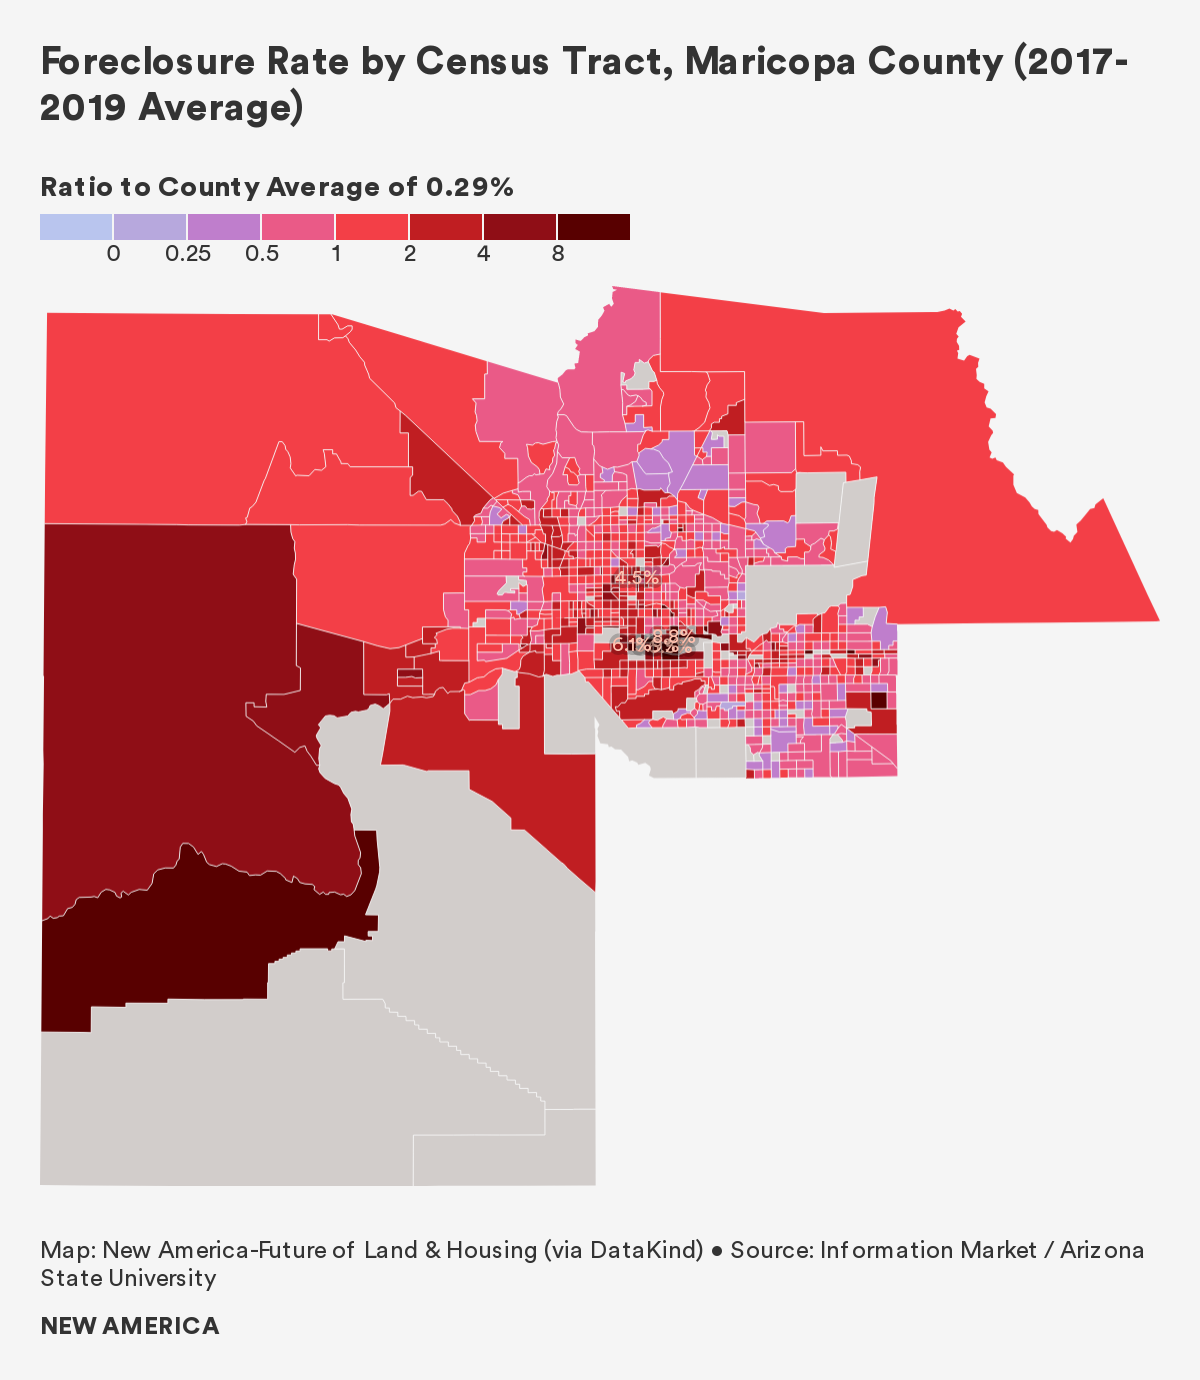
A notable exception to this trend is a group of census tracts in South Phoenix, to the west of Sky Harbor International Airport, where foreclosure rates jump to between 3 and 9 percent. Based on our previous conversations with local stakeholders in the county, we heard anecdotal evidence that neighborhoods in South Phoenix were steadily gentrifying, which could be contributing to this loss. A few tracts in the north and west of Phoenix also experienced high foreclosure rates, over 11 times the average in Maricopa County.
Who is Losing Their Home?
“…the poorest of the poor are paying more than 50 percent of their income for rent and that's not sustainable.” – Housing Nonprofit Leadership, Mesa4
Correlation analysis for Maricopa County confirms that traditionally marginalized communities experience housing loss most acutely. For example, tracts containing more households without health insurance experienced substantially higher rates of evictions and overall housing loss. Many low-paying jobs do not provide health coverage, and this finding may indicate that vulnerable households cannot pay for housing and healthcare, which is especially concerning amid the COVID-19 pandemic.
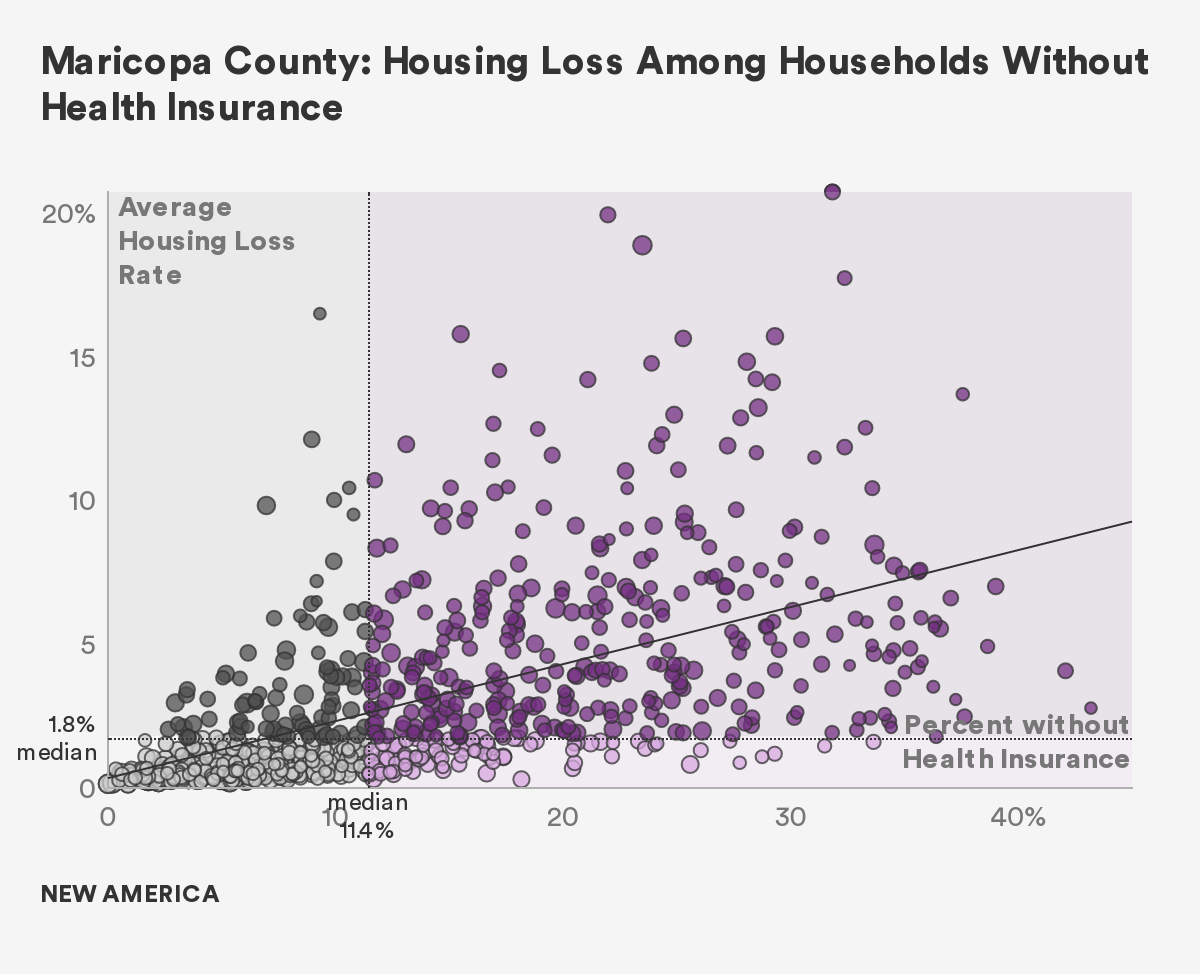
To understand this relationship between housing loss and percent uninsured, we categorized census tracts such that they fell into one of four categories: above or below the median percent uninsured and above or below the median housing loss rate in the county. Half the census tracts in the county fell below the median uninsurance rate, 11.4 percent, and half fell above it. Similarly, half the census tracts fell above the median housing loss rate, 1.8 percent, and half fell below it.
The scatter plot shows that of the census tracts with high rates of uninsured residents, nearly 80 percent had above median housing loss rates.
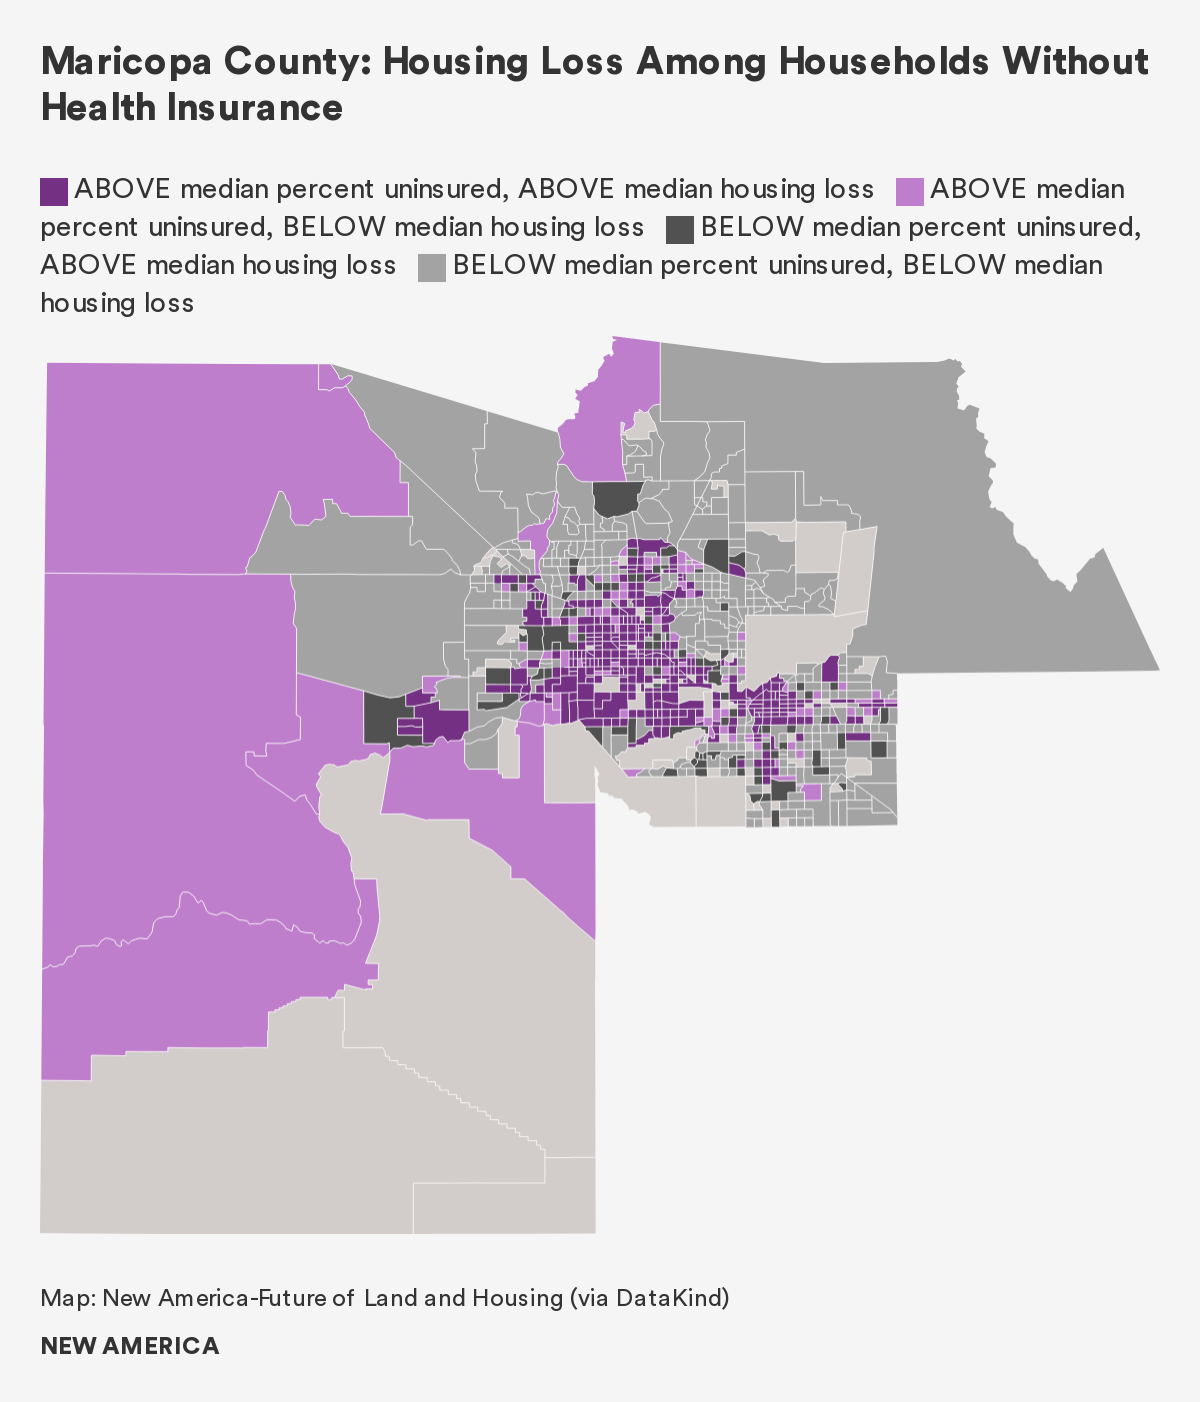
Displayed on a map, we see that the tracts with higher relative rates of uninsured residents and lower rates of housing loss are mostly on the outskirts of the major cities of Glendale, Mesa, and Phoenix. These cities are where we see a concentration of census tracts with above median households without health insurance and above median housing loss rates.
Additionally, census tracts with a higher percentage of immigrants experienced substantially greater rates of housing loss.
Tracts with more renters expressed substantially higher rates of home loss than census tracts with more homeowners, too. This relationship probably results, in part, from the fact that over half of Phoenix renters are housing-cost burdened, spending over 30 percent of their income on rent. These tenants may not be able to pay for housing and any unexpected expenses, leading to displacement.
Census tracts with a larger share of households that rely on public transportation for work commutes also had greater rates of overall housing loss. From previous research, we heard that dependence on unreliable public transportation systems can lead to repeated tardiness or absence from work, job loss, and a subsequent inability to pay for housing and other essentials. This scenario is quite plausible within Maricopa County, as access to bus and rail is generally limited, despite construction of the Valley Metro Rail in the early twenty-first century.
And tracts with more single-parent households experienced higher rates of displacement. The lack of two incomes, high costs of childcare, and difficulties in maintaining steady employment amid other responsibilities may contribute to this relationship.
Among all races and ethnicities, Latinx households had the strongest relationship with housing loss. Tracts with more Black households only show a marginally weaker relationship with displacement, in comparison. Similar to other Sun Belt case studies, as the percentage of white households in a census tract increased, housing loss rates declined.
Housing Loss and COVID-19
Interviewees in Maricopa County were quick to emphasize that populations currently at risk of housing loss, most notably wage workers in the service sector, were already vulnerable to displacement before the pandemic. The consequences of job loss are especially severe amid the COVID-19 pandemic, as many laid-off workers find it increasingly difficult to become re-employed.
The ongoing recession is also driving new groups into housing insecurity. For example, stakeholders mentioned many middle-class households are experiencing loss of income, or increased expenses as college- or adult-aged children move back home. Budgets tighten as a result, and these families increasingly become housing-cost burdened. Other groups now at risk of displacement include the self-employed, who are unable to access state unemployment benefits in Arizona, and single parents forced to quit their jobs in order to care for their children at home.
Wage workers in the service sector were already vulnerable to displacement before the pandemic.
The response to increased housing insecurity in Maricopa County was characterized as slow and uneven, particularly in regard to the disbursement of housing aid. Cities and towns with populations under 500,000 people did not receive CARES Act aid directly, and struggled to receive funds in a timely manner. Stakeholders noted that this inefficiency was due, in part, to Arizona Governor Doug Ducey placing the money in a general fund, which limited accessibility. These municipalities also lacked the resources, both public and private, of large cities, such as Phoenix or Mesa, perhaps compounding housing insecurity.
Interviewees highlighted a few successful responses to pandemic-related displacement as well. Local policy that allowed homelessness service providers to flexibly use funds for short-term hotel stays helped to lessen the burden of overcrowded shelters. And eviction moratoriums, enacted at both the state- and national-levels, helped to reduce displacement in Maricopa County. Still, many landlords are choosing not to renew leases, as demand for rental housing in the Phoenix area makes it easy to fill vacancies quickly.
Policy Solutions
Our policy recommendations to mitigate housing loss amid COVID-19 can be found in the report section: “Housing Loss in the U.S. Sun Belt.”
Citations
- From an interview with contributing author Alexandria Drake.
- Of note, an “eviction filing” is not the same thing as an “eviction.” An eviction filing initiates the formal eviction process within a court system. A filing does not mean that a tenant was actually evicted. Most times, a formal eviction is the result of a disposition or a summary judgment, and the tenant must vacate the rental unit in question. source
- According to our previous research, the average cost to cool a home in Phoenix during the summer is $477, the most expensive rate in the country. For a family already spending more than 30 percent of their income on rent (i.e., a rent-burdened household), this extra cost adds a layer of economic vulnerability that can lead to housing loss.
- From an interview with contributing author Alexandria Drake.