Ranked-Choice Voting and Political Expression
This brief is part of a series by the Electoral Reform Research Group, a collaboration between New America, Stanford University’s Center on Democracy, Development, and the Rule of Law, the American Enterprise Institute, and the Unite America Institute. To find the full report of the study summarized below, click here.
Overview
This brief reports results from a survey experiment to investigate potential disparities in political expression and alignment among informed and uninformed voters in local ranked-choice elections. The survey was conducted during the 2020 general election in San Francisco. Respondents answered questions measuring their local policy views and knowledge about politics, and then ranked actual supervisorial candidates. Before ranking candidates, respondents were randomly assigned to receive either an issue-oriented voter guide or no additional information.
Research Questions
- What types of citizens (informed versus uninformed) will take advantage of the greater opportunity for political expression afforded by ranked-choice voting systems?
- To what extent do informed and uninformed citizens’ rankings of candidates faithfully reflect their own policy views?
- Can political information (e.g., voter guides) enable different types of citizens to take advantage of the greater opportunity for political expression in ranked-choice voting elections?
Key Findings
- Uninformed respondents are significantly less likely than informed respondents to use their allotted rankings. Nonetheless, 70 percent of uninformed respondents ranked at least one candidate and 67 percent ranked more than one.
- The rankings of uninformed respondents are weakly related to their policy views. The rankings of informed respondents more faithfully reflect their policy views, with higher levels of agreement with candidates ranked first than candidates ranked second or lower.
- Providing an accessible summary of candidates’ policy views (i.e., a voter guide) increases uninformed respondents’ propensity to use their allotted rankings. Approximately 76 percent of uninformed respondents who received a voter guide ranked at least one candidate and 75 percent ranked more than one. Overall, the voter guide reduced differences between informed and uninformed respondents.
- Providing an accessible summary of candidates’ policy views strengthens the relationship between informed and uninformed respondents’ candidate rankings and their own policy views.
Background and Research Design
In recent years, political momentum behind ranked-choice voting (RCV) reforms has been building across the United States. In 2004, San Francisco became the first large American city to implement RCV for its local elections. Other cities in California, Colorado, Maine, Maryland, Massachusetts, Michigan, Minnesota, New Mexico, and Utah soon followed. In 2019, voters in New York City voted to adopt RCV for local elections and the California legislature passed legislation enabling any city in the state to do likewise—the bill was vetoed by Gov. Gavin Newsom (D-Calif.).
The adoption of RCV in these settings anticipates several benefits. For local governments, RCV systems are less expensive as they do not require separate primary or runoff elections. For citizens, the ability to rank multiple candidates yields increased opportunities for political expression. For civic organizations, RCV has the potential to increase turnout and engagement, expand candidate entry, and to improve the tenor of campaigns.
Nonetheless, moving to RCV elections might have drawbacks. Among the more important are the additional burdens RCV places on citizens, who must navigate a more complex choice setting (ranking multiple candidates, often without party cues). Moreover, by increasing the number of candidates and giving them incentives to compete for others’ supporters, RCV elections might make it more difficult for citizens to make fine-grained distinctions between candidates. Candidates might decline to endorse policies that could alienate others’ supporters or be more ambiguous about their own positions. The combination of more demanding choices and incentives to obfuscate could impair voter decision-making, especially in low-information local elections and among uninformed citizens.
Existing research sheds light on the benefits and costs of RCV.1 On the plus side, candidates competing in these elections do take concrete positions on a large array of policy issues, offering citizens distinct local platforms. In mayoral elections, citizens are able to perceive these differences and use their rankings to select candidates who best reflect their own policy views.2 In city council elections, however, citizens appear to have greater difficulty in this regard.3
Still, the RCV literature leaves several questions unanswered. First, what types of citizens will take advantage of the greater opportunity for political expression afforded by RCV systems? In particular, do uninformed citizens take advantage of the opportunity to rank candidates beyond their first choice? In San Francisco, where prior to 2019 voters could rank up to three candidates, approximately 75 percent of voters ranked multiple candidates and 60 percent ranked three.4 But we know little about how the propensity to use all rankings varies across different types of citizens. Second, to what extent do citizens’ rankings faithfully reflect their own policy views in low-information local elections, such as for city council? Finally, what types of political information can enable the uninformed and others to take advantage of the greater opportunity for political expression? Can such information also increase the alignment between citizens’ rankings and their policy views?
Citizen Decision-Making in RCV Systems: A Study of San Francisco Elections
We address these questions by conducting an original survey during the 2020 general election in San Francisco. We used Qualtrics to recruit 1,286 San Francisco residents to participate in a survey administered online in the weeks before Election Day. While existing research suggests that respondents from online panels are not always representative of the general population, our sample resembles San Francisco’s population in many respects (see Table 2 of the full report).
In our survey, respondents ranked candidates running for the Board of Supervisors (San Francisco’s legislative body) and answered other questions designed to measure their views about local policy issues and knowledge about local politics. We also embedded an experiment that randomly assigned respondents to receive either: (1) a nonpartisan voter guide summarizing the candidates’ policy views (voter-guide group), or (2) no additional information about the candidates (no-information group). The voter guide displayed the candidates’ actual positions on six local policy issues in a table with the answers respondents gave to questions about these same issues (see Figure 1 of the full report).
The 2020 general election in San Francisco is a fertile context for investigating our research questions for several reasons. First, the election included contests for six of the 11 seats on the Board of Supervisors. It was also the first regularly scheduled election for the board to use San Francisco’s new RCV system, which allows citizens to rank up to 10 candidates. Under the old system (2004–18), citizens could rank up to three candidates.
Second, San Francisco resembles many large American cities demographically and in its overwhelmingly Democratic electorate. One consequence of the latter is that its elections frequently feature candidates who are all Democrats. Despite this partisan homogeneity, the city’s political elite and its citizens are divided between so-called “progressives” (the local left) and “moderates” (the local right). Progressives advocate higher taxes on local businesses, limits on development, and providing cash assistance to the homeless. Moderates typically favor tax breaks for businesses, support for new development, and limits on panhandling. These meaningful policy differences, in the absence of partisan divides, enable us to disentangle the effects of citizens’ policy views from other factors. Our ability to measure candidates’ policy views is enhanced by the activities of local political clubs, which distribute questionnaires to candidates for local offices as a prelude to making endorsements. The policy views of candidates’ included in the voter guide were gathered by local groups prior to Election Day.
We analyze the candidate rankings of respondents assigned to the no-information group to assess (1) whether the propensity to use their allotted rankings varies among different types of citizens, and (2) the extent to which respondents’ rankings reflect their policy views. In doing so, we distinguish between informed and uninformed respondents using four fact-based questions about politics in San Francisco. Respondents who correctly answer two (the median) or more questions are considered informed, and those who correctly answered one or zero questions are considered uninformed. We then compare the candidate rankings of respondents in the no-information and voter-guide groups to examine whether political information increases the propensity to use allotted rankings and/or improves the alignment between citizens’ rankings and their policy views.
Results
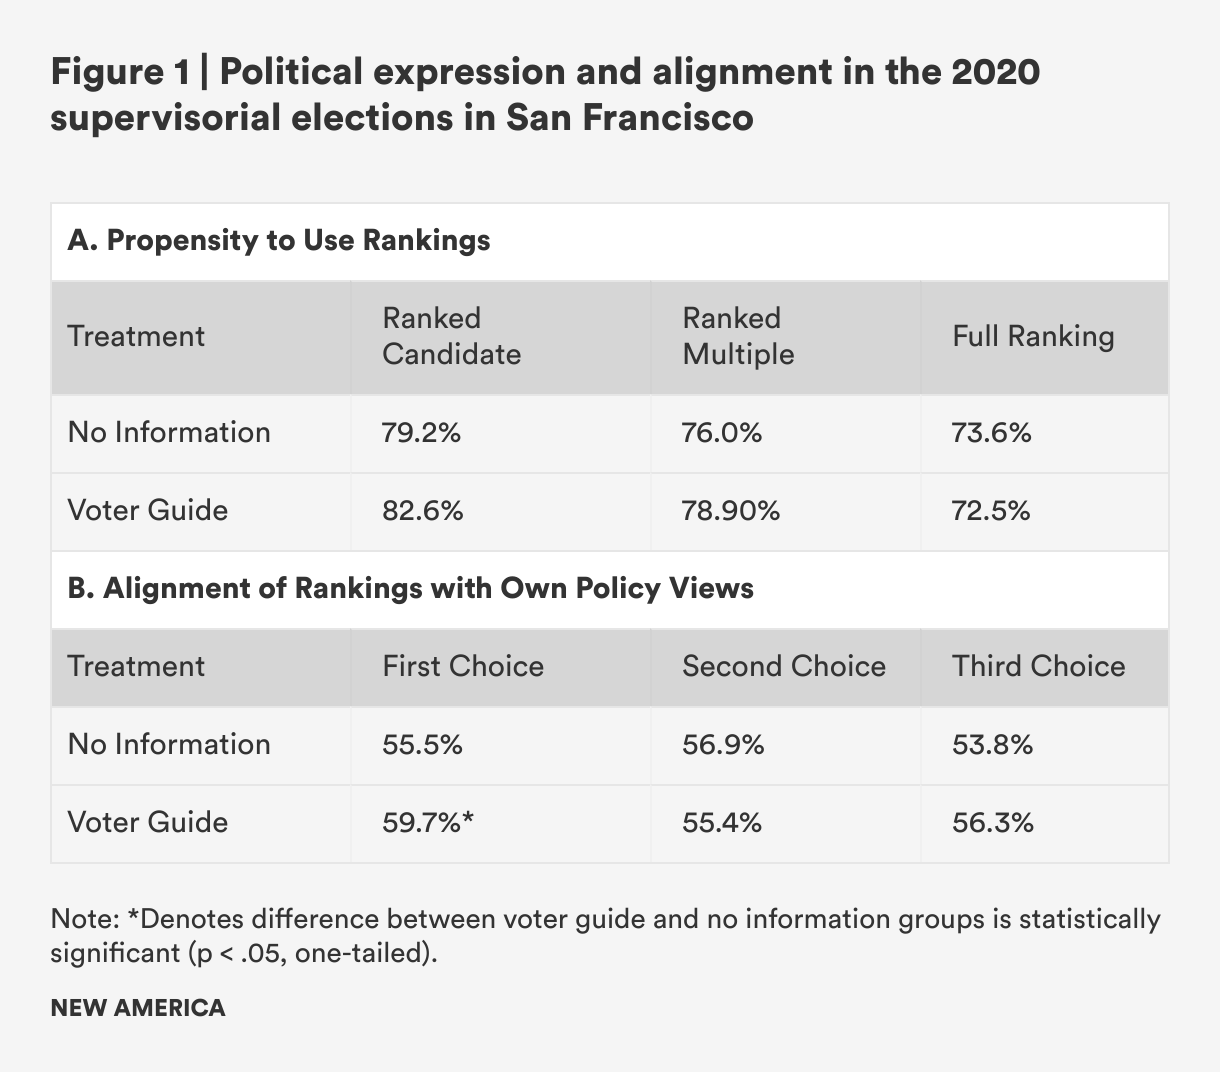
Our analyses indicate high levels of political expression in the 2020 supervisorial elections in San Francisco. Figure 1A reports the percentages of respondents in the voter guide and no-information groups who ranked a candidate, ranked multiple candidates, and gave a complete ranking of all candidates running in a particular election. Nearly eight in 10 no-information respondents (79.2 percent) ranked at least one candidate and 76.0 percent ranked multiple candidates. Approximately 73.6 percent used all allotted rankings in these elections. These figures are comparable to those reported in observational studies.
We find modest levels of alignment between respondents’ rankings and their own policy views in the no-information group. Figure 1B displays agreement scores (the percentage of congruent policy positions) for candidates ranked first, second, and third by these respondents. Overall, respondents are more likely than not to agree with the candidates they ranked on six issues included in our voter guide. But there are no clear differences in agreement between candidates ranked first and candidates ranked second and third.
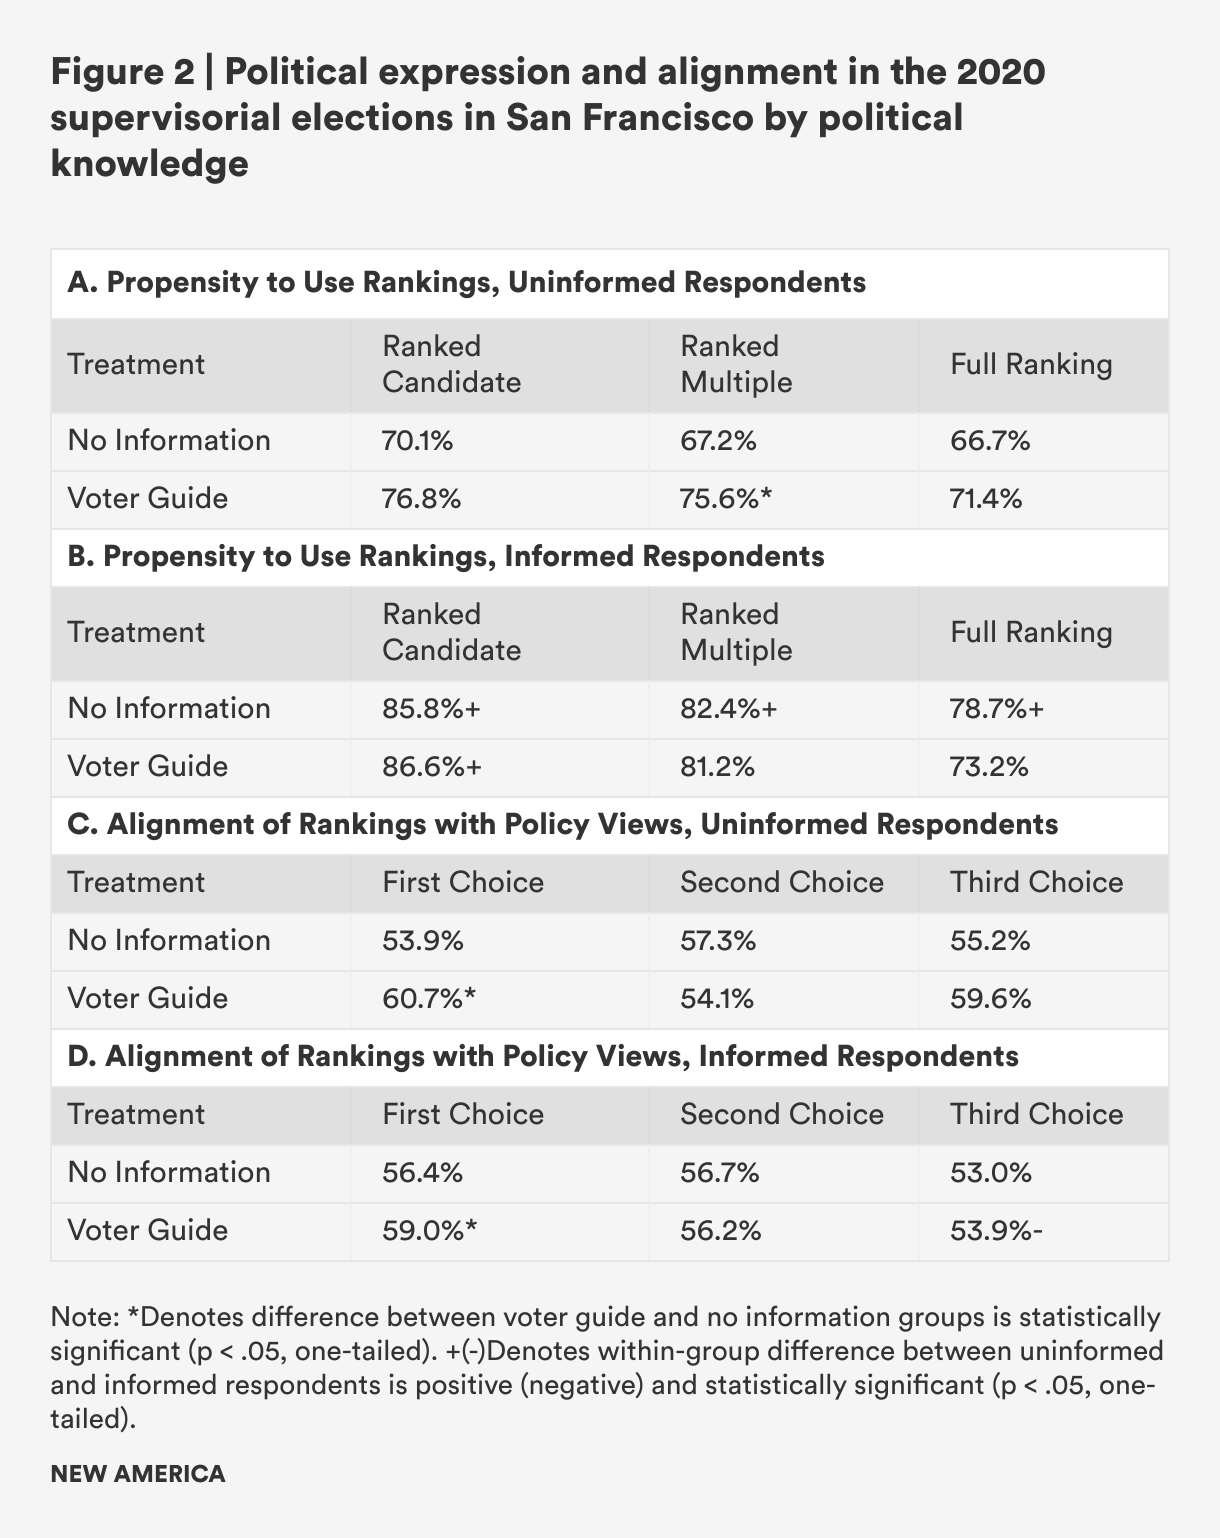
The high levels of political expression portrayed in Figure 1A mask disparities between uninformed and informed respondents. Figures 2A and 2B report the percentages of uninformed and informed respondents in the voter guide and no-information groups who ranked a candidate, ranked multiple candidates, and gave a complete ranking of all candidates. Whereas 85.8 percent of informed respondents in the no-information group ranked one of the candidates, only 70.1 percent of uninformed respondents did likewise. Similarly, 82.4 percent of informed respondents in the no-information group ranked multiple candidates and 78.7 percent used all of their allotted choices, compared to 67.2 and 66.7 of uninformed respondents from the no-information group. These differences in the propensity to use allotted rankings between uninformed and informed respondents are all statistically significant. Relative to informed respondents, the uninformed are less likely to take advantage of the greater opportunity for political expression that RCV elections provide.
In comparing respondents assigned to the voter-guide and no-information groups, we can determine whether providing citizens with an accessible issue-oriented voter guide improves political expression and alignment. Figure 1A reports the percentages of respondents in the voter-guide group who ranked a candidate, ranked multiple candidates, and gave a complete ranking of all candidates. Approximately 82.6 percent ranked at least one candidate, 78.9 percent ranked multiple candidates, and 72.5 percent used all allotted rankings. These are modest increases in political expression compared to the no-information group.
We observe similar improvements in alignment in the voter-guide group. Figure 1B displays agreement scores (the percentage of congruent policy positions) for candidates ranked first, second, and third by respondents in this group. Respondents and the candidates they ranked first agree on 59.7 percent of issues. This is a significantly greater agreement score than the 55.5 percent in the no-information group. It is also greater than the 56.9 percent agreement score respondents in the voter-guide group have with their second-choice candidate.
Importantly, uninformed respondents benefited the most from receiving the voter guide. As Figure 2A demonstrates, the voter guide increased the percentage of uninformed respondents who ranked a candidate, ranked multiple candidates, and used all of their allotted rankings, relative to the no-information group. These increases of between 5 and 8 percent are substantively large and marginally significant. In contrast, the voter guide has little impact on political expression among informed respondents. As Figure 2B shows, none of the differences between the voter-guide and no-information groups are significant for informed respondents. The combination of large effects on uninformed respondents and null effects on informed respondents means that the voter guide narrows the gap in political expression between these two types of respondents.
Finally, the voter guide modestly improves alignment among both uninformed and informed respondents. As Figure 2C reports, uninformed respondents in the voter-guide group have congruent positions with their first-choice candidate on 60.7 percent issues. This is significantly greater than the 53.9 percent among uninformed respondents in the no-information group. Figure 2D shows a similar increase among informed respondents, from 56.4 percent to 59.0 percent. We observe few differences in respondents’ second- and third-choice candidates.
Conclusion
The results reported here offer a mix of good and bad news for ranked-choice voting proponents. On the plus side, large majorities of citizens take advantage of the greater opportunity for political expression that RCV rules provide. We also find that, more often than not, citizens’ top choices in city council elections are candidates they agree with on many issues. However, this study documents significant disparities in political expression among different types of citizens. The propensity to rank a candidate, rank multiple candidates, and use all of their allotted rankings is significantly lower among uninformed citizens. Our analyses suggest this disparity is explained by uninformed citizens’ inability to distinguish between the candidates’ policy views in RCV elections.
The positive effects of the voter guide on both political expression and alignment demonstrate that these disparities are neither inevitable nor insurmountable. The voter guide, which summarized the candidates’ local policy positions, provided a basis for comparing little-known candidates. As such, it helped close the gap in political expression among informed and uninformed citizens. It also helped both types of citizens to better align their candidate rankings with their policy views. Future research, using similar methods and conducted in real-world election settings, can shed light on what types of information—whether provided on the ballot, in official ballot pamphlets, or by private voter education initiatives—can enable all types of citizens to take advantage of the greater opportunity for political expression under RCV systems.
Acknowledgments
This project was funded by New America and the Electoral Reform Research Group (ERRG), supported by Arnold Ventures. The authors would like to thank participants at the ERRG Research Development Conference, February 7, 2020, in Washington, D.C., for helpful comments and criticism.
Downloads
Citations
- Craig M. Burnett and Vladimir Kogan, “Ballot (and Voter) “Exhaustion” under Instant Runoff Voting,” Electoral Studies 37 (2015): 41-49.
- Cheryl Boudreau, Christopher S. Elmendorf, and Scott A. MacKenzie, “Racial or Spatial Voting?” American Journal of Political Science 63 (2019): 5-20.
- Cheryl Boudreau, Christopher S. Elmendorf, and Scott A. MacKenzie, “Roadmaps to Representation,” Political Behavior 41 (2019): 1001-1024.
- Pedro Hernandez, Jennifer Pae, Madeline Brown and Theodore Landsman, Voter Experience with Ranked Choice Voting in San Francisco (Takoma Park, MD: FairVote, 2018).
More About the Authors

Cheryl Boudreau
Jonathan Colner