
Table of Contents
Methodology
This report is based on the findings of a nationally-representative, probability-based telephone survey of 1,010 parents raising children ages three to 13 and reporting total household incomes below $75,000, the U.S. national median for households with minor children.1 Throughout the report, we sometimes refer to this population as “families,” “parents,” or “children” for shorthand. Unless otherwise specified, we are referring to families with children in the three- to 13-year-old age range and incomes below the national median.
The survey was conducted from March 10 to April 18, 2021, approximately one year into the COVID-19 pandemic in the U.S. It was fielded by the research firm SSRS and was offered in English or Spanish. A total of 176 respondents took the survey in Spanish. Institutional Review Board approval for the study was granted by Rutgers University. The average time to complete the survey was 20 minutes. A copy of the full questionnaire is included in the appendix to this report.
There are two aspects of our research design that distinguish this study from the many that have been conducted on U.S. families’ experiences during the pandemic.
First, we focus explicitly on families with incomes below the national median. This approach enables us to identify essential variations between lower-income families, because we have sub-samples of sufficient size to compare families’ experiences by, for example, parents’ education level; rural, suburban, or urban communities; or immigrant generation among Hispanics.
Second, other surveys on the effects of remote learning and the COVID-19 pandemic on students and families have used online panels. By contrast, we contacted parents by cellular and landline telephone. An investigation of digital inequality and its effects is inherently more inclusive when study participation does not require using those same technologies.
Sampling. To efficiently and effectively reach the low-to-moderate income parent population that met the study criteria, the sample plan consisted of two elements:
- First, respondents were pre-identified via the SSRS weekly Omnibus telephone survey as being in the specified income range and having a child at home in the specified age range (n=884). The SSRS Omnibus telephone survey is conducted weekly and uses a fully replicated, single-stage, random-digit-dialing (RDD) sample of landline telephone households and randomly generated cell phone numbers. The SSRS Omnibus completes more than 50,000 surveys annually, with 70 percent cellular telephone allocation.
- Second, eligible respondents reached and screened via the SSRS Opinion Panel, a probability-based multi-mode panel (n=126). All internet respondents are recruited to take web surveys while non-internet/web reluctant respondents can participate via phone. For this study, we invited eligible Opinion Panel respondents to take part in the survey by telephone only. Opinion panel members are recruited randomly based on nationally representative ABS (address based sample) design.
A modest over-sample of Black parents was conducted to achieve a total sample size of 200, and responses were then weighted down to their naturally occurring level. All respondents were offered a $10 incentive for participation.
Demographic variables. Data were analyzed by various demographic categories, including child age, household income, parent education, geographic location, parent race/ethnicity, and, among Hispanic parents, whether they were U.S.- or foreign-born. According to the U.S. Census Bureau, among parents with below-median incomes and three- to 13-year-old children, 44 percent are White non-Hispanic, 32 percent are Hispanic (20 percent foreign-born and 12 percent U.S.-born), 17 percent are Black, 5 percent are Asian-Pacific Islander, and 3 percent are other or mixed race/ethnicity.2 With a sample size of just over 1,000 respondents, we are able to report findings by race/ethnicity for families with White, Hispanic, or Black parents, but the number of respondents in other ethnic groups, such as Asian-Pacific Islanders or Native Americans, are too small to be able to analyze them separately. Throughout the report, the term “Hispanic” is used for consistency with our 2015 report and with Census Bureau terminology.
Weighting. Data were weighted to represent parents of children ages three to 13 with an annual household income less than $75,000. The data were weighted by first applying a base weight and then balancing the demographic profile of the sample to target population parameters for each racial group (White/Other race non-Hispanic; Black non-Hispanic; Hispanic). In addition, the data were weighted to account for systematic non-response along known population parameters that are generally present in surveys.
Margin of error. The total sample design effect for this survey is 1.71. Accounting for sample size and design effect, the margin of error for the entire sample is ±4.0 percentage points at a 95 percent confidence level.
Response rate. The response rate for this survey was calculated using AAPOR’s Response Rate 3 formula. This calculation divides the number of completed interviews in each sampling frame by the estimated number of eligible phone numbers in the frame. For the Omnibus prescreened sample, response rate was calculated to be 19 percent. For the Probability Panel sample, response rate was calculated to be 53 percent. Combined, the response rate was 20 percent.
Poverty level. Poverty level was calculated based on families’ annual income and number of household members, using federal poverty guidelines.3 Because the survey recorded family income in $5,000 increments, there were 42 respondents for whom we were unable to determine poverty level status; these respondents were excluded from the analyses that differentiated by poverty level.
Trend data. A first wave of this survey was conducted in 2015, and some of the findings in this report track findings from the 2015 survey. The full set of findings from that survey can be found in the report Opportunity For All? Technology and Learning in Lower-Income Families, released by the Joan Ganz Cooney Center at Sesame Workshop in February 2016. That survey was also conducted by SSRS, and the report was authored by the same team authoring this report. The 2015 survey included 1,191 parents of children ages six to 13, with incomes below the then-national median of approximately $65,000 year. The 2021 survey was expanded to include parents of children ages three to 13, with incomes below the current national median of approximately $75,000. In tables comparing findings over time, only parents with children in comparable age groups are included, by limiting 2021 findings to parents with children age six or older (n=799).
Statistical significance. Where relevant, differences over time or between demographic groups have been tested for statistical significance. Unless otherwise noted, findings are referred to in the text in a comparative manner (e.g., “more than,” “less than”) only if the differences are statistically significant at the level of p < .05 (i.e., differences as great as those noted would occur by chance no more than five times in 100).
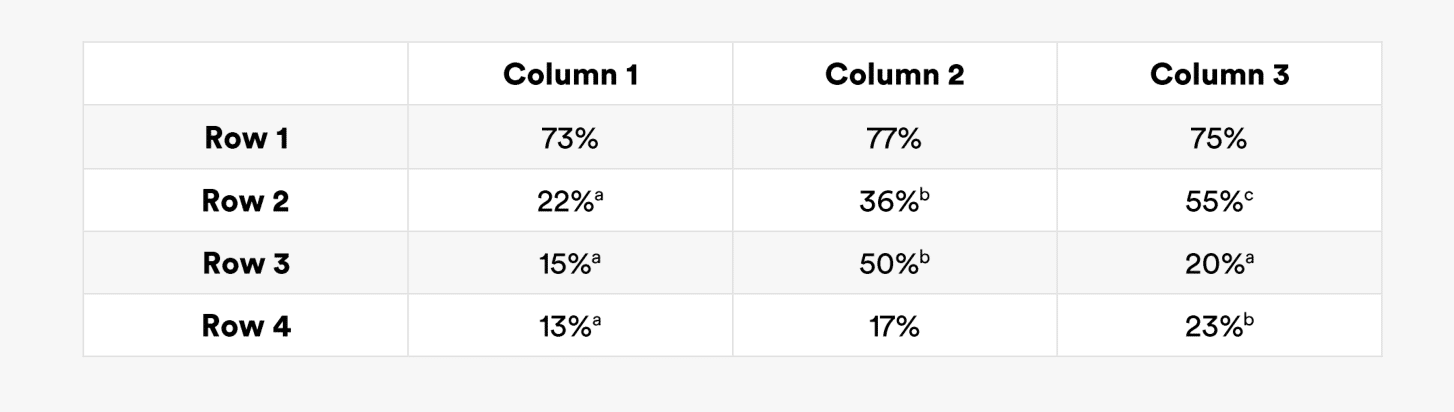
In tables where statistical significance has been tested, superscripts are used to indicate where results differ at p < .05. Items that share a common superscript, or that have no superscript, do not differ significantly. For example, in Row 1 below, none of the findings differ in a statistically reliable way. In Row 2, each item differs from the others significantly. In Row 3, the data point in Column 2 differs from those in Column 1 and Column 3, but Columns 1 and 3 do not differ from one another significantly. And in Row 4, Columns 1 and 3 differ from each other, but not from Column 2.
Parent quotes. All statistical results presented in the report are from the national survey. Throughout the report, we use quotes from parents to illustrate or amplify certain findings. These quotes come from one of two places: open-ended question items in the national survey or focus groups with a separate sample of parents that were conducted in conjunction with the national survey.
Open-ended responses. The survey included both closed- and open-ended questions. A closed question is one in which the respondent chooses from a set of pre-established responses that are read to him or her by the interviewer, such as “yes” or “no,” or “often,” “sometimes,” “hardly ever,” or “never.” An open-ended question is one in which the respondent answers in his or her own words, which are transcribed by the interviewer. This survey included two main types of open-ended responses: parents were asked to name specific educational apps, websites, TV shows, or videos that have been helpful to them during the pandemic; and parents were asked if they have any other important priorities for their child at school next year, beyond those already asked about in the survey. Open-ended responses about priorities for the coming school year were analyzed thematically, and direct quotations representative of broader patterns in those data are presented in the report. Examples of helpful educational media were coded by title, platform, and subject matter focus.
Focus groups. One-hour discussions on Zoom with eight groups of lower-income parents and grandparent caregivers of children ages three to six (34 adults in total) were conducted in three communities between April 12 and 22, 2021. Participants were recruited by local affiliates of Raising a Reader, a national nonprofit early literacy organization that serves low-income families. These local affiliates are Reading Ready Pittsburgh, Brilliant Detroit, and two organizations that serve families in Santa Clara County: Grail Family Services and First 5 California. Interested participants were asked to complete a short online survey to determine if they met the inclusion criteria of having young children and an annual household income below $75,000. The survey also gathered families’ sociodemographic data and information about their access to the internet and digital devices. Participants received $50 gift cards to retailers such as Target to compensate them for their time. Four discussions were conducted entirely in Spanish (two in Detroit and two in Santa Clara County), and transcripts of the conversations were translated to English for analysis.
Focus group questions reflected the core themes in the telephone survey but allowed for open-ended discussions of families’ decision-making and experiences. Representative quotes are included in this report, and briefs for each of the three communities are published separately and available here.
Credits. Victoria Rideout developed a first draft of this report, including charts, tables, and analyses. Data analyses of the quantitative survey findings were conducted by Melissa Saphir of Saphir Research. Open-ended survey questions, in which parents were asked to provide examples of media content, were coded by Anna Kimura and Remi Torres, graduate students at the University of California, Los Angeles, under the direction of Makeda Mays Green of Nickelodeon. Open-ended survey responses concerning parents’ priorities for the next school year were coded by Vikki Katz. Focus groups were conducted by Laura Zimmerman, with assistance in facilitating Spanish-language groups from Coral Arrua and Sebastian Gonzalez de Leon. Sabrina Detlef copyedited the report and Fabio Murgia oversaw graphics and design.
Citations
- U.S. Department of Housing and Urban Development, Notice PDR-2020-1, issued April 1, 2020, “Estimated Median Family Incomes for Fiscal Year 2020.” The median national income for families in the U.S. in 2020 was $78,500. Because the survey captured family income in $5,000 increments, families were included if their annual income was below $75,000/year.
- Steven Ruggles, Sarah Flood, Ronald Goeken, Josiah Grover, Erin Meyer, Jose Pacas, and Matthew Sobek, IPUMS USA: Version 10.0 [dataset]. Minneapolis, MN: IPUMS, 2020, source
- source. Federal poverty guidelines are issued by the U.S. Department of Health and Human Services and used to determine eligibility for federal programs. They are sometimes referred to as the “federal poverty level.” The poverty guideline for a family of four in 2021 is $26,500.