Katz and Rideout – Learning at Home While Under-Connected
Table of Contents
Abstract
This report presents the findings of a nationally representative, probability-based telephone survey of more than 1,000 parents of children ages three to 13, all with household incomes below the national median for families in the United States (i.e., $75,000). The survey was conducted in March and April of 2021: one year into the pandemic, and a crucial turning point. Parents could reflect on a full year of remote learning and pandemic parenting, and also look forward—thanks to the proliferation of vaccines—to their children’s full and safe return to in-person schooling in the fall. But this survey goes beyond documenting families’ challenges. We also uncover what parents feel they have learned through this pandemic year, from increased confidence in their ability to help their child with schoolwork to greater comfort communicating with teachers and developing a deeper understanding of their child’s learning patterns. And we look ahead to the next school year, delving into what parents think schools’ priorities should be for smoothing their children’s transitions to, or back into, the classroom in the fall of 2021.
Acknowledgments
The authors are deeply grateful to Michael Levine of Noggin and Lisa Guernsey of New America for their partnership through every stage of this project. We also thank Makeda Mays Green of Nickelodeon for her valuable insights and for reviewing drafts of the survey instrument and the final report, and Laura Zimmermann for helping gather parent quotes to insert based on her qualitative research in communities. Ralph Smith and Yolie Flores of the Campaign for Grade-Level Reading graciously connected us to their organizational partners across the U.S., who helped us identify the issues that mattered most to families with young children in the midst of the pandemic. We also thank Fabio Murgia, Riker Pasterkiewicz, Julie Brosnan, and Joe Wilkes at New America for communications and production support.
We also gratefully acknowledge the generous financial support from Noggin, Overdeck Family Foundation, Carnegie Corporation of New York, The Grable Foundation, and Silicon Valley Community Foundation that made this research and report possible. The focus groups were supported in partnership with Raising A Reader, Reading Ready Pittsburgh, Brilliant Detroit, Grail Family Services, and FIRST 5 Santa Clara County.
This project is a collaboration between New America and Rutgers University New Brunswick.
Introduction
In March 2020, the COVID-19 pandemic radically changed life in this country almost overnight. The nation began sheltering in place: school buildings were closed, playgrounds locked, and child care facilities shuttered, dramatically upending families’ lives in the process. Life—and learning—were hastily moved online.
Students’ unequal access to broadband and digital devices have concerned educators and policymakers for years. But when the pandemic shifted schooling into remote learning, a stable internet connection and functional digital device were no longer part of a quality education; they became the only way for families with school-aged children to continue learning at home. As remote learning stretched from weeks, to months, and then to whole school terms, it became clear that digital inequality was affecting the ability of students in lower-income families to remain engaged in school virtually. Some of these families’ digital equity issues have been well documented, but there is still much more that policymakers and educators need to know about their experiences learning at home during the pandemic, and their priorities for school next year.
This report presents the findings of a nationally representative, probability-based telephone survey of more than 1,000 parents of children ages three to 13, all with household incomes below the national median for families in the United States (i.e., $75,000).1 The survey was conducted in March and April of 2021: one year into the pandemic, and a crucial turning point. Parents could reflect on a full year of remote learning and pandemic parenting, and also look forward—thanks to the proliferation of vaccines—to their children’s full and safe return to in-person schooling in the fall.
In the survey, we focus on seven key topics:
- Access to computers and home internet service
- Educational disruptions that occurred due to insufficient access
- Assets that parents gained by having to guide their children’s remote learning, which educators can build on going forward
- Parents’ priorities for their children’s return to school in September 2021
- The role of informal educational media2 in helping children to continue to learn and grow during the pandemic
- Whether and how early childhood reading patterns changed during COVID
- How parents, children, and siblings engaged technology to learn together at home
In documenting digital access, we not only cover families that are “unconnected,” but the more common experience we define as being “under-connected”; that is, families whose access is unreliable or insufficient for their needs. We also explore how variations in being under-connected relate to the extent of educational disruptions that families have experienced in the past year.
But this survey goes beyond documenting families’ challenges. We also uncover what parents feel they have learned through this pandemic year, from increased confidence in their ability to help their child with schoolwork to greater comfort communicating with teachers and developing a deeper understanding of their child’s learning patterns. And we look ahead to the next school year, delving into what parents think schools’ priorities should be for smoothing their children’s transitions to, or back into, the classroom in the fall of 2021.
There are two aspects of our research design that distinguish this study from the many that have been conducted on U.S. families’ experiences during the pandemic. First, because our survey focuses exclusively on families raising children on household incomes below the national median, we can explore meaningful variations among lower-income families related to race/ethnicity, immigrant generation, geography, parent education, and whether or not the family’s income is below the federal poverty level.3
Second, we contacted parents by cellular and landline telephone, whereas most surveys on the pandemic’s effects on students and families have relied on web-based, online panels. The sampling strategies these panels use have become more robust, but we maintain that a study of digital inequality and its effects is inherently more inclusive when participating does not require using those very same technologies.
All statistical findings in this report are from the quantitative survey data. Data were analyzed by demographic categories including child age, household income, parent education, geographic location, parent race/ethnicity, and, among Hispanic4 parents, whether they were U.S.- or foreign-born.
According to the 2019 American Community Survey data from the U.S. Census Bureau, among parents with below-median incomes and three- to 13-year-old children, 44 percent are White non-Hispanic, 32 percent are Hispanic (20 percent foreign-born and 12 percent U.S.-born), 17 percent are Black, 4 percent are Asian-Pacific Islander, and 3 percent are other or mixed race/ethnicity.5
With a sample size of just over 1,000 respondents, we are able to report findings by race/ethnicity for families with White, Hispanic, or Black parents, but there are too few respondents in racial or ethnic groups that compose smaller shares of the population for us to be able to examine them separately (although they are included proportionally in the full sample).
The report also includes representative quotes drawn from open-ended questions in the survey and from a series of companion focus groups that were conducted virtually during April 2021 with parents in Detroit, MI; Pittsburgh, PA; and in Santa Clara County, CA (in and around San Jose).
The pandemic made it clear that high-speed, consistent internet connectivity and fully functional digital devices are a necessity, not a luxury. The importance of being connected will not fade away once schooling resumes nationwide. Technology is essential for students and their families: for communicating with teachers, tracking assignments, checking grades, researching projects, watching tutorials, practicing skills, or investigating extracurricular activities.
True educational opportunity demands digital equity. Unequal access to digital devices caused a massive, nationwide scramble for families in the spring of 2020.6 We need to build on what we have learned from this crisis to ensure that families and educators have the digital tools they need to support children’s transitions out of remote and hybrid learning—and to help all children to realize their full potential in the critical years ahead.
Citations
- U.S. Department of Housing and Urban Development, Notice PDR-2020-1, issued April 1, 2020, “Estimated Median Family Incomes for Fiscal Year 2020.” The median national income for families in the U.S. in 2020 was $78,500. Because the survey captured family income in $5,000 increments, families were included if their annual income was below $75,000/year.
- In this report, we use the term “informal educational media” to refer to media that parents consider educational, but that is not related to school or schoolwork.
- source. Federal poverty guidelines are issued by the U.S. Department of Health and Human Services and used to determine eligibility for federal programs. They are sometimes referred to as the “federal poverty level.” The poverty guideline for a family of four in 2021 is $26,500.
- This report uses the term Hispanic rather than Latinx for consistency with Census Bureau designations and with terminology in the first wave of this survey, conducted in 2015.
- Steven Ruggles, Sarah Flood, Ronald Goeken, Josiah Grover, Erin Meyer, Jose Pacas, and Matthew Sobek. “IPUMS USA: Version 10.0” [dataset] (Minneapolis, 2020), source
- Across the U.S., "nearly every state either ordered or recommended that schools remain closed through the end of the 2019–20 school year." Holly Peele & Maya Riser-Kositsky, “Coronavirus and School Closures in 2019-2020,” Education Week, September 16, 2020, source
Key Findings
Unless otherwise specified, all findings are among families with children ages three to 13 years old, and with incomes below the national median of $75,000 a year.
1. Rates of home internet access and computer ownership are up substantially from 2015, but many children from families with incomes below the national median still lack the essentials.
- One in seven children still does not have broadband internet access at home.
- Among all families in the survey, 11 percent still have mobile-only, 3 percent have dial-up, and 1 percent have no internet access at home.
- In families with incomes below the federal poverty level: one in four (25 percent) still have mobile-only (17 percent), dial-up (7 percent), or no internet service at all (1 percent).
- In families headed by immigrant Hispanic parents: just 72 percent have broadband service, compared with 80 percent of White families, 91 percent of families with U.S.-born Hispanic parents, and 92 percent of Black families.
- Cost remains the primary reason many families lack internet access.
- A plurality (35 percent) cite expense as the major factor, while 19 percent say they do not really need the internet, and 12 percent say there is no good service available in their community.
- There were no statistically significant differences in the type of home internet access based on whether the respondent lived in an urban, rural, or suburban area.
- Most children now have a computer at home, but one in eight still does not.
- Eighty-eight percent of three- to 13-year-olds now have a computer at home, but 12% still do not.
- Among families with six- to 13-year-olds, 91 percent now have a computer at home—up from 82 percent in 2015, when we first surveyed families with children in this age group.
- The increase has been especially pronounced among families living below the poverty level (from 69 percent in 2015 to 86 percent in 2021) and among families headed by immigrant Hispanic parents (from 63 percent to 81 percent).
- Access to home internet service is up substantially from 2015.1
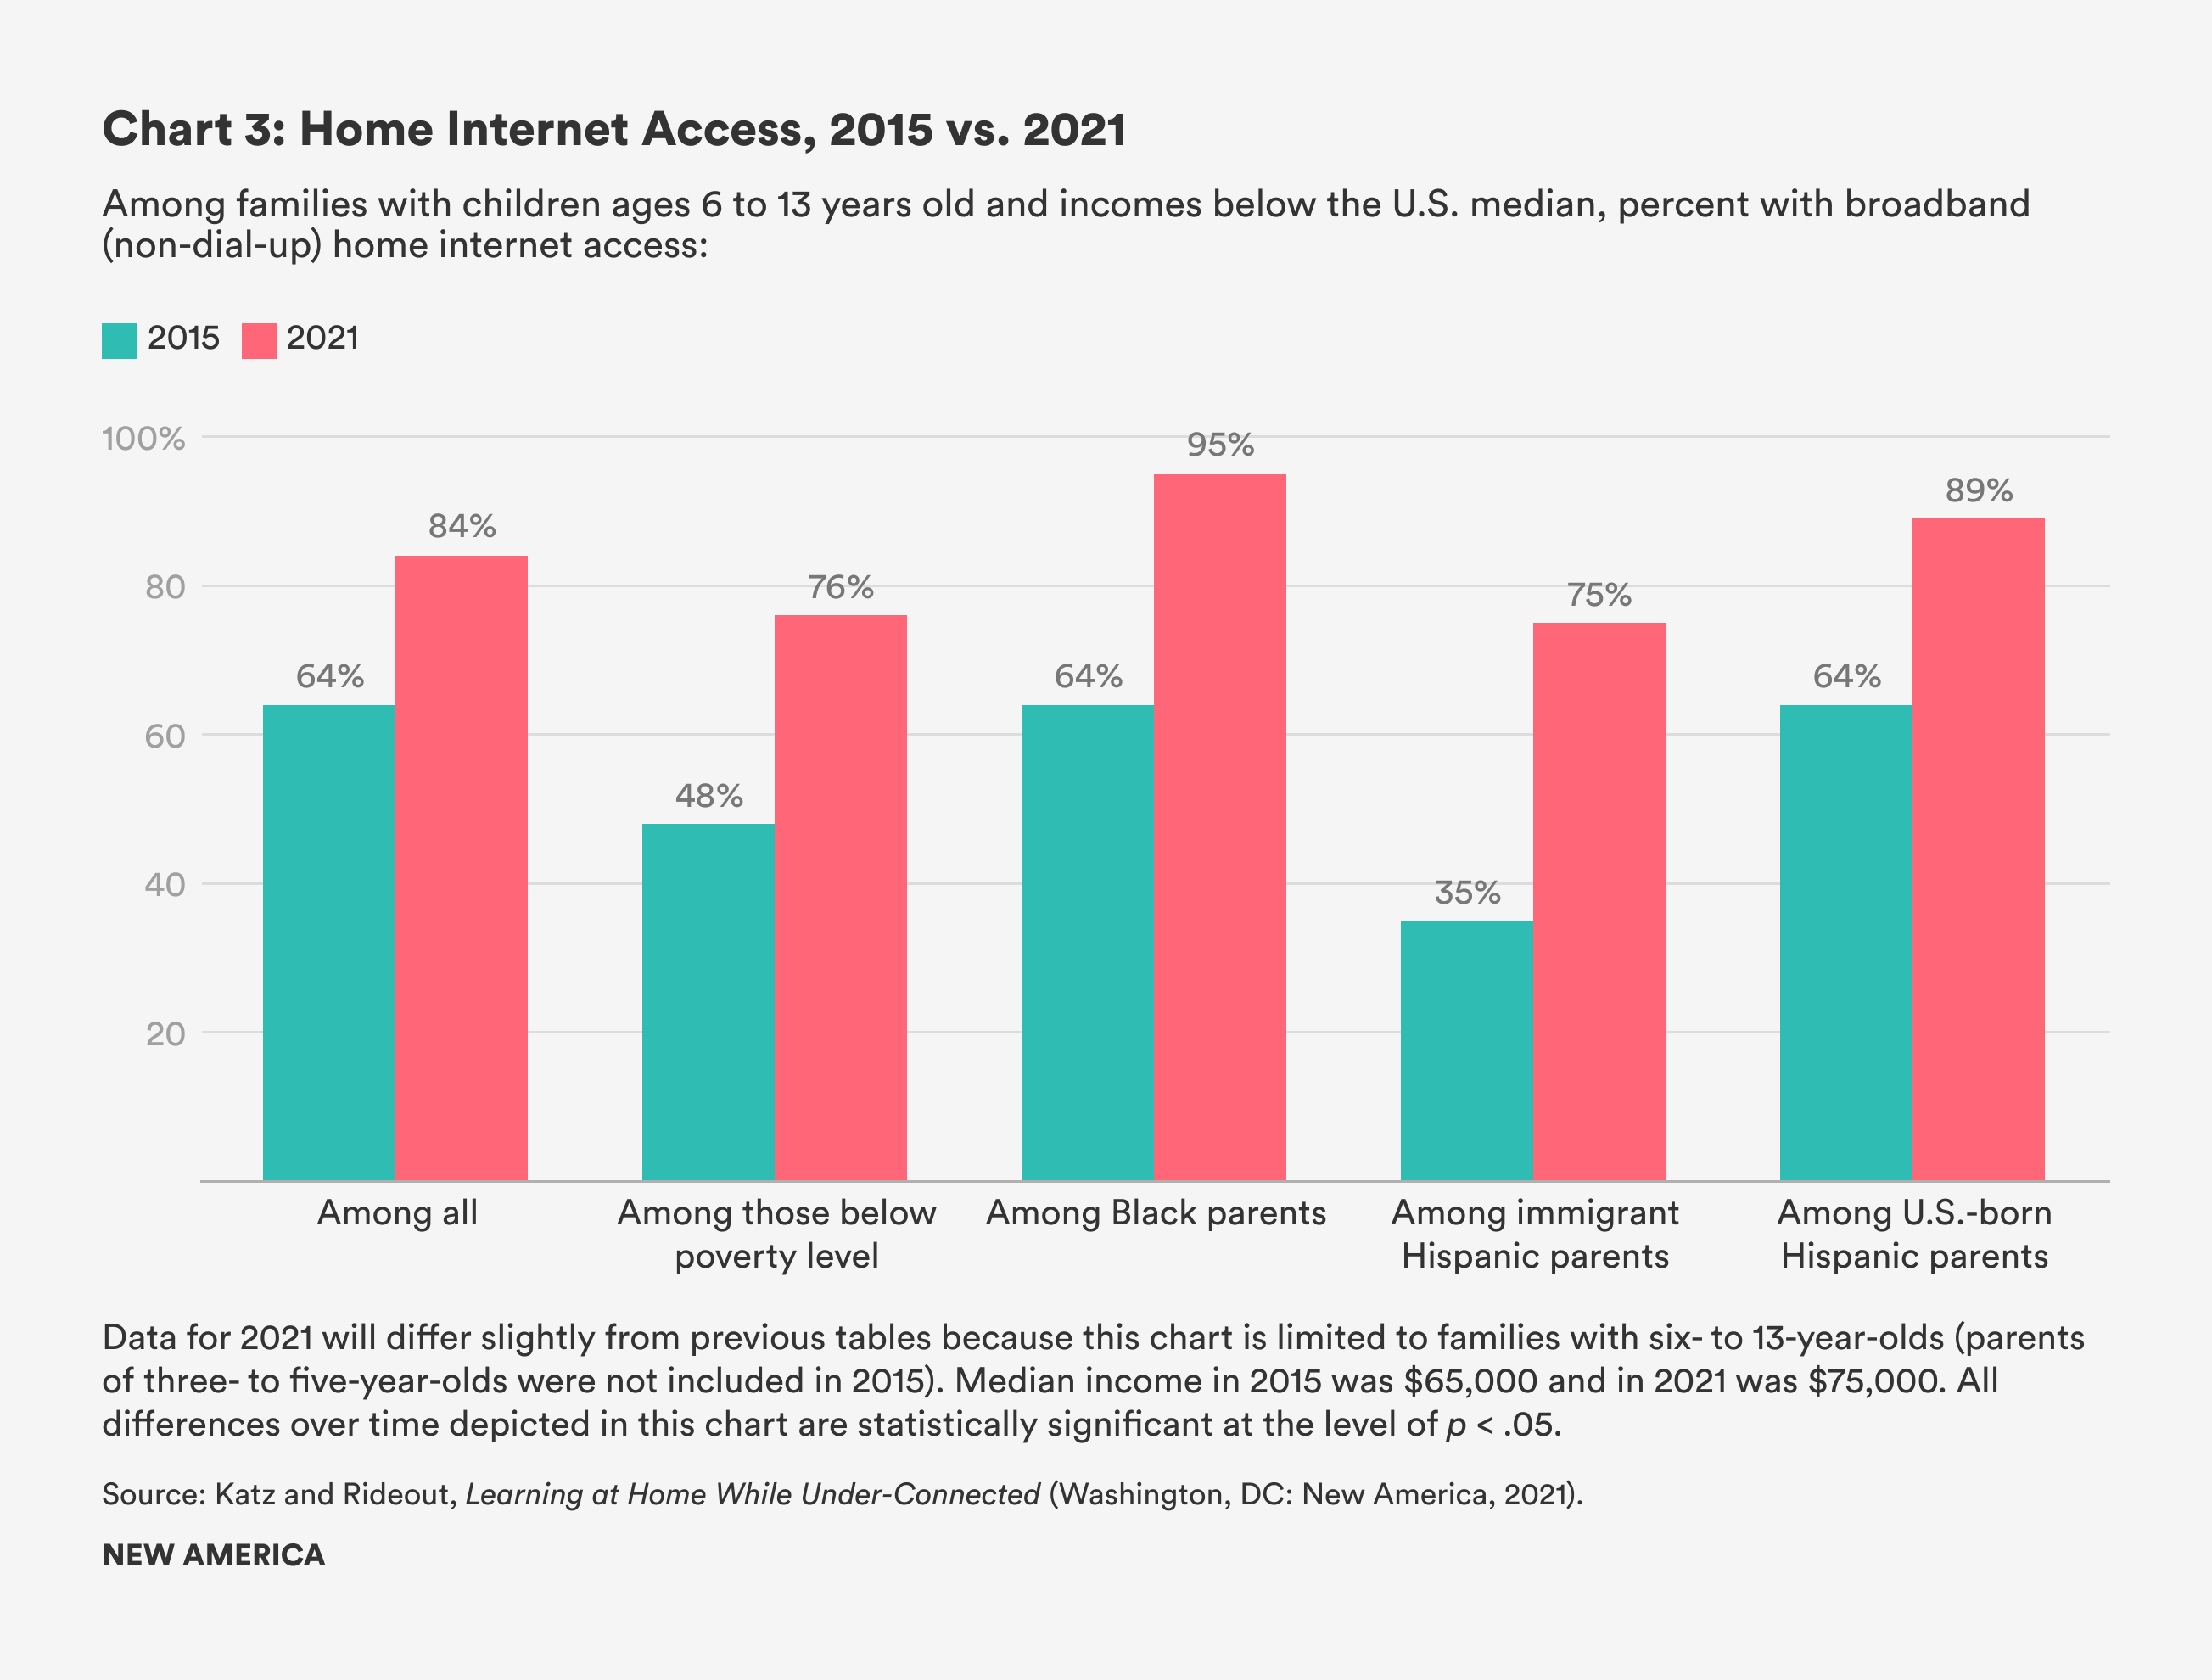
- Among families with children ages 6 to 13, access to non-dial-up home internet service has increased from 64 percent in 2015 to 84 percent in 2021.
- Especially notable increases have occurred among families with incomes below the poverty level (from 48 percent in 2015 to 76 percent in 2021), among Black households (64 percent to 95 percent), and among families headed by immigrant Hispanic parents (from 35 percent to 75 percent).
2. Even among families with computers and broadband internet access at home, a majority are “under-connected,” meaning that they report insufficient and unreliable access to the internet and internet-connecting devices.
- Among families who have broadband home internet service:
- 56 percent say their service is too slow.
- 18 percent say their service has been cut off at least once in the past 12 months due to trouble paying for it.
- Among those who only have internet access via a smartphone or tablet (mobile-only access):
- 34 percent say they hit the data limits in their plan at least once in the past year, preventing them from being consistently connected to the internet.
- 28 percent say they have a hard time getting as much time on devices as they need, because too many people are sharing them.
- 16 percent say their mobile phone service has been cut off at least once during the past year because they could not pay for it.
- Among those with a computer at home:
- 59 percent say it does not work properly or runs too slowly.
- 22 percent say it is hard to get time on it because there are too many people sharing it.
- The proportion of lower-income families who are under-connected hardly changed at all between 2015 and 2021—despite large increases in rates of home broadband and computer access.
3. The majority of students learning remotely this year experienced disruptions in their education due to being under-connected.
- More than half (53 percent) of remote students experienced one of the following disruptions at some point during the past year:
- 34 percent were unable to participate in class or complete their schoolwork due to a lack of internet access.
- 32 percent had to attend school or do their schoolwork on a smartphone for some period of time.
- 21 percent were unable to participate in school or finish their schoolwork because they could not access a computer.
- The type and quality of a family’s internet access has a direct impact on students’ school participation.
- Among parents with mobile-only or dial-up internet, half (52 percent) said their lack of internet access prevented their children from participating or completing their schoolwork at some point over the past year, compared with 32 percent of those with non-dial-up home access.
4. The digital challenges of remote learning hit families in the lowest income bracket and those headed by Black or Hispanic parents hardest.
- Among those with incomes below the federal poverty level:
- 65 percent reported that lacking access to a computer or the internet had prevented their children from participating in class, completing their schoolwork, or had necessitated participating in class via a smartphone. 48 percent of students in families living above the poverty line (but still below the median annual household income of $75,000) reported these same challenges.
- Among Hispanic and Black families:
- Majorities of Hispanic (66 percent) and Black (56 percent) parents report that their children experienced these obstacles to school participation, compared with 42 percent of White parents.
- Among families headed by immigrant Hispanics:
- 75 percent have experienced some of these disruptions in learning, with lack of internet access (52 percent) being the most likely cause for students being unable to attend school or do their schoolwork.

5. While remote learning was a tremendous stressor for parents, many also reported gaining new insights into their children’s schoolwork and learning habits, assets that can benefit families and schools moving forward.
- The majority of parents deepened their understanding of their children as learners.
- Two-thirds of parents (66 percent) say they know more about their child’s strengths and weaknesses as a learner now than they did before the pandemic.
- 62 percent say they know more about what their child is learning in school now, as compared with prior to the pandemic.
- Many parents are more confident and comfortable being involved in their child’s education.
- 43 percent say they are more comfortable communicating with their children’s teachers now than they were before the pandemic.
- 44 percent say they are more confident helping their child with their schoolwork than they were before remote learning.
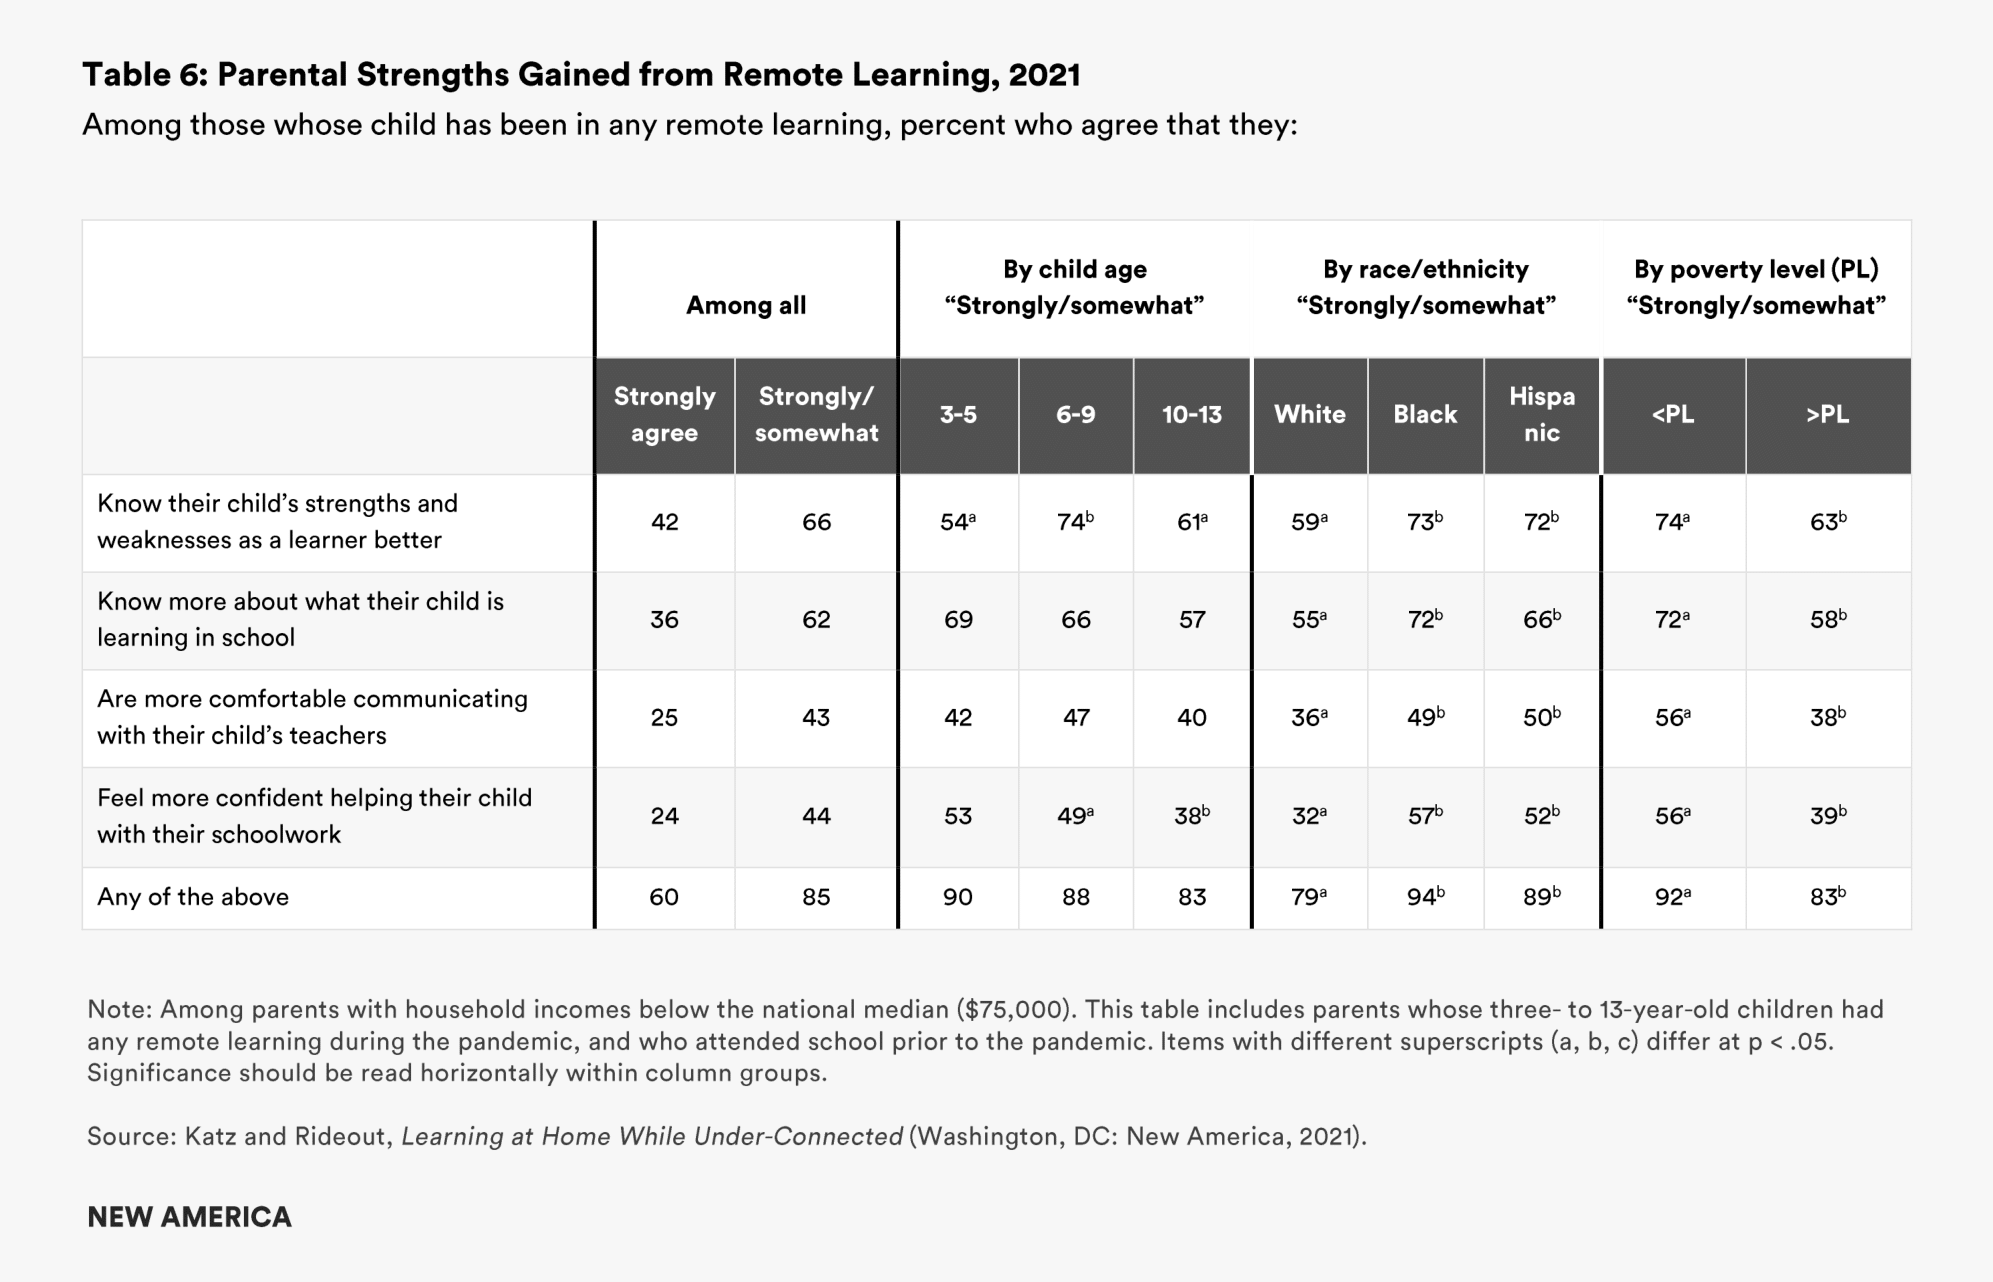
- Black and Hispanic parents, as well as families with household incomes below the poverty line, report the largest gains across all these measures. For example, 57 percent of Black parents, 56 percent of parents with incomes below the federal poverty level, and 52 percent of Hispanic parents say they now feel more confident helping their child with their schoolwork than prior to the pandemic, compared to 32 percent of White parents and 39 percent of those with incomes above the poverty level (but still below $75,000).
6. Parents prioritize social and emotional development ahead of academics for the upcoming school year.
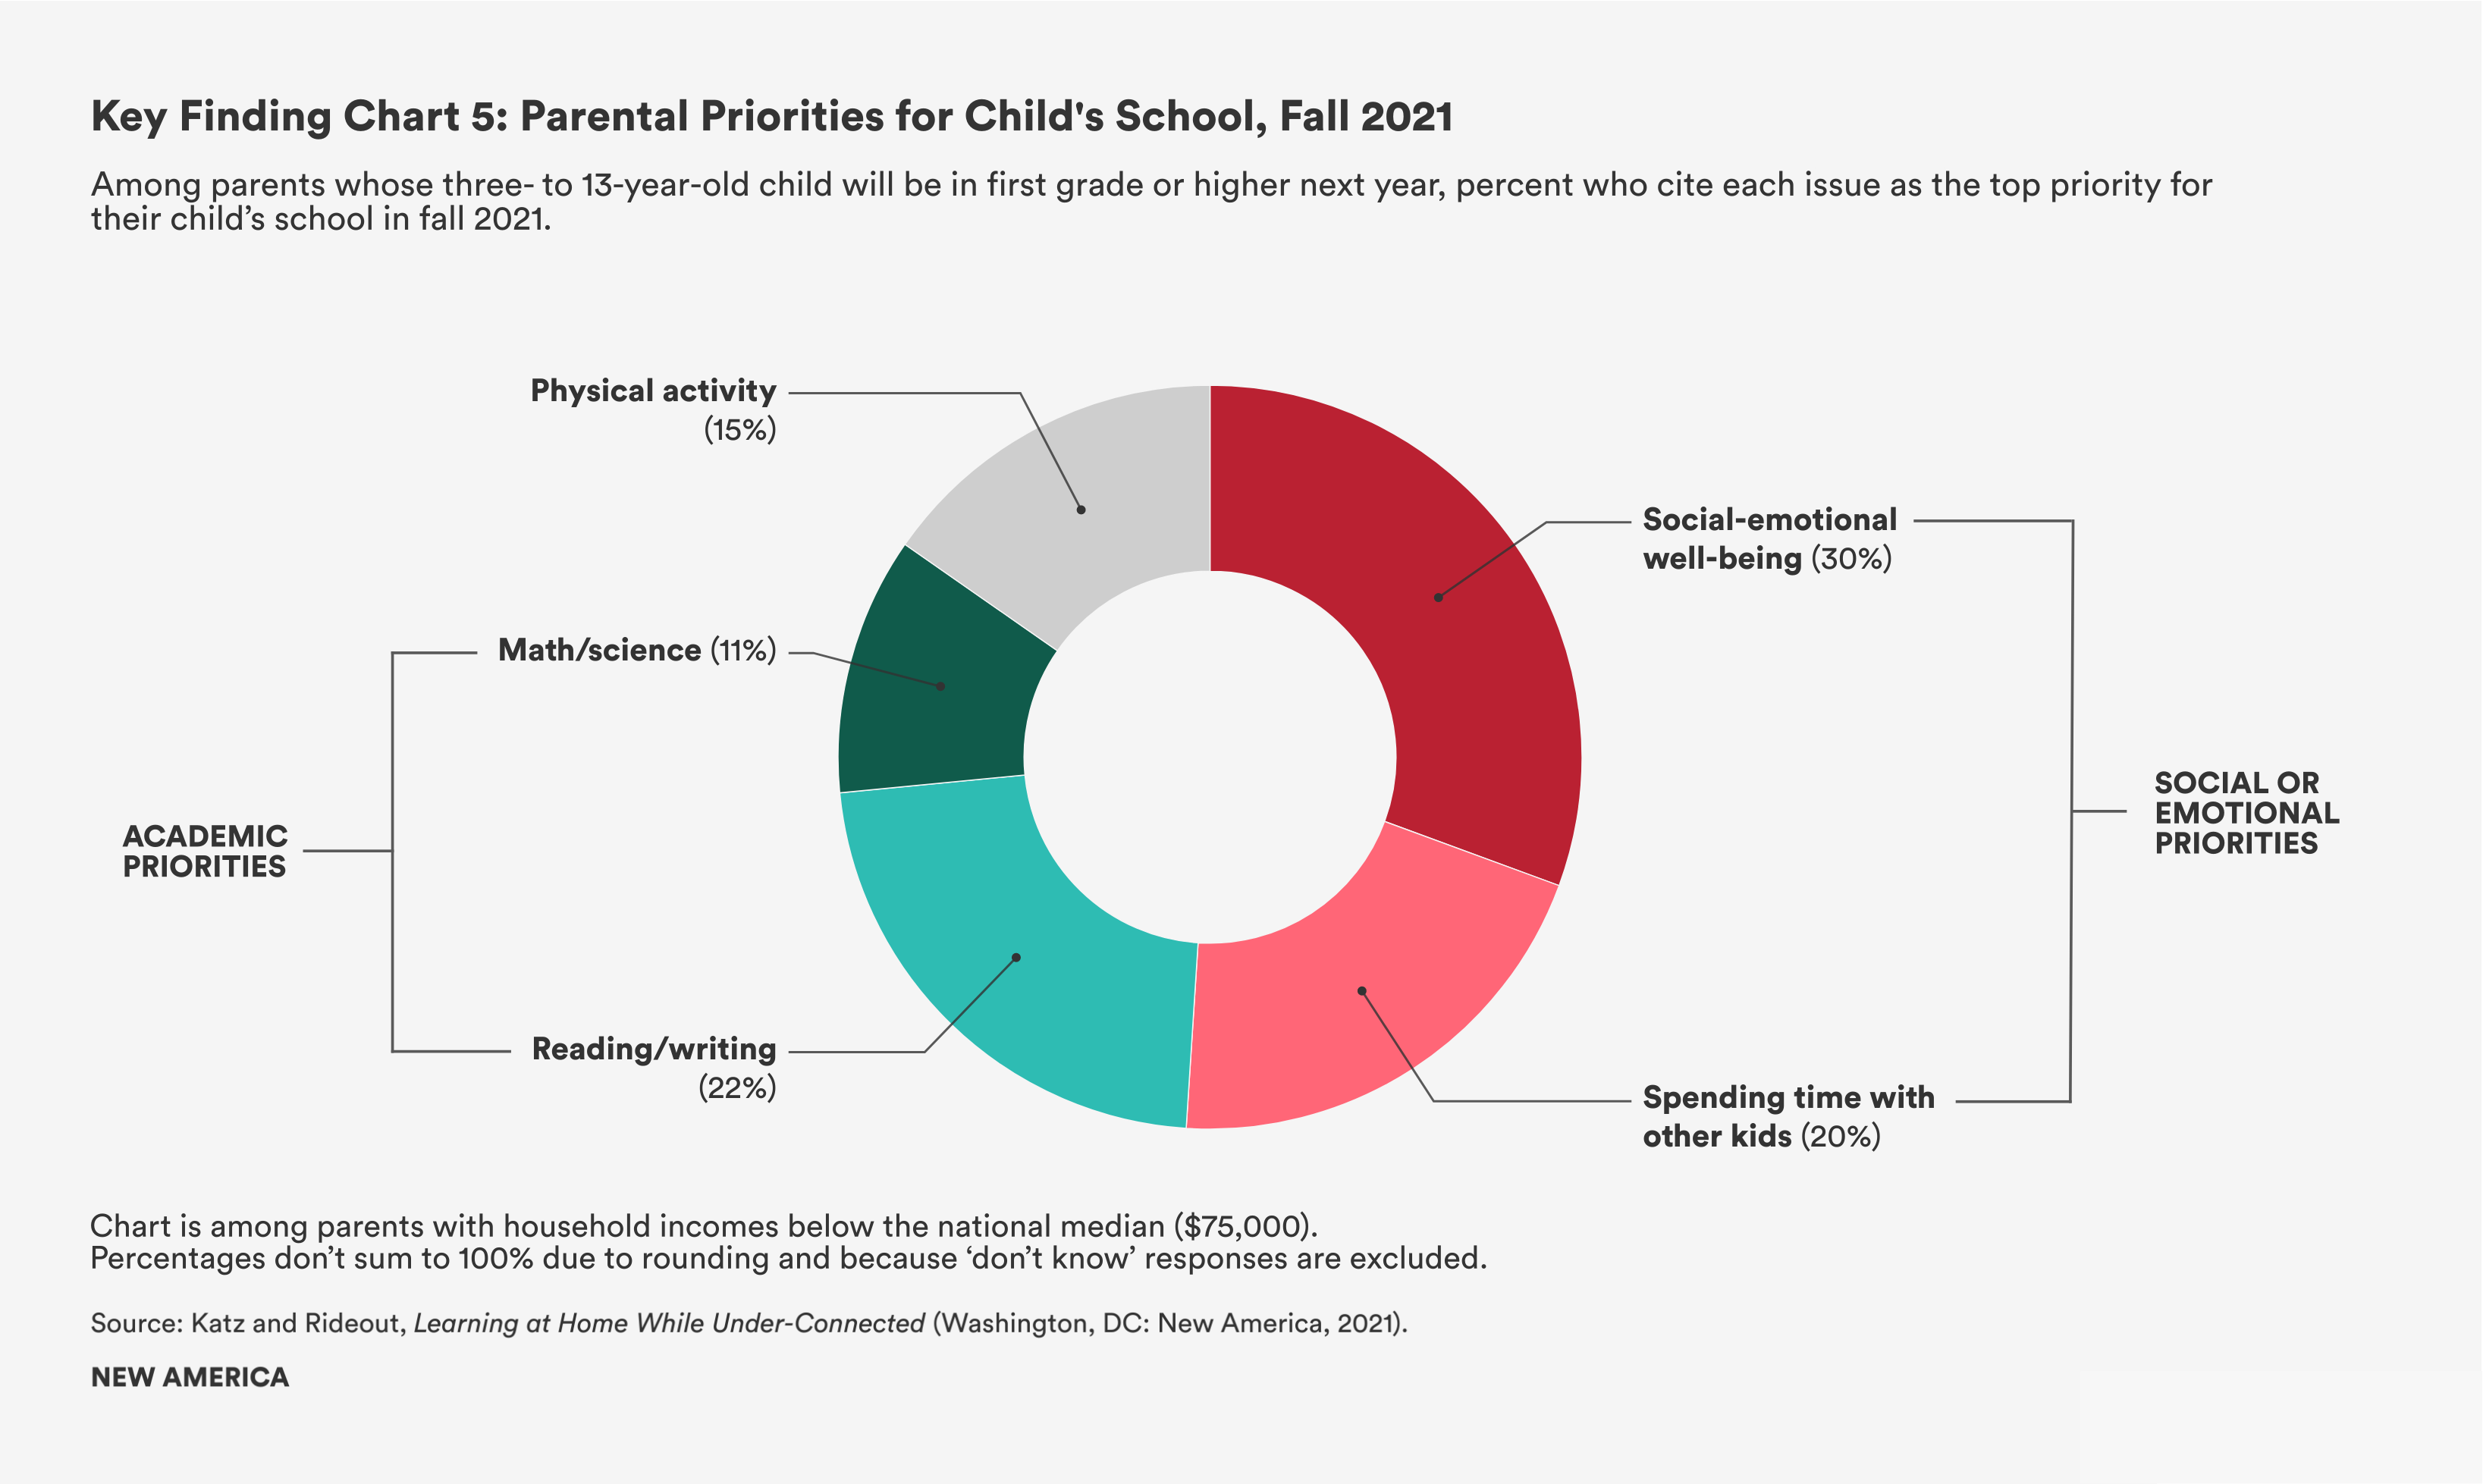
- Social and emotional well-being: Half of parents whose children will be entering first grade or higher say the most important priority for school next year is either their child’s social and emotional well-being (30 percent), or simply getting to spend time with other kids (20 percent).
- Academics: One-third of parents say academic issues are most important for their child, including reading and writing (22 percent) or math and science (11 percent).
- Physical activity: The rest (15 percent) say their top priority is their child being physically active.
7. Many families have relied on informal educational media to help keep kids growing and learning during the COVID-19 pandemic.
- Frequency of educational media use: One-third of parents say their children “often” watch educational TV shows (33 percent) and online videos (32 percent), play educational games (33 percent), or use digital devices to make art or music or engage in other creative activities (36 percent).
- Helpfulness of educational media: About half of parents whose children “often” use educational TV shows, videos, or games say they have been “very” helpful in keeping children learning and growing during the pandemic (57 percent for educational videos, 51 percent for TV shows and digital games).
- The lowest-income families rely most on educational media. Children whose household incomes are below the federal poverty level—who are also disproportionately affected by disruptions to remote schooling—are making the most use of informal educational TV shows and videos. 40 percent of children in these households “often” watch educational TV and 41 percent watch educational online videos (compared to 30 percent and 29 percent of those with household incomes above the poverty level).
8. Family reading patterns shifted during the pandemic.
- Frequency of reading: 23 percent of parents with three- to nine-year-olds say they have spent more time reading with their children during the pandemic than they did previously, while 10 percent said they were reading less frequently than before.
- Access to print books: 30 percent of parents say it has been harder to get print books for their children during the pandemic; this was especially true among Hispanic parents (39 percent) and those whose incomes are below the poverty level (42 percent).
- Use of e-books: 41 percent of parents say their children read e-books more now than they did before the pandemic.
9. Parents and children help each other learn with technology, even more than they did in 2015.
- Parents and children are equally likely to help each other with technology. More than half of parents (55 percent) say they often or sometimes help their 10- to 13-year-olds with computers or the internet. A nearly identical proportion (56 percent) say their 10- to 13-year-olds often or sometimes help them with technology.
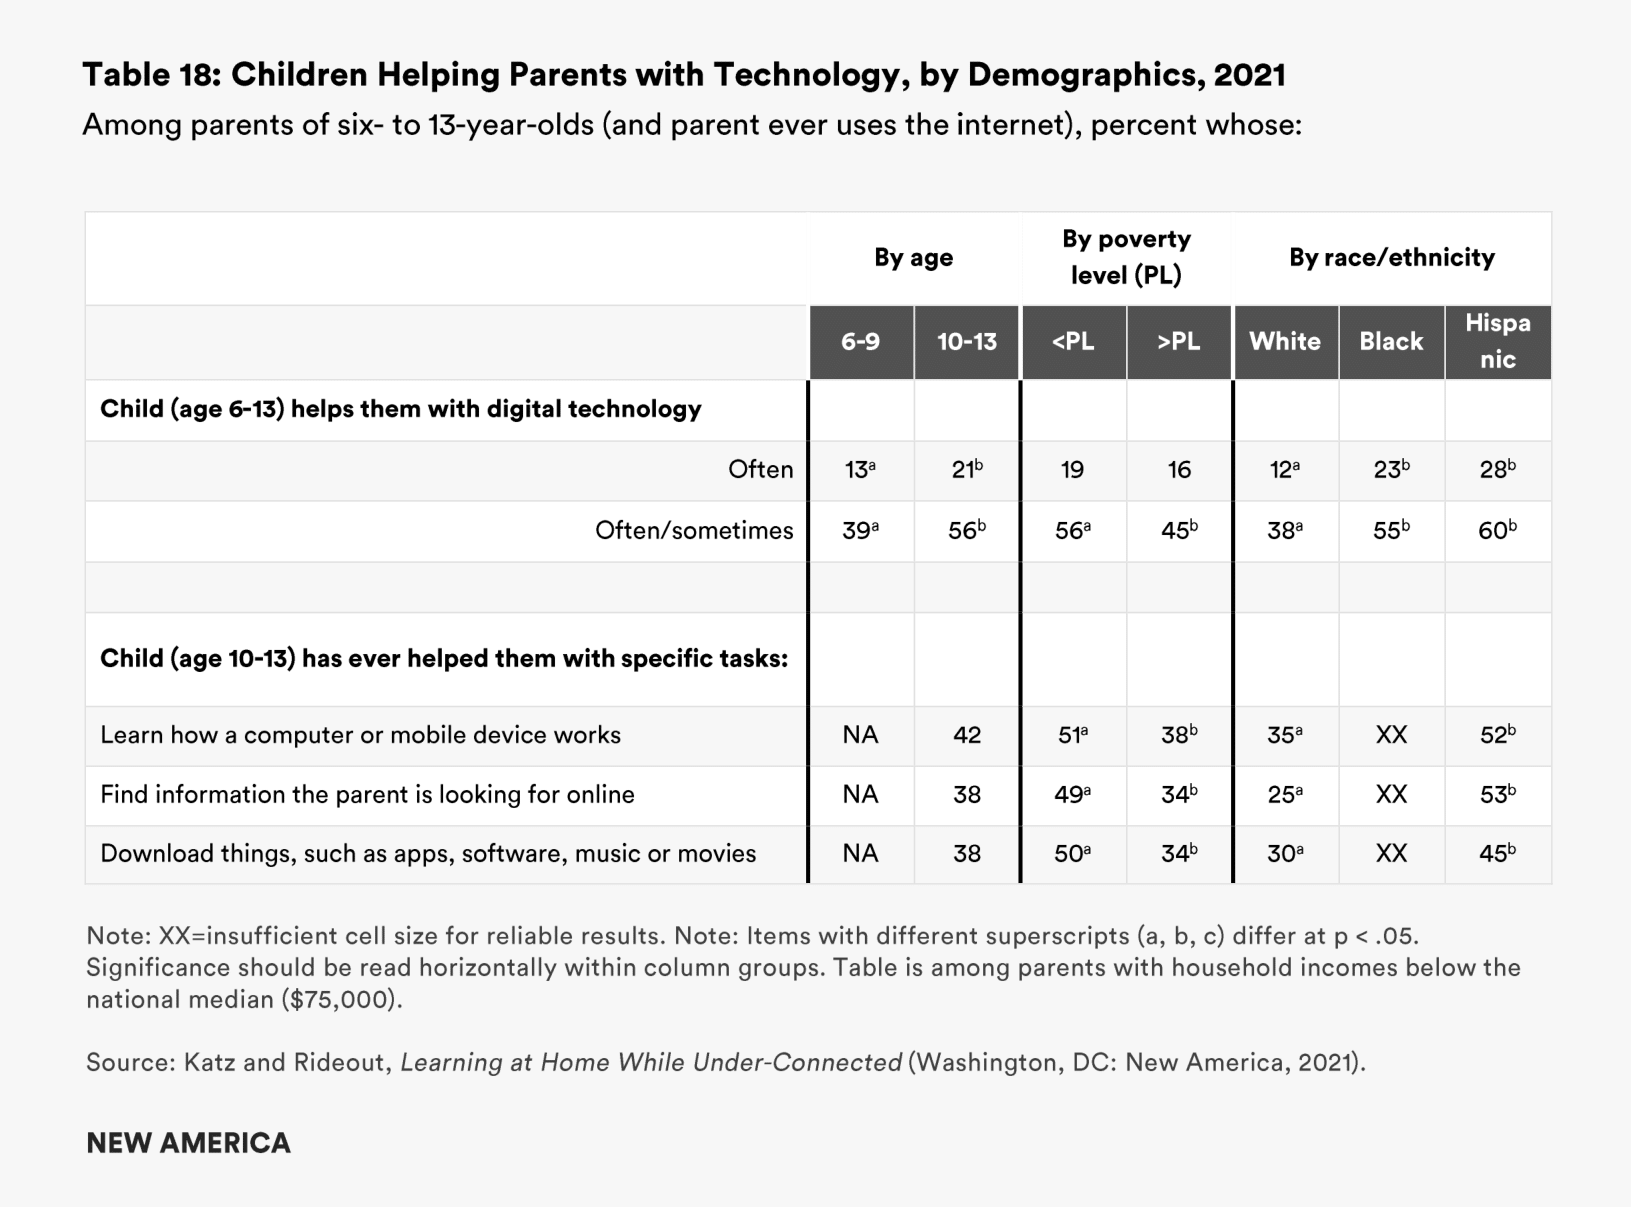
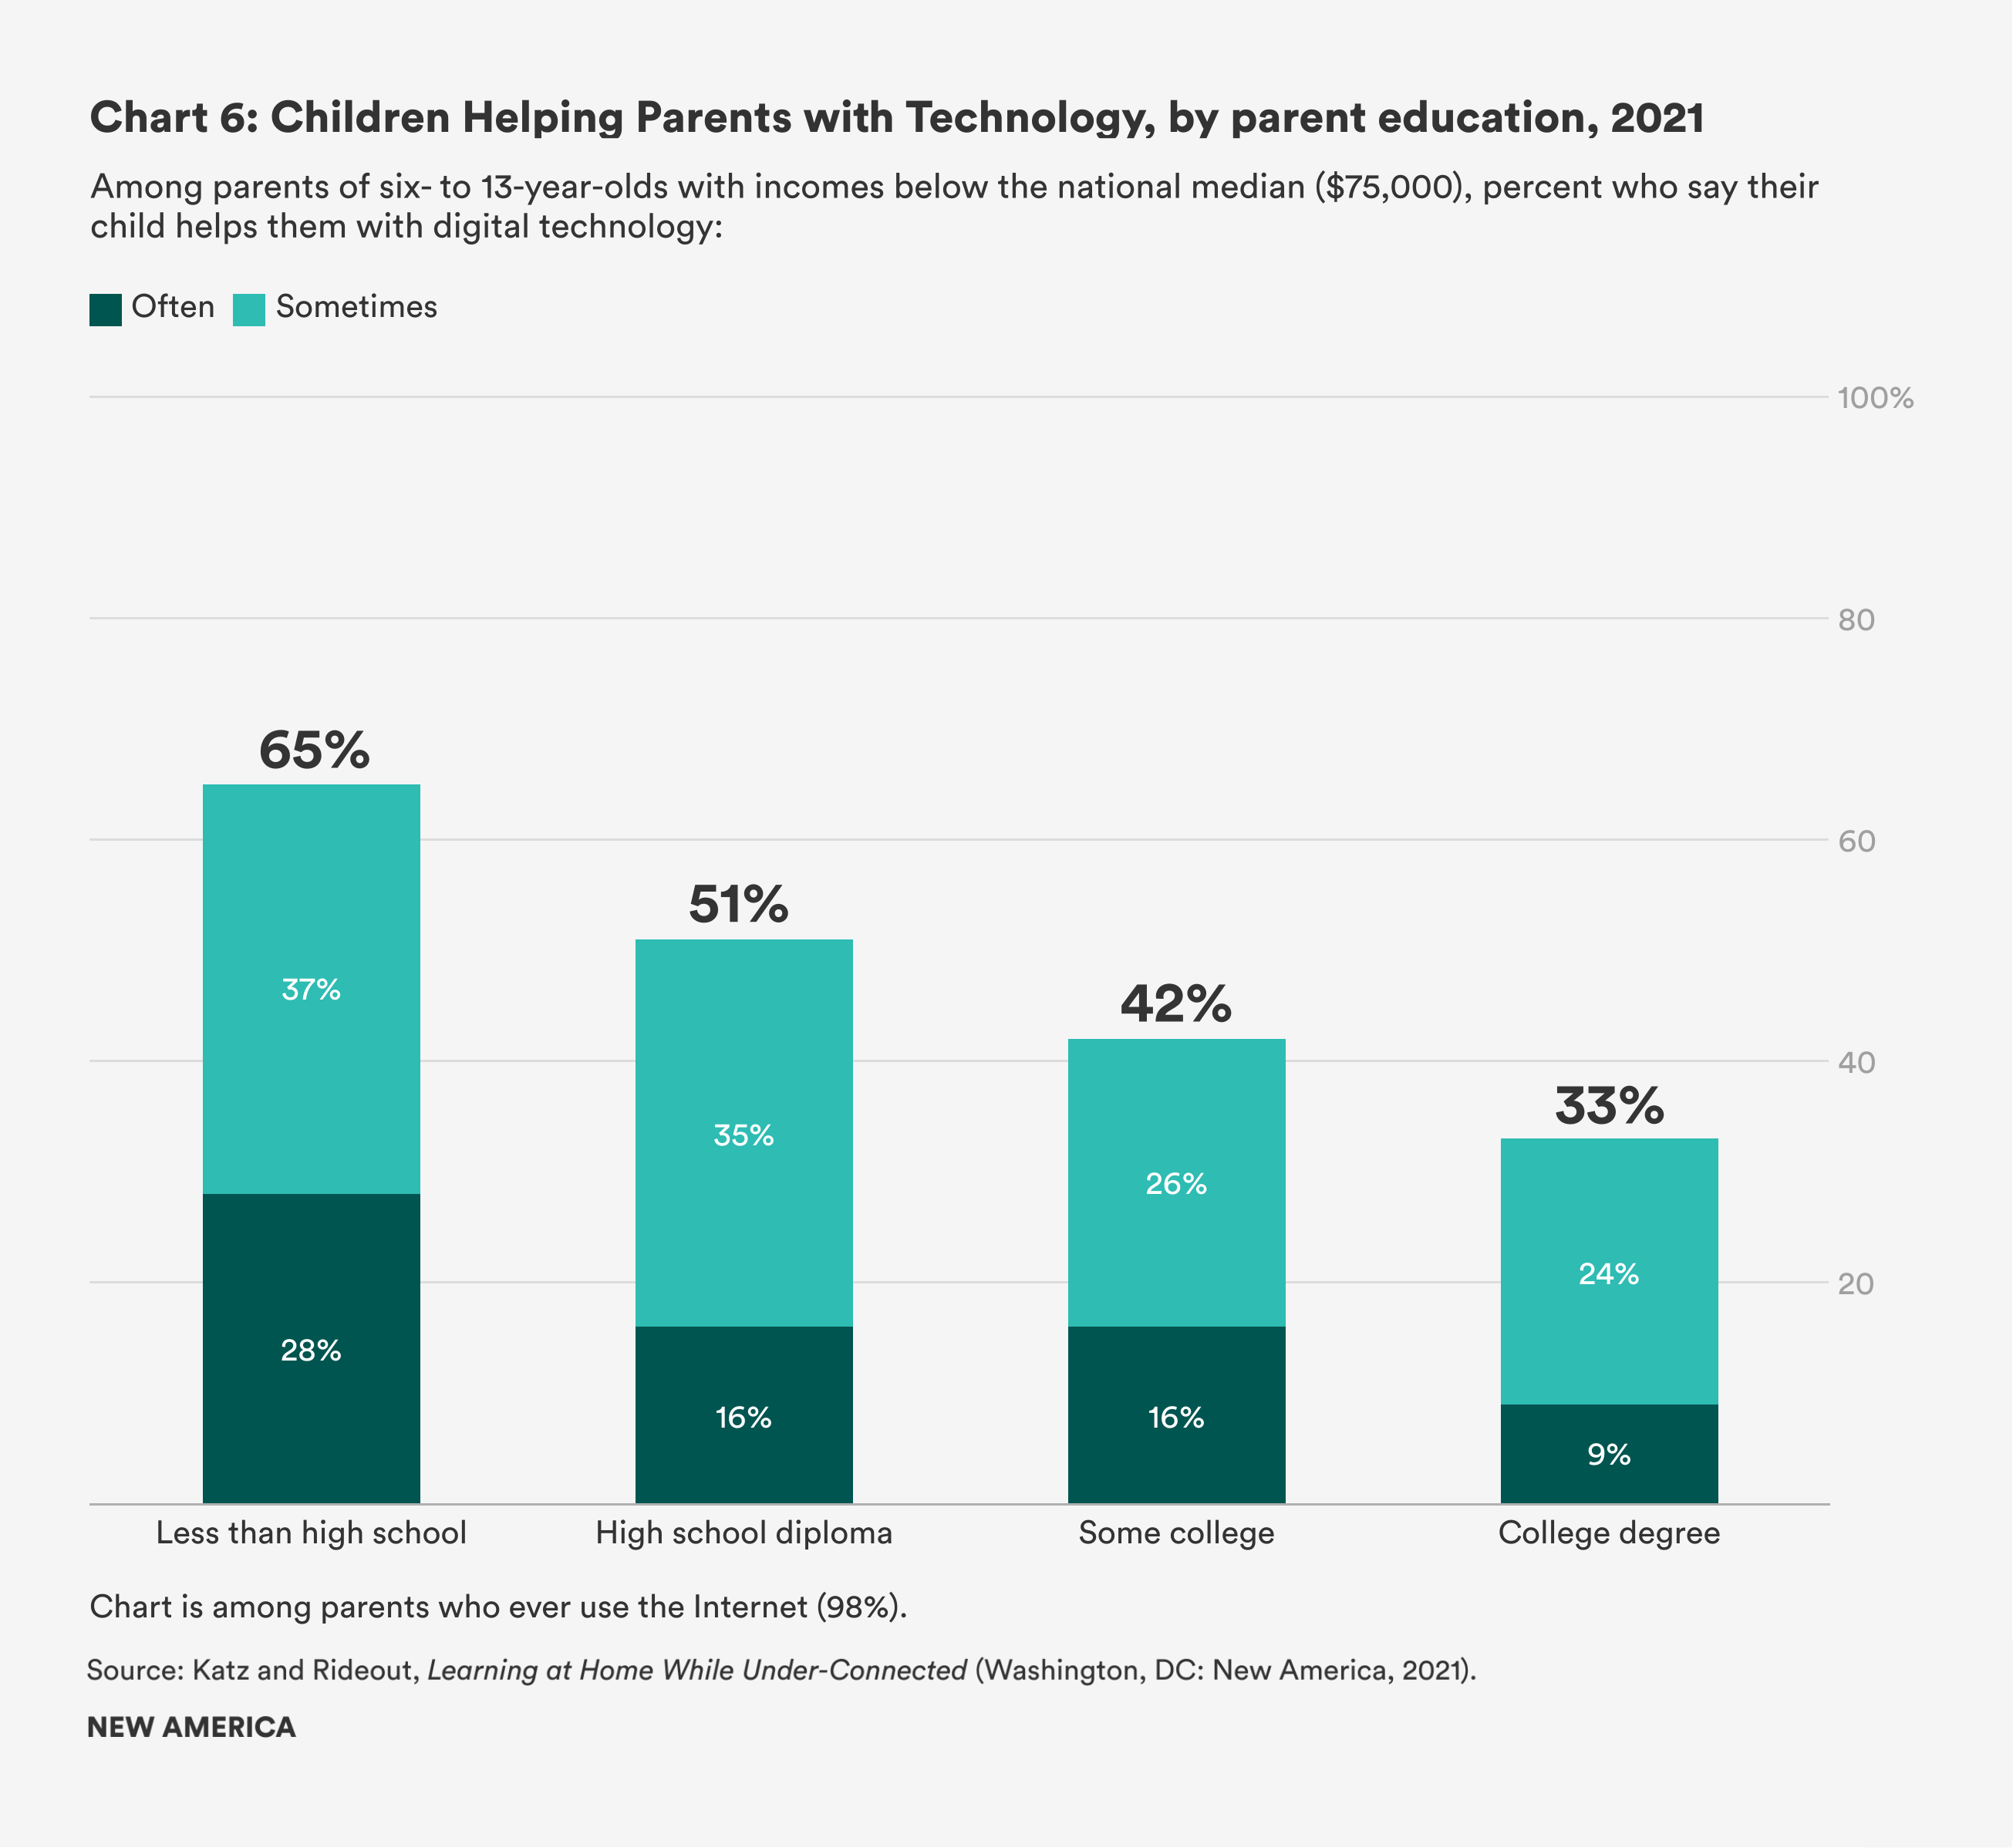
- Less-educated parents and those with the lowest incomes rely on their children for technology help more than other parents do. For example, 65 percent of parents without a high school diploma say their children often or sometimes help them, compared with 33 percent of parents with a college degree. Similarly, parents with incomes below the federal poverty level are more likely to say their 10- to 13-year-olds help them with specific tech-related tasks than parents with incomes above the poverty level, such as learning how digital devices work (51 percent vs. 38 percent), finding information online (49 percent vs. 34 percent), and downloading content (50 percent vs. 34 percent).
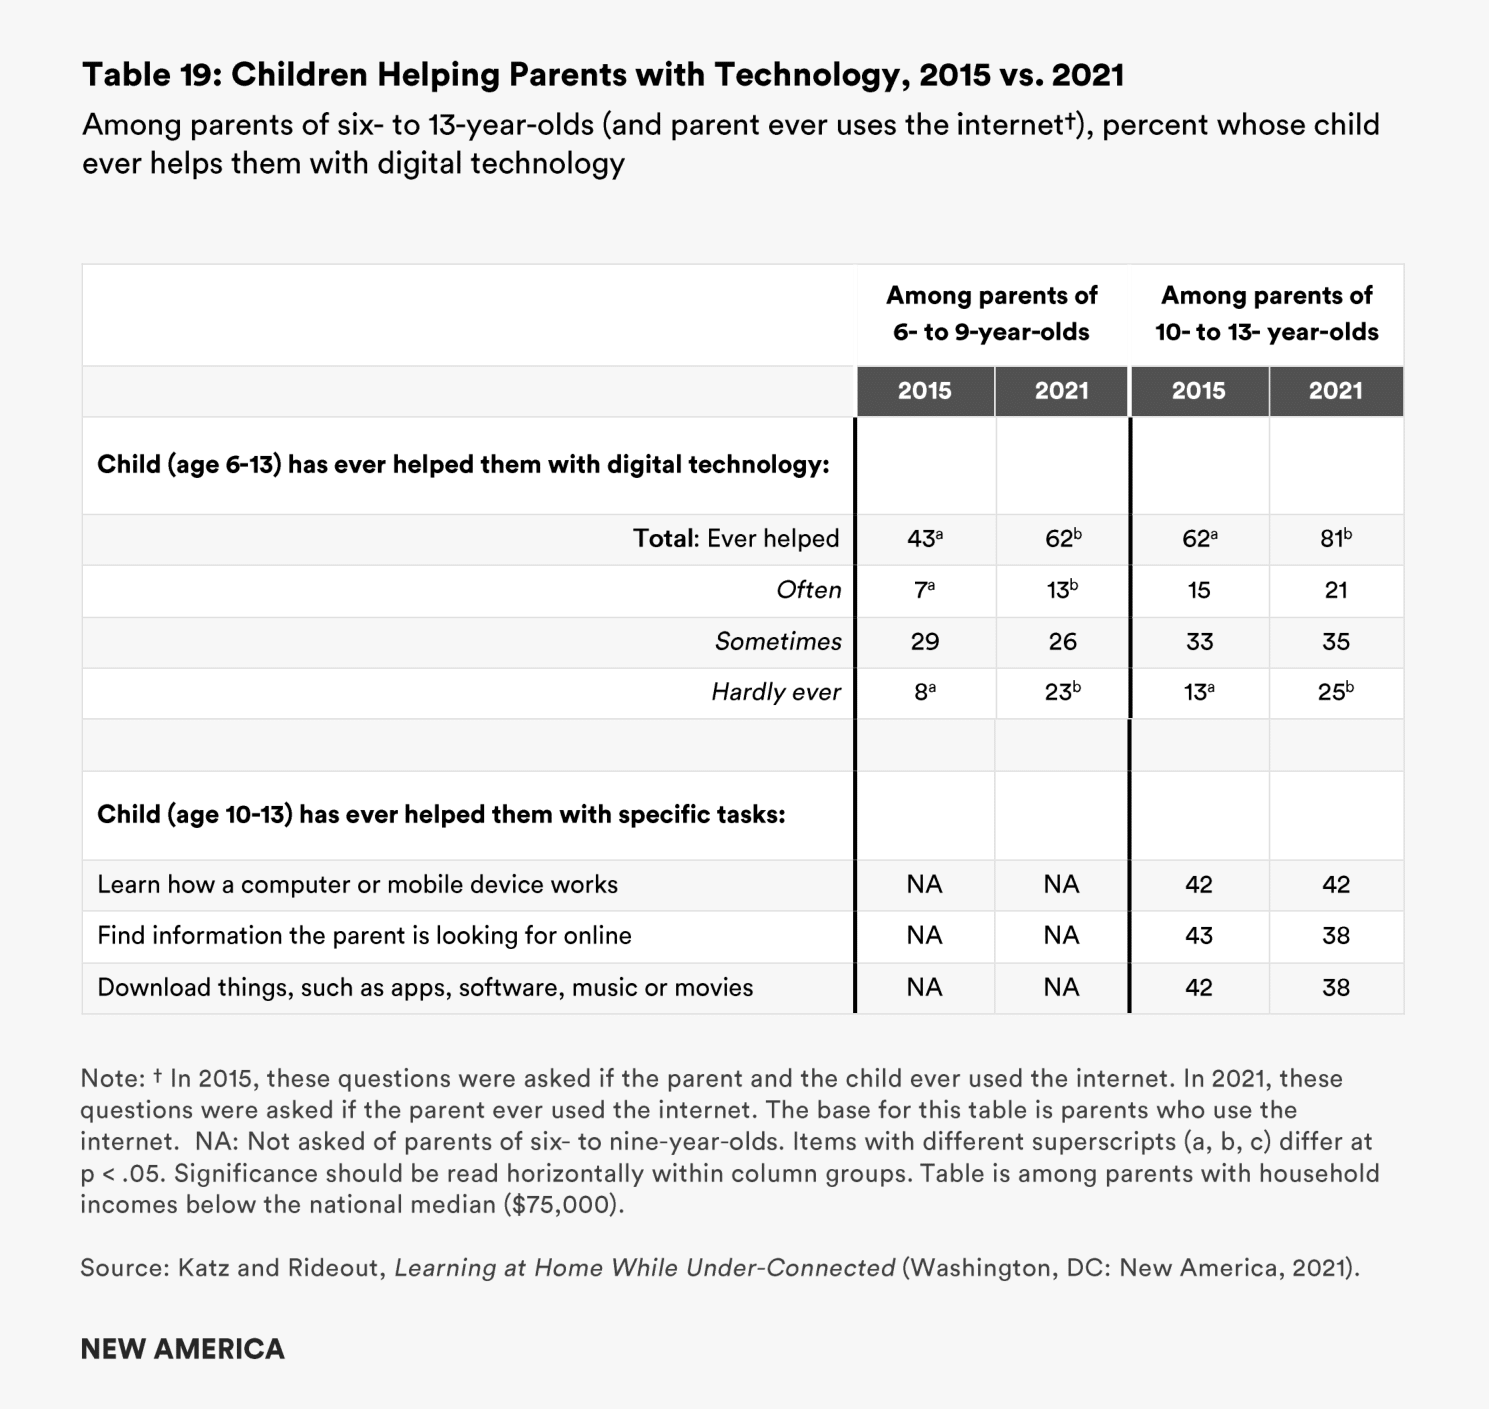
- Mutual tech support has increased since 2015. Parents are more likely to say they ever help their six- to 13-year-olds with computers or the internet today (90 percent) than they were in 2015 (77 percent). They are also more likely to say their children ever help them with technology (81 percent of parents of 10- to 13-year-olds, vs. 62 percent in 2015).
Citations
- In 2015, we surveyed 1,191 lower-income parents with children ages six to 13, using many of the same questions regarding access to the internet and digital devices, enabling us to compare families’ experiences over time. Victoria J. Rideout and Vikki S. Katz, Opportunity for All?: Technology and Learning in Lower-Income Families, Joan Ganz Cooney Center at Sesame Workshop (New York, 2016), source
Devices and Internet Access in the Home
Six years ago, in a report titled Opportunity for All? Technology and Learning in Lower-Income Families, we documented how digital inequality was affecting access to learning opportunities in lower-income families with school-aged children.1 We warned that these obstacles would have “considerable consequences” for children and families in the years to come, as technology use became increasingly integral to learning in and out of school. Once the COVID-19 pandemic arrived on U.S. shores and closed school buildings across the country, the reality of those consequences hit hard and fast.
Many schools, internet service providers, nonprofits, and families themselves tried to patch gaps in access to both digital devices and the internet. In this report, we document the state of families’ digital access one year into the pandemic (in March and April of 2021), when online schooling remained the norm in most places. Our data include the types of digital devices that families have in their homes (and especially, whether or not there is a computer available), and the types of internet connections they have (i.e., whether families have some type of broadband home access, dial-up service, mobile-only access, or no personal internet access). We then explore the extent to which families are “under-connected”—that is, whether the devices and internet service they have are sufficient and reliable enough to meet their needs. And finally, we compare where families were six years ago in relation to these issues with where they are today.
Internet Access in 2021
The type of internet access that children have at home has always mattered, but it has never mattered more than it did this past year. Remote learning required being able to livestream classes on Zoom, watch videos to complete assignments, and submit work online. Anything less than a strong broadband connection simply could not enable children’s full participation.
Among all families with three- to 13-year-old children whose household incomes are below the national median:
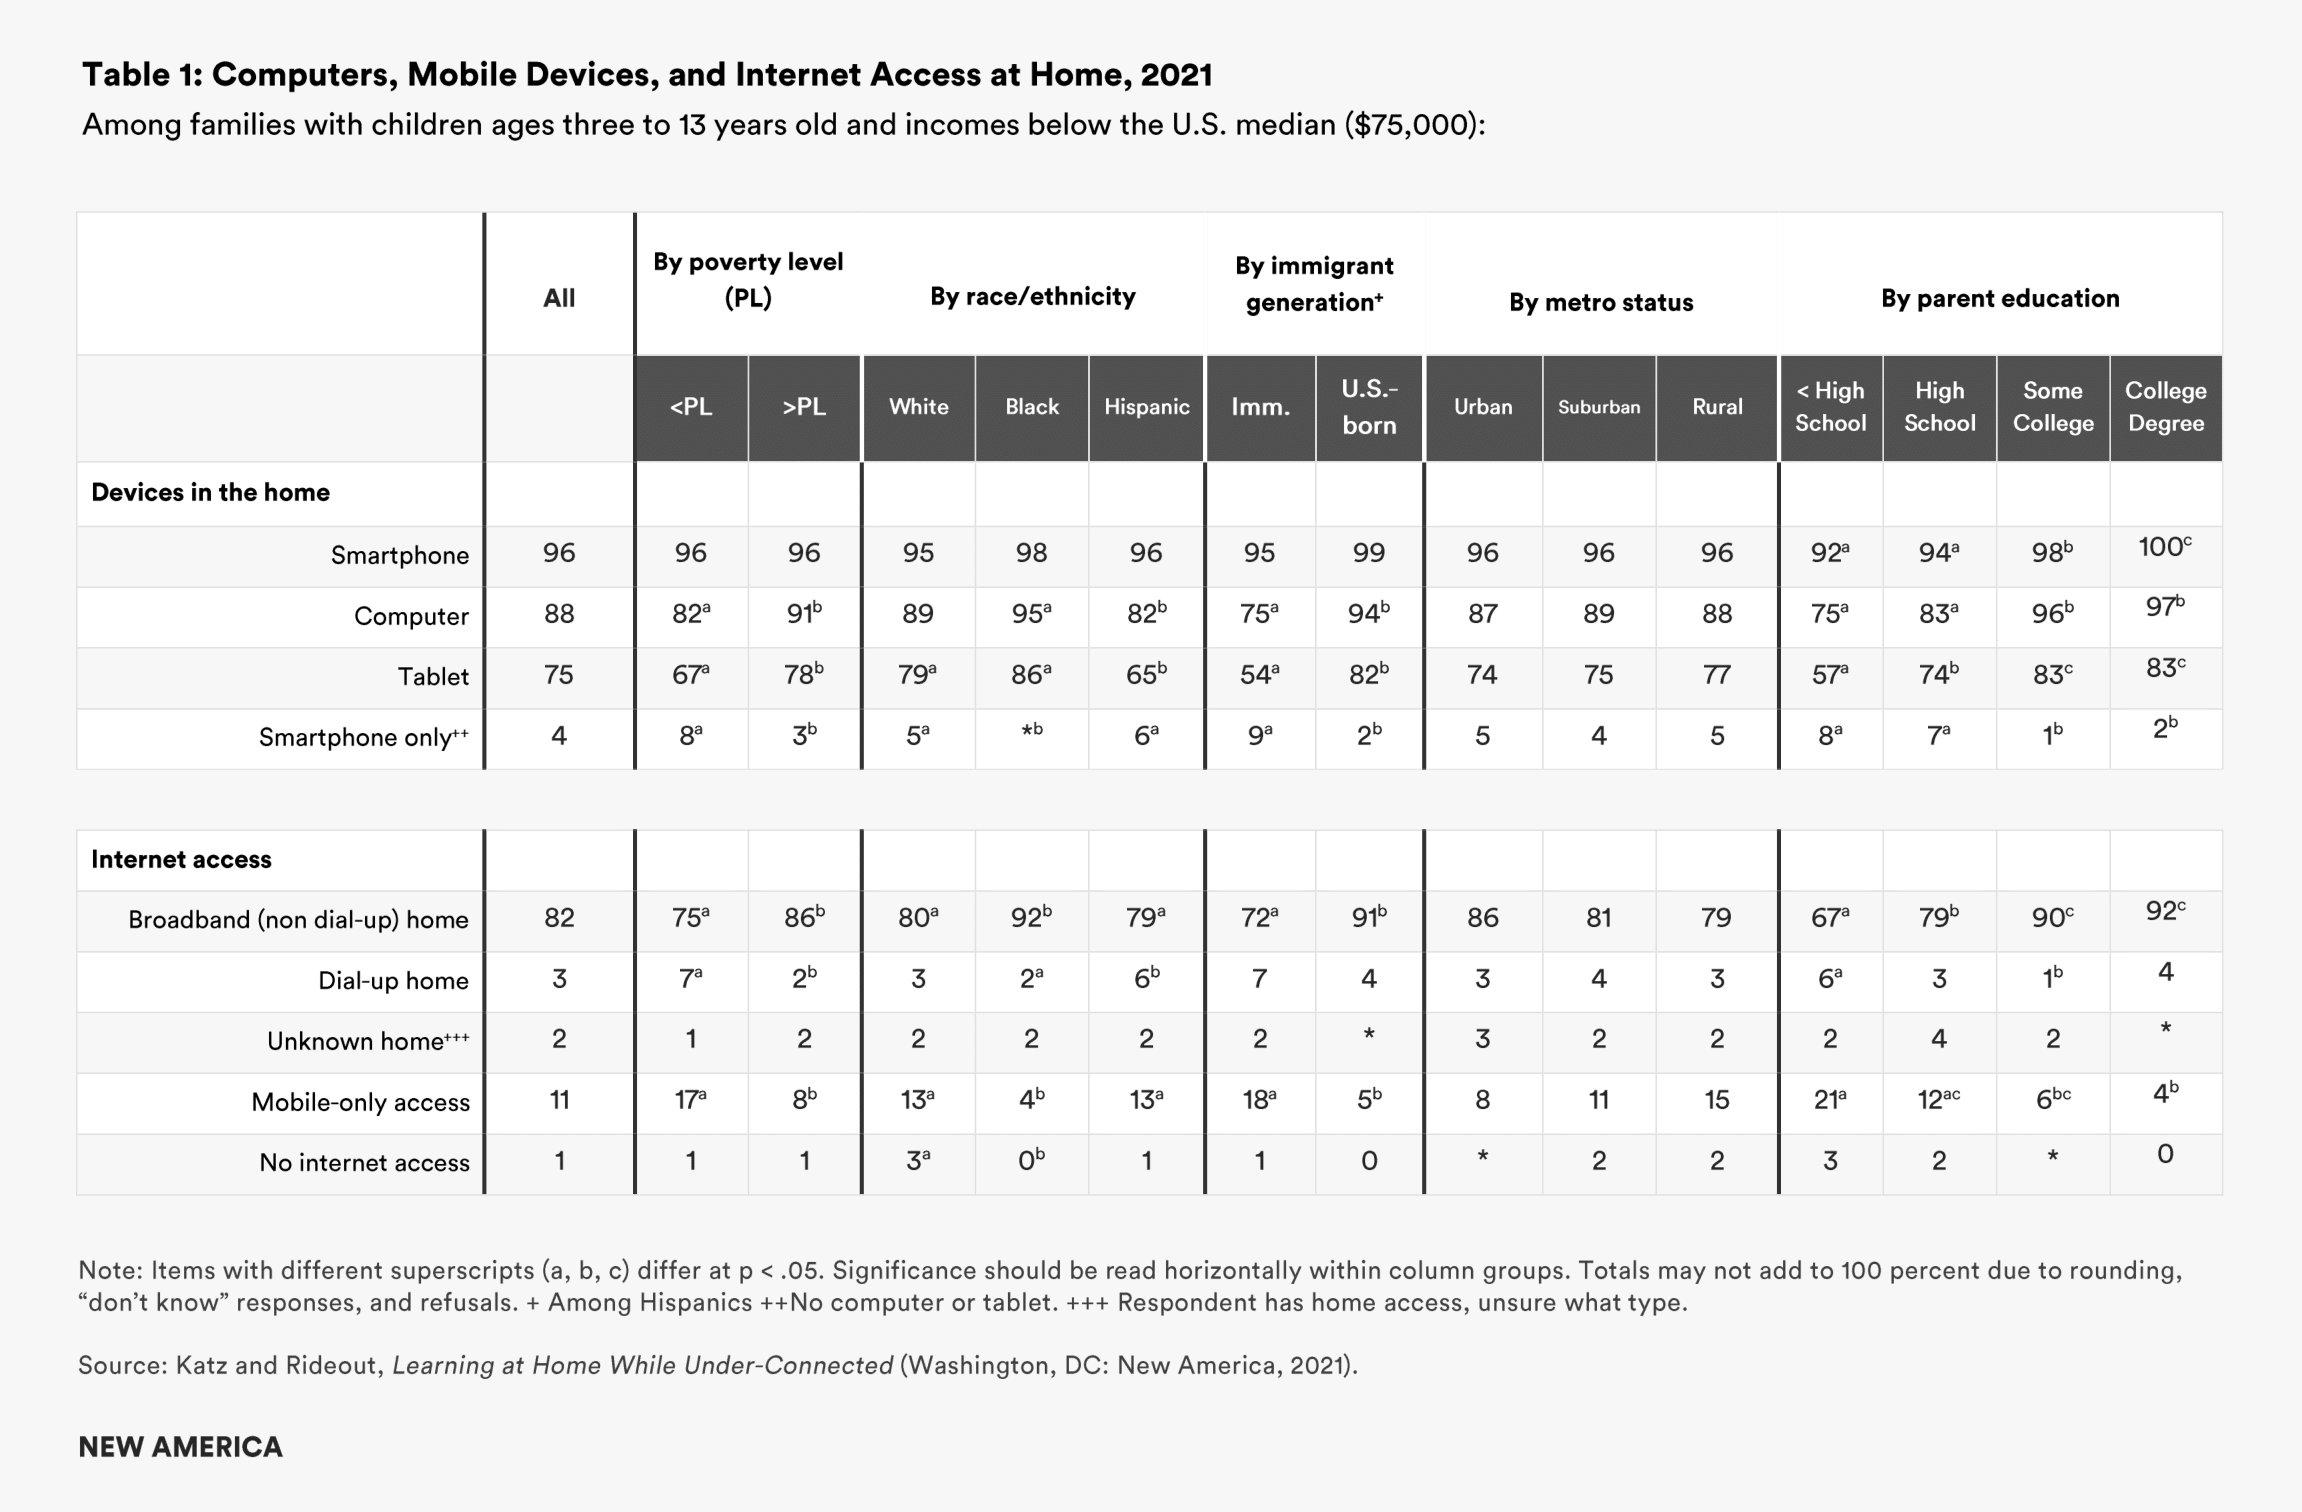
- 82 percent have some kind of broadband internet access (e.g., cable, satellite, fiber optic, or a hot spot)
- 11 percent have mobile-only access (i.e., internet access via a data plan on a smartphone or tablet)
- 3 percent have dial-up access
- 2 percent have home access, but are not sure what kind
- 1 percent have no internet access at all
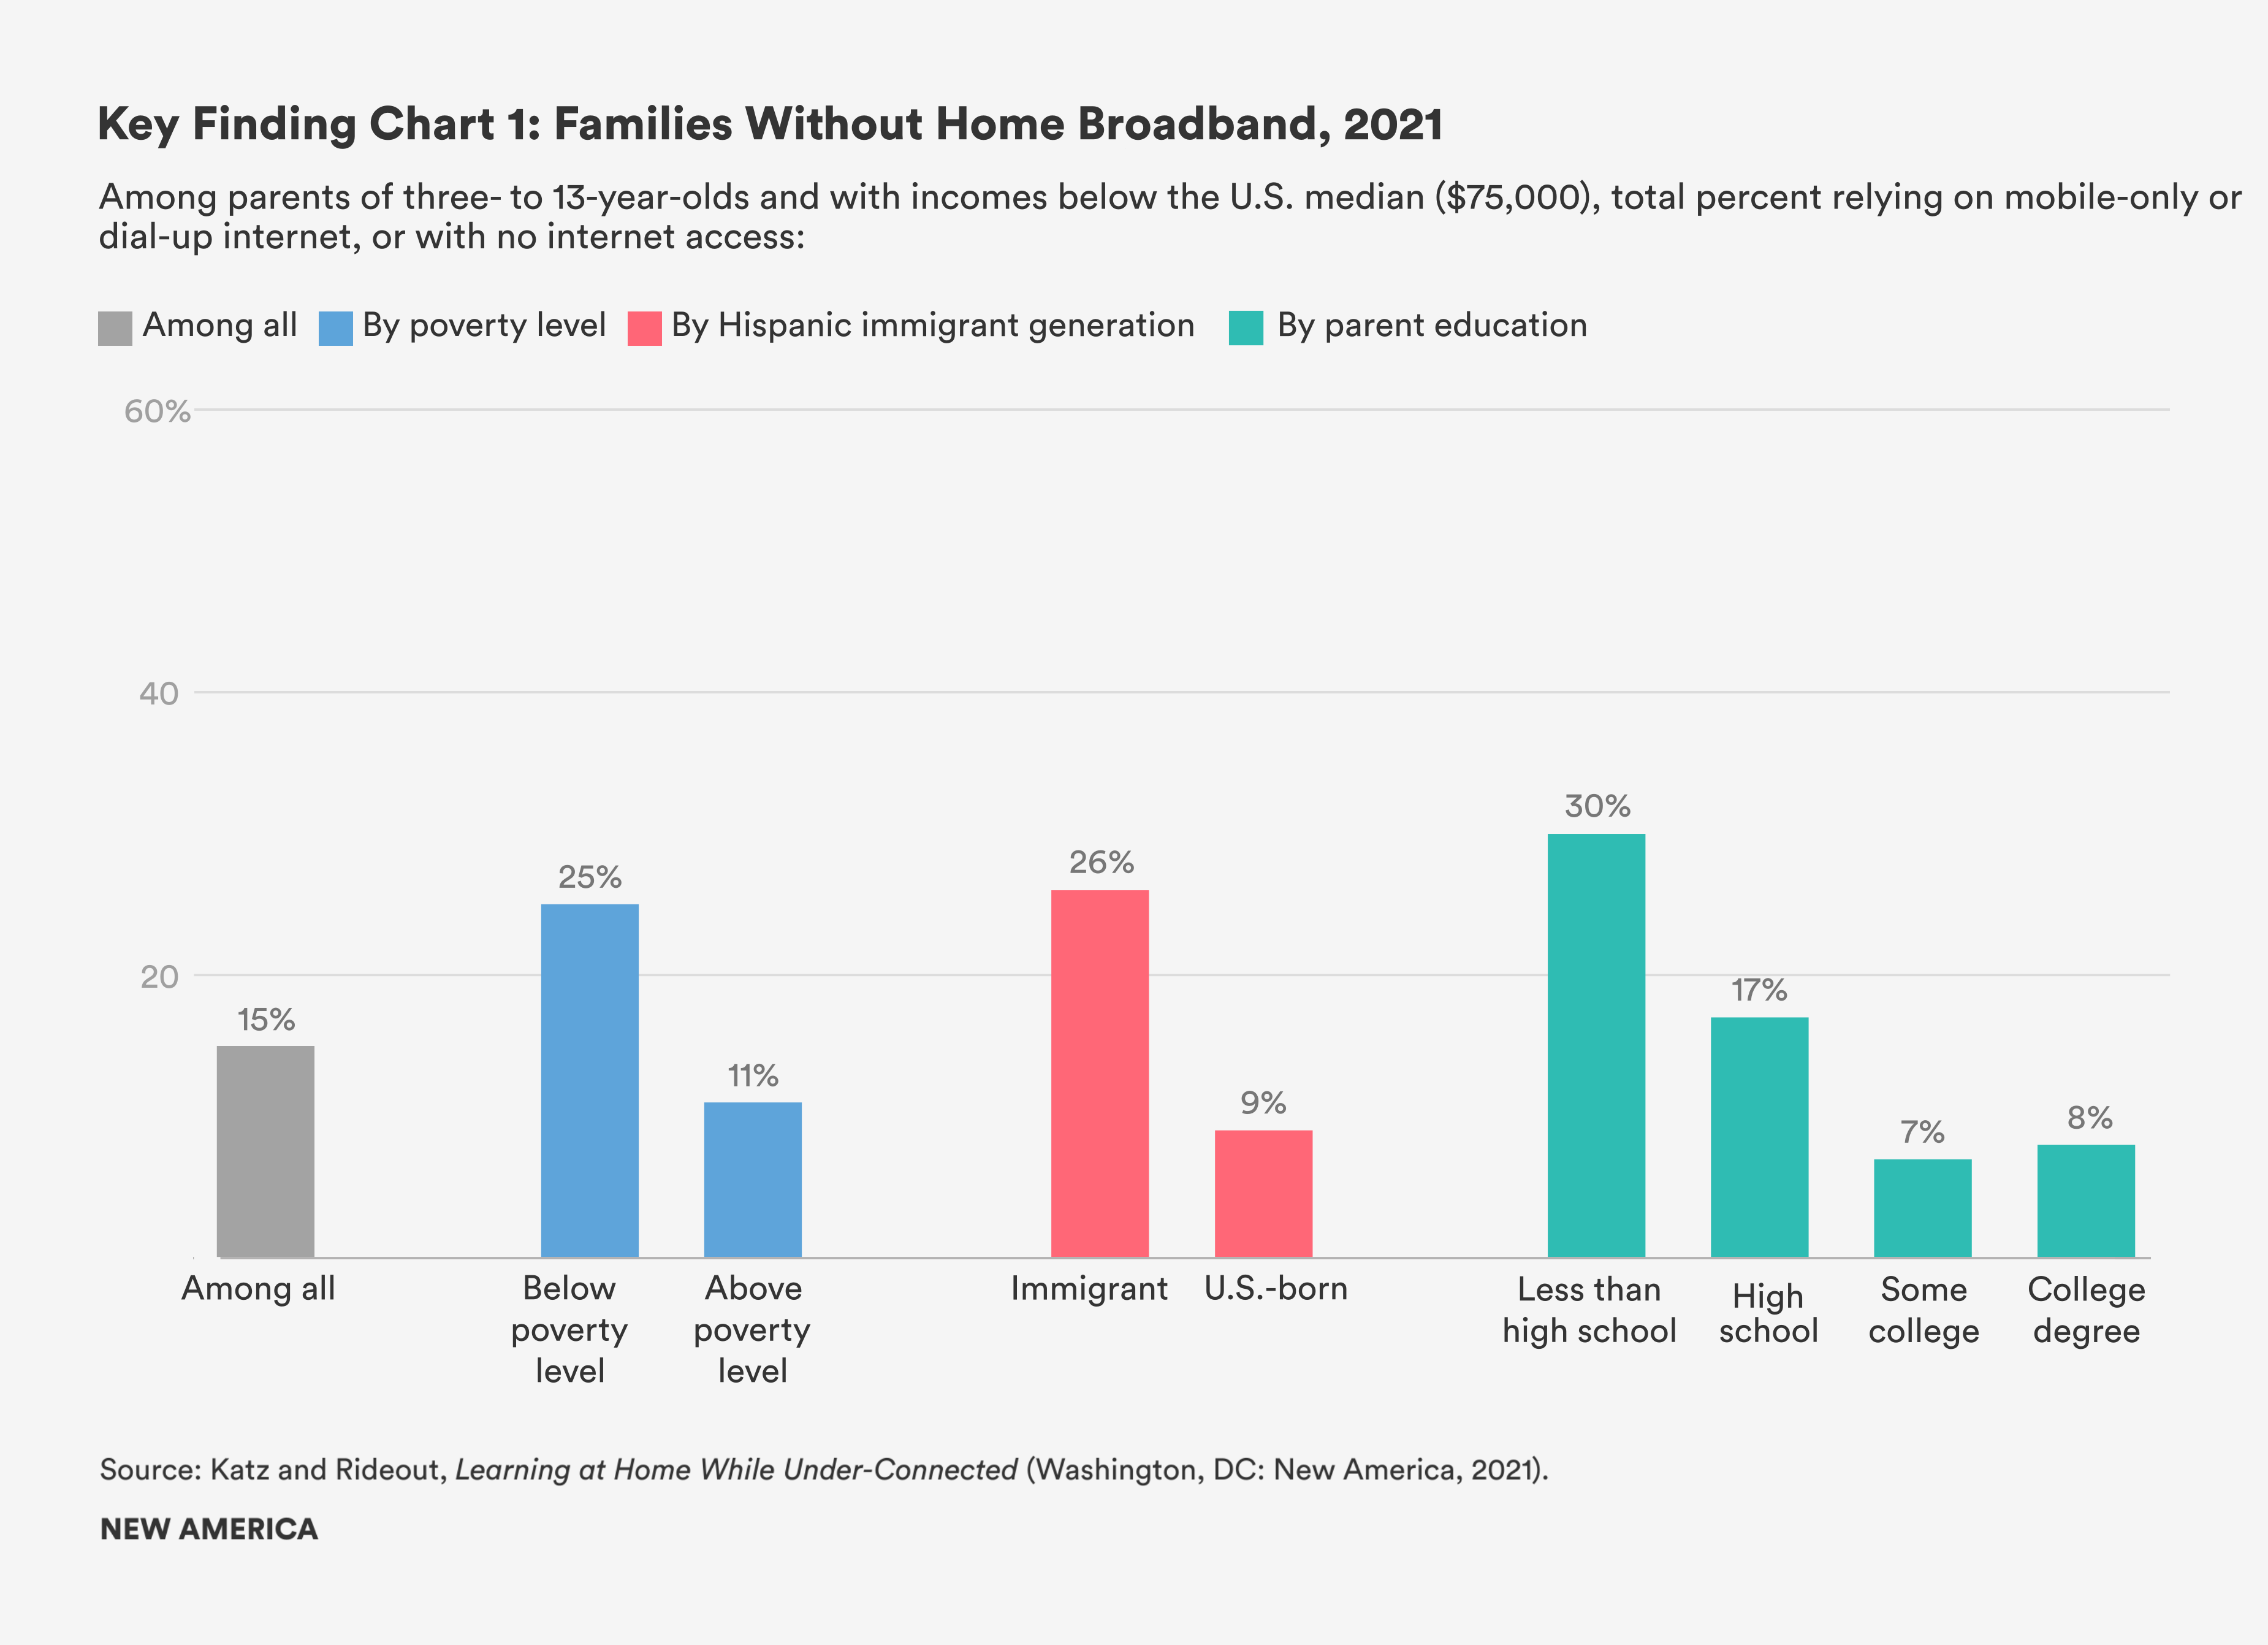
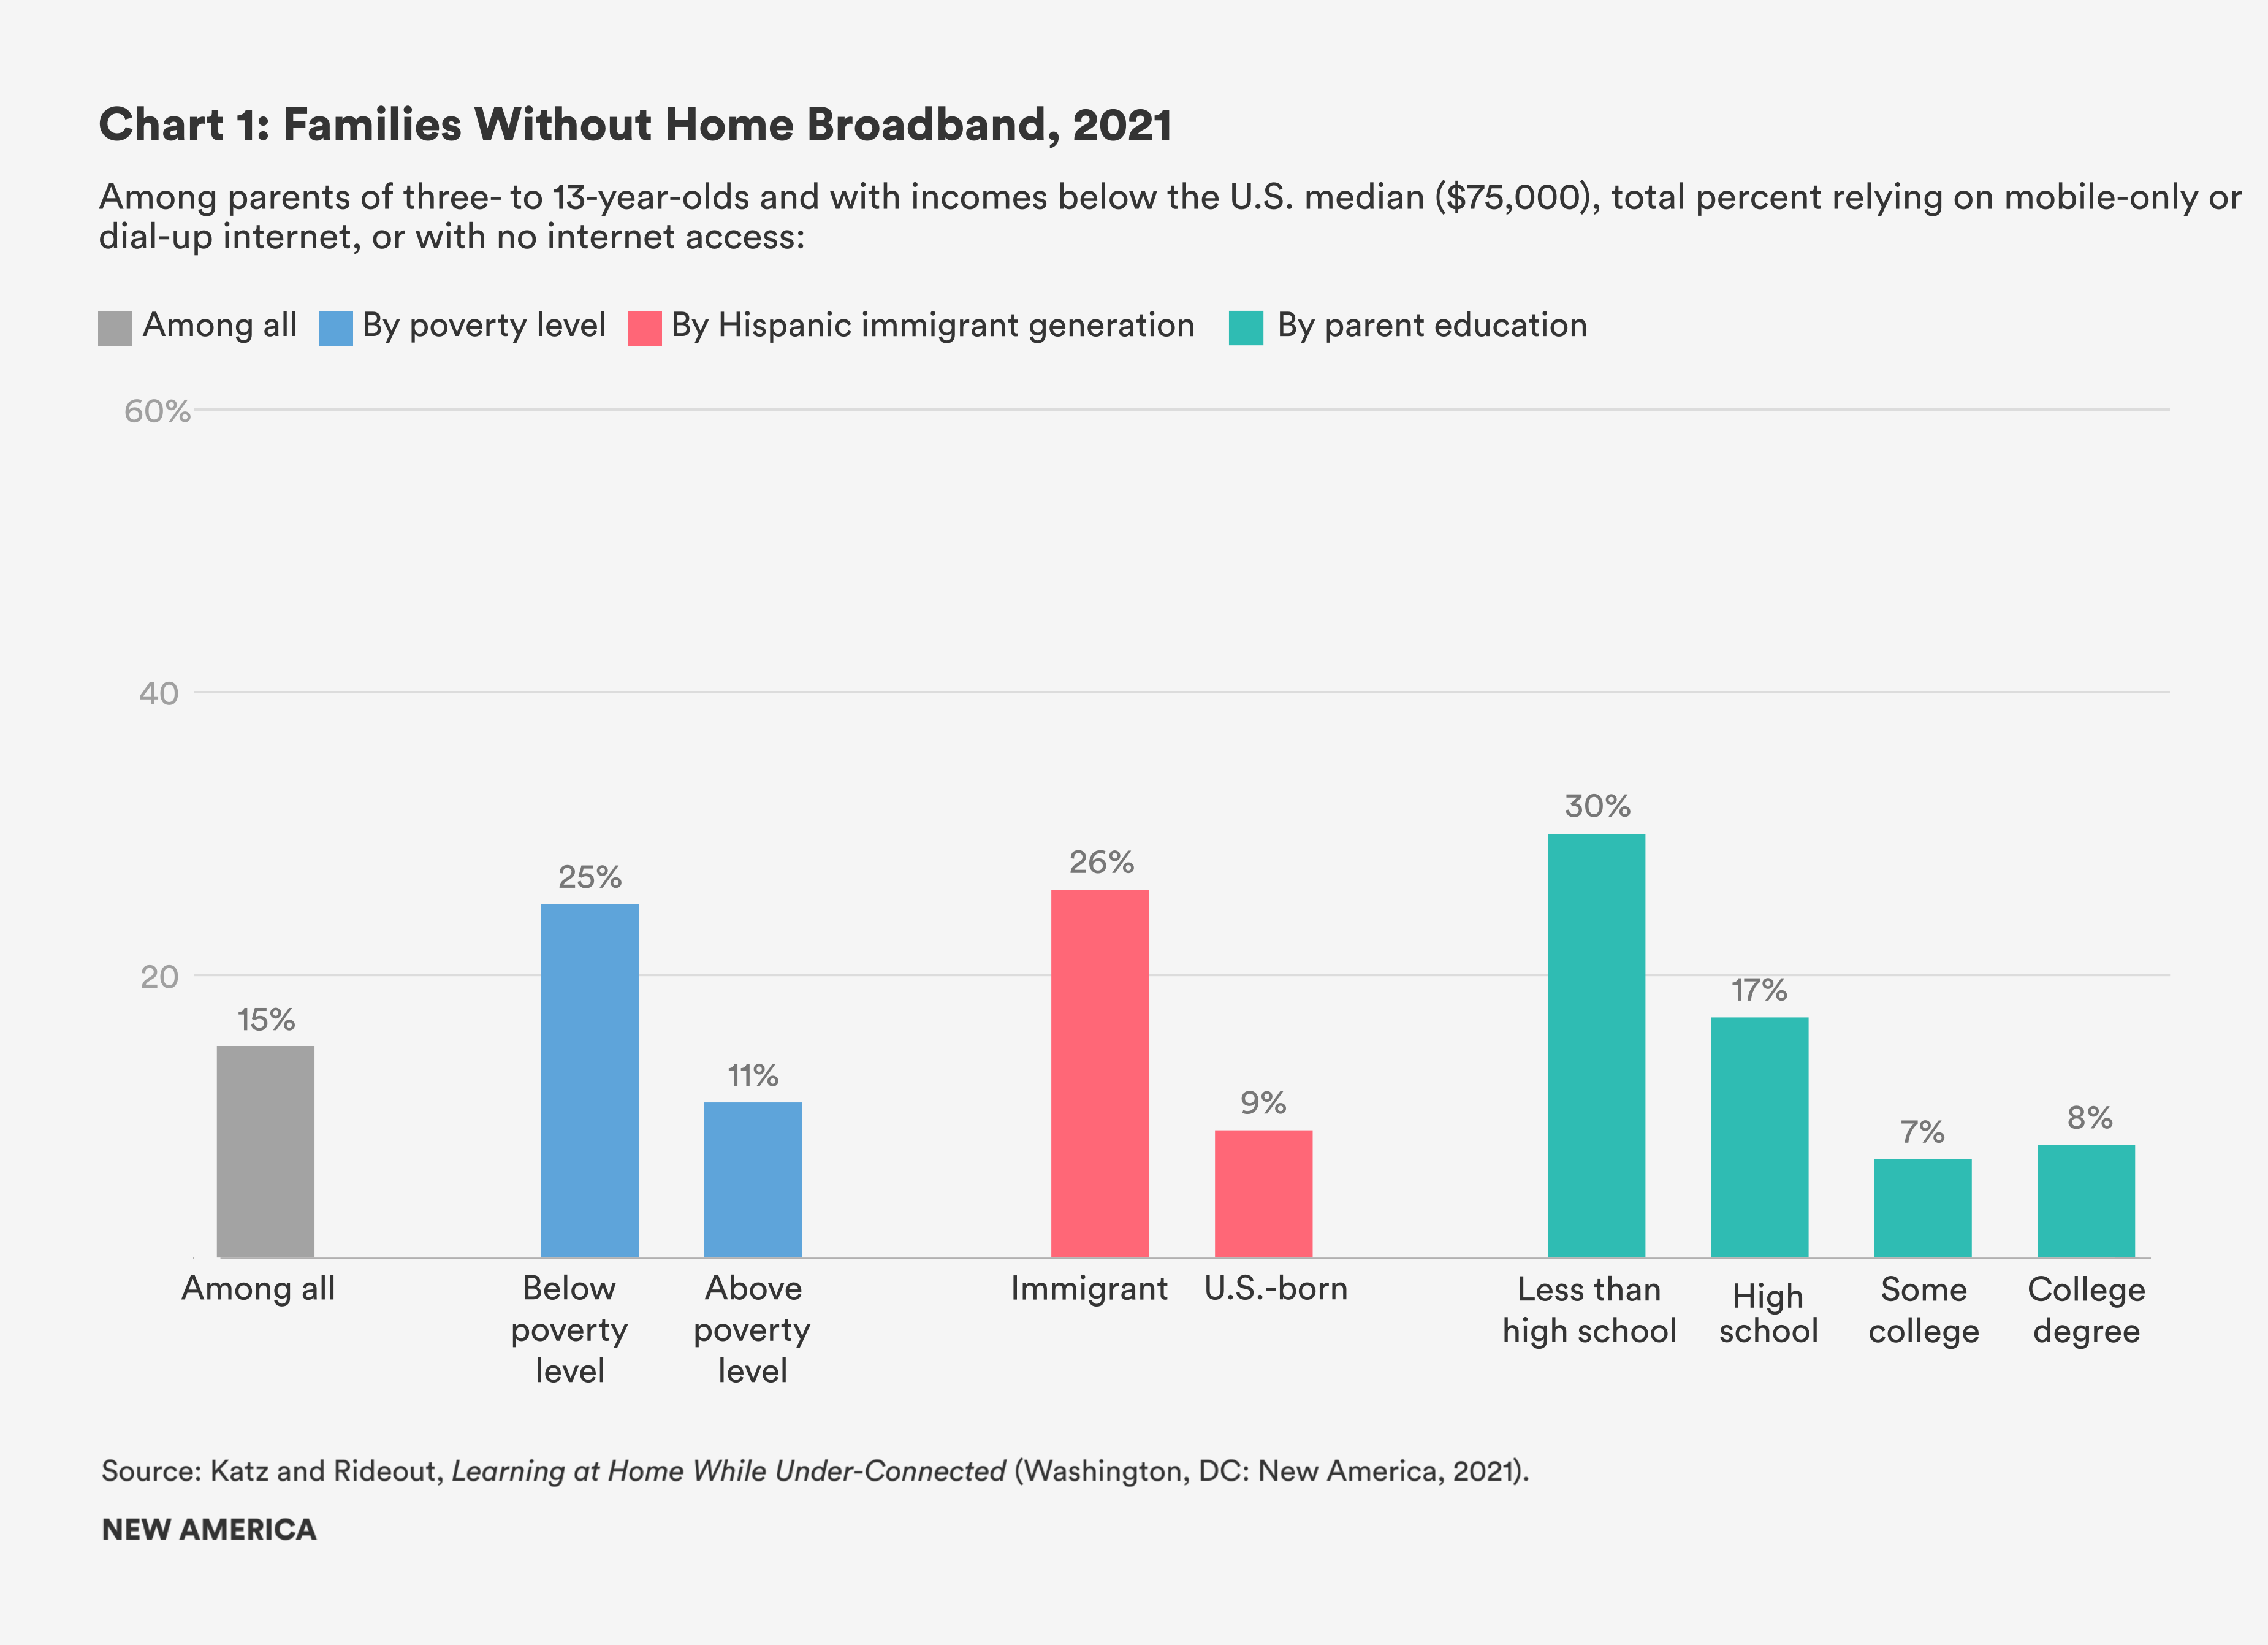
These rates of home broadband access are a vast improvement from what we found in our 2015 survey (see discussion below). However, they still leave 15 percent of children—roughly one in seven—with mobile-only, dial-up, or no internet access. The discrepancies for families living below the federal poverty line are starker still: a total of one in four have mobile-only (17 percent), dial-up (7 percent), or no internet service at all (1 percent; see Chart 1 and Table 1).
We also find differences by race/ethnicity and immigrant generation. Black families are more likely than White and Hispanic families to have broadband home internet service (92 percent of Black families, vs. 80 percent of White and 79 percent of Hispanic families). Families headed by U.S.-born Hispanics are much more likely to have home broadband access than families headed by immigrant Hispanics (91 percent vs. 72 percent).
Rates of home internet access vary substantially by parents’ levels of education as well: 30 percent of children whose parents did not have a high school diploma rely on mobile-only (21 percent) or dial-up (6 percent) internet access, or have no internet access at all (3 percent). By contrast, 8 percent of children of college graduates have mobile-only (4 percent) or dial-up (4 percent). Our survey found that no children of college graduates lacks internet access.
There were no statistically significant differences in type of home internet access based on whether the respondent lived in an urban, rural, or suburban area, indicating that the differences in broadband access identified in this survey are not based on geographic factors. Indeed, among those without home internet access, 35 percent cite cost as the major factor, compared to 12 percent who say their community does not have good service available (see Chart 2).
FAMILIES WITHOUT HOME BROADBAND, 2021
Among parents of three- to 13-year-olds with incomes below the U.S. median, total percent relying on mobile-only or dial-up, or with no internet access:

Device Access in 2021
Nearly nine in 10 (88 percent) lower-income families have a computer in the home, and 75 percent have a tablet device. Since younger children could fully participate in remote learning on a tablet more readily than elementary school-aged children, we also examined rates of device ownership by child age. Rates of home computer access indeed vary by age, from 80 percent of families with three- to five-year-olds, to 93 percent of those with 10- to 13-year-olds. Parents with six- to nine-year-olds fall in-between these two groups, suggesting that computer ownership increases gradually as children progress through elementary school (89 percent have a computer at home, not statistically different from either of the other age groups).
Computer access is lowest among families headed by Hispanic immigrants (75 percent), who did not graduate from high school (75 percent), and households with incomes below the poverty level (82 percent). Only a small number of families have to rely exclusively on a smartphone: overall, 4 percent of families had a smartphone but no tablet or computer, ranging up to 8 percent of those living below the poverty line and 9 percent in families headed by immigrant Hispanics (see Table 1).
The “Under-connected” in 2021
While it is important to identify which families do or do not have broadband internet access and a computer, yes/no questions about access cannot provide the full story. Informed by our interviews with hundreds of lower-income families with elementary school-aged children since 2013, we developed a more nuanced set of questions to identify which families have insufficient and inconsistent access to digital devices, internet service, or both.2 For many families, paying for the internet competes with other, more pressing bills some months. Their devices break or work slowly but are too expensive to replace. Families make do by sharing fewer devices than they need for everyone to have as much time online as they would like. These families are “under-connected” by virtue of indicating that their connectivity is more limited than they need it to be.
To fully diagnose who is under-connected, questions must also be asked in a way that captures fluctuations in connectivity over time. This is because parents might report that their internet connection and devices are working well on the day they answer the question, but that may not have been the case last week, or last month.
Our findings clearly demonstrate why addressing digital inequality will require addressing the challenges of being under-connected. Even among lower-income families who report having computers, tablets, and home broadband internet access, a majority are nonetheless still under-connected.
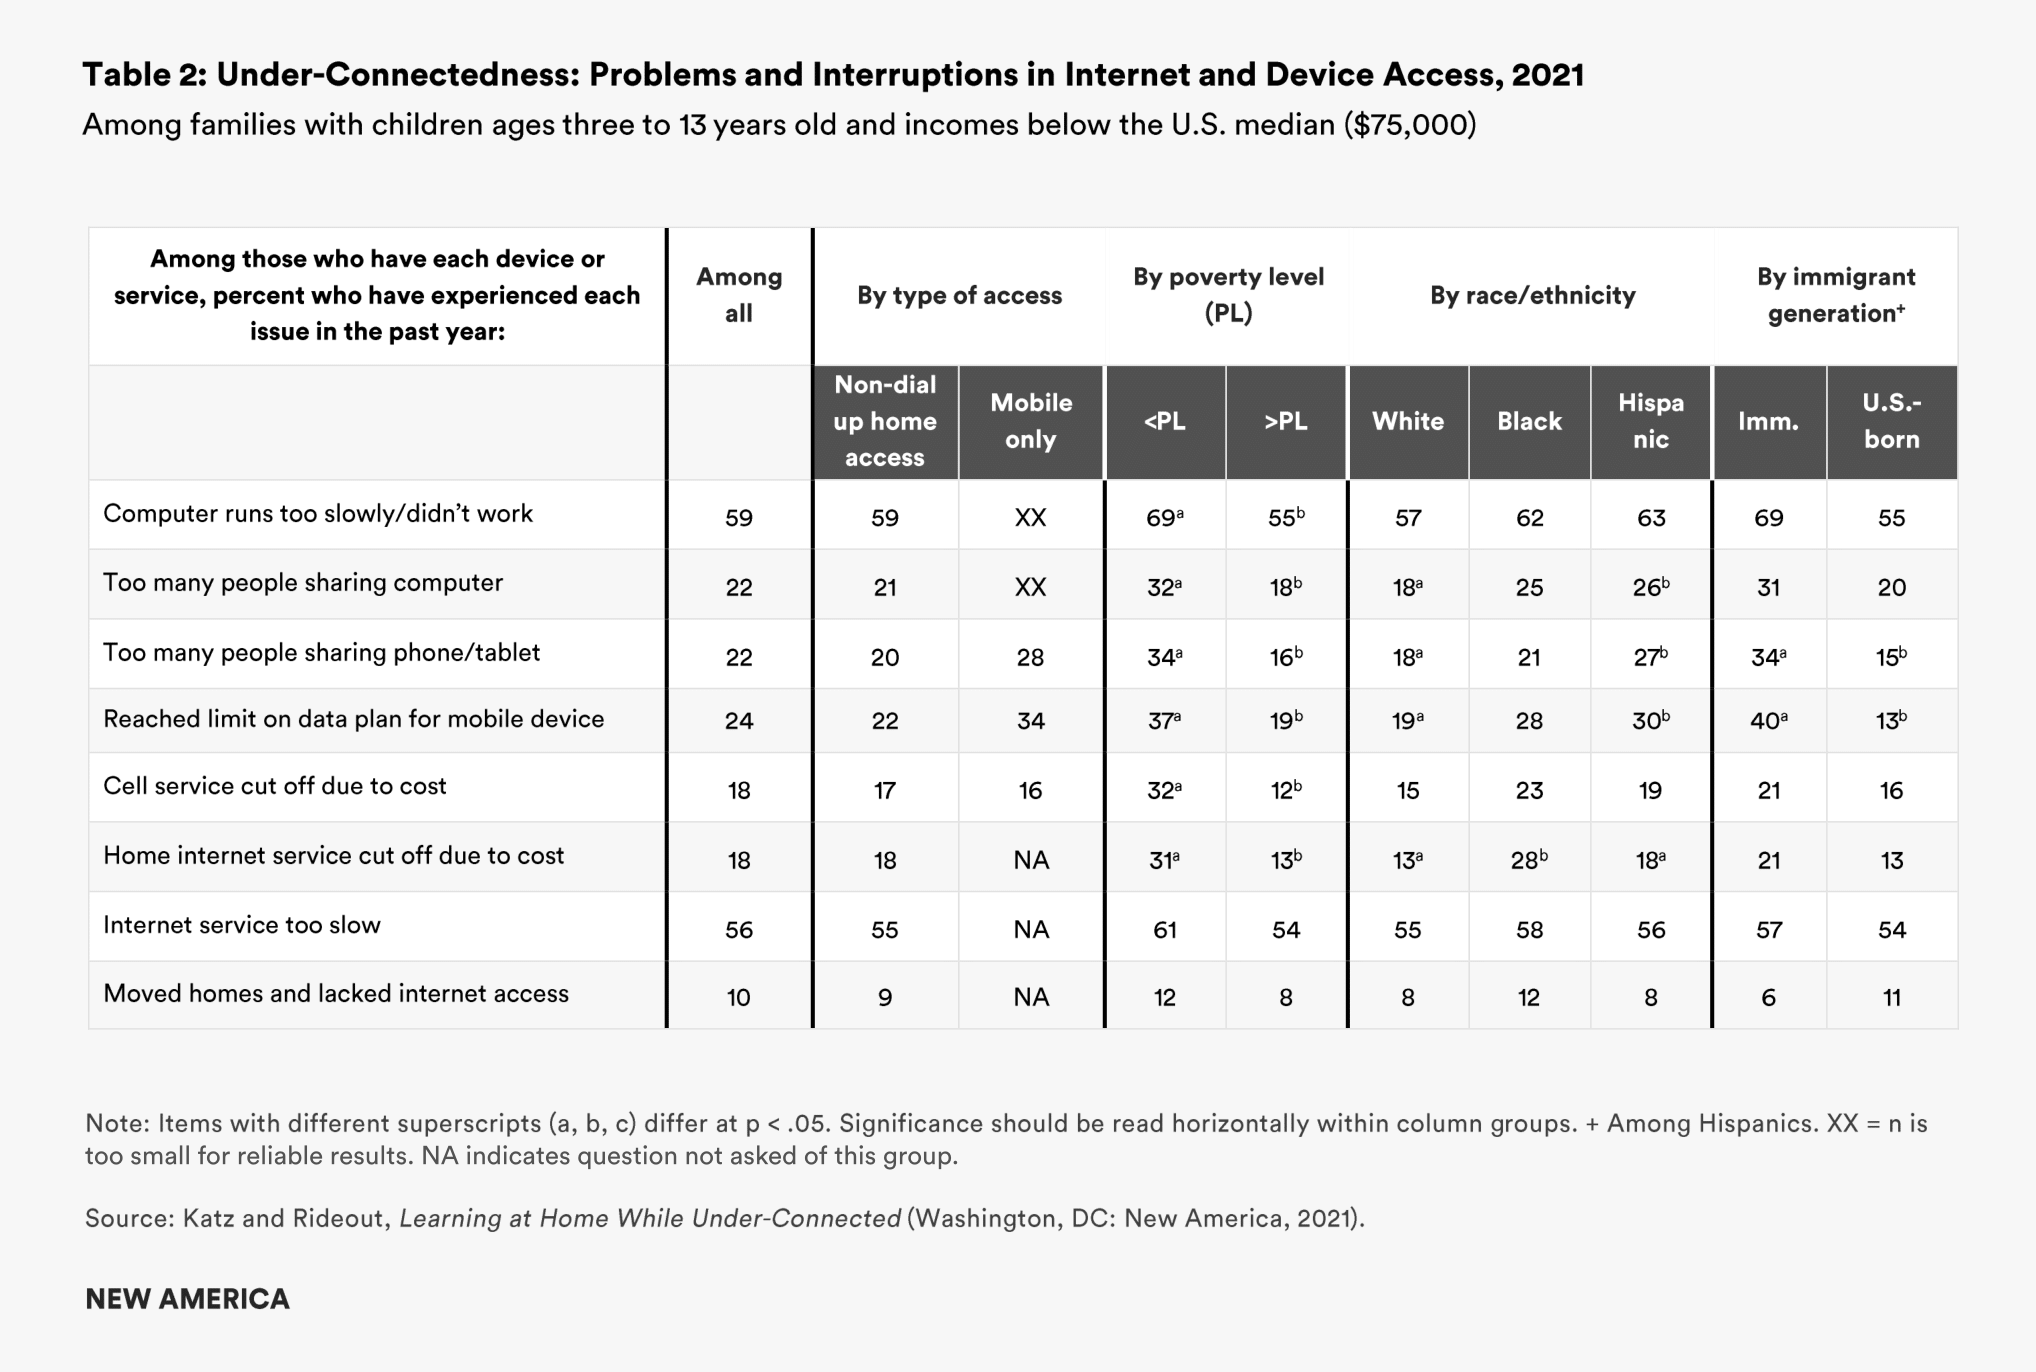
For example, among the 82 percent of families who report having broadband internet service, more than half (55 percent) said their internet service had been too slow in the past 12 months, and almost one-fifth (18 percent) reported interruptions in their internet service at least once in the past year due to unpaid bills (see Table 2).
Roughly one in ten (11 percent) families has mobile-only internet access, meaning that they report only having internet access at home via a data plan on their smartphone or tablet. Mobile-only access is a form of under-connectedness in its own right, given how challenging it is to do complex tasks like a homework assignment on a smartphone, as compared to doing so on a computer.
Similar patterns emerge regarding devices. More than half (59 percent) of parents reported that their computers did not work properly or ran too slowly. These challenges were more common among families headed by immigrant Hispanics and among those living below the federal poverty line (69 percent in both cases).
And about one in five (22 percent) of all families with a computer said there were too many people who needed to use it for them to have as much time on it as they needed. The same proportion (22 percent) of families with a mobile device reported the same problems, with too many people needing to use the smartphone or tablet. The challenges families faced in having to share devices were almost certainly more acute than in other years, with both school and work being remote for so many families during the pandemic.
Families headed by immigrant Hispanics were more likely to report being under-connected than other lower-income families. Forty percent of immigrant Hispanic respondents with a mobile device said they had reached the data limits on their mobile plans and could not go online at least once in the past year, compared with 13 percent of families headed by U.S.-born Hispanics. Additionally, 34 percent of Hispanic families with immigrant parentage said there were too many people trying to share a single device, compared with 15 percent of families with U.S.-born Hispanic parents.
Not surprisingly, families living below the poverty level had a particularly hard time keeping up with the costs of internet service and mobile data plans. They were also more likely to report that they did not have enough devices to meet their families’ needs, or that their devices ran too slowly.
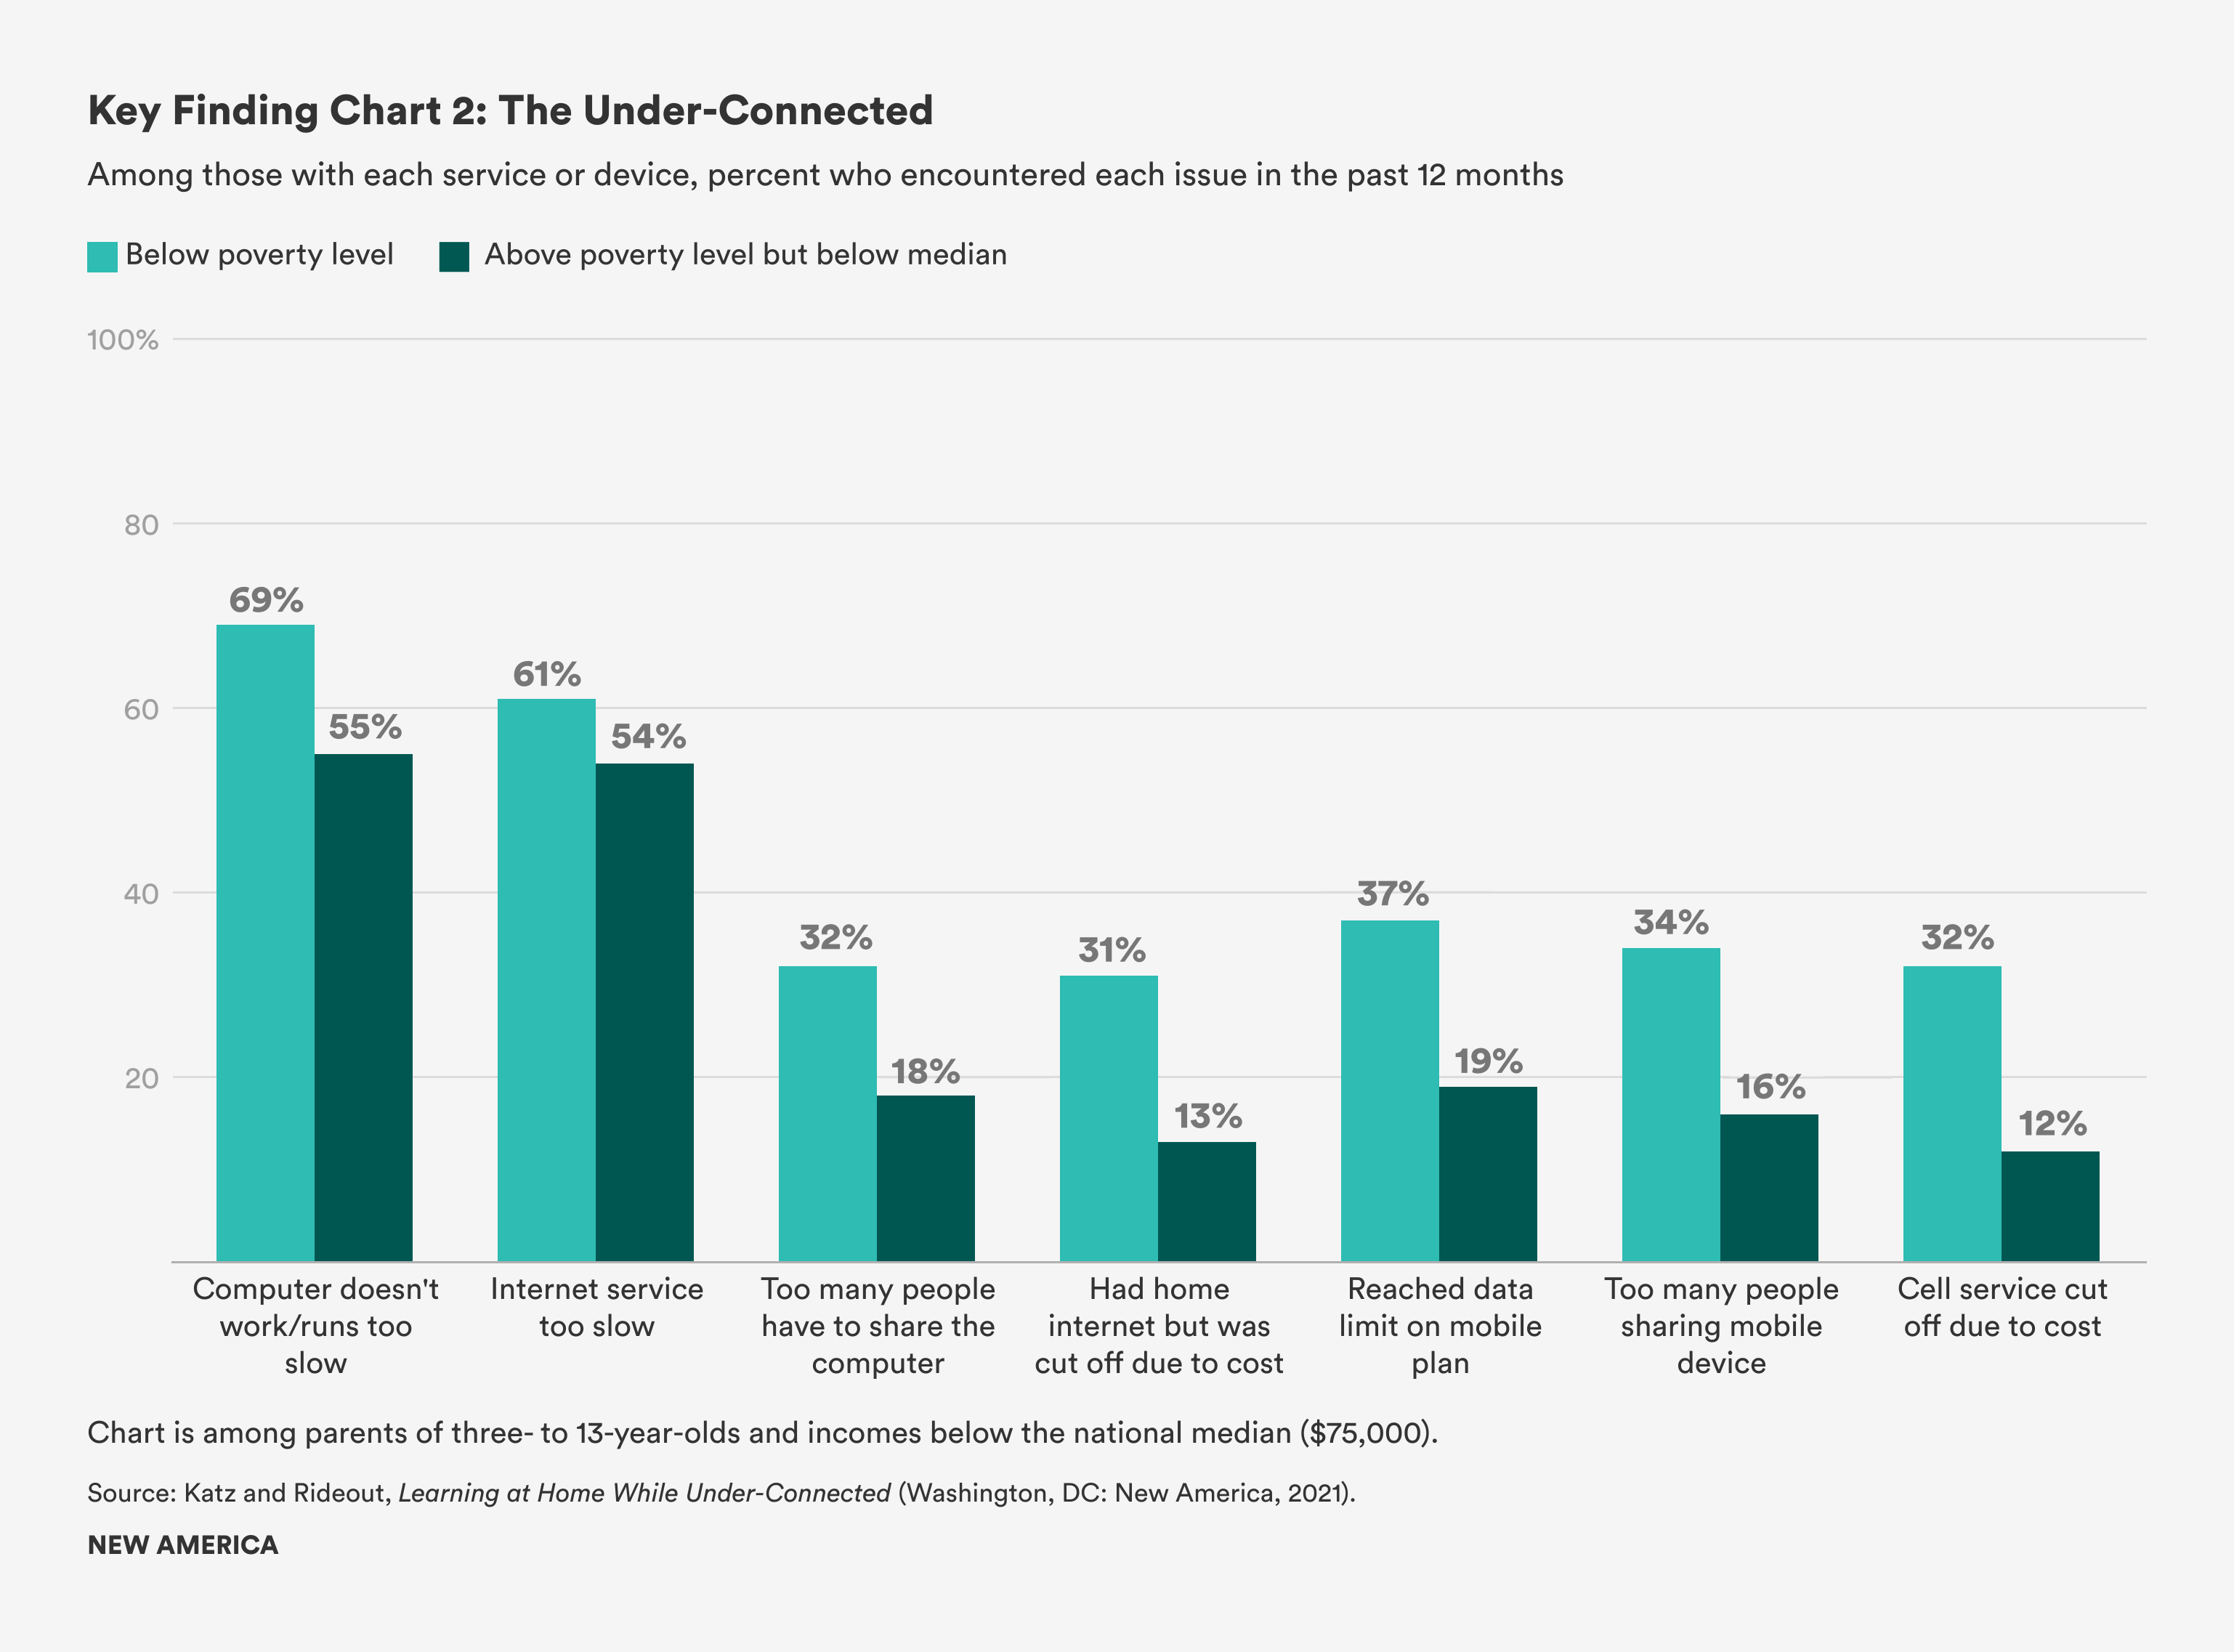
- Seventy-five percent of families with incomes below the federal poverty line reported having home broadband service, but one-third (31 percent) of them have had their service cut off at least once during the past year, due to cost.
- Nearly all families living below the federal poverty level have a smartphone or a tablet, but 37 percent reported hitting the data limits on their mobile plans at least once during the past year. Roughly one-third said too many family members needed to share mobile devices (34 percent) or reported having their cell service cut off entirely at least once in the past year, due to an inability to pay the bill (32 percent).
- Eighty-two percent of families in poverty have a computer at home, but one-third of them (32 percent) said there were too many people competing for time on the device, and nearly seven in 10 (69 percent) said their computer was too old or ran too slowly.
Changes in Internet and Device Access 2015–2021
Internet Access over Time
In 2015, we conducted a nationally representative, probability-based telephone survey of lower-income parents. Since we used the same population parameters and sampling methods this year, we can systematically compare how these families were faring digitally before and during the pandemic. Our 2015 survey focused on families with children ages six to 13 years old; therefore, our comparisons are limited to the subset of the 2021 sample with children in the same age range (n=799).
We find dramatic gains in internet access between 2015 and 2021 among this subset of families (see Chart 3). Those gains have been particularly substantial for the families who were most likely to be under-connected in 2015, including families headed by immigrant Hispanic parents.
- Home broadband access increased from 64 percent to 84 percent among lower-income families with children ages six to 13. The proportion of these families relying on mobile-only access also dropped significantly, from 23 percent to 10 percent. And the proportion with no internet access at all declined from 5 percent in 2015, to 1 percent in 2021.
- Among families reporting household incomes below the federal poverty line, broadband access increased from 48 percent in 2015 to 76 percent in 2021. The proportion of families relying on mobile-only access dropped by more than half, from 33 percent to 15 percent, and families reporting no internet access at all declined from 9 percent to 2 percent over the same time period.
- Among lower-income Black families in our samples, home broadband access increased from 64 percent in 2015 to 95 percent in 2021. Mobile-only access among Black families dropped from 25 percent to 5 percent during the same time period.
- Among lower-income families headed by U.S.-born Hispanics, home broadband access increased from 64 percent in 2015 to 89 percent in 2021. Mobile-only access decreased, from 17 percent in 2015 to 5 percent in 2021.
- Among families headed by immigrant Hispanics, home broadband access more than doubled, from 35 percent in 2015 to 75 percent in 2021. The proportion of these families relying on mobile-only access dropped from 41 percent to 17 percent, and those reporting no internet access at all had dropped from 10 percent to 1 percent. In 2015, 63 percent of families headed by immigrant Hispanics had either mobile-only (41 percent), dial-up (12 percent), or no internet access (10 percent); in 2021, 23 percent of these families experienced those same circumstances.
Device Access over Time
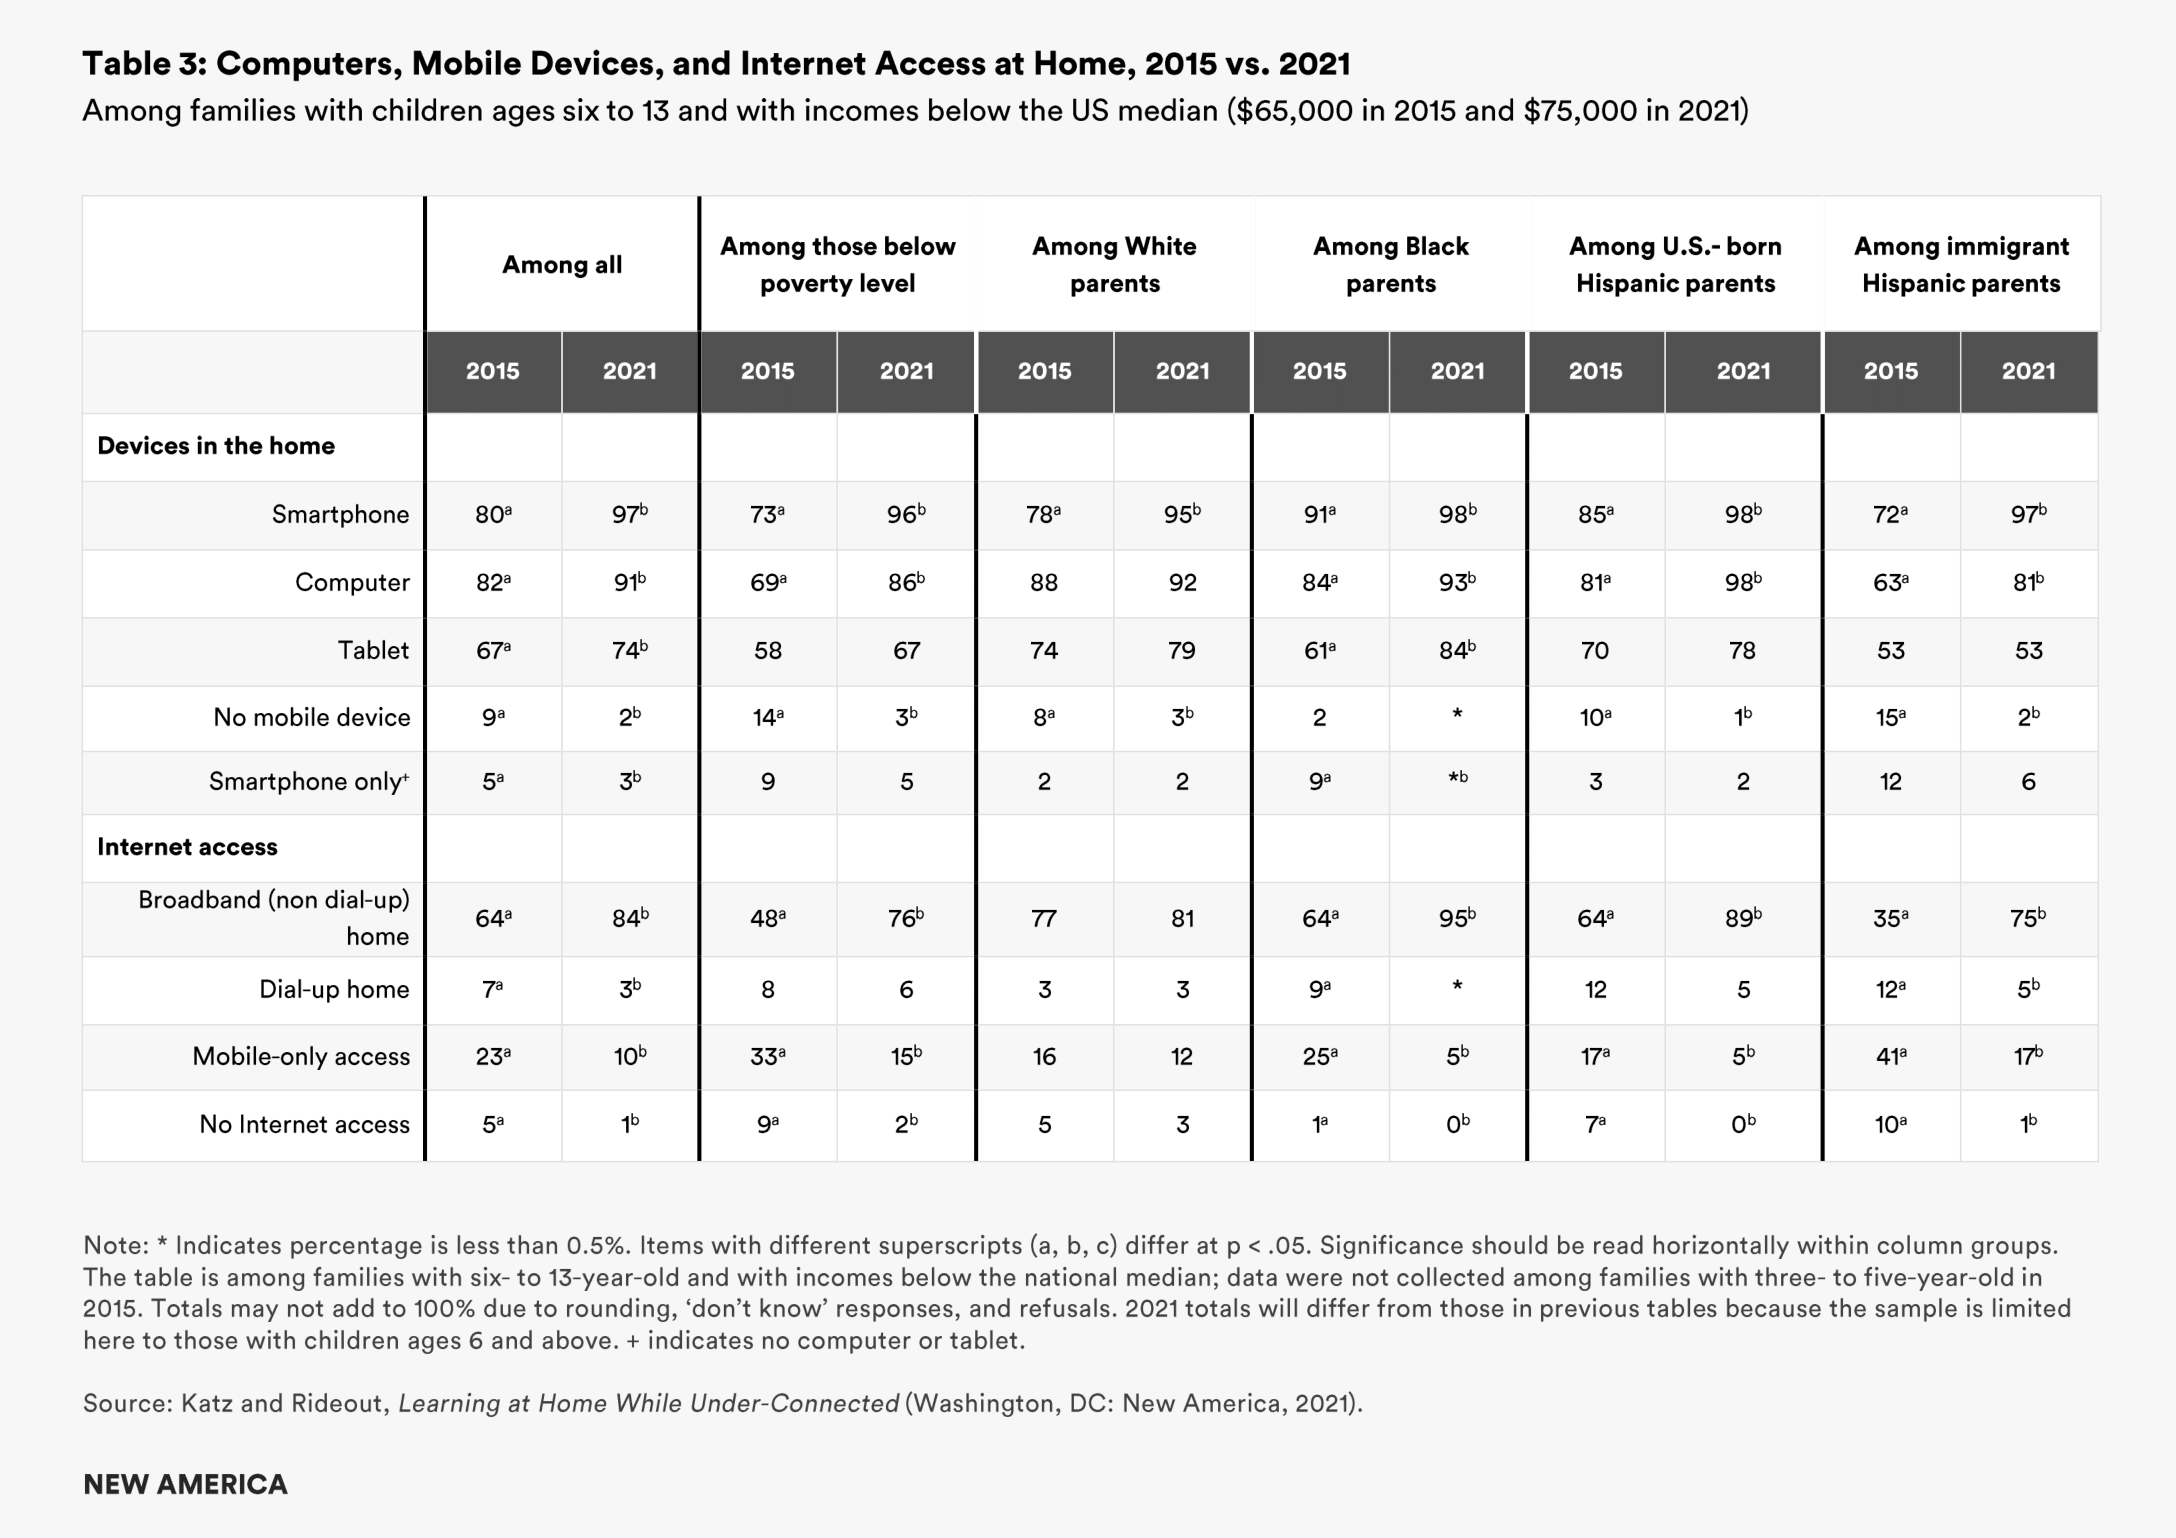
Just as rates of home internet access have increased dramatically between 2015 and 2021, so too has home computer access among lower-income families with six- to 13-year-olds (see Table 3). It is not possible to tell from this particular survey whether this is a result of schools delivering “emergency” laptops due to the pandemic that families will need to return or due to increased rates of families owning these devices.
Overall, home computer access has increased from 82 percent in 2015 to 91 percent in 2021 among families with six- to 13-year-olds. The increase has been especially pronounced among families living below the federal poverty level (an increase from 69 percent in 2015 to 86 percent in 2021), and among families headed by immigrant Hispanic parents (from 63 percent to 81 percent).
Families are also much more likely to report having other digital devices in the home in 2021 compared with 2015, including smartphones and tablets. The proportion of families with a smartphone increased from 80 percent to 97 percent among all families with six- to 13-year-olds, with especially notable increases among those whose incomes are below the poverty level (from 73 percent to 96 percent), among White families (from 78 percent to 95 percent), and among families headed by immigrant Hispanic parents (from 72 percent to 97 percent).
Citations
- The Joan Ganz Cooney Center at Sesame Workshop published the 2016 report. For the survey, accompanying case studies, and policy brief, see source
- Vikki S. Katz, “What It Means to Be ‘Under-Connected’ in Lower-Income Families,” Journal of Children and Media, 11, no. 2 (2017): 241–244.
Remote Learning and Digital Access
Remote Learning
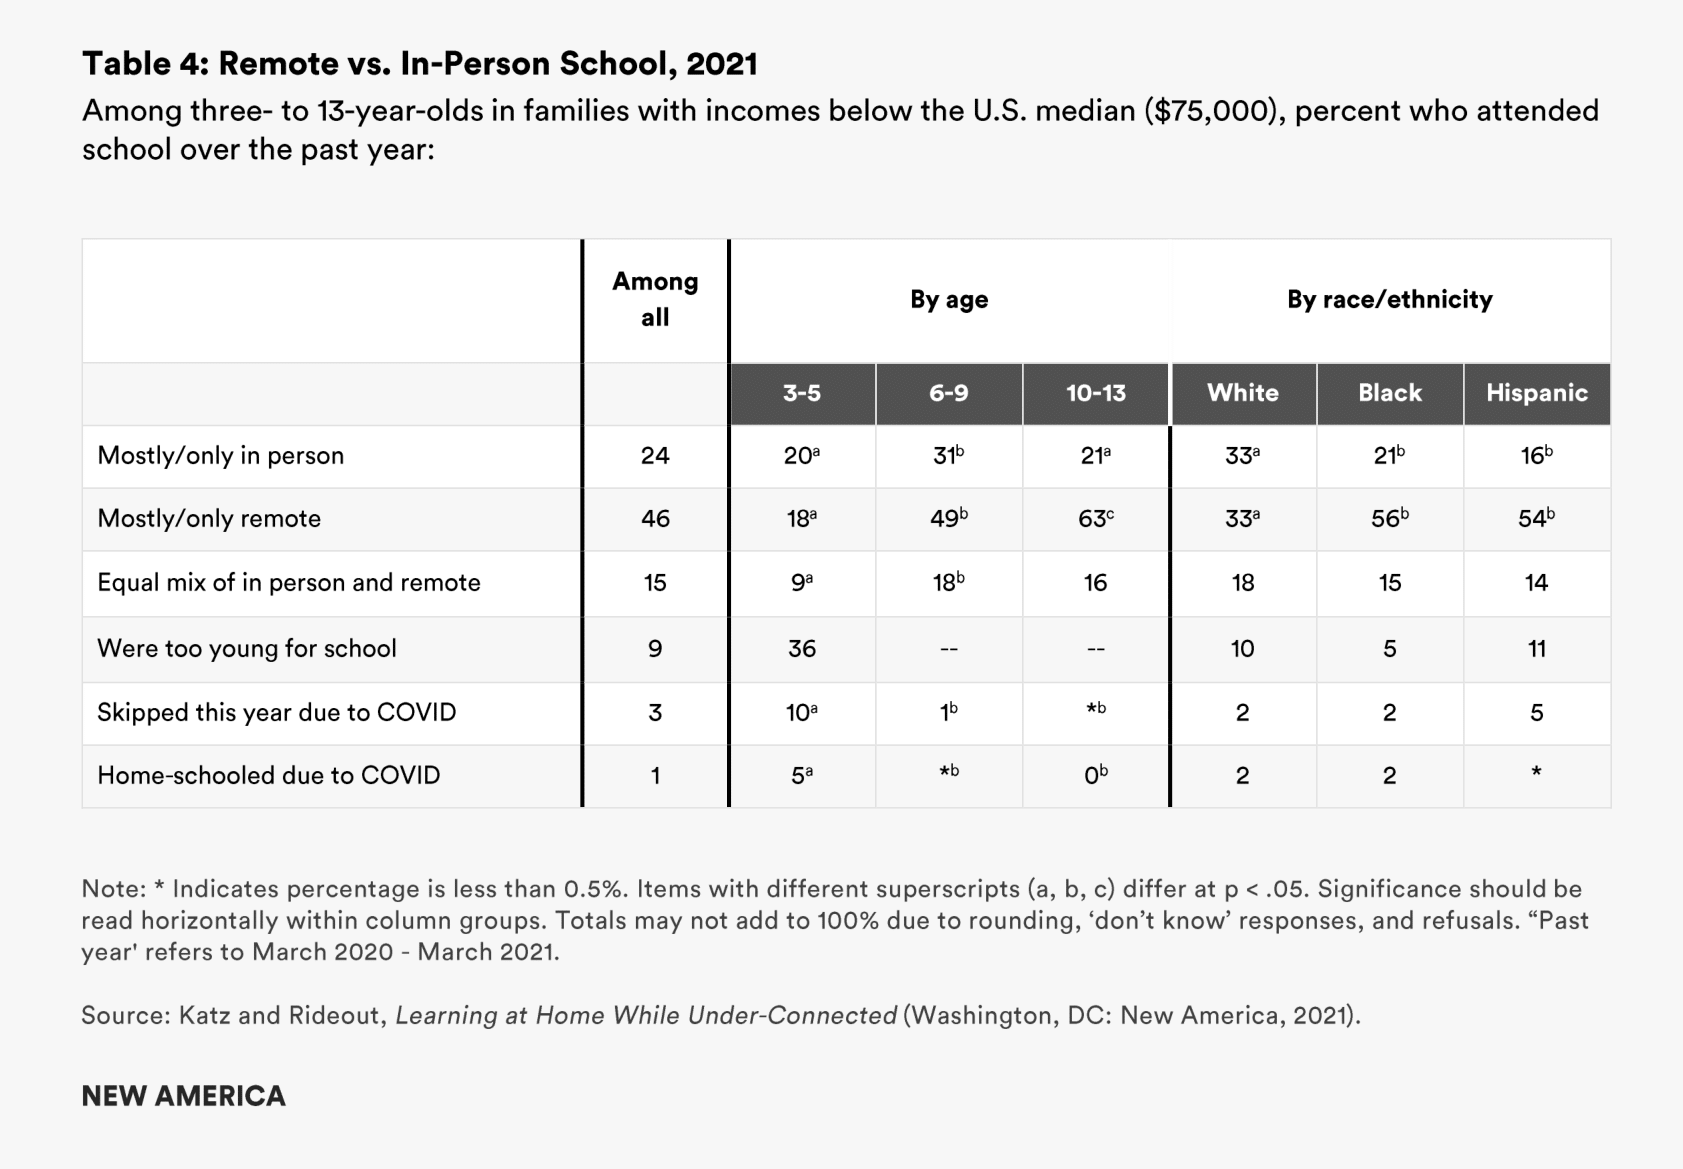
Nearly half (46 percent) of parents reported that their child had attended school either “mostly” or only remotely since March 2020, a quarter (24 percent) had attended mostly or only in-person, and 15 percent reported an equal mix of in-person and remote learning. The remainder were too young for school, skipped this school year due to the pandemic, or were being formally home-schooled due to the pandemic (see Table 4).
The likelihood of attending school remotely versus in person did not differ significantly by poverty status, or (among Hispanics) by immigrant generation. There were, however, significant differences by race/ethnicity, with majorities of Black children (56 percent) and Hispanic children (54 percent) attending school primarily remotely, compared with one-third (33 percent) of White children.
Many of the youngest children in lower-income families missed a year of or kindergarten due to the pandemic, with parents choosing either not to enroll them at all, or to homeschool them for the year instead. Ten percent of children who would normally have been in or kindergarten skipped school entirely due to COVID, and an additional 5 percent were home-schooled by their parents because of COVID (children who are normally home-schooled were excluded from the survey).
Even students who were enrolled in school during the pandemic –whether remotely or in person –ended up missing large chunks of school, a measure of COVID’s broad, disruptive impact on children. Among those in kindergarten or elementary school grades, 23 percent had missed two or more weeks of school for some reason during the pandemic. The likelihood of having missed weeks of school was even higher among children with special needs (37 percent, vs. 18 percent of those without special needs) and disproportionately reported by parents raising children on incomes below the federal poverty line. Thirty percent of these children missed at least two weeks of school, compared with 19 percent of those reporting incomes above the poverty line, but still below the median household income.
Remote Learning Interruptions Due to Being Under-connected
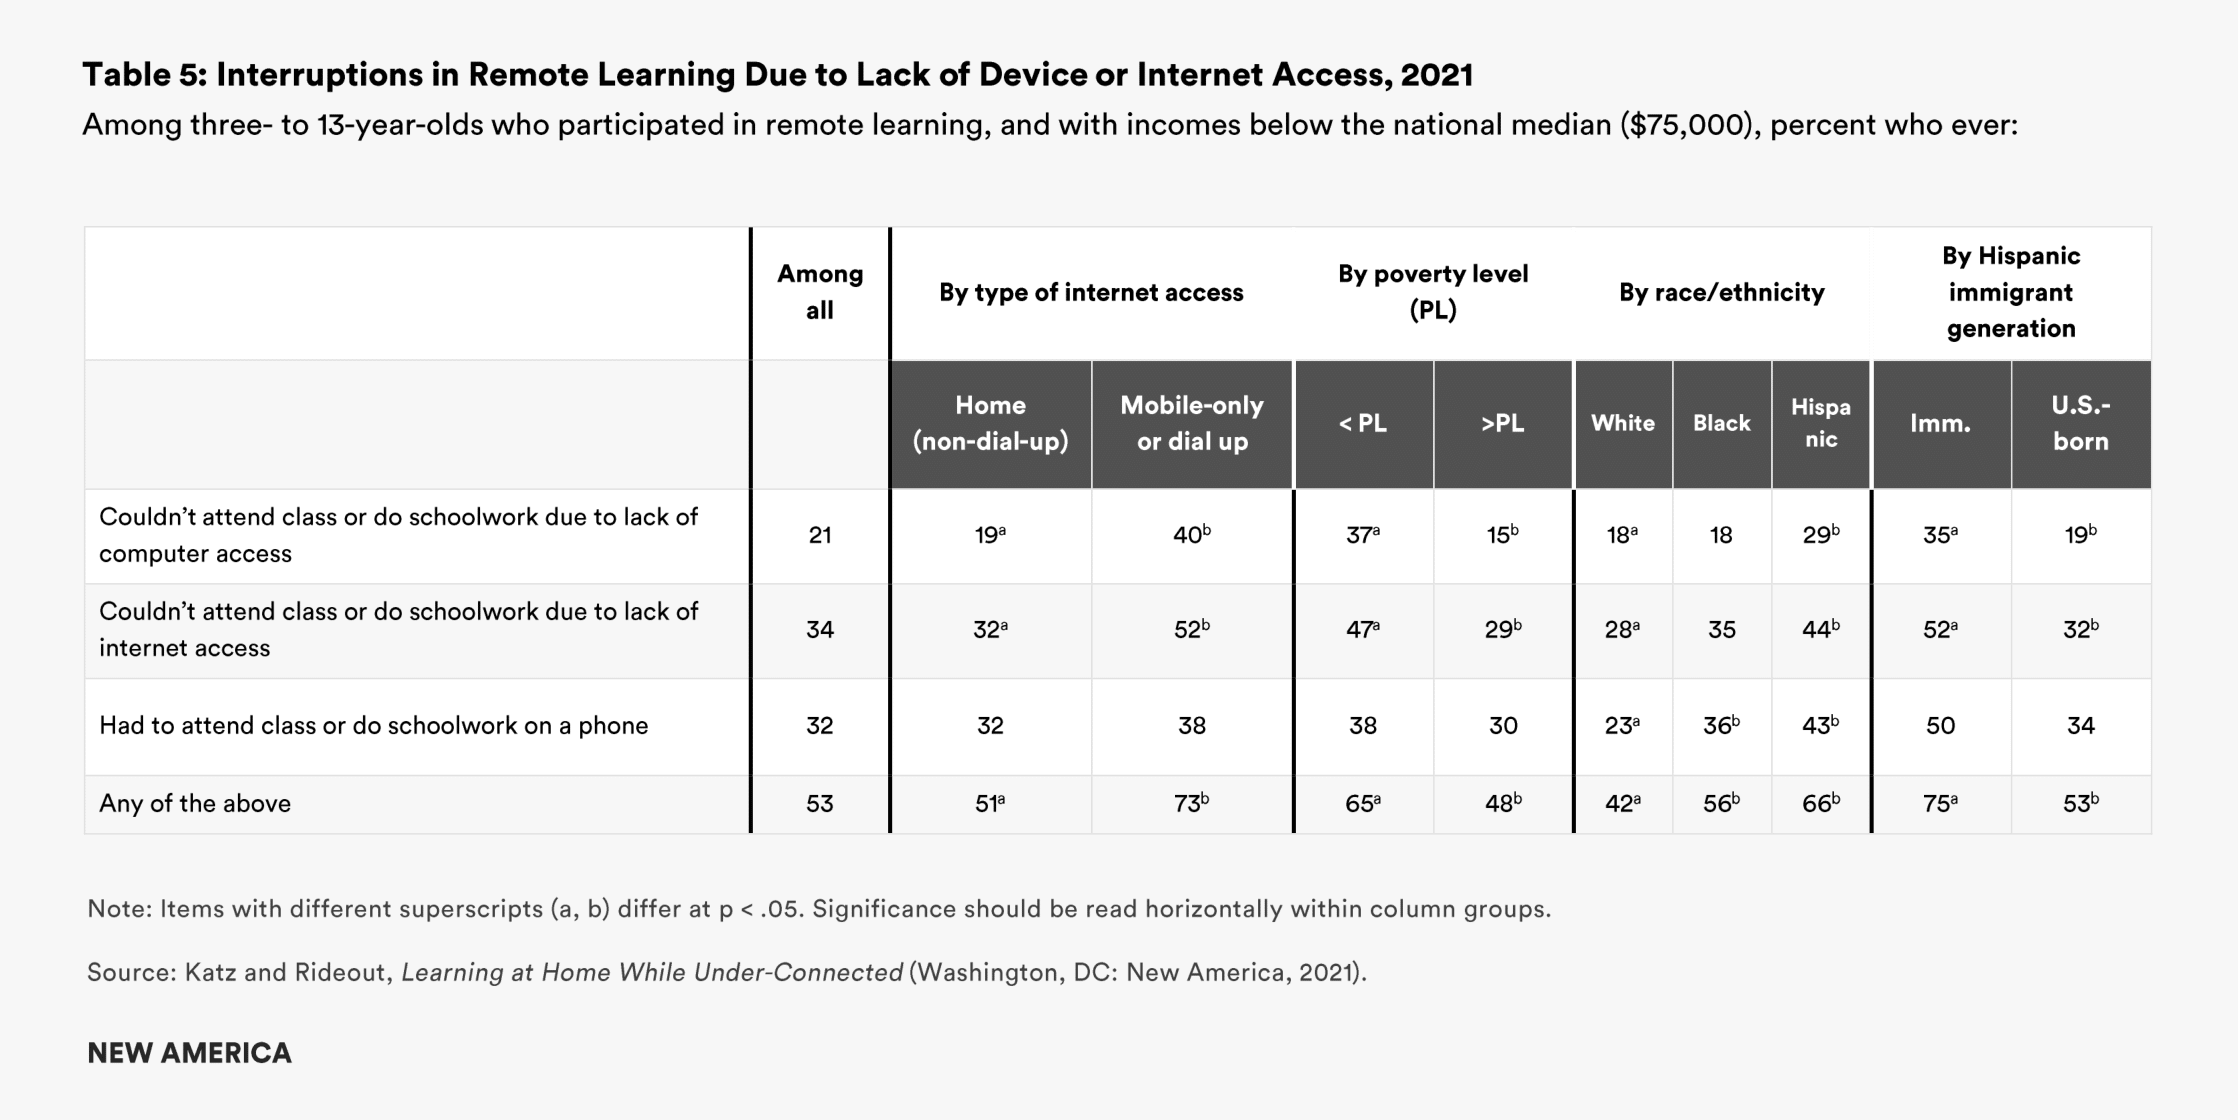
Roughly half (53 percent) of parents reported that their children had not been able to attend school remotely at some point during the past year due to being under-connected. About one-third of students were unable to participate in class or complete their schoolwork due to a lack of internet access (34 percent), and a similar number (32 percent) had to participate on a cell phone for some period of time. One in five students (21 percent) were unable to participate in school or finish their schoolwork at some point because they could not access a computer (see Table 5).
These measures clearly show how type and quality of internet access affects students’ school participation. Among parents with mobile-only or dial-up internet, half (52 percent) said their lack of internet access prevented their children from participating or completing their work at some point over the past year, compared with 32 percent of families with home broadband access.
Although youth without broadband were significantly more likely to experience schooling disruptions during the pandemic than youth with broadband, it is startling that so many students with broadband also experienced such disruptions (32 percent, as mentioned above). This highlights the importance of underconnectivity even among those with internet and internet-capable devices. Similarly, our results suggest that computer ownership alone did not prevent device-related schooling disruptions. Of course it makes sense that 34 percent of students without a computer at home couldn’t participate or do their required schoolwork because of their lack of a computer. But even among those with a computer, 20 percent sometimes couldn’t participate in school or complete schoolwork because they couldn’t access the computer, that is, because they were under-connected despite owning the device.
The challenges of remote learning hit the lowest-income families and families of color hardest. About two-thirds (65 percent) of families with incomes below the federal poverty level either reported times when they could not participate in class or do their schoolwork due to a lack of computer or internet access, or when they had had to participate via smartphone. Among families with incomes above the poverty line, a smaller but still very high percentage (48 percent) experienced these disruptions. Majorities of Hispanic (66 percent) and Black (56 percent) students also felt the impact of these obstacles to their remote learning participation, as compared with 42 percent of White students. And among families headed by immigrant Hispanics, fully 75 percent experienced these disruptions, with lack of internet access being the most common reason (52 percent) that students were unable to attend school or do their schoolwork.
Examples of Helpful Remote Learning Tools
A small subset of respondents whose children attended school remotely were asked to give examples of any apps or online programs their child used for school during the past year that “helped their learning a lot.” Among those who received this question (n=128), 71 percent gave an example. Whether the 29 percent who did not give an example felt that there was no app or online tool that helped their child’s learning a lot, or they simply could not recall any particular titles, cannot be discerned from this survey.
Of the 91 parents who provided the name of a helpful learning app or program, a total of 51 different brands or titles were mentioned, with the vast majority (42) being named fewer than four times. Google products were mentioned 21 times and Zoom was mentioned 11 times. Canvas, Dreambox, ABC Mouse, i-Ready, Epic, Seesaw, and Schoology were mentioned by four to six respondents each.
Coders classified each title into categories. The first was virtual learning support (web-based platforms used to organize virtual classrooms, collect assignments, or communicate with parents). The second was one of three types of e-learning tools: literacy-related, math-related, or multi-subject. More than half (58 percent) of parents who named a specific online program mentioned a virtual learning tool (Google Classroom, Zoom, Canvas, Schoology); 16 percent named a math-related product (Dreambox, SplashMath); 15 percent named multi-subject e-learning tools (ABC Mouse, IXL, BrainPop), and 14 percent named literacy- or reading-related e-learning tools (Epic, Sparkle, Lexia). Coders also classified apps by whether or not they require payment. Nineteen parents (21 percent of those giving an example of a learning app or tool) mentioned ones that require payment after a free trial period.
Educational Assets and Priorities for School Next Year
Parental Gains from Remote Learning
The negative impacts of remote learning on children and families have rightfully been where educators and policymakers have focused their attention. We wanted to balance that focus by investigating what parents may also have learned during this extraordinary year, when they became their children’s in-house learning guides overnight. This in no way diminishes the stresses and strains online learning generated for both parents and children. But even the most challenging circumstances can develop new skills and confidence, and schools may be able to support and build on these new strengths and assets in the future.
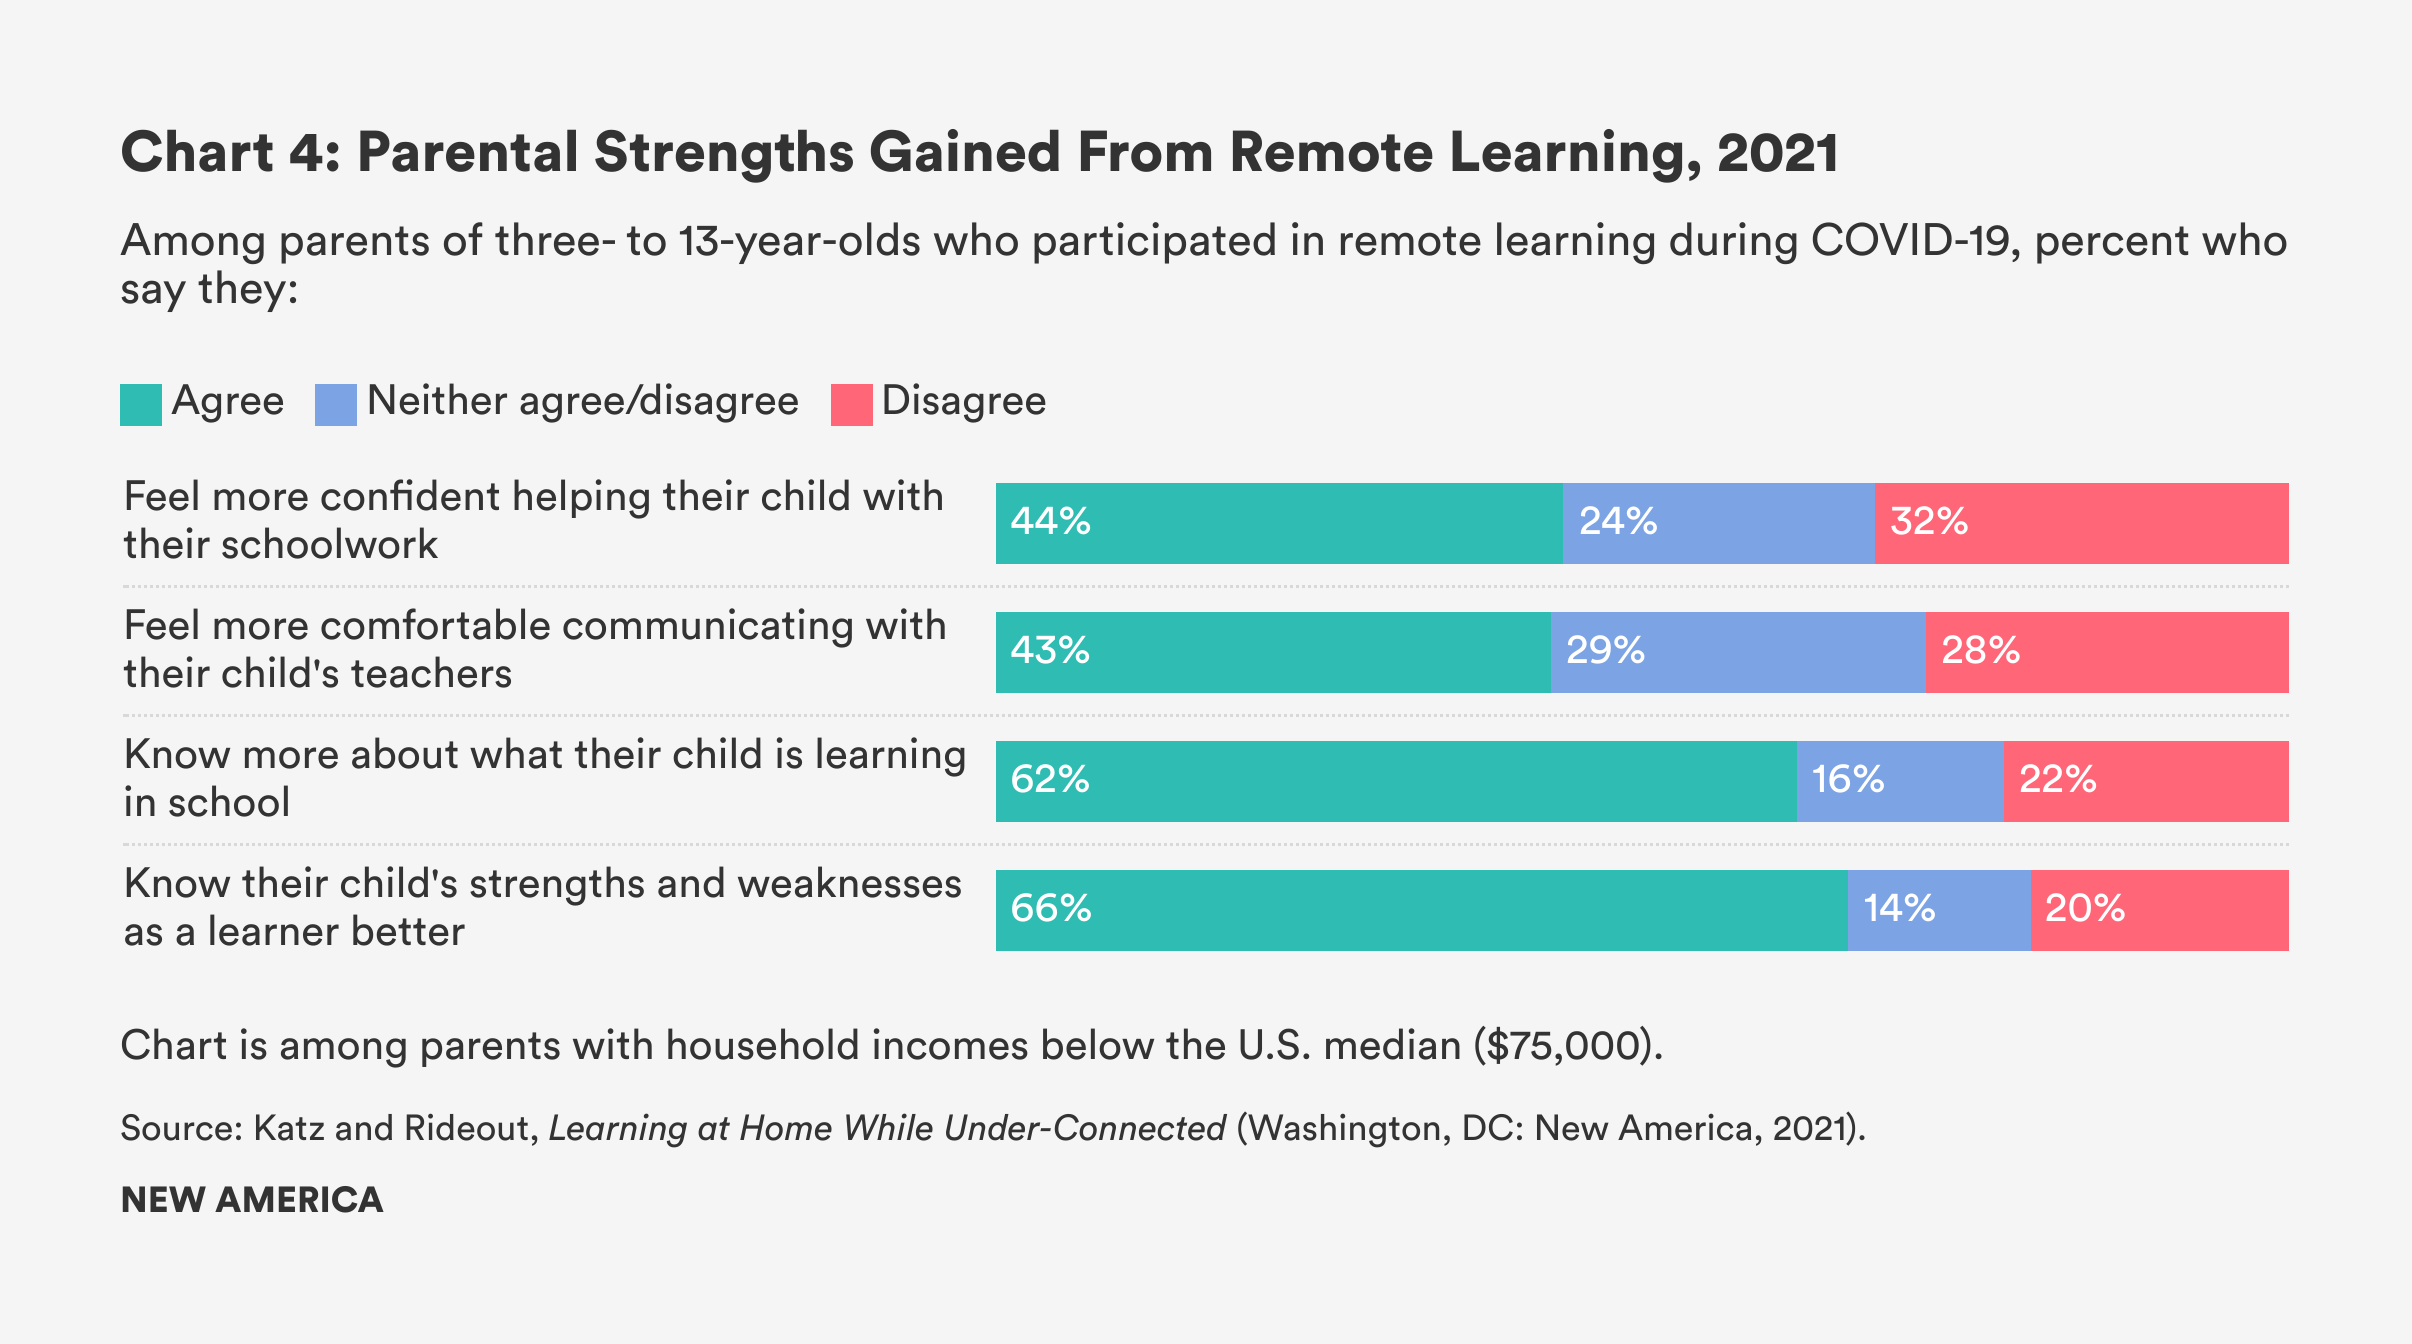
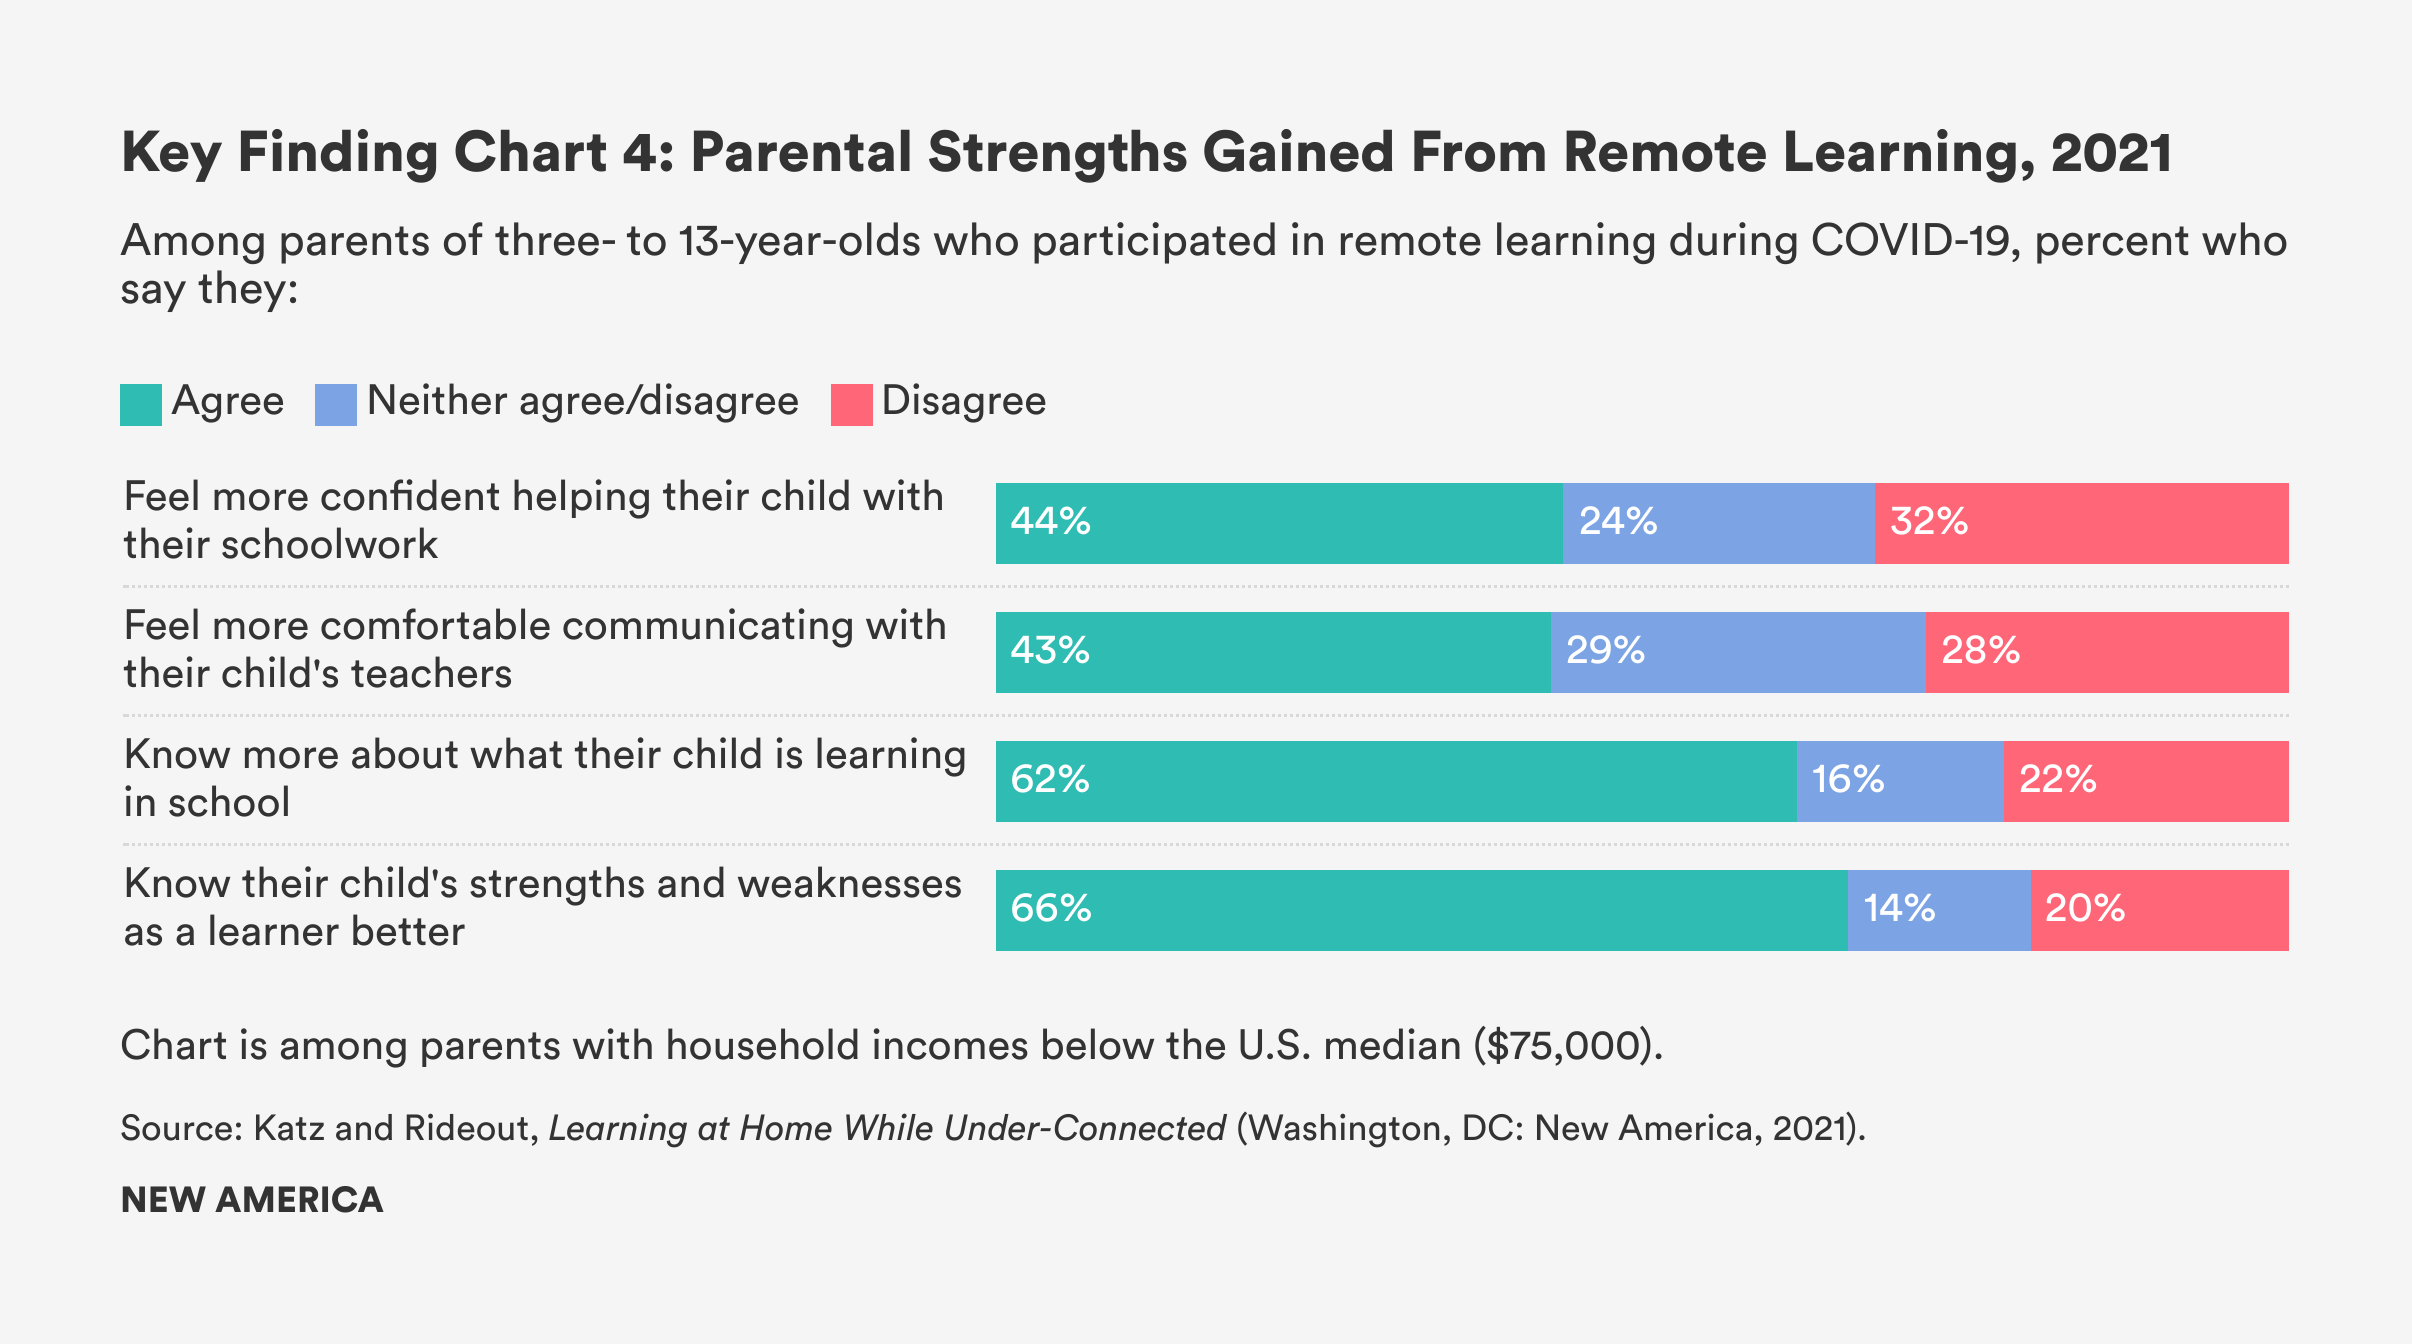
Two-thirds of parents (66 percent) agree that they know more about their child’s strengths and weaknesses as a learner now than they did before the pandemic, including 42 percent who “strongly” agree with that statement (see Chart 4). This deeper knowledge could benefit children going forward, as parents help to guide their children’s homework, or seek assistance or enrichment for their children’s learning. A majority (62 percent) of parents also agree that they know more about what their child is learning in school now than they did prior to the pandemic, including 36 percent who strongly agree.
About four in ten parents report being more comfortable communicating with their children’s teachers now than they were before the pandemic or feeling more confident helping their child with their schoolwork (43 percent and 44 percent, respectively). More than one in four (29 percent) parents disagreed with the notion of feeling more comfortable communicating with their children’s teachers than a year ago, and 32 percent disagreed that they feel more confident helping their child with their schoolwork (the rest neither agreed nor disagreed). Educators should prioritize improving parent-teacher communication and building parents’ comfort in seeking teachers’ guidance to ensure smooth transitions into or back to in-person schooling after the summer break.
One of the more positive outcomes of pandemic remote learning may be that Black and Hispanic parents, as well as those living on incomes below the federal poverty line, reported the greatest gains in terms of understanding their child’s strengths and weaknesses as a learner, knowing more about what they are learning in school, feeling comfortable communicating with their teachers, and being confident in their ability to help their children with their schoolwork (see Table 6). Given that parents of color and parents living on incomes below the federal poverty level are among those who have historically faced disproportionate challenges building strong relationships with educators, these findings are a bright spot worth building on.
Priorities for the Next School Year
Since our survey coincided with the rapid deployment of vaccines against COVID-19, a full return to in-person school for the fall 2021 term finally felt probable. Educators and policymakers at federal, state, and local levels have been prioritizing ‘high-dose tutoring’1 and other initiatives to try to accelerate academic progress when they return to classrooms. When we asked parents their priorities for the return to school in the fall, academic concerns were less pressing than their children’s social and emotional well-being. To ensure a smooth transition from learning at home to learning at school, it will be critical for educators to establish clear priorities for the new school year that align with what parents consider the most pressing developmental concerns for their children.
In this survey, we elicited parents’ opinions on their top priority for their child’s school in the fall of 2021. We listed five possible priorities and asked parents to choose the most important one (“After all the educational disruptions the pandemic has caused this past year, what do you think will be most important for your child” at school next year?). And then we asked parents an open-ended question about any other issues that they consider a “very important educational priority” for their child next fall.
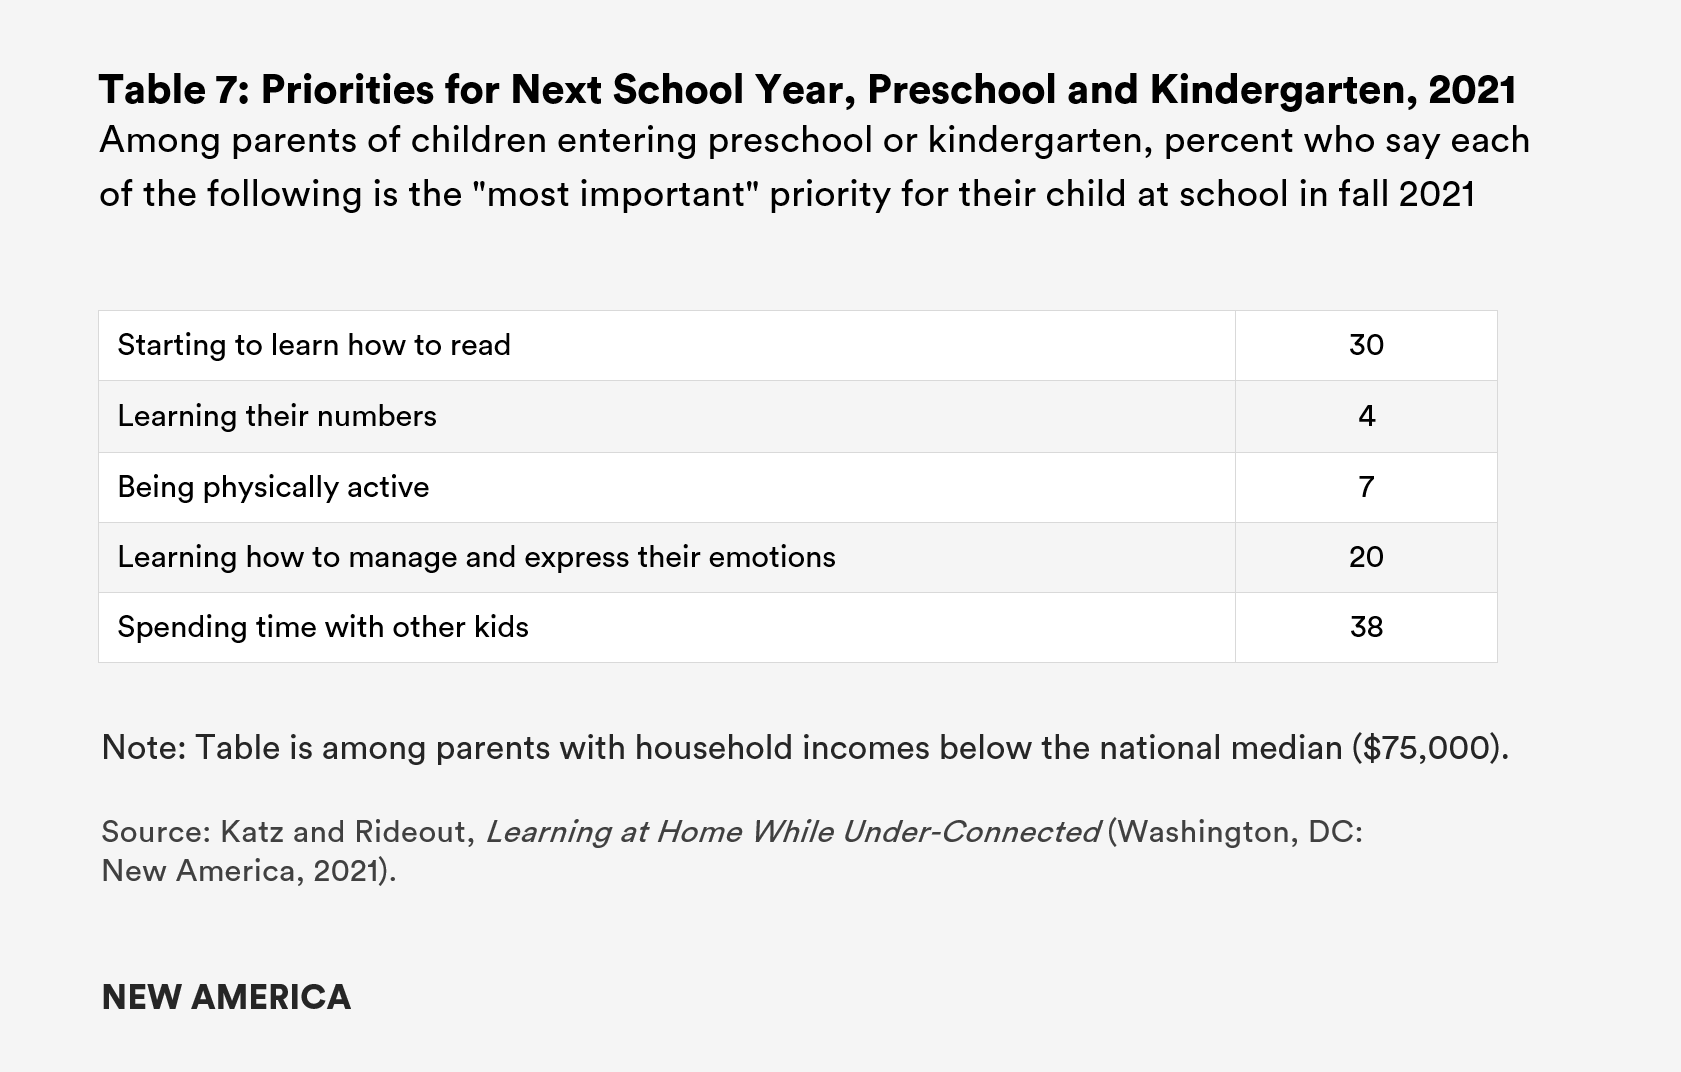
Of the five priorities listed in the closed-end question, two were academic, one was physical, and two were social/emotional. Despite all the public attention paid to “learning loss” during the pandemic, the majority of parents selected socialization or socio-emotional development as their top priority for their child. Among those whose child will be entering preschool or kindergarten, 58 percent selected either “spending time with other kids” (38 percent) or “learning how to manage and express their emotions” (20 percent) as the most important priority for the coming school year, compared to the 34 percent who selected either “starting to learn how to read” (30 percent) or “learning their numbers” (4 percent; see Table 7).
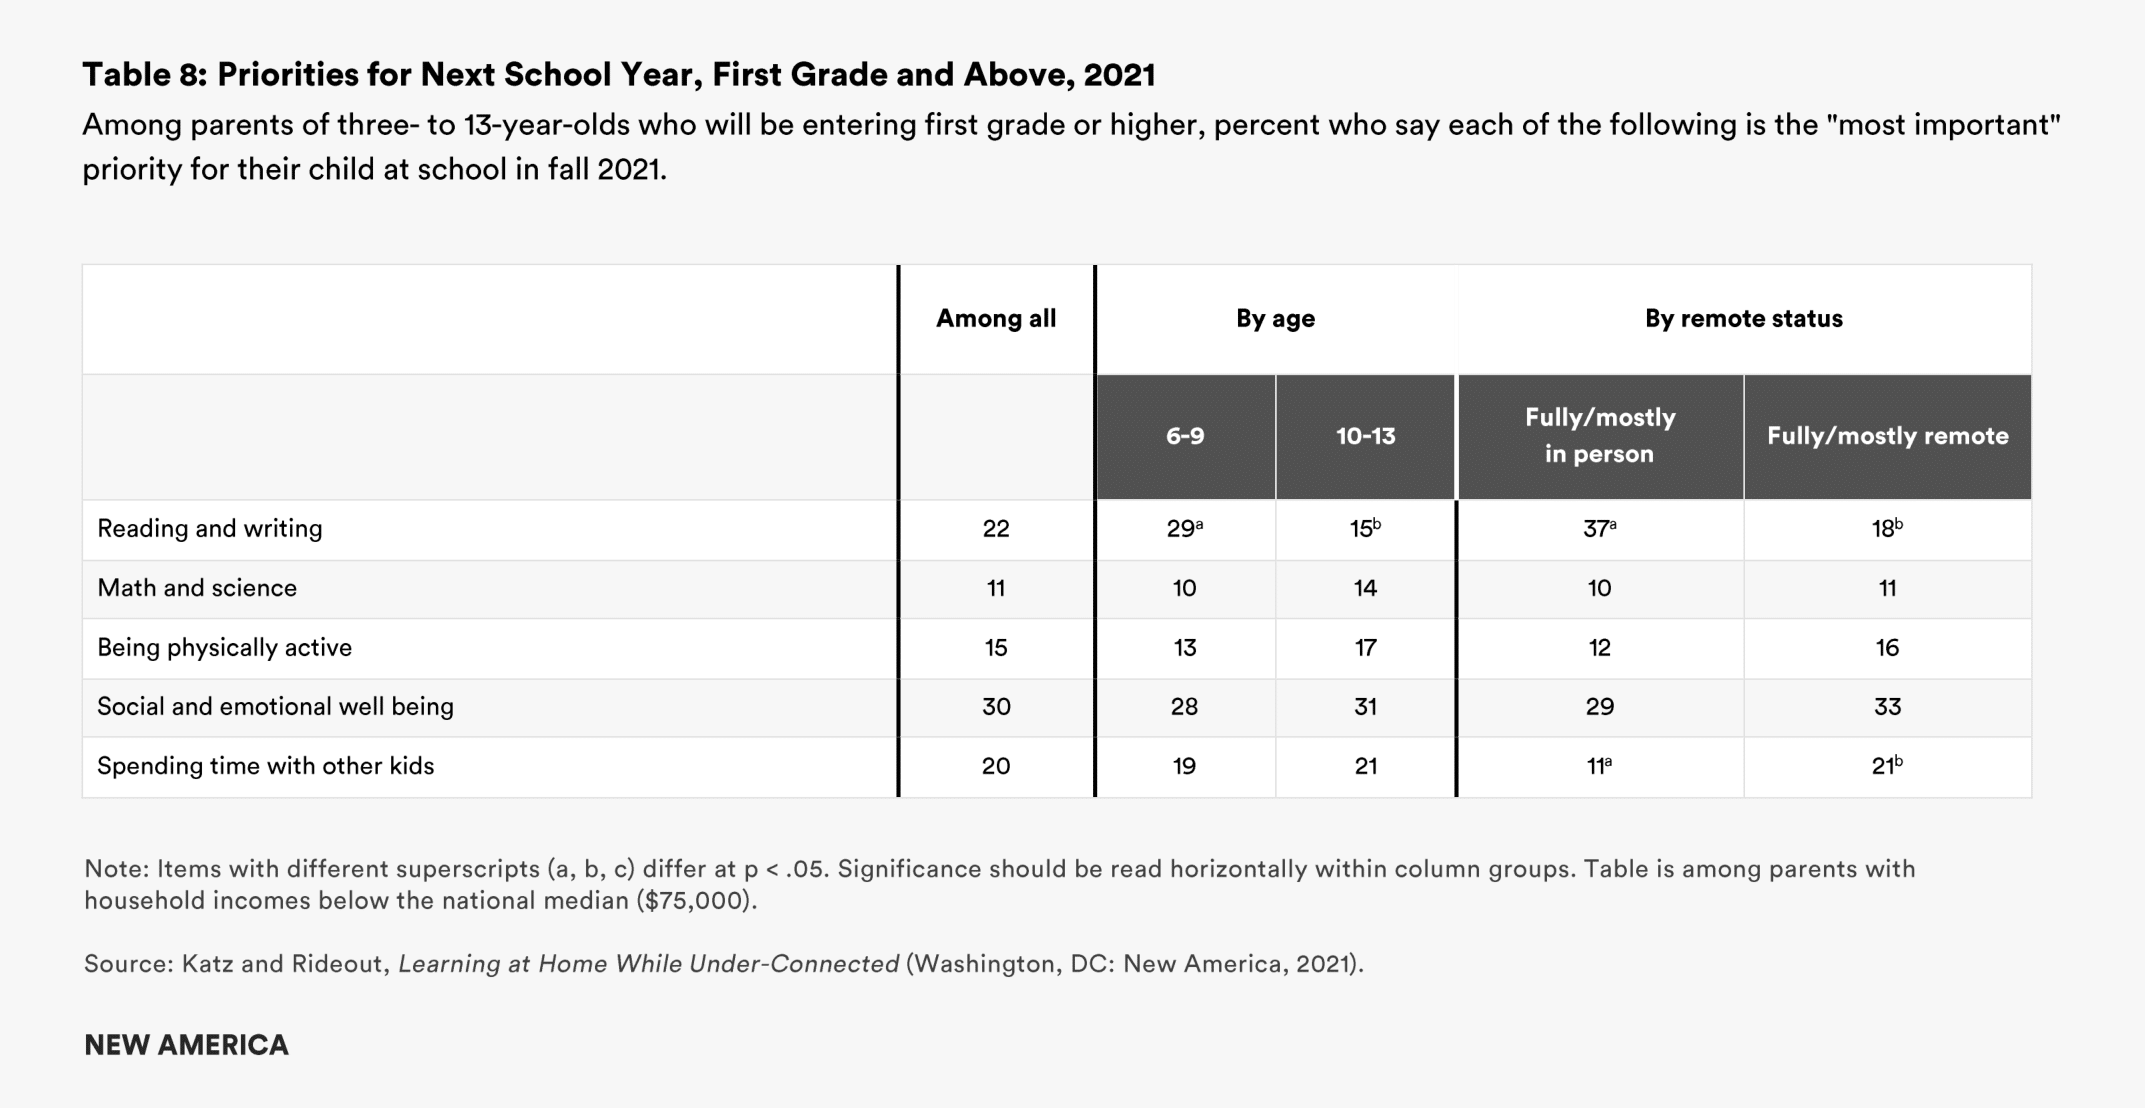
Among parents with children in first grade or higher, a total of 50 percent chose either “social and emotional well-being” (30 percent) or “spending time with other kids” (20 percent), compared with 33 percent who chose an academic priority (22 percent for reading and writing, and 11 percent for math and science). This does not imply that academics are not important to parents—reading was the number two priority among parents in both groups—but the findings clearly show that parents are deeply concerned about their children’s socialization and social-emotional well-being after more than a year of remote learning and social distancing (see Table 8).
In Parents’ Own Words: Priorities for the Next School Year
A total of 383 parents (38 percent of those surveyed) opted to provide additional perspectives in their own words on “very important” priorities for their child when school starts in fall of 2021. Consistent with the findings reported above, responses reflect socio-emotional priorities; 59 percent of open-ended responses focused on issues such as smoothing children’s transitions to in-person school five days per week, spending time with same-age peers, building strong relationships with teachers, or their child’s general well-being and mental health. By comparison, 24 percent of parents who provided responses used the opportunity to emphasize academic concerns (see Table 9).

Thematic analysis revealed an overwhelming sentiment among parents that cut across categories: that their children need to return to full-time, in-person learning in the fall. Many framed this as “going back to school and back to normal.” For others, it was the urgency of children learning in a developmentally appropriate environment.
For others, the return to in-person schooling will be a welcome return to parenting without also having to guide remote learning. As one parent summarized, her priority for the fall is “having someone who is qualified to teach my child. That's not me.”
Twenty-eight percent of parents who offered who offered priorities in their own words mentioned ensuring their child’s smooth adjustment to in-person learning. In-person learning will re-instill “a solid schedule and structure,” that will require their child to maintain better focus, follow directions, and manage their time, parents said. These skills have been hard to build or maintain at home. As one parent said, “it's like pulling teeth to get him to stay focused and on task [remotely].” Others tied their priorities for their child’s adjustment to resuming a more rigorous course load.
Another parent provided perhaps the most elegant summation of what children will need as they adjust to being back in school full time: “time and grace.”
One in five parents offering an open-ended response highlighted relationship development as a top priority, whether with peers (12%) or with teachers (8%). One parent said, “she needs to be around people her own age,” and another cited the need “to see friends’ faces, just being with other kids.” Other parents felt that building relationships with teachers would be crucial; the kinds of “hands-on learning with the teacher that he can't get through a computer.”
An additional 11 percent of parents shared that their children’s overall well-being and mental health was a very important priority; for example, that children “have fun at school, feel comfortable at school.” Others discussed how anxious their children have been this year and their hopes that the fall term, and a semblance of normalcy, would help provide their children a greater sense of security.
Nine percent of parents referenced COVID-related concerns as their main priority for the fall. About two-thirds of these parents specified a desire to maintain masking and social distancing to ensure their child’s health and safety. The remainder emphasized the need to end in-school masking, either because doing so symbolizes a return to a recognizable normal, or because they consider masking an impediment to children’s language learning and relationship development.
One in four parents (24 percent) named an academic issue as a top priority, whether they conveyed a general sense of urgency around ensuring their child could “rebound” or “recover” from this year or specified that their child will need remedial support in a specific subject, the most common being reading or writing Others wanted schools to prioritize the sorts of experiential learning that children missed this year, be that science labs, art, music, or hands-on learning experiences in general.
Closely tied to desires to resume experiential learning were parents’ hopes that their child would recover a sense of joy in learning by returning to school, “having him learn more of the things he likes,” as one parent put it. Another parent clearly reflects this desire to see more of the magic of learning return to their children’s lives: “To keep on wanting to learn what interests them and just learning new things…you know, having fun in learning what you like to do. Having fun is so important too.”
For some parents, a renewed sense of joy in being physically present in school was tied to resuming physical education (2 percent), school sports, and other extracurricular activities (1 percent). Another 2 percent of parents were anxious for their children to resume their therapeutic services or special education programs provided by their schools.
Citations
- source">Analysis: High-Quality, High-Dosage Tutoring Can Reduce Learning Loss. A Blueprint for How Washington, States & Districts Can Make It Happen
Educational Media use During COVID
In a year where remote learning disruptions have been common for lower-income families, we wanted to understand whether parents have relied on informal educational media (media that parents consider educational, but that is not directly related to school or schoolwork), particularly if they were without easy access to other supplemental educational services for their children. Accordingly, the survey asked parents how often their children have watched educational TV shows or online videos, played educational games, or engaged in creative activities such as making art or music using their digital devices during the pandemic.
The survey sought to document which types of educational media children are using (outside of what they were assigned for school), and how their usage varies by content type (TV show, game, video, or content creation), and what this looks like demographically. For children who do use educational media often, we also asked parents how helpful these media were for keeping children learning and growing during the pandemic. Finally, we asked whether parents had relied on educational media to help them to explain the COVID-19 pandemic to their children.
Children’s Use of Educational Media
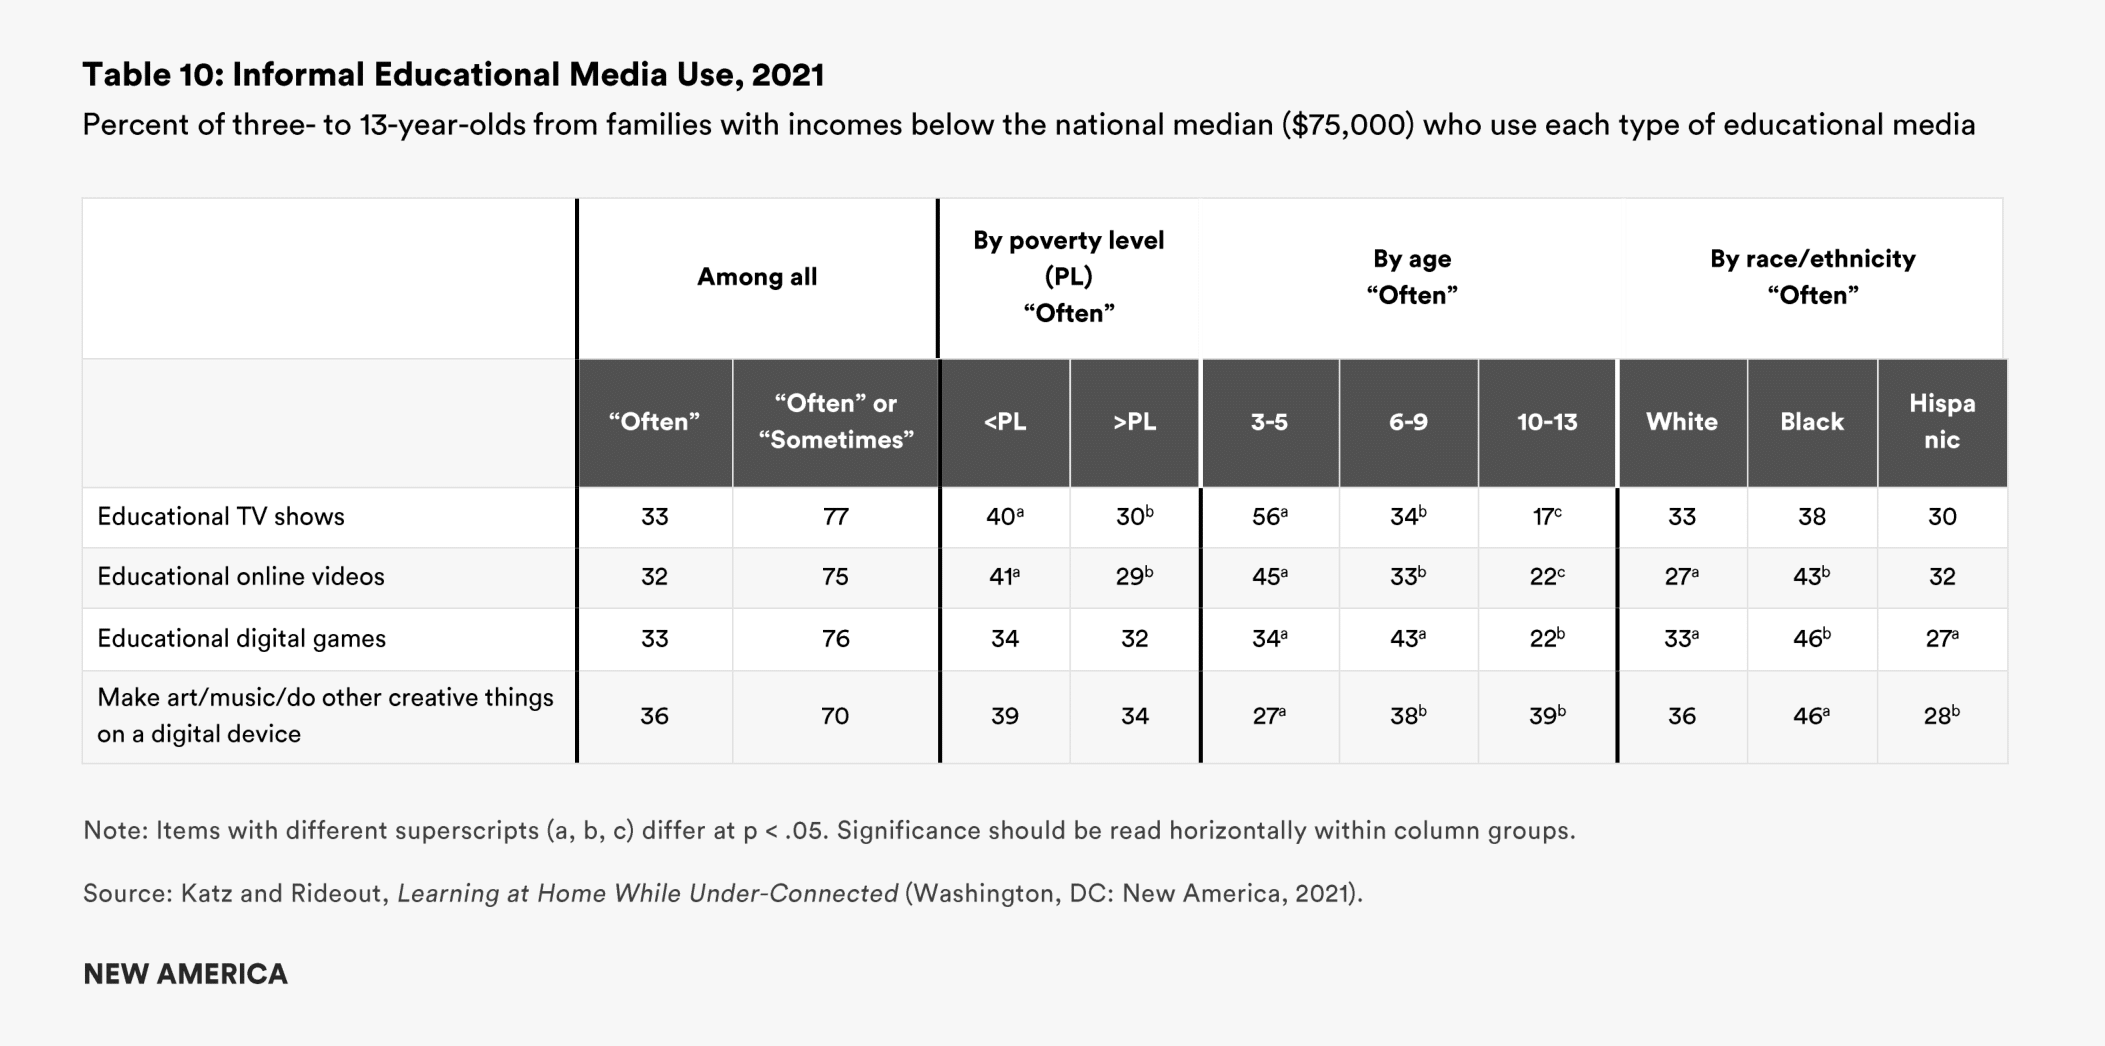
In our survey, more than seven out of 10 children use each type of informal educational media we asked about, and about one in three do so “often.” There are virtually no differences in the frequency with which children use the types of media we asked about; 33 percent of parents say their children often watch educational TV, 33 percent say they often play educational electronic games, and 32 percent say they often watch educational videos online. Thirty-six percent say their children often use a computer, tablet, or phone to make art or music or engage in other creative activities (see Table 10).
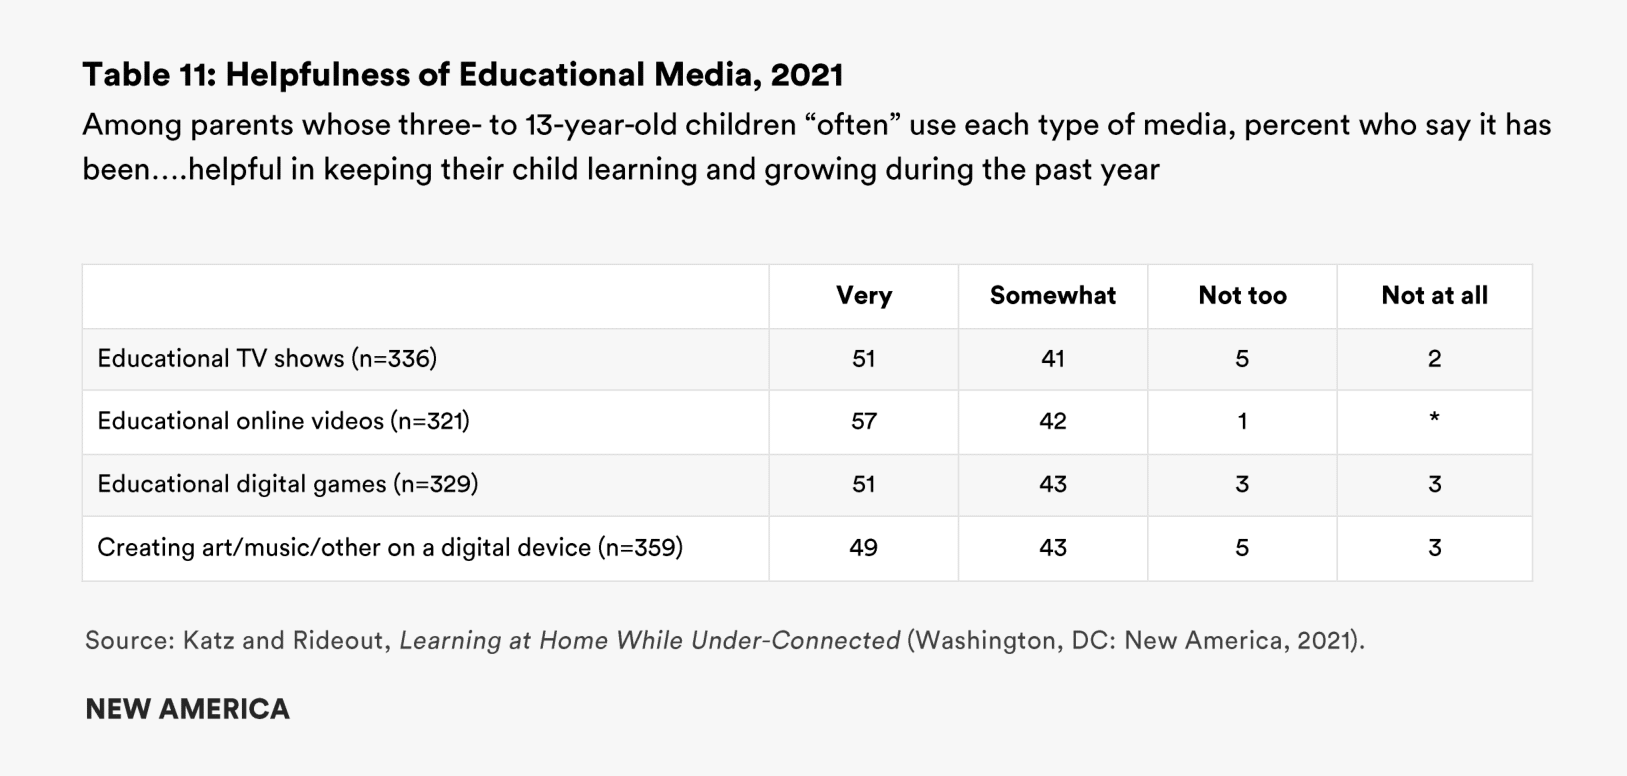
Most parents whose children use educational media say these resources have helped them keep their child learning and growing during the past year. About half of parents whose children “often” use each type of media say they have been “very” helpful, and more than nine out of 10 say they have been at least “somewhat” helpful. Parents’ ratings did not vary substantially by media type, with 57 percent saying the educational videos their child watched were “very” helpful, and 51 percent saying the same about educational TV shows and educational games played on digital devices (see Table 11).
Educational media have been most important to children in the most economically disadvantaged families, who have also been disproportionately affected by being under-connected and experiencing disruptions in their remote learning. These are the children making the most use of informal educational TV shows and videos. Four in 10 children (41 percent) in households with incomes below the federal poverty line “often” watch educational videos online, compared with 29 percent of children in families with incomes above the federal poverty line. We see a similarly significant difference between the proportion of children from families with incomes below and above the poverty line who “often” watch educational TV shows (40 percent vs. 30 percent, respectively).
Survey results also showed that informal educational media engagement varies by race/ethnicity. Black children make greater use of educational online videos and video games than White or Hispanic children and are more likely to engage in creative activities on their digital devices as well. There were no notable differences in frequency of educational media use based on immigrant generation among Hispanics, the type of internet access families relied on, or whether the family had a child with special needs. But children who have a computer in the home are more likely to make art or music or engage in other creative digital activities, as compared with children their age who do not have a computer (37 percent vs. 24 percent who “often” do so, respectively).
The frequency with which children watch educational TV shows decreases quite dramatically with age. While 56 percent of three- to five-year-olds “often” watch educational TV, that proportion drops to 34 percent among six- to nine-year-olds, and to just 17 percent for 10- to 13-year-olds.
Just under half (46 percent) of parents with more than one child ages six to 13 say their children “often” watch TV shows or videos together to learn things. This is a decline from 2015, when 55 percent of siblings “often” co-viewed educational TV shows and videos. It is possible that the need for siblings to share devices for schoolwork meant that they had less time available for watching TV shows or videos together on those devices.
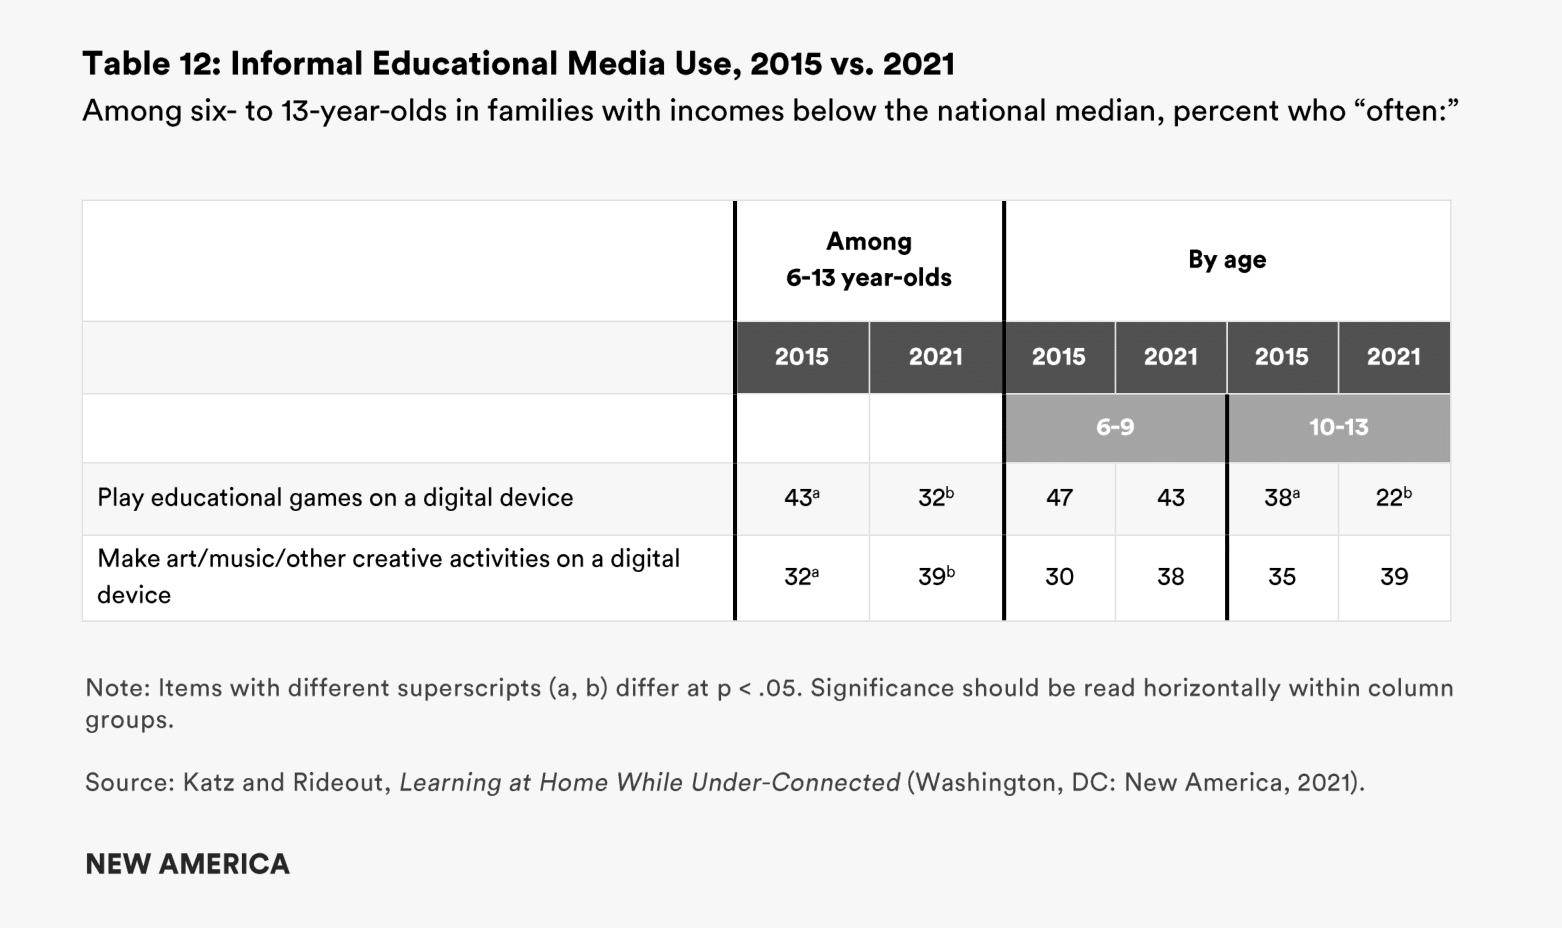
We also collected data in our 2015 survey on children using digital devices for educational games or for creative activities, among those ages six to 13 (see Table 12). Among this age group, use of educational games has declined (from 43 percent who played them often in 2015, to 32 percent who do so now), with the decline being most dramatic among 10- to 13-year-olds. On the other hand, children using computers, tablets, and phones for making art, music, or other creative activities has increased (from 32 percent to 39 percent who do those activities often). It may be that the expanded access to computers in the home since 2015 contributed to the growth in use of digital devices for these purposes.
Examples of Helpful Educational Media
Parents who said their child “often” watched educational TV shows or videos—and that those programs were “very” helpful in keeping their child learning and growing during the past year—were asked to give an example. Of the respondents who received this question (n=238), 84 percent provided an answer.
ABCmouse received the single most mentions (24), followed by Sesame Street (14), Blippi (9), Cocomelon (7), and Wild Kratts (6). Many shows that were mentioned are available on multiple platforms (e.g., Cocomelon, on Netflix and YouTube), while others are available only on a single platform (e.g., Dino Dana on Amazon Prime). Of parents who offered an answer, 21 percent mentioned titles on PBS (Sesame Street, Daniel Tiger, Wild Kratts, Xavier Riddle), and 17 percent mentioned shows or videos that are only available on YouTube (El Mono Silabo, Brave Wilderness, Jack Hartmann Kids Music Channel). Between 7 percent and 10 percent mentioned shows or videos on Nickelodeon (PAW Patrol, Team Umizoomi, Blue’s Clues, Dora the Explorer), Disney (The Mickey Mouse Clubhouse, How Things Work), and Netflix (Waffles and Mochi, StoryBots, The Who Was? Show).
Media for Learning about the Pandemic
We asked parents of six- to 13-year-olds whether their children had watched any TV shows or videos that were helpful in explaining the coronavirus pandemic: 40 percent said they had. The fact that fewer than half of families turned to TV shows or videos designed for this purpose is somewhat surprising, given how all-consuming and often confusing the topic was, even for adults. Whether this finding reflects that families chose not to watch pandemic-related programming created for children or were unaware that such resources were available is not possible to determine from this survey.
Most parents who had watched content intended to educate young people about the pandemic found it helpful, including just under half (46 percent) who said it was “very” helpful (see Chart 5). Black and Hispanic children and those in families living below the poverty level were more likely than others to have watched such programming and, although the subsample sizes are small, it appears their parents were more likely to find the content helpful as well. Over half of Black (54 percent, out of 88 who watched such shows) and Hispanic (56 percent, out of 132 who watched) parents whose children had watched TV shows or videos that explained the pandemic found them “very” helpful, compared with 21 percent of White parents (out of 98 who watched).

Reading
When schools and libraries closed, many educators and other stakeholders worried about how the pandemic would affect young children’s access to books. Would parents be able to find books for their children, especially if they had previously relied on libraries and cannot afford to purchase new books online? If print material is harder to come by, are families using e-books more often, as a cost-effective and COVID-safe way of bringing books into the household? And with families spending more time at home, are they reading together more often—or are the demands of remote learning, working from home, caring for sick family members, and surviving economically all coming together to push reading to the side?
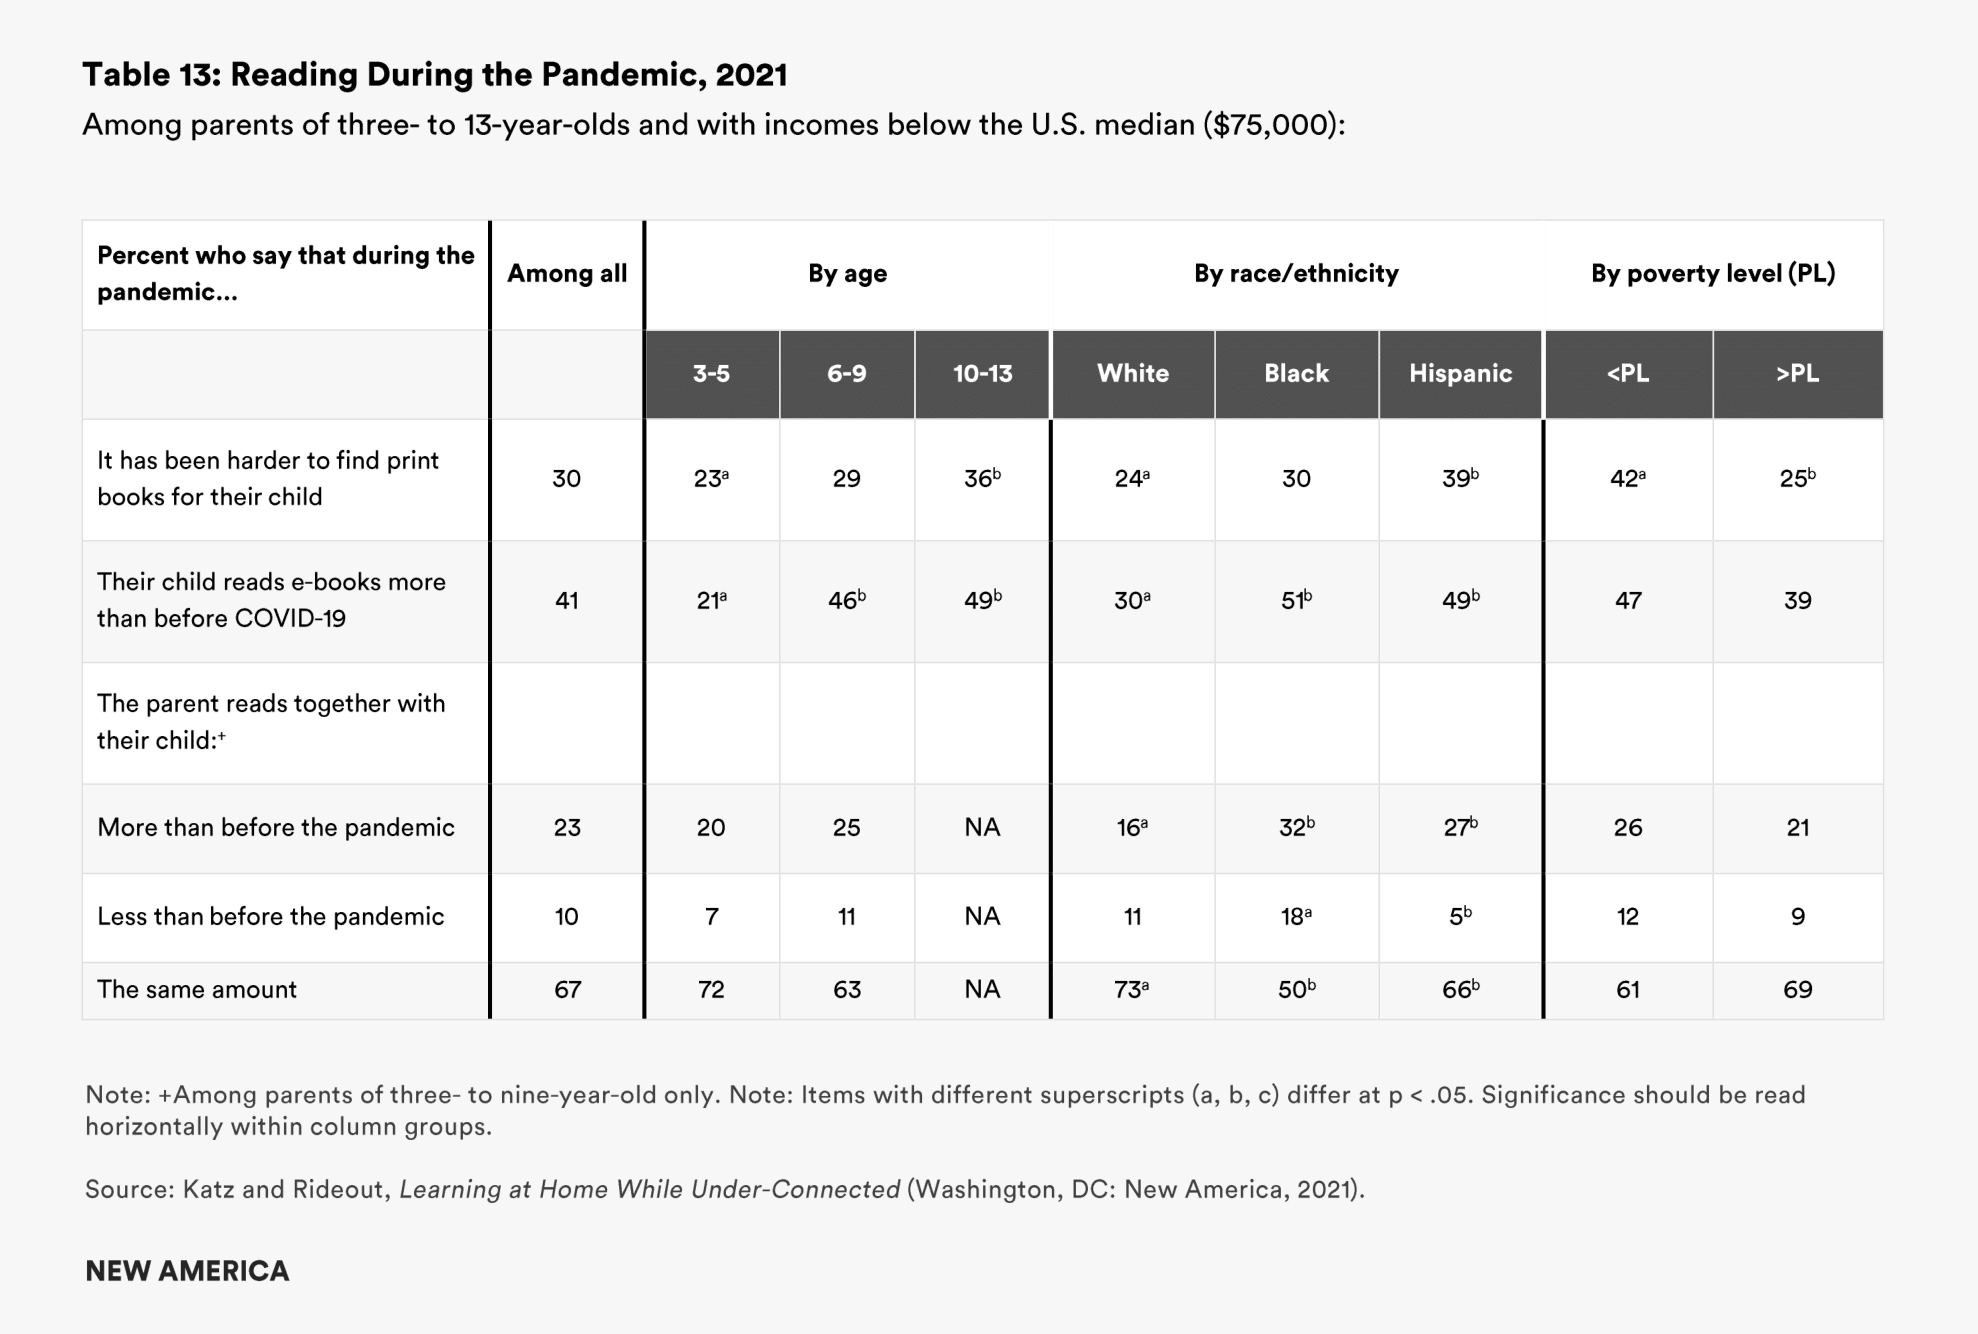
The survey did identify some important shifts in reading practices among lower-income families. Many parents—especially those with below-poverty-level incomes—found it harder to access print books during the pandemic. Overall, 30 percent of parents said they had a harder time getting books for their kids to read during COVID; 42 percent of parents with incomes below the federal poverty level reported this challenge. Constrained access to reading materials also affected children of color disproportionately, with 39 percent of Hispanic parents saying they had a harder time finding books for their children, compared with 24 percent of White parents (Black parents were in between, at 30 percent, not significantly different from either group). There were no significant differences among Hispanic families by immigrant generation.
At the same time, many parents (41 percent) report turning to e-books more often during the pandemic. This pattern is particularly prevalent among children of color: 49 percent of Hispanic and 51 percent of Black children read e-books more now than prior to the pandemic, compared with 30 percent of White children. E-books seem to have been a more attractive alternative to print books for older children: 46 percent of six- to nine-year-olds and 49 percent of 10- to 13-year-olds are reading more e-books since the pandemic began, compared with 21 percent of three- to five-year-olds. This pattern may also reflect some parental resistance to e-books for their youngest children. There were no significant differences in use of e-books between families with incomes below or above the federal poverty line, nor between Hispanics based on immigrant generation (see Table 13).
Overall, a majority of parents (67 percent) say the pandemic has not affected how often they read together with their children (this question was asked of parents of three- to nine-year-olds only, since older children are likely to be reading independently). About one in five parents (23 percent) say they read with their kids more during the pandemic, and 10 percent say they read less.
Black and Hispanic parents were more likely than White parents to say they read with their kids more during the pandemic than they had previously (32 percent of Black parents and 27 percent of Hispanic parents, compared with 16 percent of White parents), suggesting another family asset that educators could use to strengthen home-school connections as schools transition to being fully in-person in the fall. There were no significant differences in family reading practices by poverty level, nor by immigrant generation among Hispanics.
Families Learning with Technology Together
Family members learning with and about technology together may have been especially important during the pandemic, but it is hardly a new phenomenon. Whether parents are guiding children, children are helping parents, or siblings are working together, lower-income family members often enable each other to develop technology-related skills. These collaborative learning experiences are an important family asset.
We first asked these questions about how family members learn with technology in our 2015 survey. In both surveys, we found extensive intra- and inter-generational learning with technology within lower-income families. How consistent these forms of family engagement are clearly shows that this is another family strength that educators should leverage post-pandemic to maintain strong home-school connections.
In the survey, we explored three kinds of co-learning: parents helping children with technology; children helping parents with technology; and siblings learning together with technology and other types of media.
Parents Helping Children with Technology
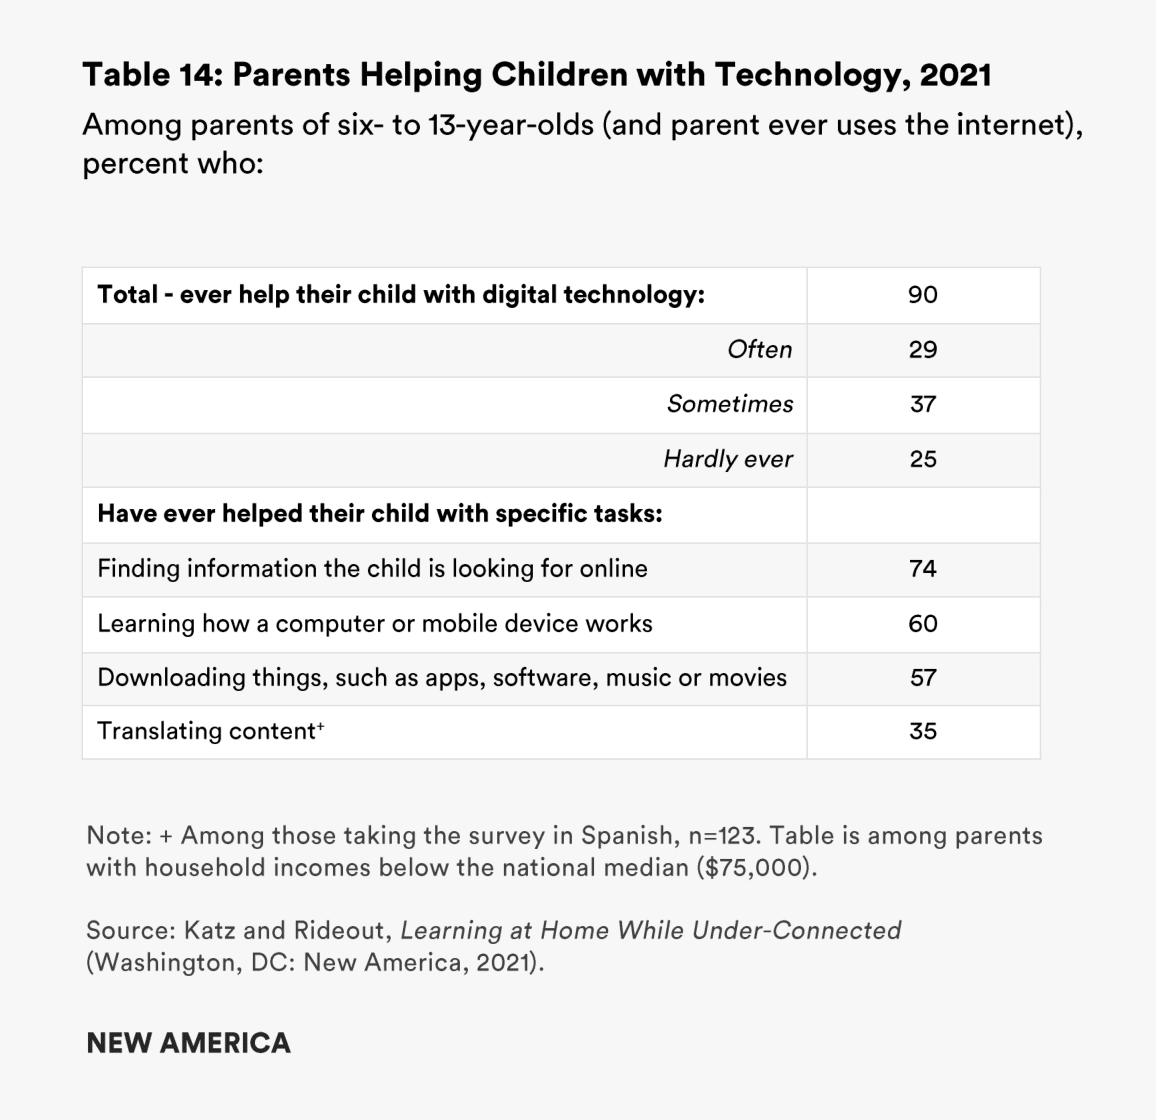
Two in three (66 percent) parents say they often or sometimes help their children (ages six or older) to use computers, tablets, or smartphones, including 29 percent who say they “often” do so. The proportion of parents who “often” help their children with digital devices does not vary substantially by household income, race/ethnicity, or parent education. Not surprisingly, parents are more likely to help their younger children: 37 percent “often” help their six- to nine-year-olds, compared with 21 percent who often help their 10- to 13-year-olds (see Table 14).
To better understand what kinds of tech-related activities children depend on their parents’ guidance to do successfully, we asked about four distinct kinds of tasks: finding information online; learning how computers or mobile devices work; downloading content or tools; and, for those whose primary language is Spanish, translating online content.1 Among parents who took the survey in Spanish (and who ever use the internet, n=123), 35 percent said they have helped their child with translating content from the web. Among all parents, 74 percent have helped their children find information they were looking for online, 60 percent have helped them learn how a computer or mobile device works, and 57 percent have helped them download content such as apps, software, music, or movies.
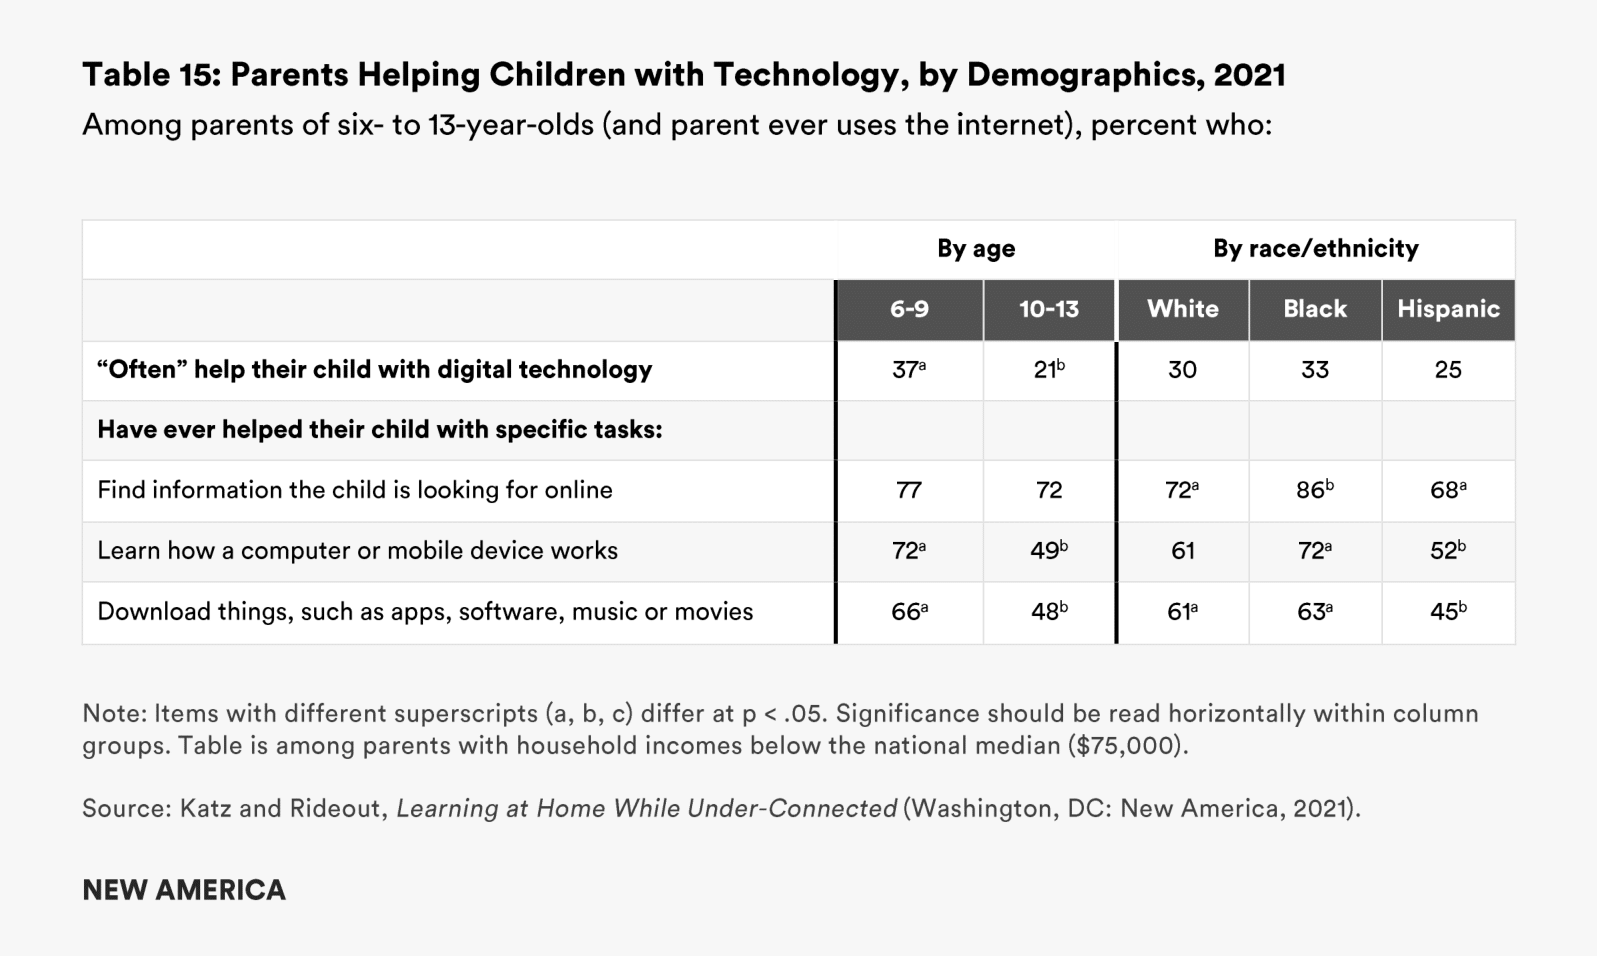
Black parents are more likely to have helped their children with each of these tasks (other than translating content) than White or Hispanic parents (see Table 15). Sample sizes were too small to compare results for translating content by demographic subgroups; comparisons between U.S.-born and immigrant Hispanic parents were not possible for the same reason. There were no differences in whether parents had helped their children with these tasks based on family incomes being below or above the federal poverty line. There was only one statistically significant variation in helping with these tasks based on parent education: those with a college degree were more likely to have helped their children understand how a computer or mobile device works than parents with only some college (72 percent vs. 58 percent).
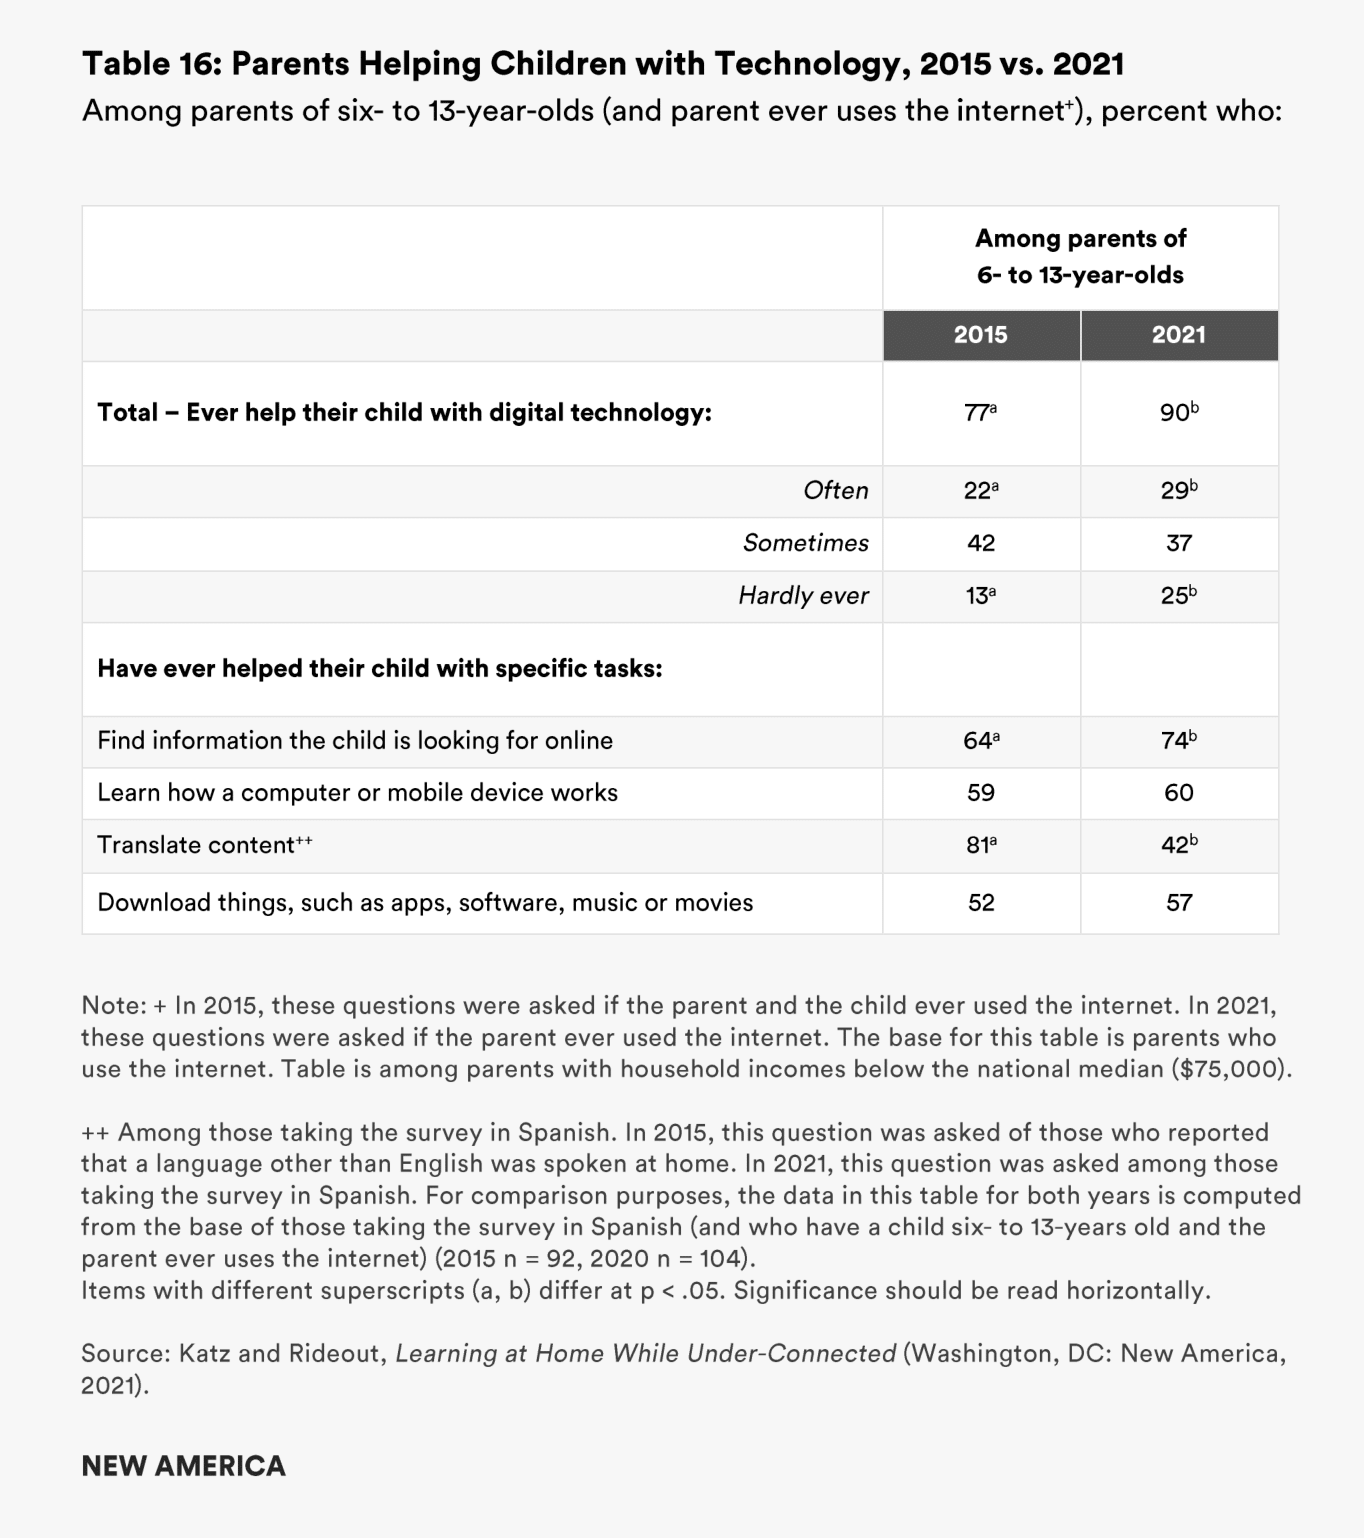
Rates of parental technology guidance have increased modestly over the past six years; nearly three in 10 (29 percent) parents say they “often” help their kids with digital devices, compared with 22 percent in 2015 (see Table 16). Parents are also more likely to help their child find information online (74 percent today, vs. 64 percent in 2015). These changes may be a function of increased reliance on the internet for schoolwork during the pandemic, but likely also reflect more general trends as technology has become more integral to K–12 education over time.
Children Helping Parents with Technology
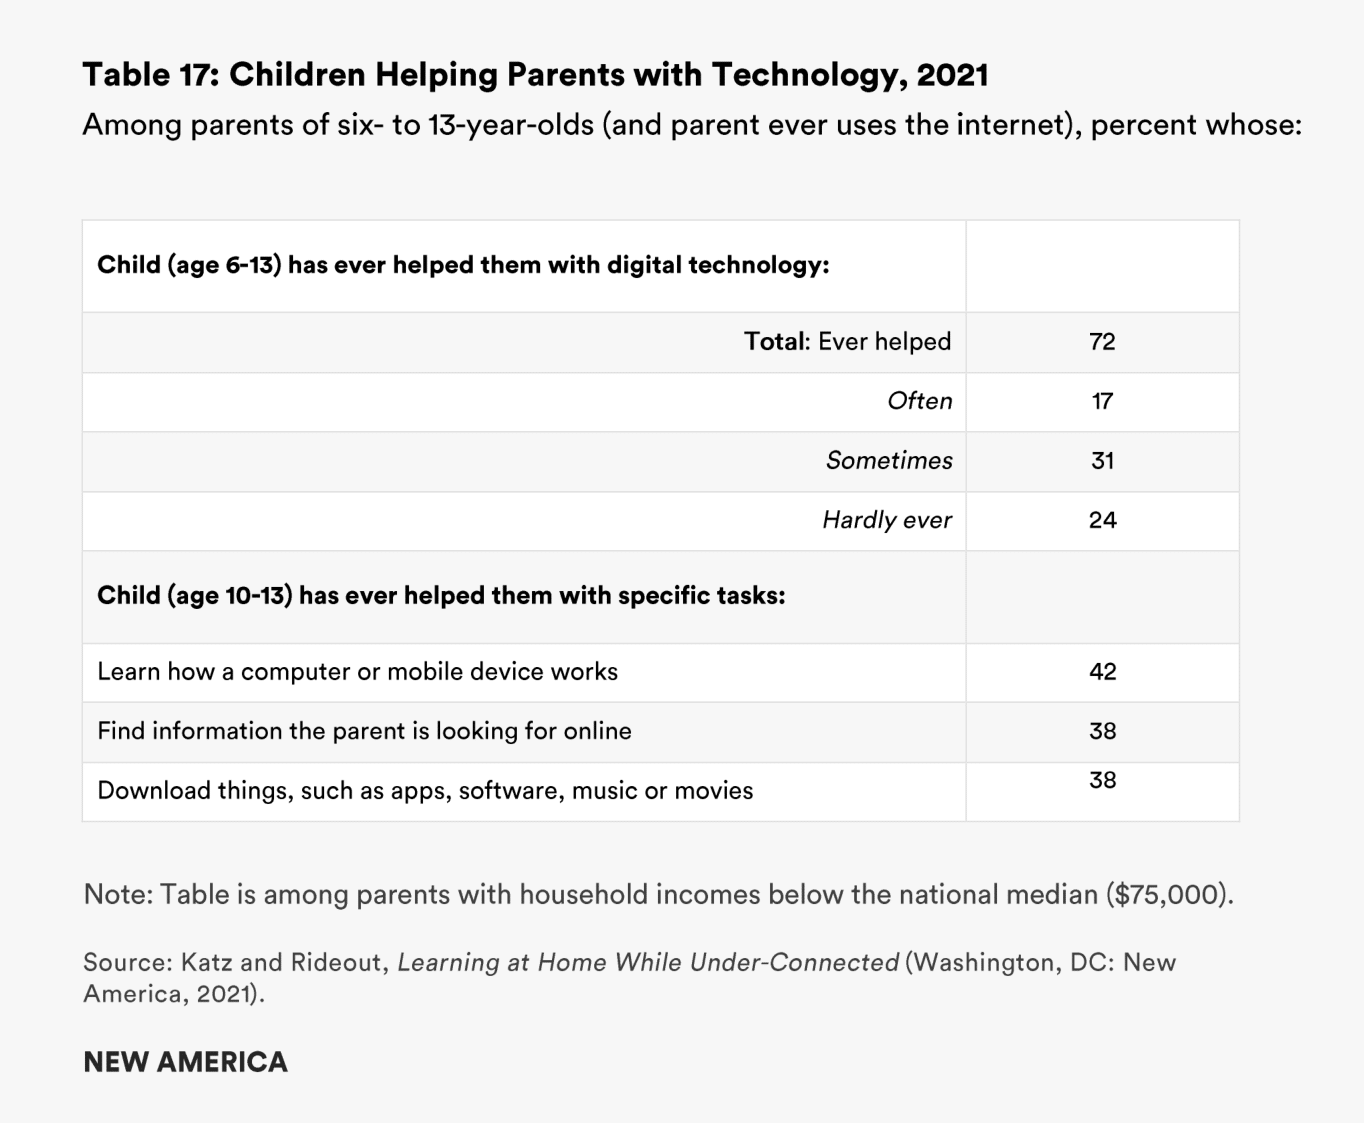
Parents also frequently rely on their children’s help to use technology. About half (48 percent) of all parents with six- to 13-year-olds say their child often (17 percent) or sometimes (31 percent) helps them with devices such as computers, smartphones, or tablets. In families with 10- to 13-year-olds, children help their parents with technology as often as parents help them with technology (21 percent “often” help each other; see Table 17). This finding underscores how fluidly parents and children can exchange expert and learner roles when it comes to technology, benefiting all family members in the process.
Children of color, those living in households with incomes below the federal poverty line, and those with less highly-educated parents are the most likely to help their parents with technology. Sixty percent of Hispanic parents say their six- to 13-year-old often or sometimes helps them, as do 55 percent of Black parents, compared with 38 percent of White parents. Over half (56%) of parents with incomes below the poverty line say their child often or sometimes helps them, compared to 45% of those with incomes above the poverty line (but still below the median income). Two-thirds of parents (65 percent) without a high school diploma say their six- to 13-year-olds often or sometimes help them with technology, compared with 33 percent of parents with a college degree (see Chart 6).
Parents with older children (ages 10 to 13) were asked which specific tasks their children help them with: finding information online; understanding how devices such as computers, tablets, or smartphones work; and downloading content or applications. About four in 10 said their children had helped them with these tasks, ranging from 38 percent to 42 percent.
Parents’ reliance on children’s help with technology varied by family income level. Parents reporting incomes below the federal poverty level were more likely to say that their child had helped them with each technology task. For example, 49 percent said their 10- to 13-year-old child had helped them look for information online, compared with 34 percent of parents reporting incomes above the federal poverty line, but still below the national median (see Table 18).
There are also variations by race, ethnicity, and immigrant generation in terms of the frequency with which children support their parents on specific tasks. For example, more than half of Hispanic children (53 percent) help their parents find information online, compared with 25 percent of White children. And among families headed by Hispanic immigrants, 62 percent said their child had helped them find information online. These sociodemographic patterns are consistent with our 2015 findings: children play crucial roles in facilitating technology engagement in families challenged by financial, educational, and linguistic constraints or some combination of these factors.
The proportion of parents who rely on their children for help with technology has increased substantially since 2015. Some of that increase is certainly an artifact of an extraordinary year, where parents and children had to use technology at home for a much broader range of activities than they had previously. However, there is likely more to glean from this change over time. Since families’ rates of home access to broadband internet and digital devices have increased significantly since 2015 as well, greater parental reliance on children’s assistance likely reflects one or both of the following dynamics: children’s proficiency and familiarity with devices and navigating the internet has increased, thanks to having daily opportunities to use them, and/or more parents are using technology more frequently, for the same reasons. In 2015, 62 percent of 10- to 13-year-olds had helped their parents with digital devices; today, 81 percent have done so (see Table 19).
Siblings Learning and Creating Together
In families with more than one child in the three- to 13-year-old age group, we asked how often siblings engage in various learning activities together. Children helping each other can be an important element of their learning environment; when one child learns something new, it can be passed on to another child. In a year when contact with anyone outside the family home was so constrained, siblings were particularly important learning partners for each other.
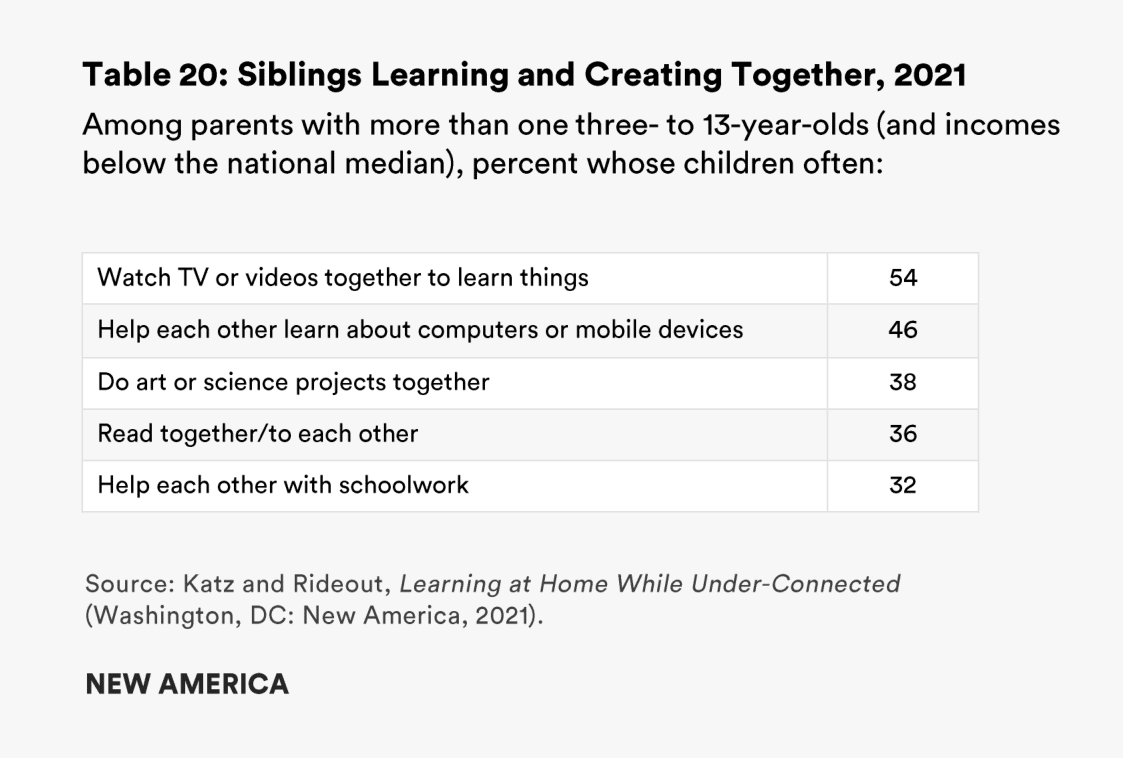
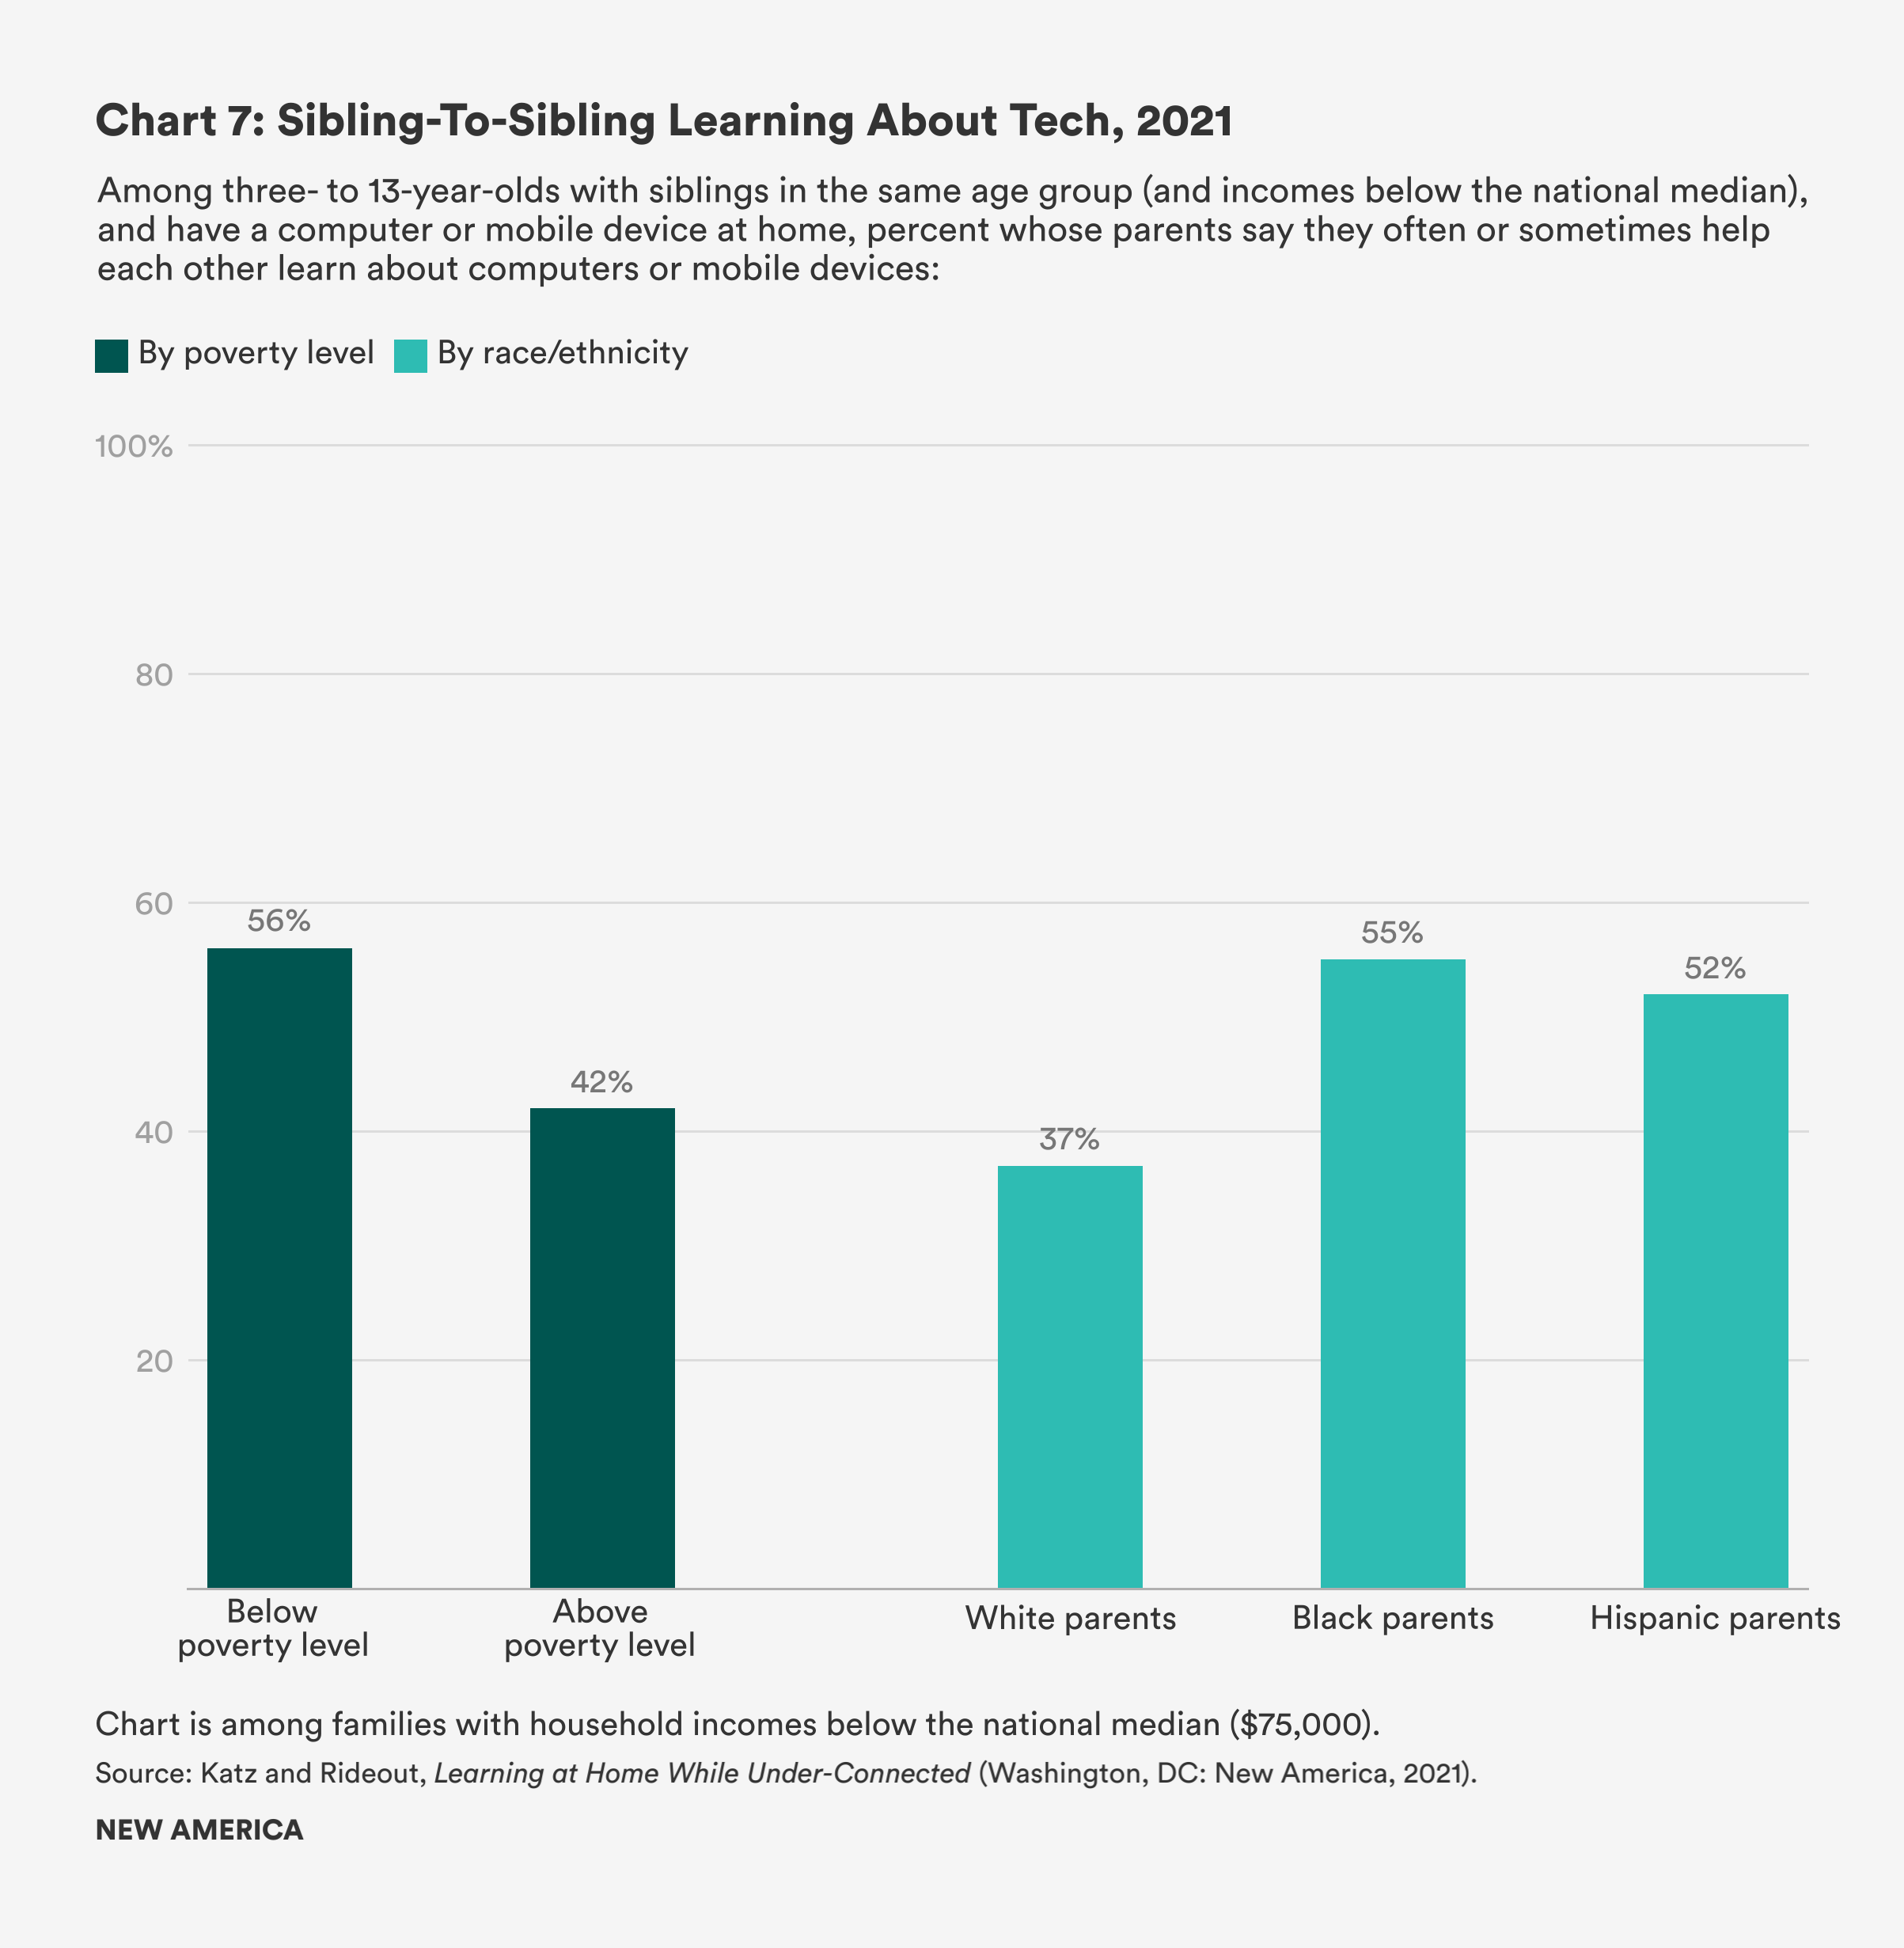
About half of surveyed parents (54 percent) with two or more children ages three- to 13 noted that siblings often or sometimes watch TV shows or videos together to learn things; this aspect of co-viewing is often overlooked in the children’s media literature, which more often focuses on parental co-viewing or co-engagement. Nearly half (47 percent) help each other learn about computers or mobile devices, an aspect of technology engagement where shared knowledge and experience can be especially helpful. And roughly one-third of children with siblings in this age group do art or science projects together (38 percent), read together or to each other (36 percent), and help each other with schoolwork (32 percent; see Table 20).
Siblings’ co-learning activities did not vary across poverty status or race/ethnicity, with one important exception: helping each other learn about technology. Children of color and those from households with incomes below the poverty level are all more likely to engage in shared learning about computers and mobile devices (see Chart 7).
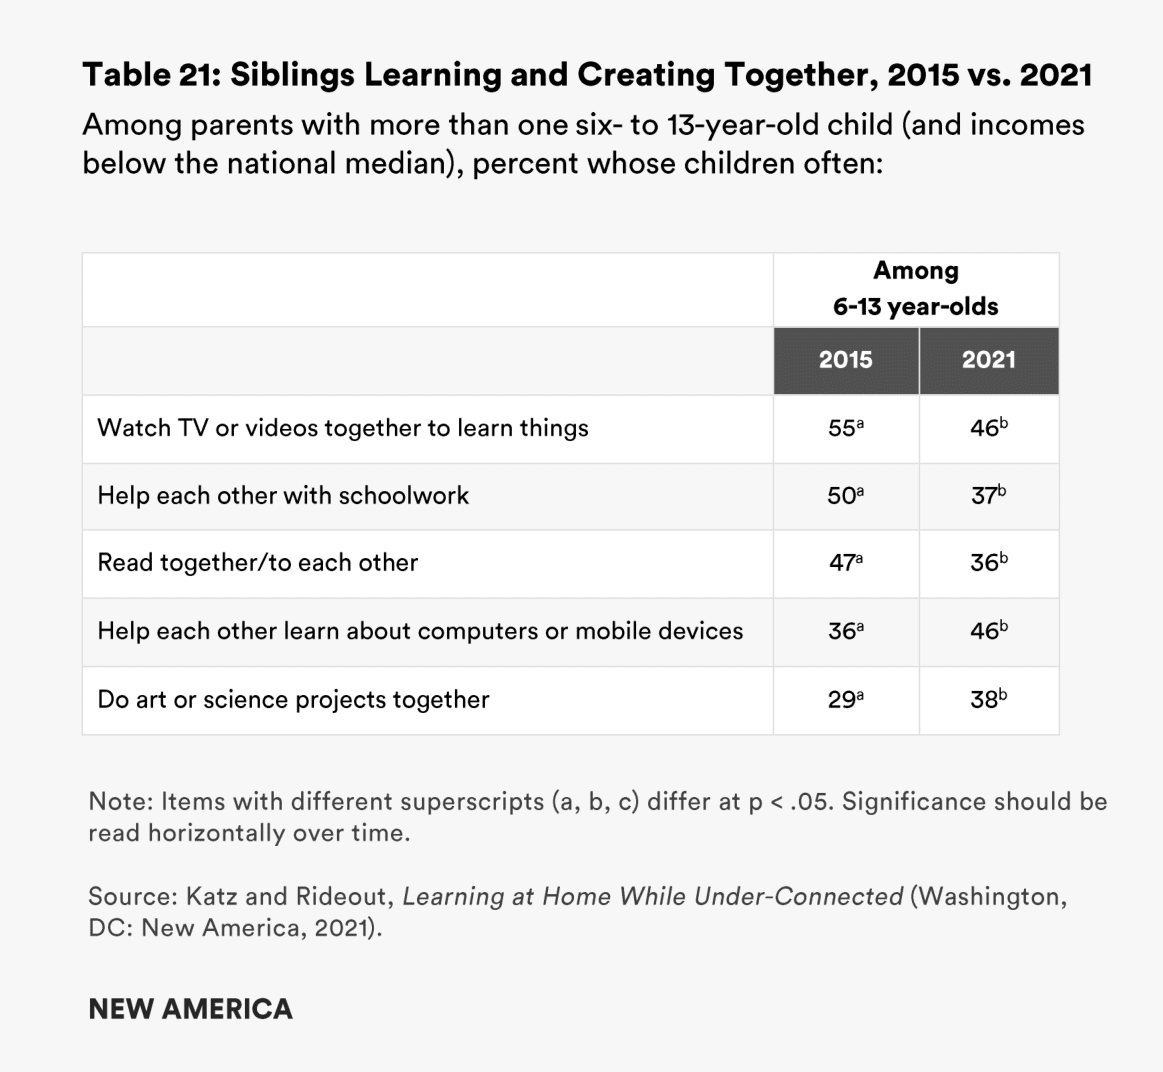
In 2015, we asked these same questions of parents with six- to 13-year-olds, so we can compare the results over time for that age group (see Table 21). Surprisingly, six- to 13-year-old children were less likely to help each other with their schoolwork during the pandemic than they had been during 2015; they were also less likely read together or to watch TV or videos together to learn things. These are all somewhat counterintuitive results, given that kids were more likely to be home together doing schoolwork and to have more time to watch TV or read together than ever before. These findings may reflect parents’ greater involvement in children’s schoolwork, obviating the need for siblings to assist each other. It is also possible that spending less time with educational media together reflects siblings having to share the devices to complete schoolwork, so that technology use was more characterized by device hand-offs than by shared experiences in some households.
On the other hand, siblings are now more likely to help each other learn about computers and other digital devices: 46 percent do so today, compared with 36 percent in 2015. This is not surprising, given that the presence of such devices in the home has expanded substantially. And, encouragingly, children are also more likely to do art or science projects together today (38 percent) than they were six years ago (29 percent).
Citations
- These categories were informed by qualitative interviews with 170 parents and their children (N=336) prior to the 2015 wave of this survey.
Conclusion
Students’ unequal access to broadband and digital devices has concerned policymakers for years, prompting the Obama administration’s ConnectEd initiative in 2013 to connect every classroom to broadband internet. The Federal Communications Commission then brought attention to the “homework gap” between students who do and do not have internet connectivity in their after-school hours.1 The COVID-19 pandemic shifted the focus to what digital access children and families have at home, when schools, libraries, and other community locations that many families depend on for Wi-Fi and computer access suddenly became unavailable.
This report details survey findings about the experiences of lower-income families with preschool and school-aged children during the pandemic, with a look back and a look forward. Parent reflect on a uniquely challenging year, how being under-connected complicated their lives, and what they learned. They also look forward to what their children will need in the months and years to come, as our nation moves beyond the acute phase of the pandemic.
The survey findings raise three calls to action for policymakers, educators, and educational media producers:
#1: The “under-connected” represent millions of families. Policymakers should make them a priority.
To fully diagnose digital inequality, we must do more than ask yes/no questions about access to broadband internet and digital devices. Our analyses comparing 2015 and 2021 survey data show that while access to broadband and computers has increased dramatically—and encouragingly, especially among the families that were least likely to have broadband and computers in 2015—the proportion of families whose internet connections and devices are unreliable or inadequate has hardly changed at all.
Of course, even the basic indicators of access show that much work remains to be done. One in seven families in our 2021 survey still does not have broadband internet access, and one in eight does not have a computer. And when we home in on children ages three to 13 whose family incomes are below the federal poverty level, or children with immigrant Hispanic parents, these challenges are even more pronounced: one in four of these children still lack home broadband access a full year into online learning. The challenge for policymakers, educators, and internet service providers is to reach these young people with affordable, long-term options for broadband connectivity and devices as soon as possible.
But an even tougher challenge awaits: reducing the number of families with school-aged children who are under-connected, because their internet connectivity or digital devices are inadequate or unreliable for the tasks that family members rely on them for. We found that a majority of lower-income families that have home broadband access still experienced service that was too slow or had been interrupted due to unpaid bills in the past 12 months. Likewise, a majority of families with a computer at home said that the computer did not work properly or that there were too many people who needed to use the device for them to have the time on it that they needed.
The consequences of being under-connected were painfully clear in this pandemic year. Our survey finds just how disruptive being under-connected was for being able to consistently participate in remote learning. Data collected by the Pew Research Center over a year ago, in April 2020, showed that lower-income parents felt their students were likely to experience disruptions.2 Our survey shows that those disruptions in fact came to pass. And Pew was not alone in predicting such challenges; in June 2020, a majority of Latino parents surveyed by Abriendo Puertas and Latino Decisions reported that they would need better or more reliable internet to support their children’s remote learning.3 Our findings suggest that not nearly enough of these families received the additional digital resources their children needed.
Now is the time for policymakers to redouble their efforts to ensure broadband and device access for lower-income students and families, by building on the considerable gains that the pandemic necessitated in many school districts and communities. The advent of the Emergency Broadband Benefit program, signed into law in April 2021, and the expansion of E-Rate, a program that provides schools and libraries with deep discounts on their purchase of internet access, are important early steps toward this goal.
But we cannot lose focus on digital equity concerns as the urgency of the pandemic subsides. The Emergency Broadband Benefit, for example, will need to be extended after this year and will not resolve under-connectedness on its own. We need to strengthen local capacity in other ways. When a lower-income family has a computer but cannot afford repairs when it malfunctions, or its internet connection is disrupted by having to prioritize other bills, the family enters a cycle of “dependable instability”4 that our survey reveals to be an enduring form of digital inequality. Resolving these challenges will require partnering with and expanding the capacities of trusted, local organizations and institutions to ensure that families know exactly where to go when they need something fixed or require other forms of digital assistance.
Furthermore, we urgently need more data on who is under-connected, and ongoing efforts that track the progress being made to reduce the number of families who are under-connected. The under-connected measures we use in our survey (located in the appendix of this report) can easily be deployed by other organizations to begin compiling this crucial knowledge base.
#2: Educators and parents partnered to keep children learning during the pandemic. Those gains should not be squandered in the “return to normal.”
The abrupt, national pivot to remote learning in the spring of 2020 required a major shift in who was responsible for ensuring that children could remain engaged in their schoolwork. Traditionally, this role has primarily been assumed by teachers. When school buildings shut, teachers had to coordinate those responsibilities with parents and other caregivers. The struggles of refining these interdependent roles were enormous for parents and teachers alike. But the shift also meant that new forms of partnership became essential to success, and we believe those hard-won gains are worth building on.
A majority of surveyed parents feel that they know their child’s learning strengths and weaknesses better than they did before the pandemic, in addition to being more familiar with the academic content their children are covering. Educators and school leaders can nurture these gains in the months ahead, when primary responsibility for guiding formal learning returns once more to teachers.
We also found that almost half of parents felt more comfortable communicating with teachers and guiding their children’s homework than they did prior to the pandemic. While this is great news, these finding suggest there is still room for educators to shore up the strong home-school bonds that serve children so well.
Educators will have an immediate opportunity to treat parents like partners: by showing that they share parents’ priorities for their children at the start of the coming school year.
Surveyed parents are most concerned about their children’s social and emotional well-being in the anticipated full return to in-person school nationwide in fall of 2021. Parents want educators to make sure their children have plenty of opportunities to build strong bonds with their peers, whether on the playground or by working together on projects, and that they can develop trusting relationships with their teachers.
While making sure their children are on track academically is important to parents as well, if educators focus on high-dose tutoring and other academic acceleration initiatives without clearly communicating that children’s social and emotional learning are also major priorities, they risk alienating parents instead of deepening their connections to them.
#3: The pandemic year blended formal and informal learning in new ways. Further innovation can enhance families’ learning landscapes in the years ahead.
The necessities of social distancing collapsed boundaries between places and activities that family members had previously done separately and brought them all together, at home. Time at school was transformed into remote learning; play dates with friends went virtual; and for many parents, their work came home as well.
Family members rely on each other and learn together, whether during a pandemic or in less extraordinary circumstances. Our findings show that parents and children frequently helped each other learn about technology in 2015, and that such help is even more prevalent today. Siblings are also helping each other learn with technology more in 2021 than they did in 2015. In Opportunity for All?, which reported our 2015 survey findings, we noted that lower-income families’ digital teamwork was an asset that educators could build on to strengthen learning practices at home. In the wake of the pandemic, we make that same recommendation with renewed vigor.
We also find that educational TV, videos, and games have been important sources of support for parents this year. Parents reported that educational media helped to keep their children learning and growing this year, and the lowest-income families and families of color most of all. Over a third of parents also reported that educational media have been an important resource for explaining the pandemic to their children.
The challenge going forward, as media consumption patterns shift towards pre-pandemic levels, is to ensure that families continue to have access to high-quality offerings that are evidence-based and informed by developmentally appropriate design. Some educational media providers shifted their marketing and fee structures to better reach and serve low- and moderate-income families during the pandemic. They should continue to do so for the foreseeable future to help children and families recover.
Finally, the pandemic affected reading practices in many families by, for example, increasing reliance on e-books, especially for older children. This provides an opportunity for schools and community-based organizations to support literacy efforts in new ways—by distributing books not only through lending and donations, but also via their websites and partnerships with public libraries that provide e-book lending programs. The result would be multiple pathways for children and parents to gain access to reading materials, in print and digital formats.
The pandemic required fast, and sometimes temporary, fixes to adjust to the realities of remote learning. Now we must build on the gains that were borne of necessity. Policymakers, educators, tech providers, libraries, media companies, and parents will all be crucial to how we reimagine digital access and educational opportunity for children as the nation moves beyond the acute stage of the pandemic. We hope these survey findings will help inform and guide such efforts over this crucial transitional summer and for years to come.
Citations
- Federal Communications Commission Acting Chairwoman Jessica Rosenworcel coined the term “homework gap” to describe the inequities resulting from students not having internet access in their after-school hours. Alyson Klein (March 10, 2021), “Acting FCC Chair: The ‘Homework Gap’ Is an ‘Especially Cruel’ Reality During the Pandemic,” Education Week, source
- Emily A. Vogels, “59% of U.S. parents with Lower Incomes Say Their Child May Face Digital Obstacles in Schoolwork,” Pew Research Center, September 10, 2020, source and Emily A. Vogels, Andrew Perrin, Lee Rainie, and Monica Anderson, “53% of Americans Say the Internet Has Been Essential During the COVID-19 Outbreak,” Pew Research Center, April 30, 2020, source
- Gabriel R. Sanchez, Betzaira Mayorga-Calleros, and Adrian Pedroza, “Latino Parent Voices: What Our Families Need Now,” Abriendo Puertas, 2020, source
- Amy Gonzales, “The Contemporary US Digital Divide: From Initial Access to Technology Maintenance,” Information, Communication, and Society 19, no. 2 (2016): 234–248, doi:10.1080/1369118X.2015.1050438
Methodology
This report is based on the findings of a nationally-representative, probability-based telephone survey of 1,010 parents raising children ages three to 13 and reporting total household incomes below $75,000, the U.S. national median for households with minor children.1 Throughout the report, we sometimes refer to this population as “families,” “parents,” or “children” for shorthand. Unless otherwise specified, we are referring to families with children in the three- to 13-year-old age range and incomes below the national median.
The survey was conducted from March 10 to April 18, 2021, approximately one year into the COVID-19 pandemic in the U.S. It was fielded by the research firm SSRS and was offered in English or Spanish. A total of 176 respondents took the survey in Spanish. Institutional Review Board approval for the study was granted by Rutgers University. The average time to complete the survey was 20 minutes. A copy of the full questionnaire is included in the appendix to this report.
There are two aspects of our research design that distinguish this study from the many that have been conducted on U.S. families’ experiences during the pandemic.
First, we focus explicitly on families with incomes below the national median. This approach enables us to identify essential variations between lower-income families, because we have sub-samples of sufficient size to compare families’ experiences by, for example, parents’ education level; rural, suburban, or urban communities; or immigrant generation among Hispanics.
Second, other surveys on the effects of remote learning and the COVID-19 pandemic on students and families have used online panels. By contrast, we contacted parents by cellular and landline telephone. An investigation of digital inequality and its effects is inherently more inclusive when study participation does not require using those same technologies.
Sampling. To efficiently and effectively reach the low-to-moderate income parent population that met the study criteria, the sample plan consisted of two elements:
- First, respondents were pre-identified via the SSRS weekly Omnibus telephone survey as being in the specified income range and having a child at home in the specified age range (n=884). The SSRS Omnibus telephone survey is conducted weekly and uses a fully replicated, single-stage, random-digit-dialing (RDD) sample of landline telephone households and randomly generated cell phone numbers. The SSRS Omnibus completes more than 50,000 surveys annually, with 70 percent cellular telephone allocation.
- Second, eligible respondents reached and screened via the SSRS Opinion Panel, a probability-based multi-mode panel (n=126). All internet respondents are recruited to take web surveys while non-internet/web reluctant respondents can participate via phone. For this study, we invited eligible Opinion Panel respondents to take part in the survey by telephone only. Opinion panel members are recruited randomly based on nationally representative ABS (address based sample) design.
A modest over-sample of Black parents was conducted to achieve a total sample size of 200, and responses were then weighted down to their naturally occurring level. All respondents were offered a $10 incentive for participation.
Demographic variables. Data were analyzed by various demographic categories, including child age, household income, parent education, geographic location, parent race/ethnicity, and, among Hispanic parents, whether they were U.S.- or foreign-born. According to the U.S. Census Bureau, among parents with below-median incomes and three- to 13-year-old children, 44 percent are White non-Hispanic, 32 percent are Hispanic (20 percent foreign-born and 12 percent U.S.-born), 17 percent are Black, 5 percent are Asian-Pacific Islander, and 3 percent are other or mixed race/ethnicity.2 With a sample size of just over 1,000 respondents, we are able to report findings by race/ethnicity for families with White, Hispanic, or Black parents, but the number of respondents in other ethnic groups, such as Asian-Pacific Islanders or Native Americans, are too small to be able to analyze them separately. Throughout the report, the term “Hispanic” is used for consistency with our 2015 report and with Census Bureau terminology.
Weighting. Data were weighted to represent parents of children ages three to 13 with an annual household income less than $75,000. The data were weighted by first applying a base weight and then balancing the demographic profile of the sample to target population parameters for each racial group (White/Other race non-Hispanic; Black non-Hispanic; Hispanic). In addition, the data were weighted to account for systematic non-response along known population parameters that are generally present in surveys.
Margin of error. The total sample design effect for this survey is 1.71. Accounting for sample size and design effect, the margin of error for the entire sample is ±4.0 percentage points at a 95 percent confidence level.
Response rate. The response rate for this survey was calculated using AAPOR’s Response Rate 3 formula. This calculation divides the number of completed interviews in each sampling frame by the estimated number of eligible phone numbers in the frame. For the Omnibus prescreened sample, response rate was calculated to be 19 percent. For the Probability Panel sample, response rate was calculated to be 53 percent. Combined, the response rate was 20 percent.
Poverty level. Poverty level was calculated based on families’ annual income and number of household members, using federal poverty guidelines.3 Because the survey recorded family income in $5,000 increments, there were 42 respondents for whom we were unable to determine poverty level status; these respondents were excluded from the analyses that differentiated by poverty level.
Trend data. A first wave of this survey was conducted in 2015, and some of the findings in this report track findings from the 2015 survey. The full set of findings from that survey can be found in the report Opportunity For All? Technology and Learning in Lower-Income Families, released by the Joan Ganz Cooney Center at Sesame Workshop in February 2016. That survey was also conducted by SSRS, and the report was authored by the same team authoring this report. The 2015 survey included 1,191 parents of children ages six to 13, with incomes below the then-national median of approximately $65,000 year. The 2021 survey was expanded to include parents of children ages three to 13, with incomes below the current national median of approximately $75,000. In tables comparing findings over time, only parents with children in comparable age groups are included, by limiting 2021 findings to parents with children age six or older (n=799).
Statistical significance. Where relevant, differences over time or between demographic groups have been tested for statistical significance. Unless otherwise noted, findings are referred to in the text in a comparative manner (e.g., “more than,” “less than”) only if the differences are statistically significant at the level of p < .05 (i.e., differences as great as those noted would occur by chance no more than five times in 100).
In tables where statistical significance has been tested, superscripts are used to indicate where results differ at p < .05. Items that share a common superscript, or that have no superscript, do not differ significantly. For example, in Row 1 below, none of the findings differ in a statistically reliable way. In Row 2, each item differs from the others significantly. In Row 3, the data point in Column 2 differs from those in Column 1 and Column 3, but Columns 1 and 3 do not differ from one another significantly. And in Row 4, Columns 1 and 3 differ from each other, but not from Column 2.
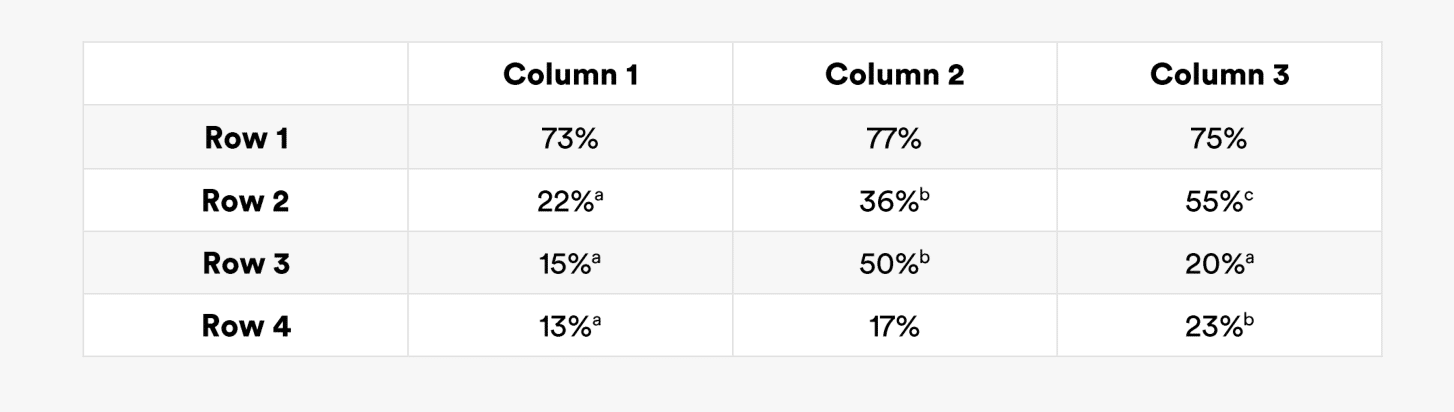
Parent quotes. All statistical results presented in the report are from the national survey. Throughout the report, we use quotes from parents to illustrate or amplify certain findings. These quotes come from one of two places: open-ended question items in the national survey or focus groups with a separate sample of parents that were conducted in conjunction with the national survey.
Open-ended responses. The survey included both closed- and open-ended questions. A closed question is one in which the respondent chooses from a set of pre-established responses that are read to him or her by the interviewer, such as “yes” or “no,” or “often,” “sometimes,” “hardly ever,” or “never.” An open-ended question is one in which the respondent answers in his or her own words, which are transcribed by the interviewer. This survey included two main types of open-ended responses: parents were asked to name specific educational apps, websites, TV shows, or videos that have been helpful to them during the pandemic; and parents were asked if they have any other important priorities for their child at school next year, beyond those already asked about in the survey. Open-ended responses about priorities for the coming school year were analyzed thematically, and direct quotations representative of broader patterns in those data are presented in the report. Examples of helpful educational media were coded by title, platform, and subject matter focus.
Focus groups. One-hour discussions on Zoom with eight groups of lower-income parents and grandparent caregivers of children ages three to six (34 adults in total) were conducted in three communities between April 12 and 22, 2021. Participants were recruited by local affiliates of Raising a Reader, a national nonprofit early literacy organization that serves low-income families. These local affiliates are Reading Ready Pittsburgh, Brilliant Detroit, and two organizations that serve families in Santa Clara County: Grail Family Services and First 5 California. Interested participants were asked to complete a short online survey to determine if they met the inclusion criteria of having young children and an annual household income below $75,000. The survey also gathered families’ sociodemographic data and information about their access to the internet and digital devices. Participants received $50 gift cards to retailers such as Target to compensate them for their time. Four discussions were conducted entirely in Spanish (two in Detroit and two in Santa Clara County), and transcripts of the conversations were translated to English for analysis.
Focus group questions reflected the core themes in the telephone survey but allowed for open-ended discussions of families’ decision-making and experiences. Representative quotes are included in this report, and briefs for each of the three communities are published separately and available here.
Credits. Victoria Rideout developed a first draft of this report, including charts, tables, and analyses. Data analyses of the quantitative survey findings were conducted by Melissa Saphir of Saphir Research. Open-ended survey questions, in which parents were asked to provide examples of media content, were coded by Anna Kimura and Remi Torres, graduate students at the University of California, Los Angeles, under the direction of Makeda Mays Green of Nickelodeon. Open-ended survey responses concerning parents’ priorities for the next school year were coded by Vikki Katz. Focus groups were conducted by Laura Zimmerman, with assistance in facilitating Spanish-language groups from Coral Arrua and Sebastian Gonzalez de Leon. Sabrina Detlef copyedited the report and Fabio Murgia oversaw graphics and design.
Citations
- U.S. Department of Housing and Urban Development, Notice PDR-2020-1, issued April 1, 2020, “Estimated Median Family Incomes for Fiscal Year 2020.” The median national income for families in the U.S. in 2020 was $78,500. Because the survey captured family income in $5,000 increments, families were included if their annual income was below $75,000/year.
- Steven Ruggles, Sarah Flood, Ronald Goeken, Josiah Grover, Erin Meyer, Jose Pacas, and Matthew Sobek, IPUMS USA: Version 10.0 [dataset]. Minneapolis, MN: IPUMS, 2020, source
- source. Federal poverty guidelines are issued by the U.S. Department of Health and Human Services and used to determine eligibility for federal programs. They are sometimes referred to as the “federal poverty level.” The poverty guideline for a family of four in 2021 is $26,500.
Appendix–Questionnaire
More About the Authors

Victoria Rideout
President VJR Consulting

Vikki Katz
Associate Professor, Rutgers University