
Table of Contents
- Executive Summary
- Introduction
- Why Do We Have Primaries?
- How Should We Think about Primary Reform?
- Are Primaries a Problem?
- Can Primary Reform Change Who Votes, Runs, and Wins?
- Why Hasn't the Top-Two Primary Been More Transformative?
- Additional Original Analysis
- Implications for Top-Four/Five Voting
- Recommendations for Future Research
- Conclusions
Additional Original Analysis
Since some of the studies are incomplete or in need of updating, I add my own original analysis of the effects of primary type on delegation. Like the vast majority of other studies, I find that primary type has minimal effects.
If primary type matters, we should expect to see differences in the voting scores of members across primary type. And if closed primaries are the problem, we should expect to see the most extreme members emerging out of closed primaries.
Instead, we see the opposite in Figure 7, which shows the ideology of members in the 116th Congress by the primary type under which they were elected.
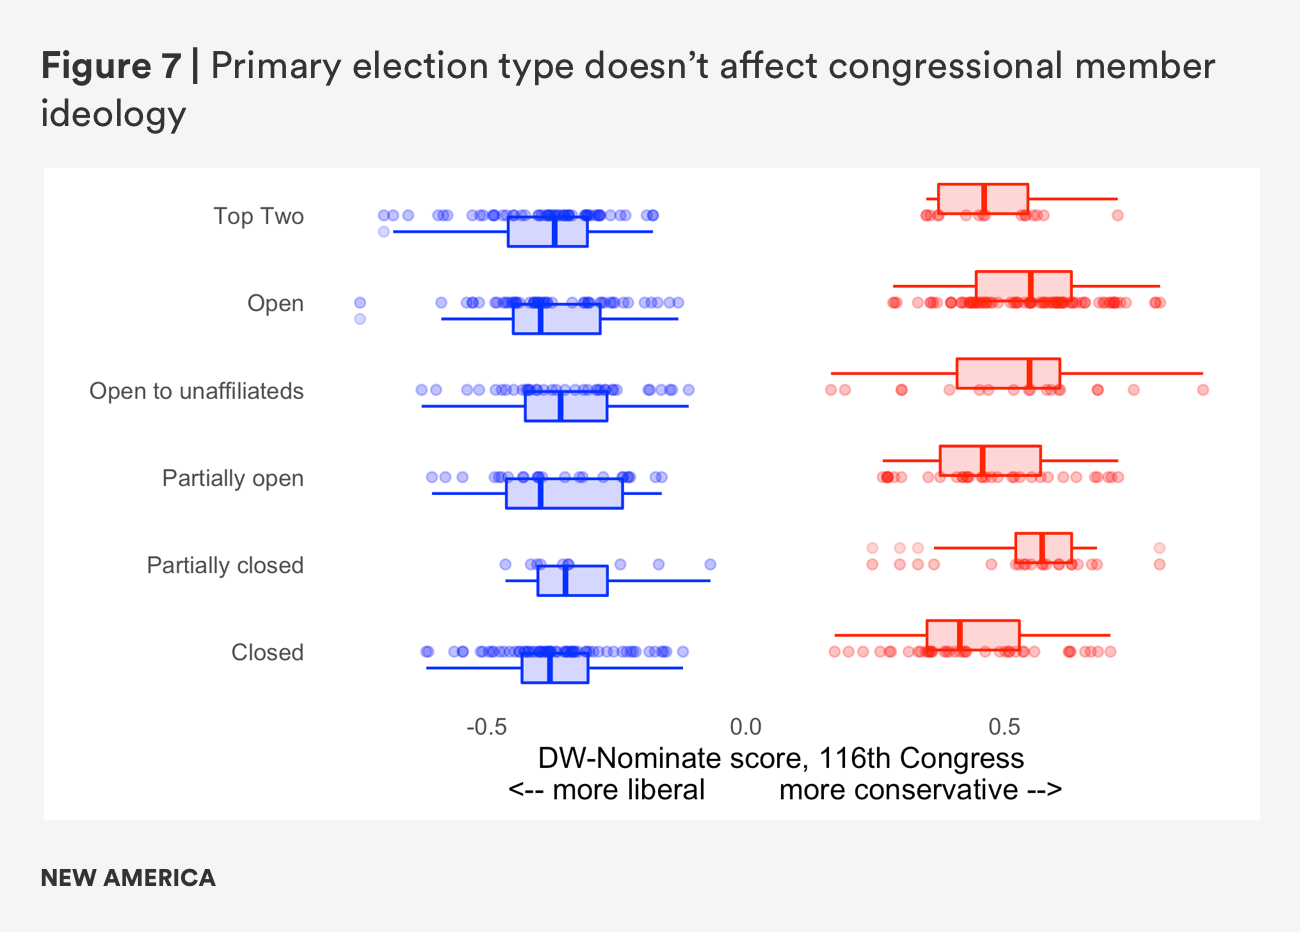
Figure 7 is a box-and-whiskers plot. The shaded box covers half of the observations, and the line in the middle of the box shows the median of the distribution. Among Democrats, the primary type seems to have absolutely no effect on the underlying voting ideology of the members elected under that type of primary.
Among Republicans, a slightly more interesting pattern emerges. Closed primaries tend to elect more moderate members; open primaries elect more extreme members. This is the opposite of what the entire open primaries movement argues.
However, one might be skeptical of these results, because they do not take into account the partisanship of the underlying district. Figure 8 takes this into account by plotting the member’s DW-NOMINATE (dynamic, weighted NOMINATE) score on the Y-axis and Trump’s 2020 vote share in the district on the X-axis.
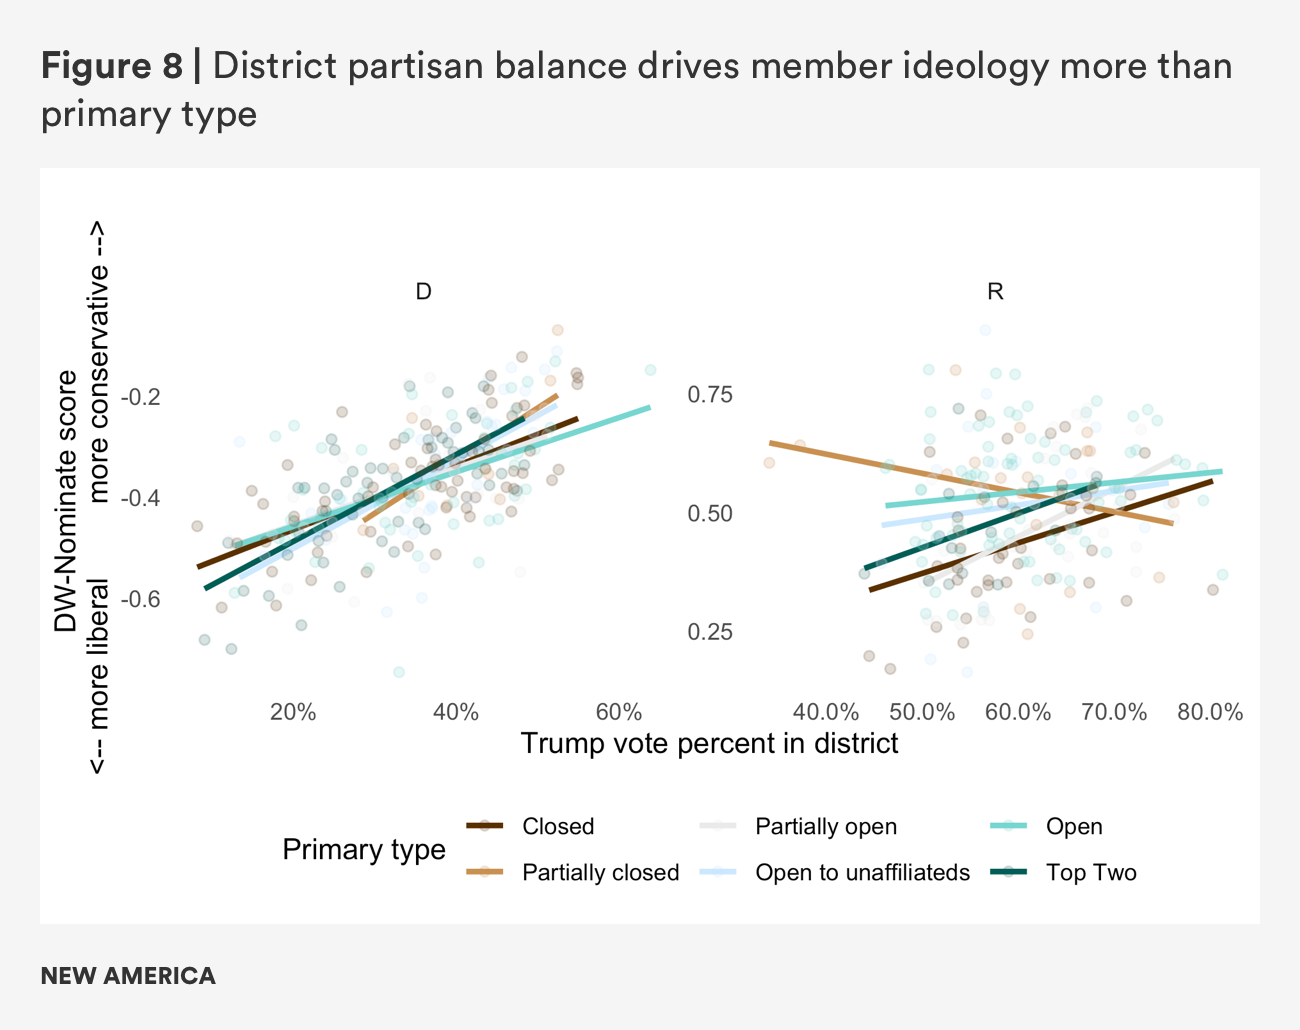
Here we see that Trump’s vote share in the district correlates with member ideology, especially among Democrats. Put another way, the safest Democratic districts elect the most liberal members of Congress. This is hardly surprising as many of those districts are in large urban areas. The relationship is less clear among Republicans, though still in the same direction. There is a little more variation by primary type. Here it is notable that the sharpest slope (strongest correlation) exists among closed primaries.
Why is this so? Perhaps in more competitive districts, closed primaries may be a way for party leaders to use their influence to steer voters toward more moderate candidates, who would be more likely to win, whereas in open primaries, there are fewer voters who care what party leaders think. It is also possible that many independent Republicans register as independents because they think the Republican Party is not conservative enough—more so than Democrats register as independents on the belief Democrats are insufficiently liberal. This could explain the pronounced gap between open and closed primaries in closer districts, but the shrinking gap as districts become safer. Both of these hypotheses are worth further investigation.
Finally, I estimate the effects of different primary rules, controlling for district partisanship. Figure 9 reports the coefficients from two regressions, one explaining ideological extremism scores among Democrats, the other explaining extremism scores among Republicans. (Extremism is the absolute value of DW-NOMINATE scores.) The omitted category for primary type is “closed” so every other category should be compared to that baseline.
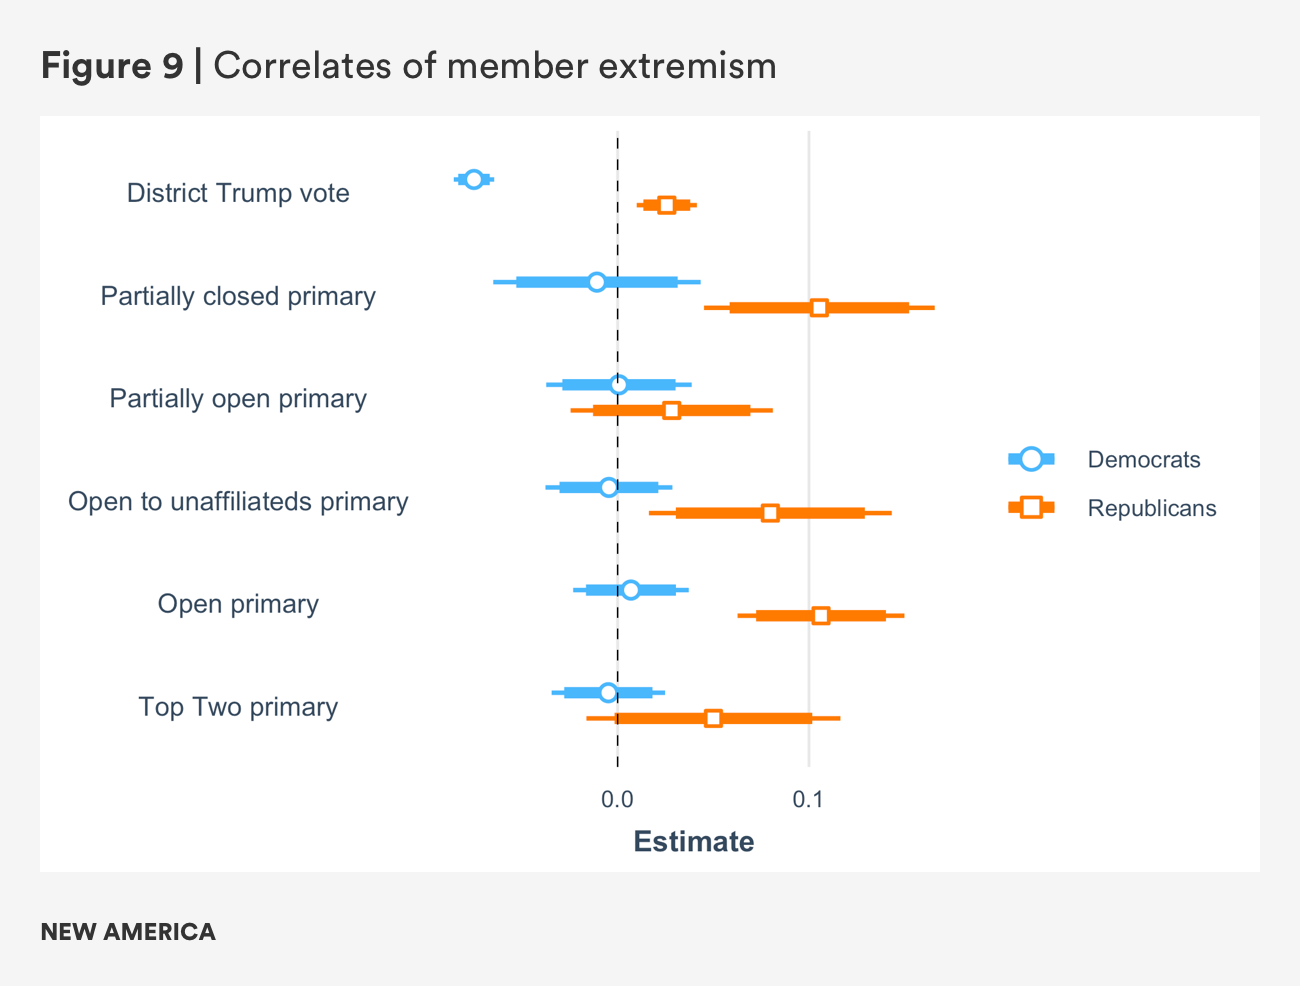
A few significant points emerge from this presentation of the relationships. First, as has been consistent throughout this analysis, among Democrats, primary type makes no difference in member ideology. Regardless of primary type, the only factor that explains member liberalism in this model is district partisanship, with safer districts sending more liberal members to Congress on average.
Among Republicans, more Trump-like districts send more conservative members to Congress, as expected, though the effect is not as large. Intriguingly, the effect of open primaries is to elect significantly more conservative members to Congress as compared to closed primaries. This is consistent with the Sides et al. finding that the most ideologically extreme subgroup across the 2008-2014 cycles was Republican candidate supporters who voted in open primaries. More broadly, compared to closed primaries, every other primary type is associated with more conservative members of Congress. Again, this runs contrary to the expectations.
But this looks at a single Congress. How much of this is consistent across multiple Congresses? To assess this, I grouped Democrats and Republicans separately by primary type, and took the average NOMINATE score across each delegation for the past five Congresses (to keep districting boundaries mostly consistent). The results suggest that there was nothing unique about the 116th Congress. The differences in primary type are consistent across multiple Congresses.
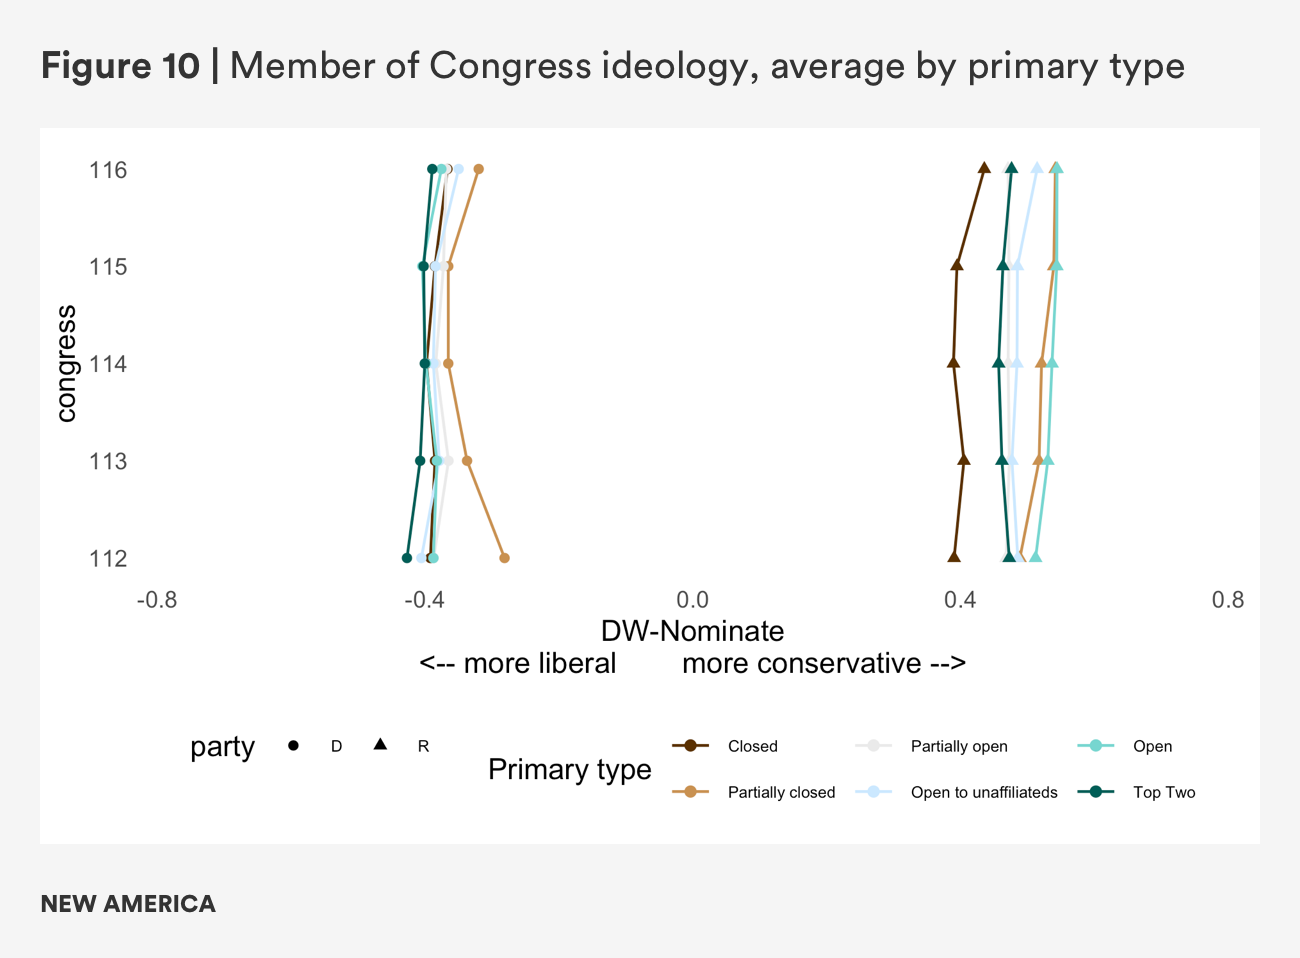
The takeaway from this analysis is simple: nothing in the data for the last Congress or the last decade suggests that primary type matters when it comes to member ideology. Contrary to expectations, open primaries consistently elect, on average, more extreme Republicans than closed primaries do. In fact, closed primaries consistently elect more moderate Republicans than open primaries. Meanwhile, the top-two primary has not moved the needle very much at all.
The other key takeaway from Figure 10 is that the difference between the parties is orders of magnitude larger than the differences among partisans by primary type. In other words, even if one took away from the above graphic that the key to making Republicans more moderate was to enact closed primaries everywhere, Republicans and Democrats in Congress would remain extremely far apart.