The Voting Experience
Considerable research has tried to measure the burden of RCV on voters—specifically, the difficulty involved in switching from a single-mark to a multi-vote, preferential ballot. Many studies also aim to tease out who is most likely to struggle with that adjustment. Others focus on comparative error rates, common RCV error types and groups most likely to commit errors, and/or what types of interventions are most effective at reducing error and ballot spoilage.
These studies can illuminate pain points in ballot design and inform voter education efforts in jurisdictions that use RCV or plan to in the future. They can also be exploited by people who oppose reform implicitly, who will cherry-pick findings to lend academic authority to their preconceived claims that RCV is overly confusing and bound to exacerbate historical inequities in ballot access. By and large, these claims are not supported by existing research.
Claim 1: Voters Can Understand RCV
Conclusion: Supported
There are two main ways to approach the question of whether voters understand RCV. First, we can ask voters directly. Second, we can let the results speak for themselves: post-election ballot analyses and election experiments can tell us a lot about how voters use (or don’t use, or misuse) their rankings. Neither approach is sufficient alone. Measuring understanding among specific groups is limited by the secret ballot rule, that is, the inability to link ballots to actual voters. There is always the risk that some survey respondents cast incomplete or invalid ballots and then report having had a good understanding of RCV. An experimental setting can overcome that challenge, but laboratory conditions may miss important real-world factors, such as media and peer effects.
Survey data consistently show that voters are perfectly capable of ranking. The overwhelming majority of voters experiencing a ranked-choice voting election, even for the first time, say they understand how it works.
For example, in 2004, San Francisco implemented single-winner RCV for the first time, marking the beginning of the modern U.S. wave of RCV. That election, San Francisco voters reported high levels of understanding of RCV. Researchers Francis Neely, Lisel Blash, and Corey Cook found 86 percent of polling place voters surveyed said they understood RCV "fairly well" or "perfectly well."1 By the next cycle, they found, that figure grew to 87 percent.2 Similarly, when Minneapolis introduced RCV in 2009, 90 percent of survey respondents reported that they understood RCV rules "perfectly well" or "fairly well."3 And according to exit polls from New York City’s first RCV elections in 2021, 96.5 percent of participants expressed understanding RCV at least somewhat well, if not very or extremely well, and 79 percent expressed understanding RCV extremely or very well.4
Looking beyond single-city surveys, a 2017 article by Sarah John and Andrew Douglas reported results of 2013 and 2014 surveys comparing voter experiences in RCV and non-RCV cities. In the 2013 survey, 90 percent of respondents in RCV cities found the RCV ballot easy to understand. Interestingly, in the 2014 survey, more respondents in California (49 percent) in RCV cities reported understanding RCV extremely or very well than reported understanding the top-two primary extremely or very well (40 percent).5 A 2020 survey of likely Democratic primary voters also found a large majority of respondents found ranking to be easy.6
Multiple surveys on cumulative voting (which, like RCV, is a preferential method that asks voters to mark multiple candidates) since the early 1990s likewise found that voters of all backgrounds report high levels of understanding of that voting system.7
However, RCV tends to lag single-mark plurality in self-reported understanding and ease-of-use. Researchers Donovan, Tolbert, and Gracey found that voters in plurality cities (73 percent) are somewhat more likely to report that the voting instructions are “very easy” to understand compared to voters in RCV cities (61 percent). When asked to describe their level of understanding of RCV, 12.9 percent of respondents answered “not at all well,” compared to just 9.8 for plurality. Some of this, no doubt, is due to familiarity. Thus, we expect that with repeated usage, understanding of ranked-choice voting will increase.
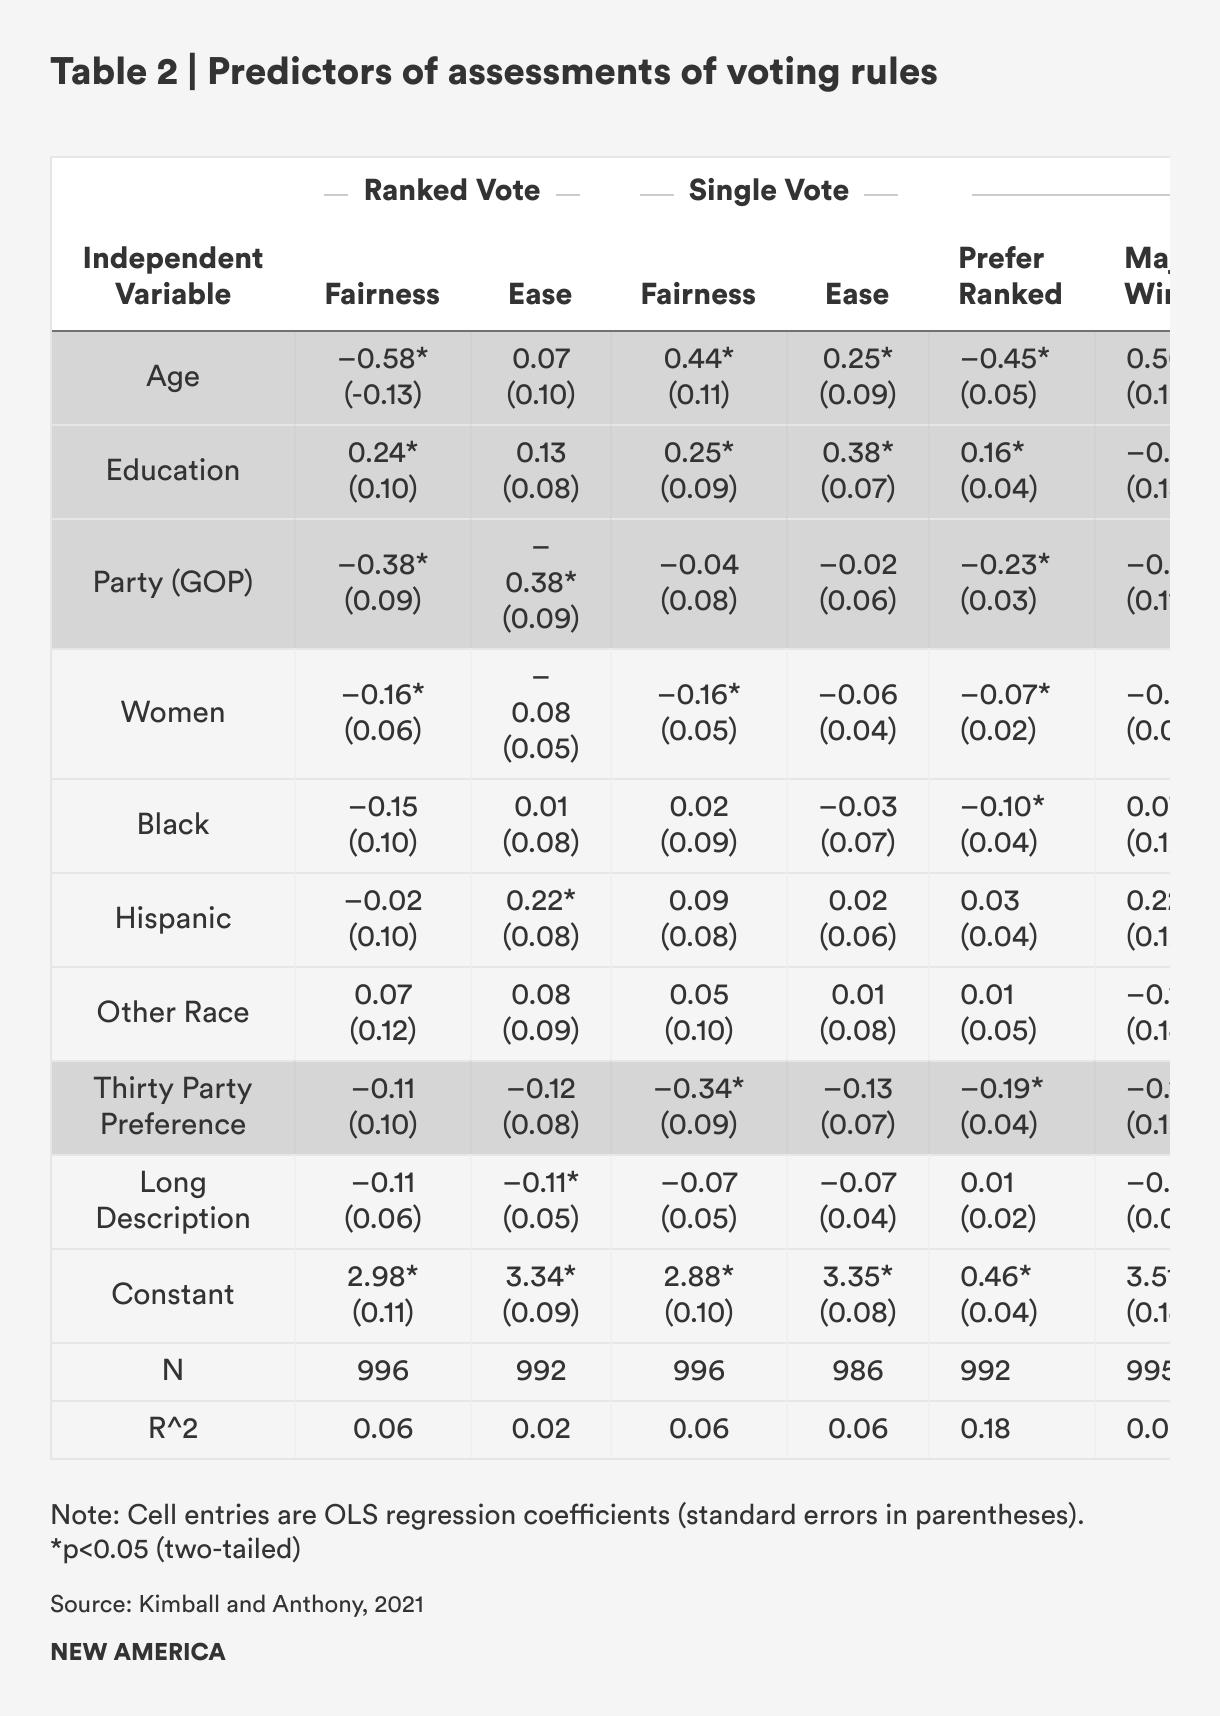
In their recent experimental study of public perceptions of RCV and plurality, David Kimball and Joseph Anthony found that large majorities of participants considered both methods very easy or somewhat easy to follow, and more than 70 percent gave the same rating to both voting rules.8 However, the single vote rule had a significantly higher mean rating on ease-of-use compared to RCV. Longer descriptions of the rule did not significantly alter ease-of-use ratings for RCV. This finding, when combined with results of recent experiments by Melody Crowder-Meyer, Shana Kushner Gadarian, and Jessica Trounstine indicate that experience, rather than written instructions, may be the key to improving voter understanding. Crowder-Meyer et al. found that relatively brief practice with RCV led respondents to be significantly more likely to understand how RCV elections work.9 When cities or states transition to ranked-choice voting, then, they may wish to offer training opportunities at polling stations for voters to practice before they vote.
Still, questions persist about whether RCV places excessive information costs on voters, particularly on low‐income, low-education voters as well as historically underserved communities. Resource and information-based disparities exist under plurality rules, of course, but it is important to understand whether and to what extent disparities might be exacerbated with RCV.10
As discussed above, Neely et al.’s 2004 San Francisco election survey found high levels of self-reported understanding of RCV in the 2004 election. However, they also observed that voters with a high school education or less, African Americans, and Latinos were all less likely to say they understood RCV compared to other voters.11 By the 2005 cycle, however, that racial disparity (in San Francisco) was no longer observable.12 This is further evidence that experience is the best teacher, with voting rules as with much else in life.
Donovan et al. found that white voters and voters of color understood voting instructions equally well in RCV cities. However, they observed that understanding varies widely by age: Older voters in RCV cities were significantly less likely to report understanding voting instructions very well (19 percent for RCV versus 28 percent for plurality). Furthermore, they found RCV was the only election type that older voters were significantly less likely to report understanding very well.13
Joseph Coll found similar age-related differences in self-reported understanding in a survey of likely 2020 Democratic presidential primary voters. More older voters said they experienced increased difficulty, but then were actually more likely to complete their ballots correctly, utilizing all of their rankings. This is consistent with scholarship showing older voters have the strongest status quo bias, and relatedly, the greatest resistance to voting rule changes (as discussed in a later section). However, it hints that self-reported understanding measures have their limits. Like Donovan et al., Coll’s findings challenge the argument that certain racial, ethnic, or socioeconomic groups are more likely to have difficulty understanding RCV than others.14
Exit polling out of New York City, which introduced RCV to their primary elections in 2021, found minimal variability in expressed understanding of RCV between racial and ethnic groups. Again, expressed difficulty did increase with age. Among those in the youngest age group (18-29 year olds), only 1 percent acknowledged not understanding RCV well at all, compared to almost 5 percent in the oldest age group (65 and older).15 Still, the high levels of understanding of RCV among voters in New York City across demographic groups is likely a credit to the massive voter education campaign that preceded the rollout of the new system. Efforts included over 600 online and in-person trainings, held in partnership with over 750 organizations citywide, and direct canvassing to priority communities. Education materials were printed in 13 languages.
At this point, we have a good grasp of how well voters understand ranked-choice voting: Generally, pretty well. We also have a good understanding of who struggles the most to understand ranked-choice voting: Generally, older voters. We also have a good understanding of what helps voters to better understand ranked-choice voting: Resources, training, and experience. This suggests that jurisdictions implementing ranked-choice voting for the first time should invest in opportunities for voters to practice the new voting system, and invest extra resources in polling places with higher percentages of older voters.
Claim 2: Voters Utilize Their Rankings
Conclusion: Mostly supported
As the discrepancy in Joseph Coll's study between ratings of RCV difficulty and ballot completion rates among older respondents illustrates, the demands of a given voting type may be more accurately measured in terms of ballot completion and error rate rather than self-reported understanding. So, we turn now to the questions of whether and how voters use their rankings.
One of the key advantages of RCV is that it provides voters with a greater opportunity for political expression. But for voters to reap the benefits, they first need to follow the instructions by ranking the right number of candidates.
Individual ballot records and survey data both indicate that most people do utilize at least some of their rankings. For instance, FairVote’s 2018 report on San Francisco elections found approximately 75 percent of voters ranked multiple candidates and 60 percent ranked the maximum allowable number.16 In a national survey from 2014, more than 65 percent of respondents participating in RCV elections ranked three candidates or less, but otherwise followed instructions well.17 About 60 percent of the voters in Minneapolis’s first ranked-choice elections in 2009 reported that they ranked some candidates.18 Exit poll results from the June 2021 New York City mayoral primary found that 88.5 percent of voters ranked at least two candidates; 48 percent ranked five (the maximum allowable number for the contest); and 11 percent ranked only one candidate. In the city council races, 69 percent ranked more than one candidate and 28 percent ranked only one candidate.19
Similar to these observational studies, a recent experimental survey from Cheryl Boudreau, Jonathan Colner, and Scott MacKenzie found high rates of ranking utilization. Eight in 10 survey respondents ranked at least one candidate, 76 percent ranked multiple candidates, and approximately 74 percent used all allotted rankings in these elections.20
Yet some voters appear to be more likely to use their rankings than others. The same study observed significant disparities among voters, which corresponded to different levels of political knowledge. Only 70.1 percent of uninformed respondents who were not given a voter guide (the no-information group, as marked in the figure reproduced below) ranked at least one candidate (beyond their first choice), compared to 85.8 percent of informed respondents in the same group; the same disparities tracked for the groups’ uses of multiple and full rankings. These gaps were significantly narrowed by providing a voter guide (Figure 1).21
One of this study’s more counterintuitive findings is that a lack of political knowledge and/or information about the election was less of a barrier to marking the ballot under RCV than single-choice plurality. As shown in Figure 1, respondents within the uninformed and informed groups respectively were more likely to pick (rank) at least one candidate in the RCV setting than they were likely to pick a candidate in the single-choice setting—with or without a voter guide. Among uninformed respondents without a voter guide, the most disadvantaged set of survey participants, the difference between the RCV and single-choice settings was especially stark: 70.1 percent picked (ranked) a single candidate in the RCV setting, while only 45.2 percent picked a candidate in the single-choice setting (Figure 1A). Moreover, among uninformed and informed respondents, a greater percentage of respondents in the respective no information groups utilized all of their rankings than those who selected just one candidate in the single-choice plurality setting.
Figure 1 | Political expression in the 2020 supervisorial elections in San Francisco by political knowledge
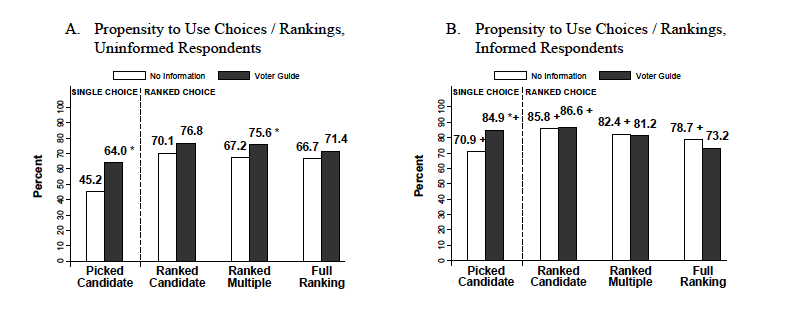
Notes: *denotes the difference between voter guide and no information groups is statistically significant (p < .05, one-tailed). +(-)denotes within-group difference between uninformed and informed respondents is positive (negative) and statistically significant (p < .05, one-tailed).
Ranking truncation—that is, not utilizing all allotted rankings—is always challenging to evaluate, given that one voter’s indifference or ignorance is another's conscious protest. But regardless of why a voter doesn’t use their allotted rankings, the implications for RCV are enormous. One of the central selling points of RCV is that it produces majority winners. When voters don’t rank multiple candidates, their ballots are much more likely to be exhausted (i.e., not counted in the final tally). For example, a frequently cited 2015 article by Craig M. Burnett and Vladimir Kogan analyzed ranked-ballot data (some 600,000 votes) in four local elections in California and Washington and found that due to high ballot exhaustion none of the winners received the promised majority of the total votes cast.22 However, the study’s peculiarly small sample of elections and consideration only of races with a three-rank limit (a limit which has since been identified as a problem and is now less common) undercuts its generalizability. Further, when one considers all RCV elections in the United States, most of them do result in a final-round winner with a majority of total votes cast.
Another concern is voter error—when voters fills out the ballot incorrectly, invalidating their vote. This is different from truncation, since truncation can be deliberate. Error is by definition not deliberate.
Many studies have addressed the “is RCV too confusing?” question by comparing the rate of residual, or invalid votes, recorded in plurality and RCV elections. In most cases, the residual vote rate—the difference between the total ballots cast and the number of valid votes recorded for the contest in question—has been found to be about the same, or lower, after adopting RCV, or in RCV cities versus plurality cities. Residual votes (or uncounted or voided votes) include undervotes (votes left blank), overvotes, and other mismarkings that cause the ballot to be disqualified.
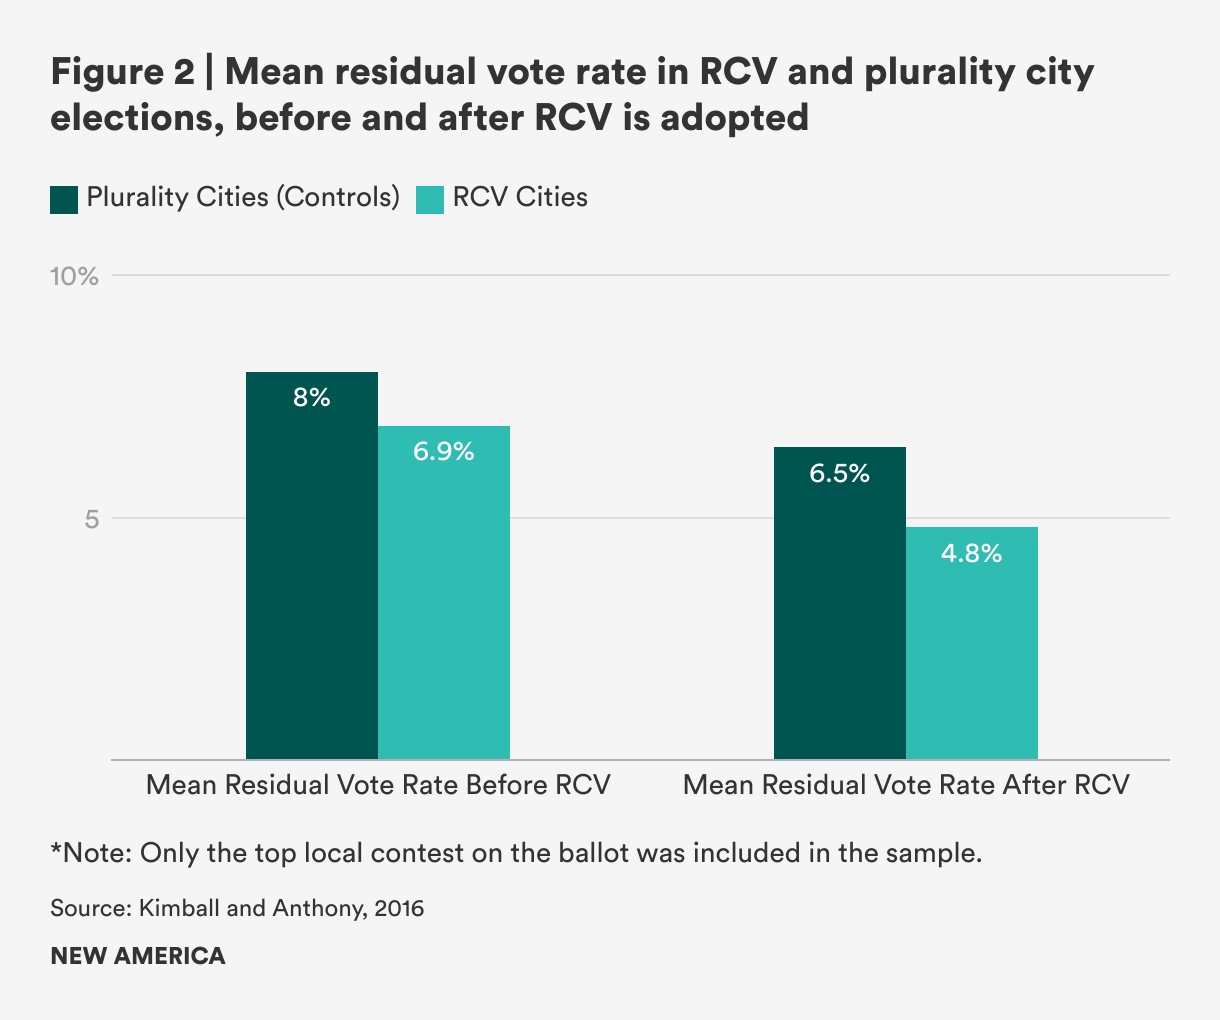
For instance, a 2008 article by Francis Neely and Corey Cook found that the first local elections with RCV in San Francisco produced slightly lower residual vote rates than before RCV was implemented.23 In a 2016 paper, David Kimball and Joseph Anthony likewise observed a decline in residual vote rate after the adoption of RCV (see Figure 2). However, their regression results indicate the change in the difference between the groups is not statistically significant.24 From the same paper, a case study comparison of Minneapolis in 2005 and 2013 also revealed no significant change in residual vote rate after adopting RCV. They also found no significant changes in income-related disparities in ballot completion.
The rate of spoiled ballots is another helpful marker of voter confusion. When a voter (sometimes with the help of the voting equipment) notices an error in their ballot, the voter can return that “spoiled” ballot and exchange it for a new one. The original, spoiled ballot does not count, but tracking the number of spoiled ballots can help expose challenges voters face with specific types of ballots. Researchers Lawrence Jacobs and Joanne Miller found Minneapolis’s citywide spoiled ballot rate increased from 1 percent in 2005, when the city was still using plurality rules, to 4 percent in 2013, after switching to RCV. 25
Data separating undervotes and overvotes is more limited, but Neely and Cook’s analysis of voter behavior during the first three RCV elections in San Francisco showed that the reform decreased voters’ tendency to undervote compared to plurality.26 In the Minneapolis 2013 election, undervoting and other error rates did go up in comparison to pre-RCV elections, however the error and ranking truncation rates were still substantially lower than those reported for RCV elections in San Francisco.27 Additionally, a 2015 nationwide survey experiment found only 3.5 percent failed to rank any candidates at all.28
There is mixed evidence on whether (or to what extent) RCV increases overvoting overall and/or among certain demographic groups. Neely and McDaniel’s examination of San Francisco elections between 2004 and 2011 concluded the pattern of overvoting is similar in both RCV and non-RCV contests, and that overvotes occur disproportionately in precincts with more residents aged 65 or older. The probability of a disqualifying overvote at the precinct level also appeared to increase with the share of the population that is Black, Latino, foreign-born, and lower-income.29 Neely and Cook found racial differences in aggregate overvote patterns, but no disadvantage for elderly voters.30 Finally, comparing Minneapolis’s 2005 and 2013 elections (pre- and post-RCV implementation), Kimball and Anthony reported in their 2016 report that the undervote and overvote data do not reveal substantial income disparities in the 2013 Minneapolis mayoral election. Yet, Jacobs and Miller (previous cited) observed a higher rate of spoiled ballots in low income wards and majority-minority wards compared to high income and majority white wards in 2013.
Recent election simulations conducted by Jason Maloy at the height of the 2020 U.S. presidential primary season suggest that RCV and other more complex ballot types do not increase the chance that a voter’s ballot will be voided, despite raising the probability of at least one violation of voting instructions.31 In fact, results from the experiments show that, on this “most basic and widespread measure of voting error,” the rate of void votes (also known as invalid, residual, or rejected), RCV outperformed the traditional, single-mark ballot. Results further suggest that group-based inequalities in voting error—measured by the discrepancies in void rates across age, gender, and race cohorts—are smaller with reform ballots than single-mark, plurality ballots.
The conventional wisdom on more complex ballot types is that they increase information costs for voters. “All-or-nothing is crude but accessible, whereas giving different degrees of support to different candidates is more expressive but also more error-prone,” as Maloy put it in a brief reporting his findings. But this tradeoff is not as evident, or as big a problem, as one might expect. Switching from a standard plurality ballot to preferential ballot appears to increase the likelihood of a voter choosing at least one candidate and thus the likelihood of having their vote count.
Therefore, if there is a trade-off, it may simply be this: With single-winner plurality voting, voters are slightly less likely to make mistakes, but also less likely to choose any candidates. With more choice, more voters express their political preferences, but some of that increase in expression is canceled out by errors. 32 Of course, over time, as voters learn, the errors are likely to decline, thus reducing the potential of a trade-off.
Instead of major errors, ranking truncation remains a much greater concern to RCV advocates and administrators. Rampant truncation can jeopardize RCV’s promise of delivering a widely-agreed upon majority winner. Worse, there is evidence that less educated and minority voters are more likely to truncate their rankings, and therefore less likely to have their ballots count toward the final tally. But wasted votes and demographic disparities in ballot completion also exist in plurality elections. Indeed, as Maloy found in his study, RCV was actually associated with smaller discrepancies in error-proneness according to race and gender, while the plurality ballot was associated with larger discrepancies.
For RCV jurisdictions or those considering the reform, the most important takeaway from the research thus far is that it is possible to encourage more complete rankings among voters, thus improving the quality of RCV elections.33
As we saw before with reported understanding of RCV, experience is the best teacher. As voters become more familiar with ranking, they make better use of rankings and make fewer errors. Neely and Cook found that the share of ballots on which three candidates were ranked was 7 to 9 percent higher in precincts where voters used it for the second time compared to those using it for the first time.34 The literature suggests other remedies, too: voter guides35 (and aggressive voter education in general) can increase voters’ propensity to use their rankings, in addition to lively competition (especially races to fill open seats),36 and more campaign spending.37 The same factors can moderate disparities in ballot completion and error among historically disenfranchised groups. 38
Finally, limiting the number of candidates on the ballot can help offset the added cognitive and informational burdens that RCV places on voters. Ranking truncation appears to rise in tandem with the number of candidates listed on the ballot. Boudreau et al. saw a substantial drop in the share of uninformed respondents who used their rankings when the number of candidates increased from three to seven. No such erosion was evident in the single-choice plurality setting. Neely and Cook’s 2008 study of error in San Francisco’s RCV elections observed a similar decrease in rankings as the number of candidates increased. Beyond truncation, as the number of candidates increases, more “catastrophic” voting errors (those that void your vote) may creep up as well. The article estimated that an increase from 10 to 16 candidates on the ballot would increase the average undervote rate from 0.9 percent to 1.2 percent. Moreover, the number of candidates listed on the ballot was the strongest predictor of overvotes.39
At this point, we understand the challenges that voters in both voting correctly under RCV and the importance of fully using their rankings. Where more research could be useful would be in understanding the ways in which election administrators can more effectively help voters to be most effective in casting their ballots. Might certain interventions be more effective than others? Could certain ballot designs improve voters’ ability to cast their ballots effectively? Additionally, might election administrators find ways to limit ballot overcrowding, or offer mechanisms that allow parties or interest groups to more easily provide voters with suggested rankings for those voters who would prefer to delegate candidate evaluation to a trusted intermediary? Could offering practice ballots before the election help reduce errors? Such interventions could be tested first through experiments.
Claim 3: RCV Increases Voter Participation
Conclusion: Mixed evidence, hard to assess
For good government reformers, persistently low voter turnout in the United States has long been a source of frustration and hand-wringing. One consistent finding in the voting reform literature is that interventions meant to boost participation tend to have marginal impact on turnout, and can even increase demographic disparities in turnout, as long as elections remain mostly uncompetitive and voters have limited and generally uninspiring choices. In theory, then, the potential for ranked-choice voting to increase voter turnout and mitigate participatory biases by expanding voter choice is promising.
However, this mechanism is indirect. In order for ranked-choice voting to increase participation, it must first increase competition and candidate entry. After all, in a recent Knight Foundation report on non-voters, the most common reason cited for not voting was “Don’t Like the Candidates” (17 percent), followed by “Vote Doesn’t Matter” (12 percent).40 To the extent that RCV can encourage more candidates running, and make more voters feel like their votes matter, it has the potential to improve voter turnout. Nonetheless, several studies have analyzed the correlation between ranked-choice voting and turnout more directly.
Scholarly research on RCV and turnout in the United States has been fairly limited, and findings have been mixed. Unlike early voting and other convenience reforms, about which there is substantial data spanning many years and locations and electoral contexts, there is still very little data to understand how RCV has impacted turnout where it is used and even less to guide predictions on how it might affect participation under different conditions. Not only is RCV still a novelty, with the earliest relevant cases going back less than two decades, but it’s used predominantly in low-turnout municipal elections, many of them nonpartisan and held in odd years or apart from the state and federal election schedule. These peculiar characteristics, coupled with insufficient data, create a challenge for researchers who wish to isolate RCV’s impact from other factors that we know to cause swings in turnout from one election to the next: who is on the ballot, when the election takes place, and whether elections are competitive.
During the Progressive Era, reformers who wanted to free local politics and elections from the grip of corrupt national party organizations enacted reforms like odd-year elections and nonpartisan municipal elections. In most cases, these reforms caused voter turnout in city elections to plummet and exacerbated existing disparities in participation.41 While timing is crucial for turnout, nonpartisan elections have proven at least as problematic. Voters—especially lower-information voters who already feel disconnected from politics—depend on partisan cues and party mobilization and education efforts not just to go to the polls but also to make informed choices.42
Still, if RCV does boost turnout even marginally, small increases in participation can be decisive in low-turnout races. And if RCV boosts participation among historically underrepresented groups relative to high-propensity voting populations, there’s a chance it can help disrupt a vicious cycle of nonvoting and disaffection for many citizens.43 Moreover, studying turnout effects can also facilitate future inquiry about how RCV might affect participation in statewide or federal elections.
In their 2016 analysis of participation in cities that use RCV compared to plurality cities, David Kimball and Joseph Anthony found that RCV was not associated with a statistically significant change in voter turnout in general elections.44 Instead of voting rules, their findings suggest general election turnout is influenced much more by the number of contests on the ballot (turnout spikes when there are three or more), timing (even-numbered years), and whether there’s a competitive mayoral race in play. Their case study of Minneapolis showed only a slightly higher rate of participation in RCV elections compared to general elections under plurality rules.45
However, in cases where ranked-choice voting elections combine what was formerly a low-turnout primary and an uncompetitive general election into one single contest, or a two-round election into a single election, RCV can boost turnout. Kimball and Anthony found that turnout in RCV elections far surpass that in primary and runoff elections in plurality cities. Many cities hold two elections for local offices: a primary election and, if nobody reaches a majority, a runoff election to decide between the top vote-getters from the primary. Sometimes one of these elections coincides with the general election, but not always. The way RCV is typically implemented is that the primary and runoff are combined into one “instant runoff” election, and that election is held in November, where it can share the ballot with higher-profile state and federal elections likely to attract more voters, thus boosting turnout overall. Notably, this is what all 23 Utah cities opting into RCV decided to do, effectively eliminating primaries.
Kimball and Anthony’s comparison of turnout in primary and runoff elections in RCV and plurality cities observed that in the elections prior to RCV adoption, mean turnout in the (future) RCV cities was 22.3 percent, compared to 14.8 percent in plurality cities; after cities adopted RCV (and converted all their elections to general elections), mean voter turnout in RCV cities was 31.7 percent and 16.9 percent in plurality cities—a larger difference that suggests RCV increases turnout compared to a baseline of a primary election followed by a general election. The authors suggest that turnout boosts may be more attributable to changes in timing and competitiveness than the voting method itself. Thus, to the extent that ranked-choice voting can make general elections both more competitive and more important by eliminating primary elections, this will likely increase turnout.
Jason McDaniel’s 2019 paper on turnout in mayoral elections using RCV found a slight decrease in turnout (about 3 to 5 percentage points) among cities that implemented the reform, compared to similar cities that did not. Despite using national data, it was still heavily focused in California, making it similar to previous analyses.46
As with concerns about some voters finding ranked-choice voting more difficult than others, some researchers have examined concerns that the impacts of ranked-choice voting on election turnout may also be disparate.
In their previously discussed analysis of the 2013 Minneapolis election, Jacobs and Miller reported higher rates of participation in white and high‐income wards, but did not show how that gap compared to turnout patterns found in pre-RCV elections. Kimball and Anthony addressed this gap in the research by comparing the same demographic turnout patterns from 2013 with those in Minneapolis’s 2005 elections, right before the city adopted RCV. They observed virtually no increase or decrease in turnout disparities between high-income and predominantly white wards and low-income wards with higher concentrations of people of color between 2005 and 2013.
Two studies suggest that RCV may reduce the income gap in turnout. A 2016 study of San Francisco’s mayoral elections between 1995 and 2011 by Jason McDaniel (the forerunner to his previously cited 2019 paper) found that, contrary to his expectations, higher levels of income, across racial groups, were not associated with higher levels of voter turnout in RCV elections, even though they were positively associated in plurality elections. This narrowing of the income-turnout gap would appear to be a sign that lower-income voters were mobilized by the opportunity for greater political expression afforded by RCV.47 These results have been supported in a recent working paper from Eamon McGinn, which concluded that the introduction of RCV to the Minneapolis-St. Paul Metro Area caused a 9.6 percentage point increase in turnout for mayoral elections, on average, and that the increased turnout effect is larger for precincts that have higher poverty rates.48
Let's examine McDaniel's 2016 study more closely now, with regard to other demographic turnout effects. Broken down by race, age, and education, the article suggested RCV was associated with a significant decline in Black turnout (about 18 points) and white voter turnout (about 16 points) compared to pre-RCV elections.49 He found no meaningful difference in Asian or Latino participation as a result of RCV adoption, and attributed any increases in their participation after RCV to the presence of in-group candidates on the ballot. Notably, Willie Brown was an African-American mayor of San Francisco before RCV was implemented. It is quite likely that with Brown no longer running, Black turnout declined, a change merely coincidental (and therefore causally unrelated) to RCV. Again, this highlights a more general point: If RCV increases turnout, it does so indirectly. If RCV encourages more diverse candidates to run, it may also encourage more people to participate because of an opportunity to vote for a candidate they feel represents them well.
McDaniel’s main takeaway on racial turnout disparities was that any negative racial turnout effects of RCV “can be offset when there are clear racial group interests at stake, especially among newly mobilizing portions of the electorate.” Translation: the more candidates on the ballot from your racial or ethnic group, the more likely you are to vote. The missing piece of the puzzle here, then, may be whether RCV can increase candidate entry among underrepresented groups enough to outweigh potential negative turnout effects imposed by the extra information costs involved. However, the jury is still out on these potential negative turnout effects, with different studies finding differing effects.
Finally, McDaniel concluded that younger and poorly-educated voters were most likely not to vote under RCV elections. On the other end, there was a positive relationship between graduate education and turnout in RCV elections—and here, again, the strongest marginal effect was among white voters. The results suggest that the information demands of RCV may widen the gap between voter participation among the most and least highly educated members of the population.
McDaniel’s findings concerning youth voter turnout have since been challenged in an article by Courtney L. Juelich and Joseph A. Coll. Juelich and Coll used a matched study of individual level voter turnout for seven RCV and 14 non-RCV local elections from 2013 and 2014, and found no statistical difference in voting rates between RCV and plurality cities for the general public. But, in contrast to McDaniel, they estimate that younger voters are 9 percentage points more likely to vote in RCV cities than plurality cities. From the article: “increased contact in RCV elections accounts for a larger portion of the increased voter turnout compared to perceptions of campaign civility. Findings suggest RCV acts as a positive mobilizing force for youth voting through increasing campaign contact.”50
Another measure of participation is called voter drop-off, or the difference between ballots cast in the first and last rounds of voting, such as between primaries and general elections or primaries and runoffs. By replacing primaries and runoffs with a single RCV election held in November, again, we should see more continuity in voting, and therefore less drop-off. Ballot exhaustion—when an RCV ballot doesn’t make it to the final tally—complicates this argument, but less so if most people utilize their rankings. Taking ballot exhaustion into account, the 2016 Kimball and Anthony paper cited above compared the drop in voter participation from the first to the last rounds of voting in RCV and plurality cities. For RCV cities, they measured drop-off as the difference between the total ballots cast in the election and the number of valid votes counted in the final round of vote tabulation; in plurality cities, they measured drop-off as the difference between the total ballots cast in the general election and the valid votes for the top local contest in the primary or runoff. Based on a sample of 62 elections (including 43 plurality cities that held a separate primary or runoff in addition to the November general election), they calculated that RCV adoption is associated with a 24 percentage point reduction in drop-off.51 This sizable improvement indicates that RCV dramatically reduces the voter participation gap seen in plurality elections, where about half of voters participate in the general but not primary election, or one round only of the runoff.52 Furthermore, the change illuminates how RCV can address the problem of low primary turnout.53
Over the last several years, primary elections and primary electorates have become an important focus of political reformers, and primary reforms have taken up a correspondingly large share of reform thought and resources. A recent New America report summarizing the literature on primary reform found that changing the rules of primaries from closed to open, as many reformers propose, shows little evidence of reducing polarization, or significantly boosting turnout.54 As the report notes, drawing on existing studies: “At best, open primaries increase participation by only 2 or 3 percentage points, and top-two primaries by about 6 percentage points.55 Given already abysmally low turnout in primaries, and thus plenty of room to expand, these are hardly transformative numbers—especially since they do not appear to change the ideological content of the voters who participate.”56
However, by merging the primary election into the general election, RCV offers a chance to improve primary turnout in ways that conventional primary reforms seemingly cannot.
As of 2021, nearly all RCV elections in the United States are held at the local level, where nationwide turnout is dismal, and getting steadily more so over time, regardless of voting system. A 2007 study of mayoral elections of the largest cities in the United States over the previous 25 years found that average voter turnout was only 27 percent, and was decreasing every year.57 A 2016 study of local election turnout in 50 U.S. cities found that turnout in 10 of America’s 30 largest cities was less than 15 percent.58 Turnout skyrockets when the local election coincides with a national election, or if there is a hotly contested mayoral election.59 This has substantial implications for research on RCV’s turnout effects. With our sample of cases largely limited to municipal and often nonpartisan elections (in relatively engaged localities), the best we can say for RCV, independent of timing considerations, is that it may increase local turnout from a pathetic baseline to a slightly less pathetic level by attracting more, and more diverse, candidates. However, if RCV is able to combine the primary and the general election into a single election, held in November alongside other national elections, it is likely to have a more powerful effect in boosting turnout.
But, with a very limited sample, and many other factors that determine voter turnout, it is very difficult to say with much confidence whether RCV in itself is responsible for increases in participation where it has been implemented, let alone whether it would impact turnout if it were implemented in more statewide and federal elections. This presents a serious challenge for researchers trying to study the turnout effects of RCV apart from the impacts of timing and competitiveness, as well as advocates selling RCV on the grounds it can mobilize voters. However, if RCV combines what was previously two elections, a primary and a general (or primary and runoff), it can potentially solve the problem of low-turnout primaries more effectively than open primaries or other primary reform.
Claim 4: Voters like RCV, and Consider it an Improvement Over the Status Quo
Conclusion: Generally supported, with caveats
In order for RCV to catch on, voters have to like it. After all, either voters in states that use plurality voting will have to affirmatively choose to switch through a binding referendum, or politicians will have to vote to switch because they believe such a change will be popular. So, public opinion matters.
While limited, the literature on voters’ response to RCV is growing, and we now have a much better understanding of how voters feel about the reform in general, in comparison with the plurality method, as well as what demographic factors predict support for or opposition to RCV.
Briefly, findings consistently show that younger voters, Democrats, and those with past experience using RCV tend to be more supportive of the reform than older voters, Republicans, and those who are new to RCV. Meanwhile, surveys conducted in and around RCV cities and/or in tandem with real RCV elections generate more supportive attitudes, whereas experimental surveys conducted nationwide tend to generate lower opinions of RCV. This difference is likely due to the fact that most voters nationally aren’t familiar, let alone have had any direct experience, with RCV. In the case of RCV, familiarity generally breeds comfort and warmth.
When Americans who don’t know RCV are exposed to it in an experimental setting and asked to rate the system, the majority tend to prefer the status quo plurality method—at least at first. Conversely, in places where RCV has already been implemented, voters tend to prefer RCV to traditional voting systems. For example, when researchers Sarah John and Andrew Douglas surveyed voters in RCV cities and non-RCV cities in 2013 and 2014, they found support for the reform was greatest in cities already using RCV (though the gap was far narrower in California cities).60 After RCV was implemented in their cities, 65 percent of Minneapolis respondents said they preferred RCV to what they had before; in San Francisco, 61 percent of polling place voters preferred RCV and 77 percent of absentee voters preferred RCV.61
Unsurprisingly, exit polls from Santa Fe’s 2018 and New York City’s 2021 inaugural RCV elections showed large majorities of residents wanting to use RCV in future municipal elections (71 percent and 79 percent, respectively). In both polls, however, support for using RCV dropped 16 percentage points when the question turned to whether RCV should be used in elections beyond the local level.62 While this still leaves a majority of respondents in each city who support expanded use of RCV, the discrepancy is worth exploring further, particularly in light of what has taken place in Maine.
Indeed, Maine, the only U.S. state as of 2021 to have implemented RCV for statewide and federal elections, seems to be the exception in terms of public opinion toward the reform. In a pre-primary election statewide survey taken in 2018, Maine voters were asked how much they would like the experience of using RCV. Fifty percent of respondents answered that they expected using RCV to be either “excellent” or “good,” compared to 42 percent who expected it to be “just fair” or “poor.” The question is not a perfect proxy for “do you support RCV, or prefer it to the old way?,” but it gives us a sense of what happens to public opinion when the reform is introduced into partisan contexts, beyond the municipal level. To be sure, cities that adopt RCV are likely to be cities where there is already support for RCV and one party is dominant.
Meanwhile, Lindsay Nielson’s online survey of 622 American adults showed RCV was rated far below plurality and majority (runoff) methods on overall preference. The analysis also found that voting in a mock RCV election as part of a survey did not make respondents more likely to support RCV voting systems.63 These findings have since been validated at least partially by a suite of studies commissioned by the Electoral Reform Research Group.64 This suggests that it may not be the RCV election itself that engenders familiarity, but rather the social learning that comes with the experience of voting in an RCV election.
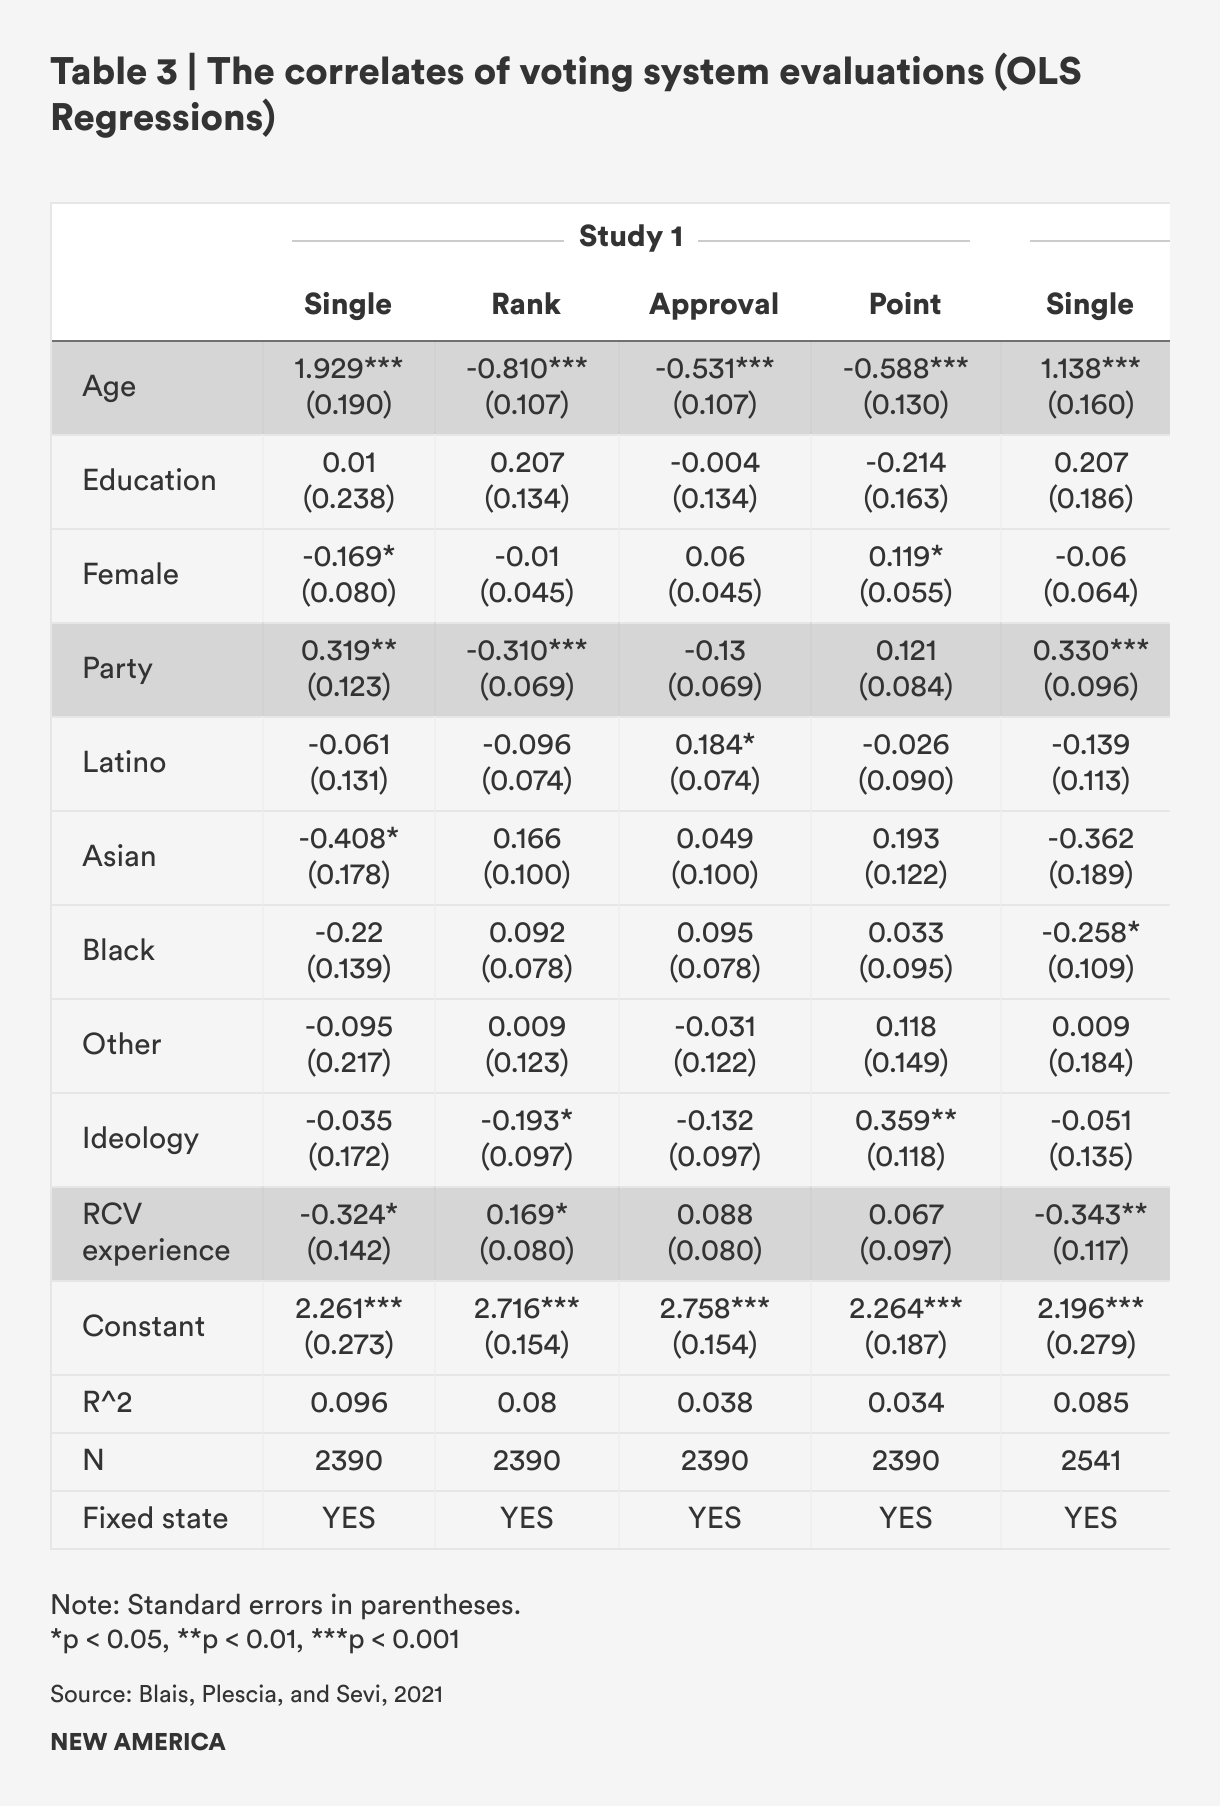
For example, a study by Andre Blais, Carolina Plescia, and Semra Sevi, reported similar results from their 2020 survey experiments conducted in Super Tuesday states and nationally. The authors found that the single vote (plurality) remains the most preferred voting method.65 Additionally, the 2021 David Kimball and Joseph Anthony paper discussed above found a strong majority of respondents in a national survey experiment preferred the single vote plurality method to RCV.66 Again, it is important to understand that for most voters, RCV is still something different and strange, and a single survey experiment can only capture this initial reaction.
Because of this frequent attitudinal disconnect between residents of RCV cities and nationally representative samples of American voters, there is good reason to be skeptical of national survey experiments that measure respondents’ preferences for RCV versus other voting systems, since these respondents are likely to be ignorant of RCV. For reform practitioners working on the ground in communities that have adopted or are campaigning to adopt RCV, it’s common sense that people don’t like change—but once something new comes along, people get used to it, and even learn to like it. Thus, voting experiments divorced from real-life election settings can appear to be academic exercises at best, and may have a chilling effect on reform, at worst.
While these critiques have merit, the surveys offer important insights into how different types of voters might initially respond to ranking, and how advocates can both better respond to initial hesitation and design educational resources. Anyone embarking on a new campaign to implement RCV needs to understand that at this point, most voters are likely unaware and skeptical, and thus will need convincing that there is a better way to vote. Such research can also serve as benchmarks for future studies. If national efforts to improve the popularity of RCV are successful, we should observe changes in receptivity to ranked-choice voting in these kinds of surveys and experiments.
These surveys can also help advocates better understand which demographic groups will be most receptive and most resistant, and thus can help shape advocacy efforts. Here is a breakdown of findings regarding who is most likely to “like” RCV, and who is more likely to need additional experience or convincing, based on a selection of recent studies.
- "Ranked-Choice Voting, Runoff, and Democracy: Insights from Maine and Other U.S. States," by Joseph Cerrone and Cynthia McClintock:
- Overall, 65 percent of Republicans in the national survey indicated opposition to changing electoral rules; only 12 percent of Democrats and 36 percent of Independents said the same. RCV also had a negative effect on Republican voters’ satisfaction with elections, while there was virtually no effect for Democrats and Independents.67
- "Public Perceptions of Alternative Voting Systems," by David Kimball and Joseph Anthony:
- Younger voters, Democrats, more educated respondents, and third party supporters tend to evaluate RCV more positively than older voters, Republicans, less educated respondents, and major party supporters.68
- "Choosing to Vote As Usual," by Andre Blais, Carolina Plescia, and Semra Sevi:
- Older voters are most supportive of the single vote versus the reform options. Results also show that those who identify as Republican overwhelmingly prefer the single vote and dislike the other systems, especially RCV. Finally, those who have personal experience with the RCV ballot tend to give higher ratings to that system, and lower ratings to the single vote. In a notable departure from other studies, the authors find that older voters’ strong preference for the single vote holds regardless of educational attainment.69
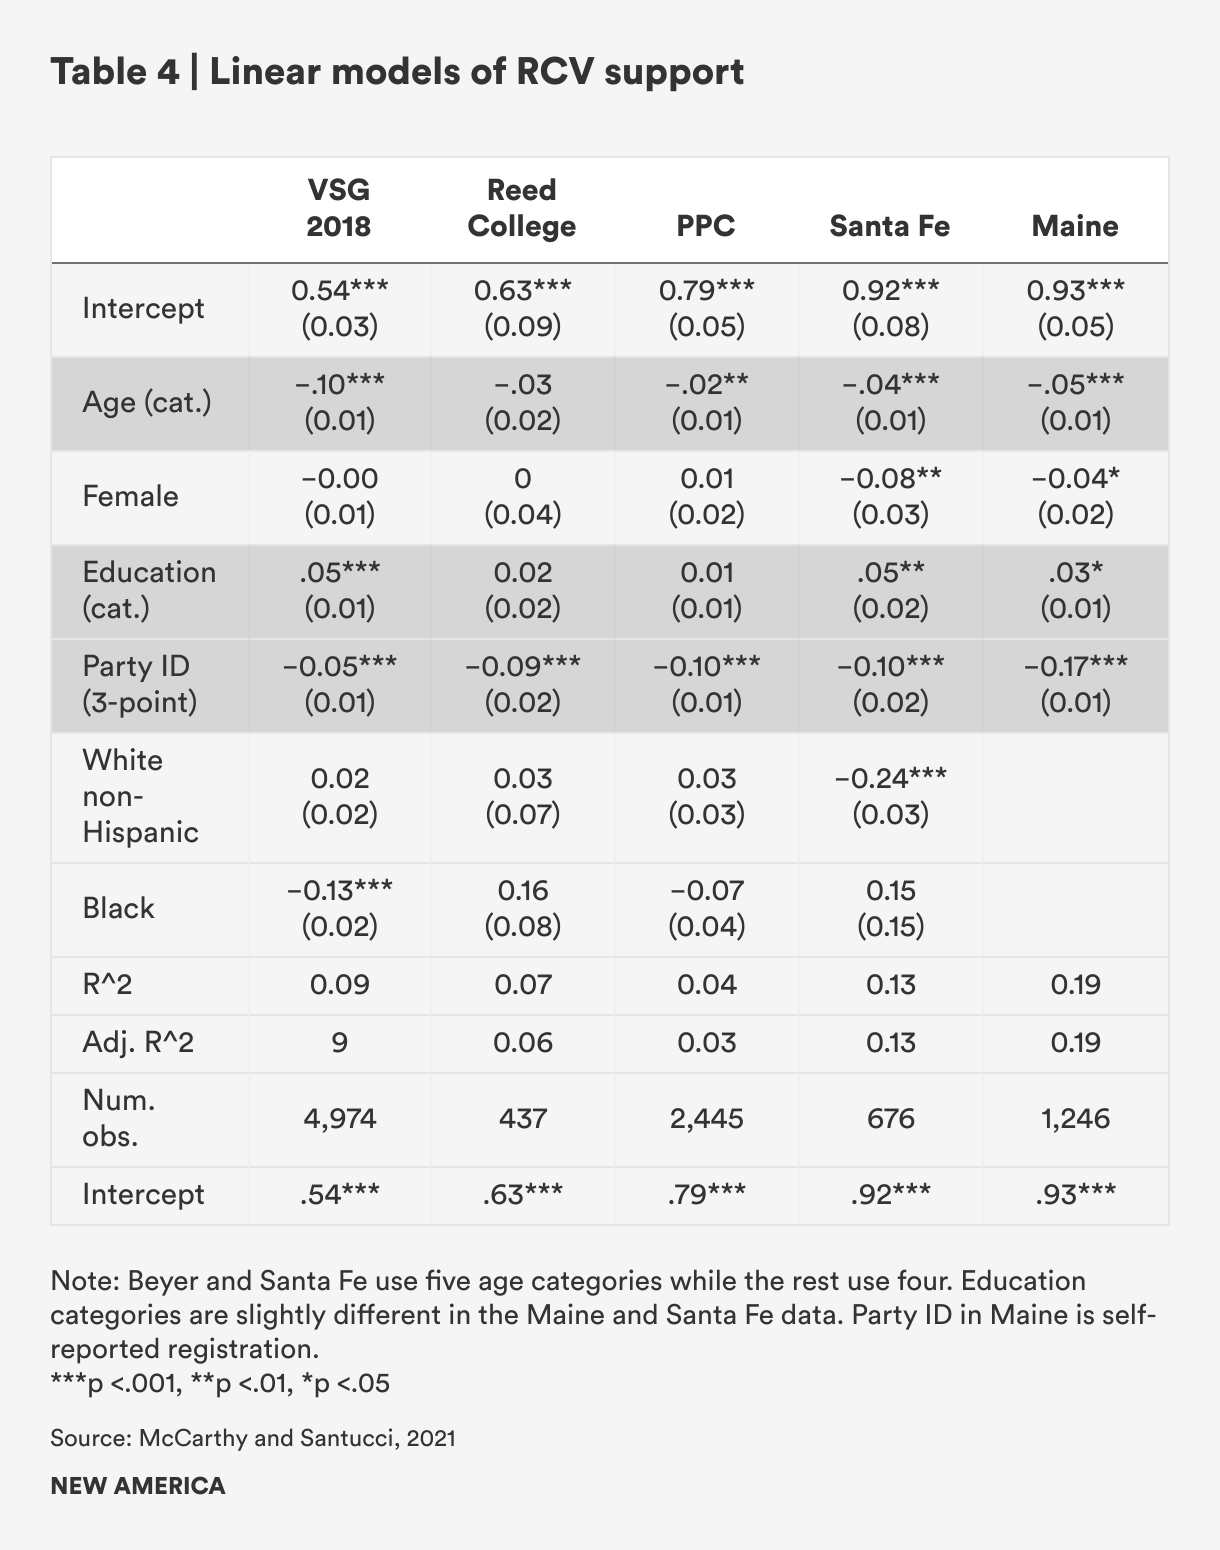
- "Ranked Choice Voting as a Generational Issue in Modern America Politics," by Devin McCarthy and Jack Santucci:
- Their analysis of five different surveys (three nationwide and two from places that have adopted RCV, Sante Fe, New Mexico and Maine) found that self-identified Democrats and people with more education are more likely to support RCV. Black respondents are less supportive of RCV in two of the nationwide samples when controlling for other variables, although Black respondents are still more likely to support RCV than the average American—just less likely than white Democrats. Across partisan and racial groups, RCV support is highest among young people.70
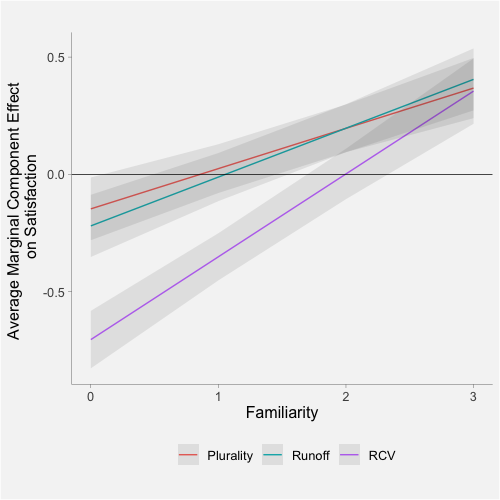
Furthermore, the experimental surveys discussed above suggest that through greater familiarity and experience, most people learn to like RCV, provided partisanship doesn’t get in the way.71 Illustrating this, McClintock and Cerrone’s survey found that unfamiliarity with RCV had a much stronger negative impact on satisfaction for RCV compared to plurality or runoff. Yet, they observed no difference in effect among those “very familiar” with the rule. “This suggests that voters do indeed ‘learn to like’ RCV and become more satisfied with it over time.”
Figure 3 | Familiarity increases satisfaction, especially with RCV
It is evident that experience makes people more comfortable with RCV generally, and certain demographic groups are more inclined to support RCV than others. What is less clear is how voters (both with and without RCV knowledge or experience) feel about certain features of RCV, what goes into those evaluations, or even what aspects of the system people find most appealing. Here, survey messaging and question wording matter considerably.
For instance, one of RCV’s central advantages is that voters can express themselves sincerely and not have to worry about their vote being wasted. However, as Kimball and Anthony noted, there is not much direct evidence indicating whether American voters really like this feature. Using a module from the 2020 CCES, Kimball and Anthony conducted a set of national experiments in which respondents were asked to complete voting tasks and answer questions afterward. They found that a short explanation of the vote transfer properties of RCV did not increase public support for the voting rule, but that this was in conflict with older respondents' expressed preference for majority winners. The disconnect here suggests that, in the absence of direct experience with RCV, reading about its advantages of RCV and disadvantages of plurality may be too abstract and/or superficial to register meaningful opinion change.72
In a similar vein, McClintock and Cerrone’s survey experiment indicates that most voters don’t understand the threat of a spoiler throwing an election to the least-preferred candidate. “Further, under RCV, many voters find the remedy for the ‘spoiler’ problem—the allocation of additional-preference votes leading to a come-from-behind victory—unsatisfying.”
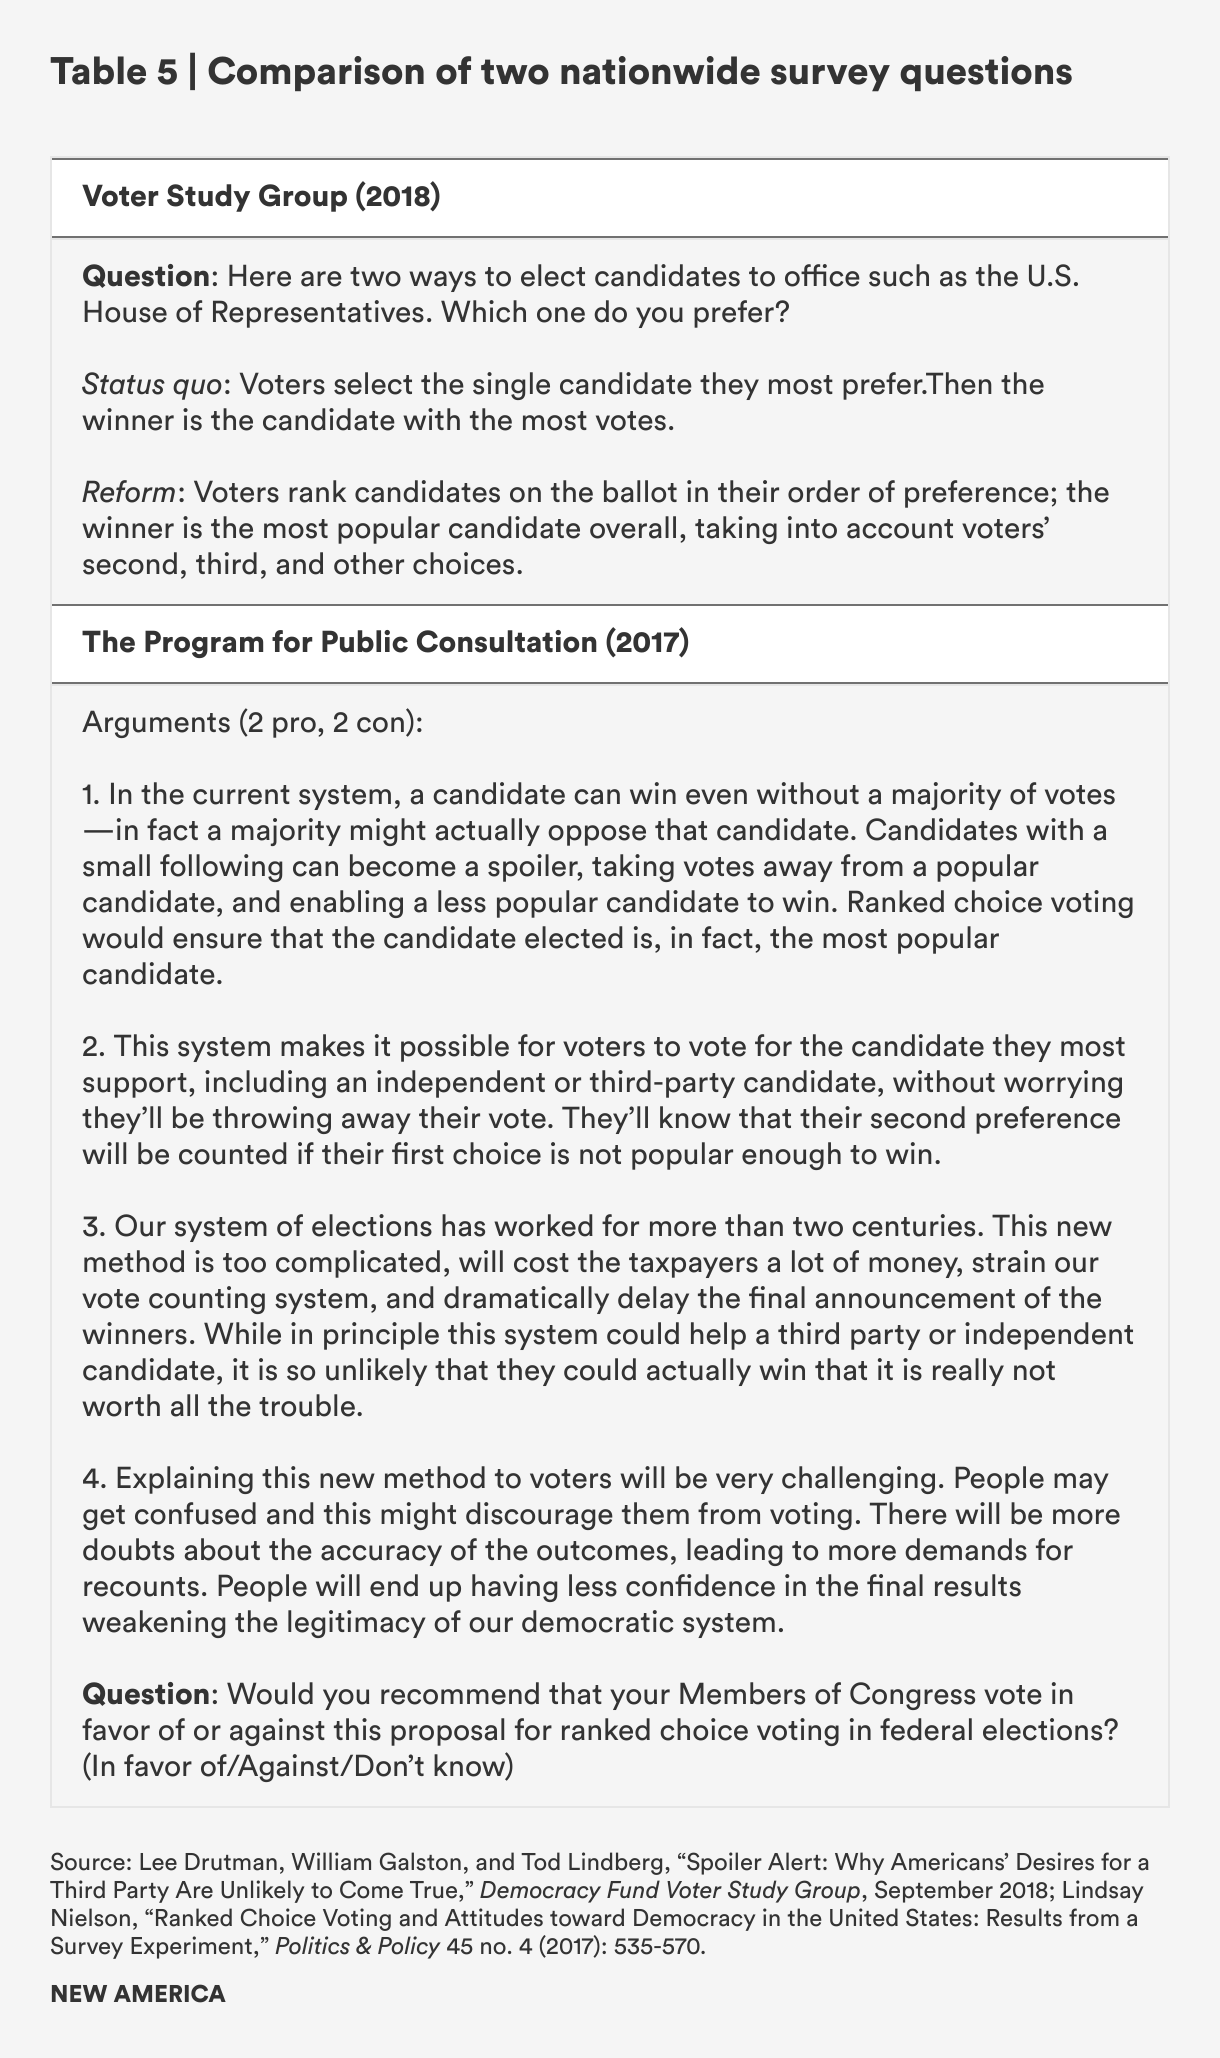
Devin McCarthy and Jack Santucci’s summary analysis of public opinion polling on RCV considered the extent to which wording may affect observed support for RCV.73 Depending on question wording, they observed, support for RCV ranged from 23 percent to 55 percent in national surveys by Democracy Fund’s Voter Study Group (VSG) and the Program for Public Consultation National Survey (PPC), respectively.74 The VSG survey presented respondents with a choice between a system in which the winner is the candidate with the most votes and a system in which the winner has majority support. The PPC survey took a different approach. First, it provided an extensive description of RCV (including how it works, what issues it addresses, where it is used), and identified the reform as part of a current bill in Congress. Then, it presented four arguments, two in favor of RCV and two against, and asked respondents whether they would recommend that their members of Congress would support the [hypothetical] bill to introduce RCV to federal elections. (See Table 5 for the full VSG question wording and the question and four arguments from the PPC survey). The latter, more information-heavy approach led to much higher levels of support for RCV.
From the same analysis, a Santa Fe poll showed 71 percent said “yes,” they supported using RCV in future local elections. However, only 66 percent indicated support when the question was framed as a choice between one between a candidate who gets the majority of votes or a candidate with the most votes, similar to the VSG question. Support was even lower, 55 percent, when asked about using RCV in state elections (using this same framing)—another warning sign about the difficulties of adopting RCV beyond the local level.75
In terms of persuasive power, if we dig into the original PPC 2017 survey report, it’s evident that positive arguments (especially the second) about RCV were more convincing to respondents than negative ones, on average. And even though the majority of Republican respondents were against the hypothetical RCV bill, 62 percent of them said they would find an RCV federal elections proposal acceptable or tolerable, and 68 percent of respondents in very red districts would find it acceptable or tolerable.76
It is admittedly difficult to capture the important elements of ranked-choice voting in a singular question as part of a larger survey, and expect respondents to get ranked-choice voting if they are unfamiliar with it. All of this suggests that campaigners and advocates should not get too lost in the specific mechanics of how ranked-choice voting works, since experience here is clearly the best teacher. Instead, they should focus on the benefits of ranked-choice voting and work hard to make the new voting system feel more familiar. Lacking this direct experience, voters are likely to rely on partisan and elite cues.
Claim 5: RCV Makes Voters Think Elections are Fairer
Conclusion: Not well-supported
A stable democracy depends on people believing the electoral process is legitimate and fair. The insurrection of January 6, which was caused by electoral losers’ refusal to accept the results of the 2020 presidential election, is case in point. So far, only a few U.S.-based empirical studies have examined the relationship between RCV and attitudes toward the democratic process.77 But early indications show that RCV does not do much to improve voters’ faith in the system. Experimental work even suggests that it may reduce voters’ perceptions of fairness, since the process by which votes are transferred can appear mysterious to voters, especially those who see their preferred candidate ahead in the initial tally only to have them lose after all the preferences are transferred.
Let’s revisit some of the studies from the previous section, many of which contain relevant findings on this topic.
In their 2020 survey experiment Cynthia McClintock and Joseph Cerrone explored voters’ satisfaction with RCV, runoff, and plurality, through a nationwide survey experiment.78 Their satisfaction score was composed of seven post-treatment indicators, including perceived fairness (of results) and perceived legitimacy (of the winner).79 As the figure below shows, voters were less satisfied with RCV than with runoff or plurality, and especially less satisfied when the ultimate winner of the RCV contest did not receive the most first-preference votes (compared to no real dissatisfaction with non-majority winners in a plurality context and much less dissatisfaction than when the ultimate winner in a runoff was not the top vote-getter in the first round).
Figure 4 | Under RCV, voters much less satisfied with a likely/actual “come-from-behind victory”

Two recent papers, from Jesse Clark and Crowder-Meyer et al., found RCV decreased voter satisfaction and confidence, at least at first. Following a set of election experiments, Crowder-Meyer et al. reported “initial experience with RCV produces dissatisfaction, including lower levels of trust in how votes are being counted and in the officials overseeing elections. However, after voting in a second series of ranked-choice contests (in a later experiment), these negative perceptions dissipate.”80
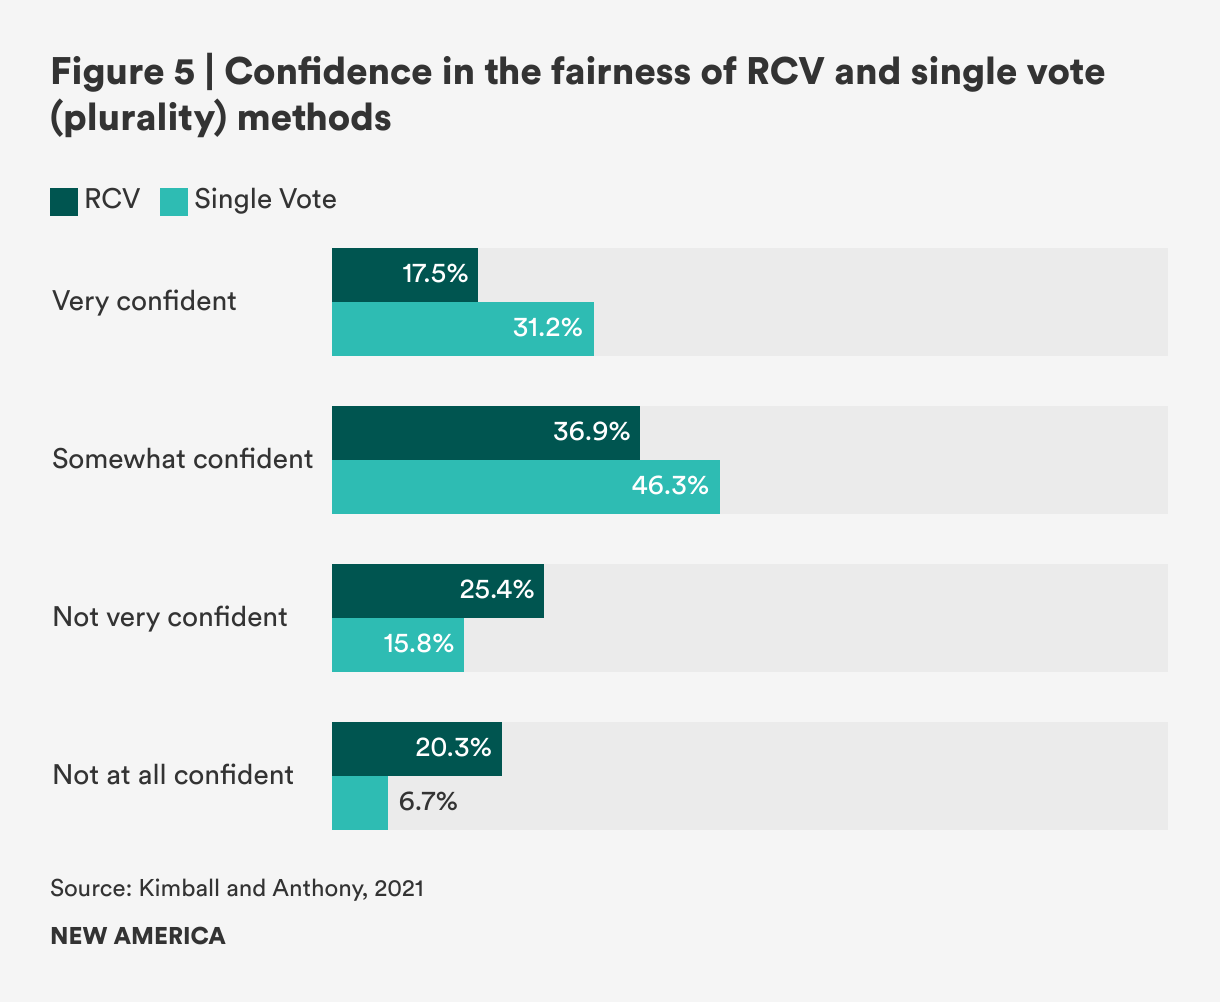
In Kimball and Anthony’s 2021 survey experiment, majorities of respondents reported being somewhat or very confident in the fairness of each voting method, but respondents rated the single vote method higher than RCV. They also found that varying the description of each voting rule did not significantly affect fairness ratings of either voting system, nor did providing a more thorough explanation of voting rules, including how RCV’s vote transfer system works. Figure 5 compares the distribution of ratings of both voting rules in terms of voter confidence that the method produces a fair outcome.81
One recent article does suggest a link between RCV and higher fairness ratings. "Electoral Systems and Political Attitudes: Experimental Evidence," by Sean Fischer, Amber Hye-Yon Lee, Yphtach Lelkes, found in their election game experiment that moving from a plurality to an RCV system had no impact on perceived fairness or satisfaction with the outcomes, but the gap between how winners and losers perceived the fairness of the election was smaller under RCV than plurality. The gap was especially narrow when RCV was combined with five political parties. The article also suggests that increasing the number of parties increases overall satisfaction and decreases the winner-loser gap in satisfaction with results (though RCV and proportional systems with three and four parties are no better on winner-loser gap than plurality systems).82
Fischer et al. validate previous findings that winning, more than which voting system is used, affects citizen attitudes toward the electoral process—winners are more likely to be satisfied with results and perceive the election as fair, while losers feel the opposite, especially in majoritarian winner-take-all elections.83 But their laboratory setting was detached from real-world U.S. partisan politics. There were no Democrats or Republicans; generic teams stood in for political parties. Furthermore, the finding that winning has a stronger impact on democratic legitimacy, rather than steer us away from prioritizing voting reform (as the discussion of turnout effects may have done, for example), points us back toward reforms like RCV and STV, which are designed to make more people feel like winners—or at least, to soften the blow of losing.
Unfortunately, such reforms are already deeply partisan, thanks in large part to Maine. The Maine Republican Party’s opposition to RCV has been internalized by co-partisans nationwide. Americans who identify as Republican have a clear aversion to RCV. In their 2021 paper discussed earlier, Cerrone and McClintock concluded that this is an expression of general wariness of reform. When they asked about the likelihood that the voter would support changing U.S. electoral rules, 65 percent of Republicans overall indicated opposition to changing electoral rules, compared to 12 percent of Democrats and 36 percent of Independents.
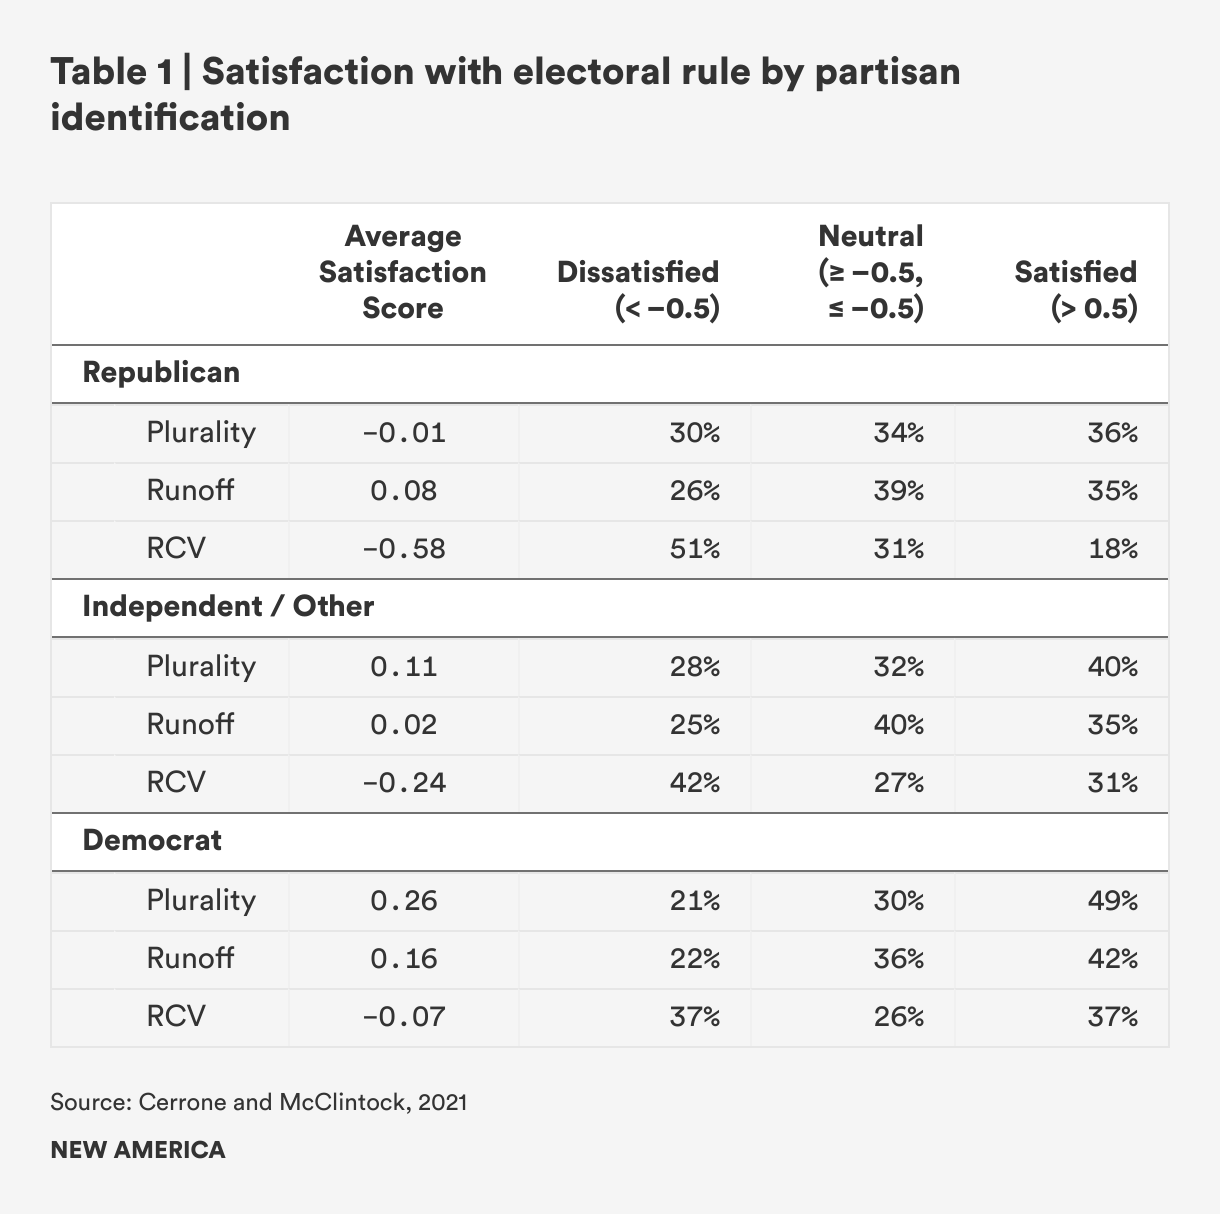
From a philosophical point of view, Republicans’ opposition makes sense; Republicans are conservative, conservatives don’t want to change institutions. And yet, as previously shown in Table 1, “Satisfaction with electoral rule by partisan ID,” Republicans indicated lower satisfaction and higher dissatisfaction with the status quo plurality-system than their Democratic counterparts. Moreover, as a recent paper from the Independence Institute, The Conservative Case for Ranked Choice Voting points out: “Conservatism is not a monolithic creed; the Republican Party should not be a monolithic entity… RCV provides a greater opportunity for other conservative and Republican voices to be heard, beyond those currently dominating the Republican party (and who have been less than successful at building a competitive Republican coalition, let alone a Republican majority).”84
Once again, the city-based data (which constitutes the majority of U.S. RCV literature) indicates voters tend to grow more satisfied with RCV with time and practice, while early Maine data and nationwide surveys suggest that such an evolution might be slowed or precluded by national political forces, particularly partisanship. Outside of Alaska, a state with a strong tradition of independent politics, and Utah, where Republicans face minimal electoral challenge from Democrats in a single-winner arrangement irrespective of voting method, Republican-led jurisdictions are not rushing to adopt RCV.85
This partisan polarization around RCV suggests a significant challenge for nationwide implementation. However, widespread voter ignorance of ranked-choice voting still provides an opportunity.
The research suggests that RCV advocates should actively engage GOP voters, elites, and decision-makers more explicitly, and place more emphasis on the problems of plurality and why “come-from-behind victories” are no less fair than non-majority plurality victories.
To maximize the effect of these outreach and messaging efforts, researchers will have to supply more and better evidence. During a June 2021 conference of the Electoral Reform Research Group, scholars and practitioners offered a number of suggestions along these lines, including the following:
- Describe a case where Republicans would have won with RCV in order to tease out the effect of partisanship versus ideological beliefs about RCV and electoral reform overall.
- Run counterfactual simulations on other electoral contexts, e.g., what if the recent U.S. Senate elections in Georgia had used RCV?
- Analyze the Republican Party of Virginia's use of RCV in their 2021 gubernatorial primary. What worked? Did it produce a candidate with appeal beyond GOP voters?
- Message test to figure out why RCV is such a hard sell on the right, in particular, where maintaining the status quo offers no clear political benefit to Republicans? Specifically, what are the best ways to move a conservative voter today to see reform not as a progressive hijacking?
- Poll Republicans on reforms that they believe would benefit them. If the Maine experience is turning Republicans off RCV more than their conservative stance toward institutional reform, polling them on reforms that would benefit them electorally should show that. And if it does, that suggests that perhaps the best way for Republicans to warm up to RCV is for it to help them win a few times.
Additionally, we suggest looking more closely at variation in attitudes toward RCV and reform among Republican voters. Some Republicans are more supportive of reform than others.
Citations
- Francis Neely, Lisel Blash, and Corey Cook, An Assessment of Ranked-Choice Voting in the San Francisco 2004 Election (Daly City, CA: Public Research Institute, San Francisco State University, 2005); Richard E. DeLeon, San Francisco and instant runoff voting: An analysis of the SFSU/PRI exit poll data assessing voter opinions about ranked choice voting in the November 2004 Board of Supervisors elections (San Francisco, CA, September 2005), source.
- Francis Neely, Lisel Blash, and Corey Cook, An Assessment of Ranked-Choice Voting in the San Francisco 2005 Election (Daly City, CA: Public Research Institute, San Francisco State University, 2006).
- Ranked Choice Voting: 2009 City Of Minneapolis Municipal Elections (St. Cloud State University Survey, 2009), available at source; Michael Lewyn, “Two Cheers for Instant Runoff Voting,” Phoenix Law Review 6 (2012): 117-136, available at SSRN: source.
- The poll was conducted by Edison Research, with a sample size of 4,020 voters. Jay Wendland and Erin Carman, Ranking Works? An Examination Of Ranked Choice Voting In New York City (Amherst, New York: Daemen College, 2021), source.
- Sarah John and Andrew Douglas, “Candidate Civility and Voter Engagement in Seven Cities with Ranked Choice Voting,” National Civic Review 106 (Spring 2017): 25-29, source.
- Joseph A. Coll, “Demographic Disparities Using Ranked-Choice Voting? Ranking Difficulty, Under-Voting, and the 2020 Democratic Primary,” Politics and Governance 9 (June 2021): 293–305, source.
- Richard L. Cole, Delbert A. Taebel, and Richard L. Engstrom, “Cumulative Voting in a Municipal Election: a Note on Voter Reactions and Electoral Consequences,” Political Research Quarterly 43 (1990): 191-199, source; Richard Engstrom and Charles Barrilleaux, "Native Americans and Cumulative Voting: The Sisseton-Wahpeton Sioux," Social Science Quarterly 72 (June 1991): 388-393, source; Robert R. Brischetto and Richard L. Engstrom, “Cumulative Voting and Latino Representation: Exit Surveys in Fifteen Texas Communities,” Social Science Quarterly 78 no. 4 (1997): 973-991, source; David Kimball and Martha Kropf, “Voter Competence with Cumulative Voting,” Social Science Quarterly 97 (September 2016): 619–35, source.
- David Kimball and Joseph P. Anthony, “Public Perceptions of Alternative Voting Systems: Results from a National Survey Experiment,” April 16, 2021, source.
- Melody Crowder-Meyer, Shana Kushner Gadarian, and Jessica Trounstine, “Ranking Candidates in Local Elections: Neither Panacea nor Catastrophe,” January 21, 2021, available at SSRN: source.
- Martha Kropf and David C. Kimball, Helping America Vote: The Limits of Election Reform (New York, NY: Routledge, 2012).
- Neely, Blash, and Cook, An Assessment of Ranked-Choice Voting in the San Francisco 2004 Election.
- Francis Neely, Corey Cook, and Lisel Blash, An Assessment of Ranked-Choice Voting in the San Francisco 2005 Election (Daly City, CA: Public Research Institute, San Francisco State University, 2006).
- Todd Donovan, “Self-Reported Understanding of Ranked-Choice Voting,” Social Science Quarterly 100 (August 2019): 1768–76, source.
- Joseph A. Coll, “Demographic Disparities Using Ranked‐Choice Voting? Ranking Difficulty, Under‐Voting, and the 2020 Democratic Primary,” Politics and Governance 9 (June 2021), source.
- Wendland and Carman, Ranking Works? An Examination Of Ranked Choice Voting In New York City.
- Pedro Hernandez, Jennifer Pae, Madeline Brown, and Theodore Landsman, Voter Experience with Ranked Choice Voting in San Francisco (Takoma Park, MD: FairVote, 2018).
- Lindsay Nielson, “Ranked Choice Voting and Attitudes toward Democracy in the United States: Results from a Survey Experiment,” Politics and Policy 45 (August 2017): 535-570, source.
- David Schultz and Kristi Rendahl, Evaluating Ranked Choice Voting in the 2009Minneapolis Elections: A Report for the Minneapolis Elections Department (St. Paul, Minnesota: Hamline University, 2010).
- Wendland and Carman, Ranking Works? An Examination Of Ranked Choice Voting In New York City.
- Cheryl Boudreau, Jonathan Colner, and Scott A. MacKenzie, “Ranked-Choice Voting and Political Expression: How Voting Aids Narrow the Gap between Informed and Uninformed Citizens,” March 24, 2021, available at SSRN: source.
- Boudreau, Colner, and MacKenzie.
- Craig M. Burnett and Vladimir Kogan, “Ballot (and Voter) ‘Exhaustion’ Under InstantRunoff Voting: An Examination of Four Ranked‐Choice Elections,” Electoral Studies 37 (March 2015): 41‐49, source.
- Francis Neely and Corey Cook, “Whose Votes Count? Undervotes, Overvotes, and Ranking in San Francisco’s Instant‐Runoff Elections,” American Politics Research 36 (July 2008): 530‐554, source.
- David Kimball and Joseph Anthony, “Voter Participation with Ranked Choice Voting in the United States,” (working paper, presented at the 2016 American Political Science Association Annual Meeting, Philadelphia, PA, October 2016), source.
- Lawrence R. Jacobs and Joanne M. Miller, Rank Choice Voting and the 2013 Minneapolis Elections (Minneapolis, MN: University of Minnesota, February 2014).
- Francis Neely and Corey Cook, “Whose Votes Count? Undervotes, Overvotes, and Ranking in San Francisco's Instant-Runoff Elections.”
- Neely and Cook; Jacobs and Miller; Francis Neely and Jason A. McDaniel, “Overvoting and the Equality of Voice under Instant-Runoff Voting in San Francisco,” California Journal of Politics and Policy 7, no. 4 (2015): 1-27, source.
- Lindsay Nielson, “Ranked Choice Voting and Attitudes toward Democracy in the United States: Results from a Survey Experiment.”
- Neely and McDaniel, “Overvoting and the Equality of Voice under Instant-Runoff Voting in San Francisco.”
- Note that the elections sampled used optical scan voting machines which detect overvote errors and give the voters the opportunity to start over. Neely and Cook, “Whose Votes Count? Undervotes, Overvotes, and Ranking in San Francisco's Instant-Runoff Elections.”
- Jason Maloy, “Voting Error across Multiple Ballot Types: Results from Super Tuesday (2020) Experiments in Four American States,” September 24, 2020, available at SSRN: source; See also, J. S. Maloy and Matthew Ward, “The Impact of Input Rules and Ballot Options on Voting Error: An Experimental Analysis,” Politics and Governance 9 (June 2021): 306–318, source;
- For example, if a voter ranks two candidates as their second choice, that second choice vote doesn’t count but their first-preference vote will stand.
- See, for example, Benjamin Reilly, “Ranked Choice Voting in Australia and America: Do Voters Follow Party Cues?,” Politics and Governance 9 (June 2021): 271–279, source.
- Neely and Cook, “Whose Votes Count? Undervotes, Overvotes, and Ranking in San Francisco's Instant-Runoff Elections.”
- Boudreau, Colner, and MacKenzie, “Ranked-Choice Voting and Political Expression: How Voting Aids Narrow the Gap between Informed and Uninformed Citizens.”
- Neely and McDaniel, “Overvoting and the Equality of Voice under Instant-Runoff Voting in San Francisco”; Kimball and Anthony, "Voter Participation with Ranked Choice Voting in the United States.”
- Neely and Cook, “Whose Votes Count?”
- See, for example, Jason Maloy, “Voting Error across Multiple Ballot Types: Results from Super Tuesday (2020) Experiments in Four American States,” and Neely and Cook, “Whose Votes Count?”
- Neely and Cook, “Whose Votes Count?”; Boudreau, Colner, and MacKenzie, “Ranked-Choice Voting and Political Expression: How Voting Aids Narrow the Gap between Informed and Uninformed Citizens.”
- The 100 Million Project: The Untold Story of American Non-Voters (Knight Foundation, 2020), source
- Curtis Wood, “Voter turnout in city elections,” Urban Affairs Review 38 (November 2002): 209–231, source.
- Without partisan cues, voters are also more likely to rely on cognitive biases that disproportionately penalize candidates of color. See, for example, Crowder-Meyer, Kushner Gadarian, and Trounstine, “Ranking Candidates in Local Elections: Neither Panacea nor Catastrophe.”
- The 100 Million Project: The Untold Story of American Non-Voters; Robert P. Jones, Daniel Cox, Betsy Cooper, and Rachel Lienesch, The Divide Over America’s Future: 1950 or 2050: Findings from the 2016 American Values Survey? (Washington, DC: Public Religion Research Institute, 2016), source.
- Kimball and Anthony, "Voter Participation with Ranked Choice Voting in the United States.”
- Kimball and Anthony.
- Jason A. McDaniel, “Electoral Rules and Voter Turnout in Mayoral Elections: An Analysis of Ranked-Choice Voting," (paper prepared for the Election Systems, Reform, and Administration Conference in Philadelphia, PA, July 11–12, 2019), source.
- Jason McDaniel, “Writing the Rules to Rank the Candidates: Examining the Impact of Instant‐Runoff Voting on Racial Group Turnout in San Francisco Mayoral Elections,” Journal of Urban Affairs 38 (November 2016): 387–408, source.
- Eamon McGinn, Rating rankings: Effect of instant run‐off voting on participation and civility (Unpublished manuscript, October 2020), source.
- In “Writing the Rules to Rank the Candidates,” McDaniel used mutilevel linear regression models that controlled for incumbency, candidate race, precinct socioeconomic status, education, population age, and racial diversity.
- Courtney L. Juelich and Joseph A. Coll, “Ranked Choice Voting and Youth Voter Turnout: The Roles of Campaign Civility and Candidate Contact,” Politics and Governance 9 (June 2021): 319–331, source. Jeulich and Coll’s findings, it should be noted, were based on self-reported turnout levels that significantly surpassed actual turnout from the election years in question. In addition, though they used a sophisticated approach to matching—usually within‐state, if not within county, and with controls on population size, racial and ethnic composition, political characteristics, US region, and socio‐economic conditions—they didn’t compare the differences in turnout between the matched cities prior to RCV adoption, which means we can’t judge if or the extent to which higher levels of engagement were already present in the places that adopted RCV, and even may have predisposed those cities to reform.
- Kimball and Anthony, “Voter Participation with Ranked Choice Voting in the United States.” The authors estimated that a competitive mayoral contest also reduces vote drop‐off, but by about 11 points, a much smaller effect compared to RCV consolidated election schedule RCV.
- Kimball and Anthony.
- For more voter drop-off between elections, see Declan Alvidrez, Primary Runoff Elections and Decline in Voter Turnout (Takoma Park, MD: FairVote, December 2020), source.
- Lee Drutman, What We Know about Congressional Primaries and Congressional Primary Reform (Washington, DC: New America, 2021), source.
- Seth J. Hill, “Sidestepping Primary Reform: Political Action in Response to Institutional Change,” Political Science Research and Methods (2020): 1–17, source: “Point estimates suggest an increase in turnout of 1.5 percentage points in open primaries and 6.1 percentage points in nonpartisan primaries.” See also Matthew J. Geras and Michael H. Crespin, “The Effect of Open and Closed Primaries on Voter Turnout,” in Routledge Handbook of Primary Elections, ed. Robert G. Boatright, 1st ed. (New York: Routledge, 2018), 133–46, source: “For both the Republicans and the Democrats, voter turnout was highest during open primaries and lowest during hybrid primaries. The predicted difference in turnout between these two types of primaries appears to amount to about 2 to 3 percent.”
- Drutman, What We Know about Congressional Primaries and Congressional Primary Reform.
- Neal Caren, “Big City, Big Turnout? Electoral Participation in American Cities,” Journal of Urban Affairs 29 (February 2007): 31-46, source.
- Jason Jurjevich, Phil Keisling, Kevin Rancik, Carson Gorecki, and Stephanie Hawke, Who Votes for Mayor? (Portland, OR: Portland State University, 2016), source.
- For example, when Baltimore shifted to even-year elections in 2016, voter turnout in local races jumped from just 13 percent to 60 percent, and research indicates that participation in local elections in cities doubles in on-cycle November elections: Zoltan Hajnal, Vladimir Kogan, and G. Agustin Markarian, “Who Votes: City Election Timing and Voter Composition,” American Political Science Review (2021): 1–10, doi:10.1017/S0003055421000915; Caren, “Big City, Big Turnout?”; Jan Brennan, “Increasing Voter Turnout in Local Elections,” National Civic Review 109 (Spring 2020), source.
- Sarah John and Andrew Douglas, “Candidate Civility and Voter Engagement in Seven Cities with Ranked Choice Voting," National Civic Review 106 (Spring 2017): 25-29, source. The November 2013 survey included 2,400 voters in three RCV cities (Minneapolis, St.Paul, Cambridge), and seven non-RCV cities (Boston, Seattle, Des Moines, Cedar Rapids, Tulsa, Lowell, MA and Worcester, MA); the November 2014 survey was of 2,400 voters in eleven Californian cities: the four Bay Area cities that use RCV (Berkeley, Oakland, San Francisco, and San Leandro) and seven control cities.
- Ranked Choice Voting: 2009 City of Minneapolis Municipal Elections (St. Cloud State University Survey, December 2009); Neely, Blash, and Cook, An Assessment Of Ranked-choice Voting In The San Francisco 2004 Election.
- The Santa Fe survey was conducted by Lonna Atkeson and FairVote New Mexico, who covered eight voting centers in Santa Fe for the full polling day and two additional centers for a half day each. Santa Fe Voters Support Ranked Choice Voting and Have High Confidence in City Elections (FairVote New Mexico, 2018), source; Wendland and Carman, Ranking Works? An Examination Of Ranked Choice Voting In New York City.
- Nielson, “Ranked Choice Voting and Attitudes toward Democracy in the United States: Results from a Survey Experiment.”
- The Electoral Reform Research Group is a collaboration between New America’s Political Reform program, the Unite America Institute, Stanford’s CDDRL, the American Enterprise Institute, formed in 2019, source.
- Andre Blais, Carolina Plescia, Semra Sevi, “Choosing to Vote As Usual,” February 12, 2021, available at SSRN: source.
- Kimball and Anthony, “Public Perceptions of Alternative Voting Systems.”
- Joseph Cerrone and Cynthia McClintock, “Ranked-Choice Voting, Runoff, and Democracy: Insights from Maine and Other U.S. States,” January 19, 2021, available at SSRN: source.
- Kimball and Anthony, “Public Perceptions of Alternative Voting Systems.”
- Blais, Plescia, Sevi, “Choosing to Vote As Usual.”
- McCarthy and Santucci, “Ranked Choice Voting as a Generational Issue in Modern America Politics.” They also found young people express greater dissatisfaction with “the way democracy works in the United States,” and that dissatisfaction is significantly associated with RCV support.
- Again, while only the exception here seems to be Maine, its status as the only state to have already implemented RCV for federal elections gives it added weight, and signals to those promoting RCV beyond the local level that more work will be necessary to overcome partisan identity-based resistance. Bitter partisan battles leading up to implementation, followed by Republicans’ disappointment with their candidate losing the 2018 House race in a “come-from-behind victory.” Cerrone and McClintock, “Ranked-Choice Voting, Runoff, and Democracy: Insights from Maine and Other U.S. States”; Blais, Plescia, and Sevi, “Choosing to Vote As Usual”; Crowder-Meyer, Kushner Gadarian, and Trounstine, “Ranking Candidates in Local Elections: Neither Panacea nor Catastrophe”; Kimball and Anthony, “Public Perceptions of Alternative Voting Systems.”
- On the other hand, experience may not be enough to reconcile reported values with preference: a Maine study found a large majority of voters prefer a system that produces a majority winner, but an exit poll of Maine voters conducted during the first election to use RCV rules found only 47 percent of voters approved of the electoral reform. Katherine Gillespie, Carrie Levan, and L. Sandy Maisel, “Ranked Choice Voting in Maine: Were the Critics' Fears Justified?” Unpublished manuscript, Colby College, 2019.
- McCarthy and Santucci, “Ranked-Choice Voting as a Generational Issue in Modern American Politics.”
- Lee Drutman, William Galston, and Tod Lindberg, Spoiler Alert: Why Americans’ Desires for a Third Party Are Unlikely to Come True (Washington, DC: Democracy Fund Voter Study Group and New America, 2018), source; Nielsen, “Ranked Choice Voting and Attitudes toward Democracy in the United States: Results from a Survey Experiment.”
- FairVote New Mexico, Santa Fe Voters Support Ranked Choice Voting and Have High Confidence in City Elections.
- “Government Reform: Ranked Choice Voting, Redistricting by Citizen Commission and Multi-Member Districts: A Survey of American Voters,” Program for Public Consultation, School of Public Policy, University of Maryland, 2017, source.
- A cross-national study of public opinion by David Farrell and Ian McAllister concluded that, other things being equal, voters were more satisfied with how democracy worked in nations where people voted for candidates with preferential voting: “Voter satisfaction and electoral systems: Does preferential voting in candidate-centred systems make a difference?,” European Journal of Political Research 45 (August 2006): 723-749, source.
- While much of the article focused on Maine, the authors decided to survey U.S. voters nationwide on satisfaction with different systems, given the likelihood that Maine results would reflect the strongpartisan divisions over RCV in the state. To explain the choice, they cite Joseph Anthony, Amy Fried, Robert Glover, and David C. Kimball, “Ranked Choice Voting in Maine from the Perspective of Election Authorities,” (paper prepared for delivery at the annual meeting of the American Political Science Association, Washington, D.C., August 29-September 1, 2019).
- Other indicators used to measure voters’ satisfaction were usability, comprehensibility, transparency, representativeness, and support for adoption in the respondent's own state. Cerrone and McClintock, “Ranked-Choice Voting, Runoff, and Democracy Insights from Maine and Other U.S. States.”
- Crowder-Meyer, Kushner Gadarian, and Trounstine, “Ranking Candidates in Local Elections: Neither Panacea nor Catastrophe.” See also Jesse Clark, “Rank Deficiency? Analyzing the Costs and Benefits of Single-Winner Ranked-Choice Voting,” MIT Political Science Department Research Paper No. 2020-8, October 1, 2020, available at SSRN: source. Clark found the interaction between RCV and the ballot size had a significant impact on voter satisfaction as well.
- Kimball and Anthony, “Public Perceptions of Alternative Voting Systems.”
- Sean Fischer, Amber Hye-Yon Lee, and Yphtach Lelkes, “Electoral Systems and Political Attitudes: Experimental Evidence,” May 12, 2021, available at SSRN: source.
- Christopher J. Anderson and Christine A. Guillory, “Political Institutions and Satisfaction with Democracy: A Cross-National Analysis of Consensus and Majoritarian Systems,” The American Political Science Review 91, no. 1 (1997): 66–81; Shaun Bowler, Todd Donovan, Ola Listhaug, Christopher J. Anderson, and André Blais, Losers’ Consent: Elections and Democratic Legitimacy (Oxford: Oxford University Press, 2007).
- Barry Fagin, The Conservative Case for Ranked Choice Voting (Denver, CO: Independence Institute, 2021), source. Utah’s more cautious and decentralized approach to introducing RCV provides an interesting case study for conservatives. The state’s Republican-led local options legislation is a time-limited pilot program with the goal of collecting data before pushing for statewide use.
- Other (more limited) exceptions include the Republican Party of Virginia’s decision to use RCV for its 2021 nominating convention, and the Indiana GOP decision to use RCV for party primary elections in 2020. Deb Otis and Nora Dell, “Ranked Choice Results and Analysis from Virginia Republican Convention,” FairVote, May 10, 2021, source; Adam Ginsberg, “Indiana GOP to Use Ranked Choice Voting in Virtual Convention,” FairVote, May 14, 2020, source.