
Foreclosure and Eviction Analysis Tool User Guide
Abstract
The Foreclosure and Eviction Tool (FEAT) is a web application, developed by New America’s Future of Land and Housing program in partnership with DataKind and over a dozen cities and counties across the United States. FEAT is intended to help local leaders understand where housing loss is most acute, when it is occurring, and who is most impacted.
This user guide provides an overview of FEAT, as well as detailed guidance on how to use the tool, from formatting eviction and foreclosure data to interpreting its results.
For more information on FEAT, please visit the project webpage.
Acknowledgments
The development of the Foreclosure and Eviction Analysis Tool (FEAT) web application was made possible by the work of several at New America and DataKind, including Sabiha Zainulbhai, Yuliya Panfil, Dona Stewart, Caitlin Augustin, Larry Kilroy, Jacob Harris, Matt Harris, Kayla Wilding, Sophia Harms, and Rachel Ford. We’d also like to thank Sarah James from Apollo UX Design, whose visual design and user research helped shape FEAT.
We’d also like to thank the DataKind project team who initially developed FEAT, including Mallory Sheff, Emily Yelverton, Manu Sharma, Rachel Thurston, Allie Surina, Joe Grange, Jeff Markey, Ozzie Liu, and Proma Bhattacharyya.
We’d also like to extend our gratitude to the individuals from FEAT partner sites, who helped develop and test the tool and lent their knowledge and expertise to improving the housing loss data infrastructure.
And lastly, we would like to thank all our colleagues at New America who assisted with this report: Jodi Narde, Kelley Gardner, Naomi Morduch Toubman, and Joe Wilkes.
Downloads
Section 1. What is the Foreclosure and Eviction Analysis Tool (FEAT)?
The Foreclosure and Eviction Tool (FEAT) is a web application, developed by New America’s Future of Land and Housing program in partnership with DataKind and over a dozen cities and counties across the United States.
What Does FEAT Do?
FEAT is for local leaders looking to generate data-driven insights about evictions and foreclosures in their community, whether it’s for policymaking, research, or advocacy purposes.
FEAT processes and analyzes address housing loss data, appends demographic and socioeconomic information from the U.S. Census Bureau’s American Community Survey, and produces summaries of housing loss over time. These insights are intended to help local housing leaders track and better understand evictions and foreclosures in their communities.
What Data Do I Need to Use FEAT?
FEAT can process three types of data (individually or in combination to produce a collective housing loss analysis):
- Eviction filings;
- Eviction judgments; and
- Mortgage foreclosures.
You, the user, are responsible for sourcing and uploading eviction or mortgage foreclosure data into FEAT, in the format specified in Section 2, and for ensuring that the data uploaded is as accurate as possible and representative of the geographic region and time period intended. Data must be at the level of an individual eviction or foreclosure (i.e., not aggregated) and must include at least one geographic identifier (e.g., street address of the property or census tract) and one date for each record.
Users can also access FEAT analysis on eviction filing data from Eviction Lab’s Eviction Tracking System—a database of eviction filing data across approximately 10 states and 30 cities.
How Do I Access FEAT?
FEAT can be found at www.featapp.org. Users need to register by creating a login and password to use FEAT.
Who Should Use FEAT?
FEAT is intended for anyone looking to generate data-driven insights about evictions and foreclosures in their community whether it’s for policy, research, or advocacy. In particular, FEAT will be useful for local leaders across the U.S., including those in city and county housing departments, legal aid organizations, researchers, journalists, and community-based advocates.
What Insights Does FEAT Produce?
FEAT presents housing loss analysis in two ways: 1) a ZIP file of all FEAT analysis and underlying data for download; and 2) a dashboard visualizing select FEAT results. FEAT produces geocoded datasets, one for each type of housing loss provided, as well as a dataset that aggregates evictions and foreclosures at the census tract level. FEAT also appends five-year 2017–2021 American Community Survey data to housing loss data, also at the census tract level, and conducts correlation analysis to show which demographic and housing variables have strong associations with housing loss. Lastly, FEAT produces a heat map of housing loss data, as well as the necessary files for creating maps in GIS or QGIS.
Is My Data Kept Private?
User content (uploaded files containing eviction or foreclosure data) are processed by FEAT to create outputs (both HTML and downloadable ZIP files). Once processed, the user content is destroyed by an automated process within 24 hours of upload and is no longer stored by FEAT. For more information, please visit our Terms of Service.
What Else Should I Know Before Using FEAT?
FEAT is a data transformation tool that produces housing loss analyses based on uploaded data. The reliability of the analyses is only as good as the housing loss data that a user uploads into FEAT. It is important that users take into account any data limitations when interpreting FEAT results and exercise caution when using and sharing this analysis.
Who Should I Contact If I Have Questions about FEAT?
Detailed information about the data and methods FEAT uses is available in this user guide. You can use the Feedback button within FEAT to submit a technical glitch, bug, or data questions. You can also email Sabiha Zainulbhai at zainulbhai@newamerica.org with any additional questions .
Section 2. FEAT Input Data
There are two ways that users can access housing loss analysis through FEAT. Users can upload their own data, or users can use eviction filing data from Eviction Lab’s Eviction Tracking System (if available for their city or state). This section provides detailed information on the data requirements for data uploaded to FEAT.
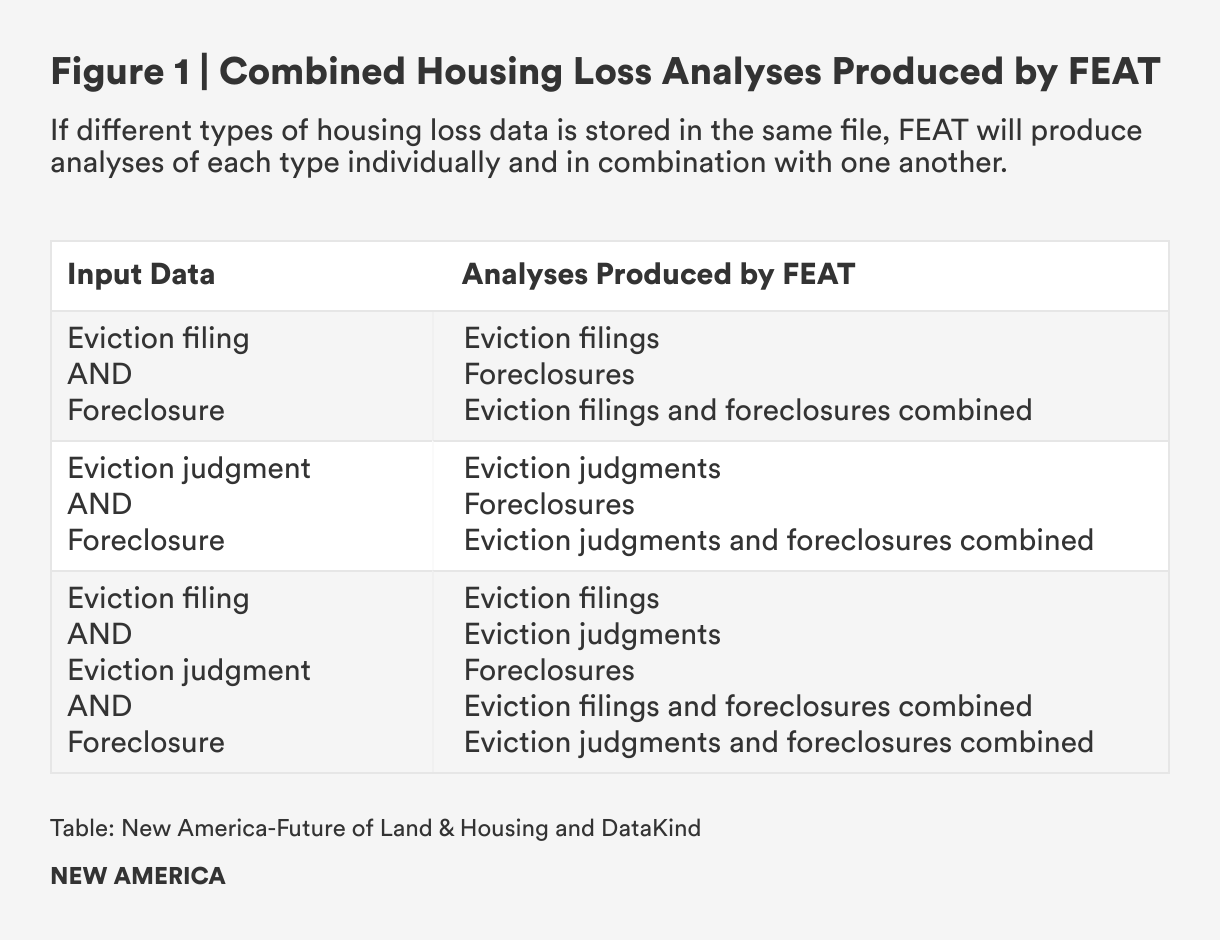
If only one form of housing loss data (eviction filings, eviction judgments, or mortgage foreclosures) is uploaded, FEAT will produce analysis on that form of housing loss. If a user uploads a combination of eviction and foreclosure data, however, FEAT will combine the two to calculate a combined housing loss metric. Figure 1 below depicts the analyses that FEAT will produce based on the type(s) of housing loss data that a user inputs.
Using Your Own Housing Loss Data in FEAT
Users uploading their own housing loss data must ensure that their input data meets the following criteria (a template for storing FEAT input data can be found here):
- Data must be stored in a .csv (comma-separated values) file no larger than 20 MB in size.
- Data must be recorded at the level of individual evictions or foreclosures (in other words, not aggregated).
- Data must contain the following columns:
- Street address (column label: street_address_1);
- City (column label: city);
- Zip code (column label: zip_code);
- State (column label: state);
- Date to indicate when the event happened (column label: date); and
- Type to indicate data type where options are eviction_filing, eviction_judgment, and foreclosure (column label: type).
- Data can cover any time period from 2016 to present day, and it will be analyzed by individual years and across all years included in the data. Please note that if you upload data that does not cover a full calendar year, FEAT will process and analyze the data as if it’s a full year of data. Users should use caution in uploading and interpreting FEAT results based on partial years of data.
Figure 2 specifies the data fields required for each type of housing loss, including any data formatting specifications.
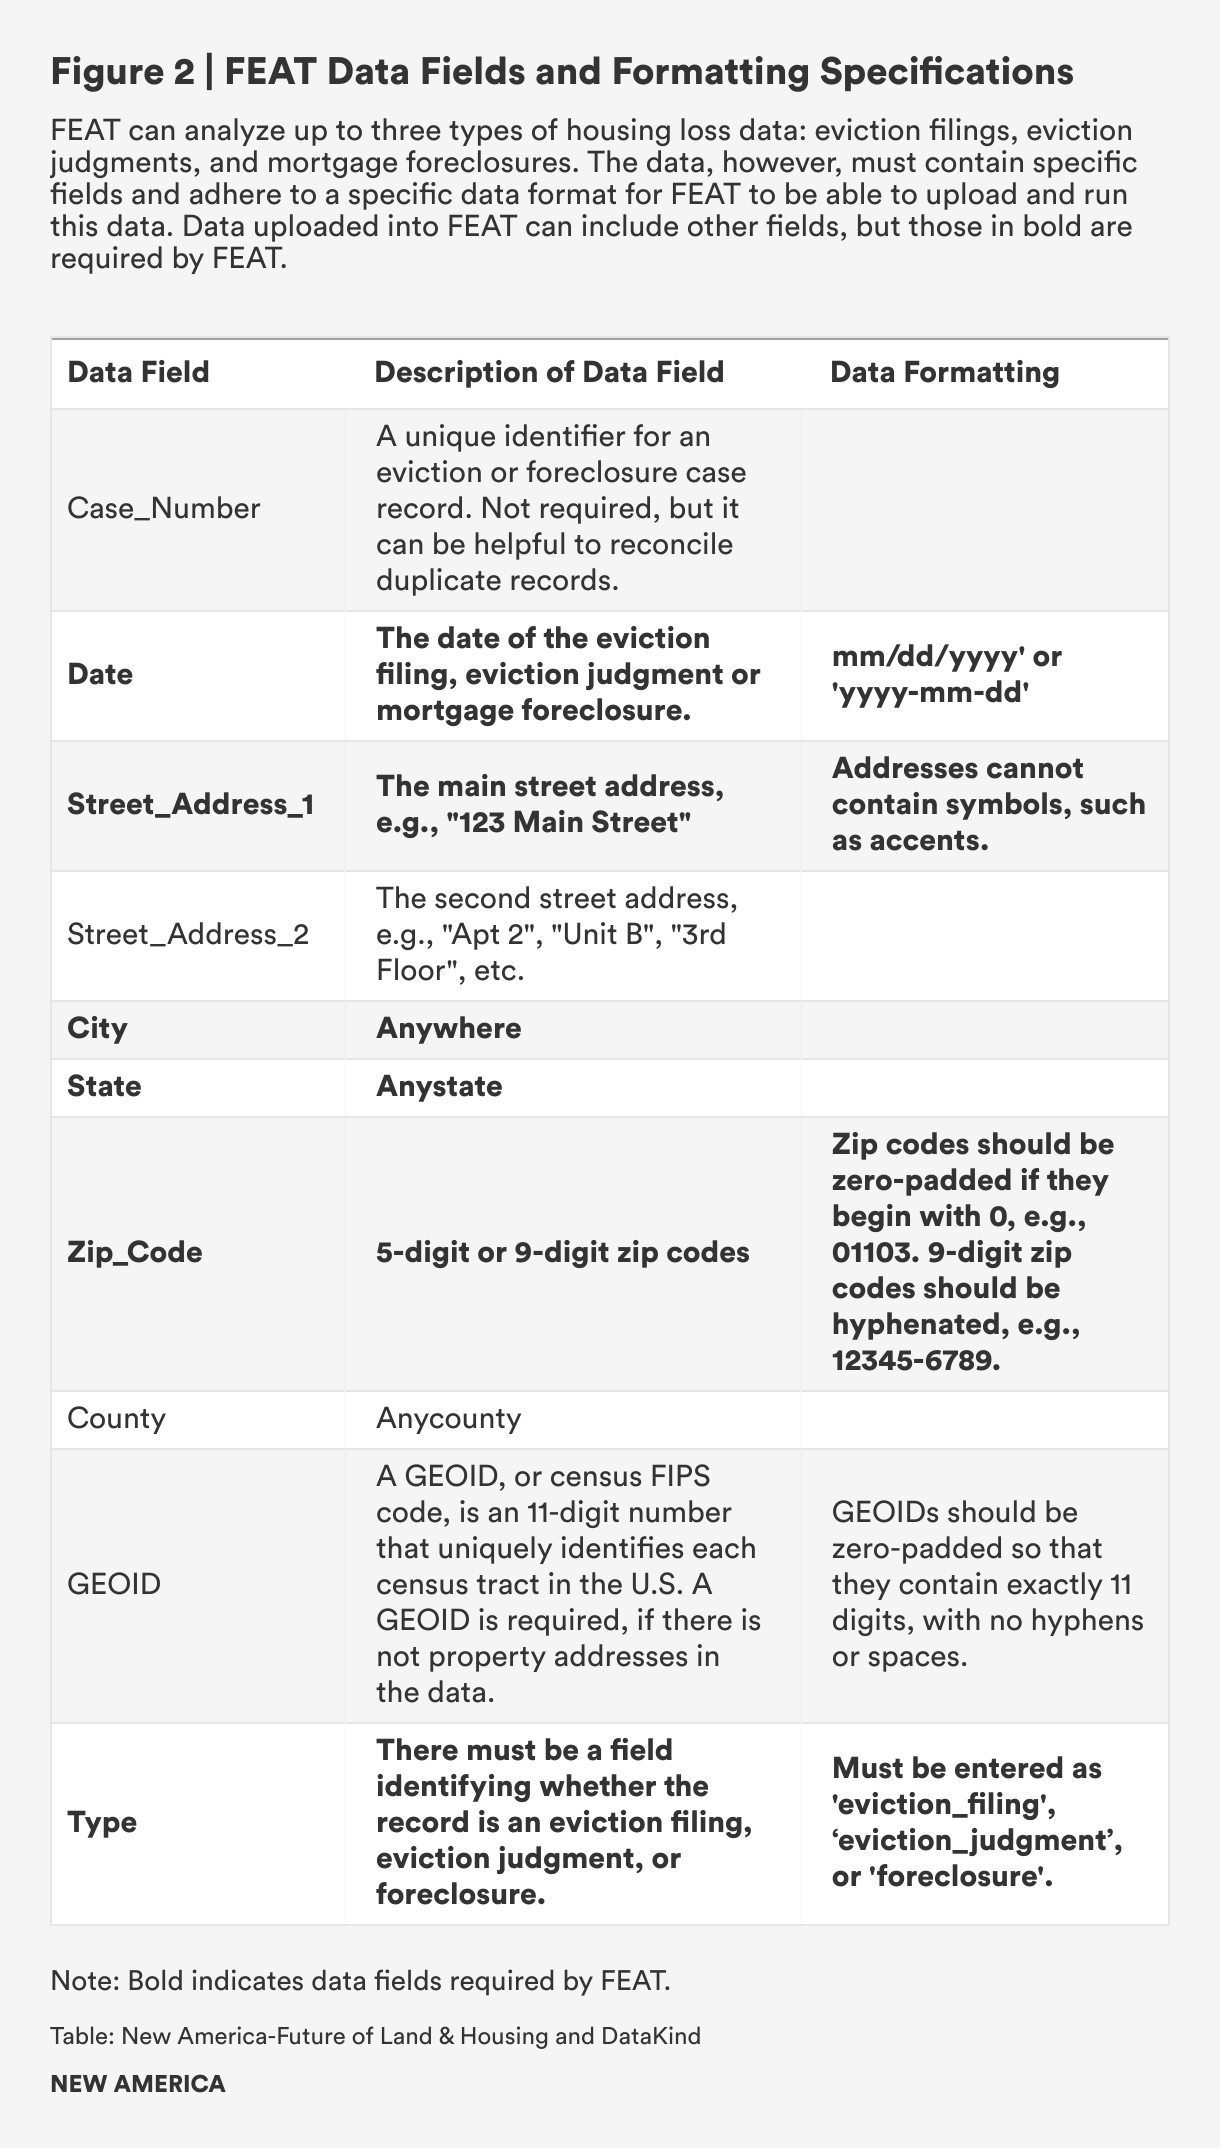
Note that other data fields can be present in your input file. In other words, users do not have to delete all other data beyond the required fields in their input data file for FEAT to run.
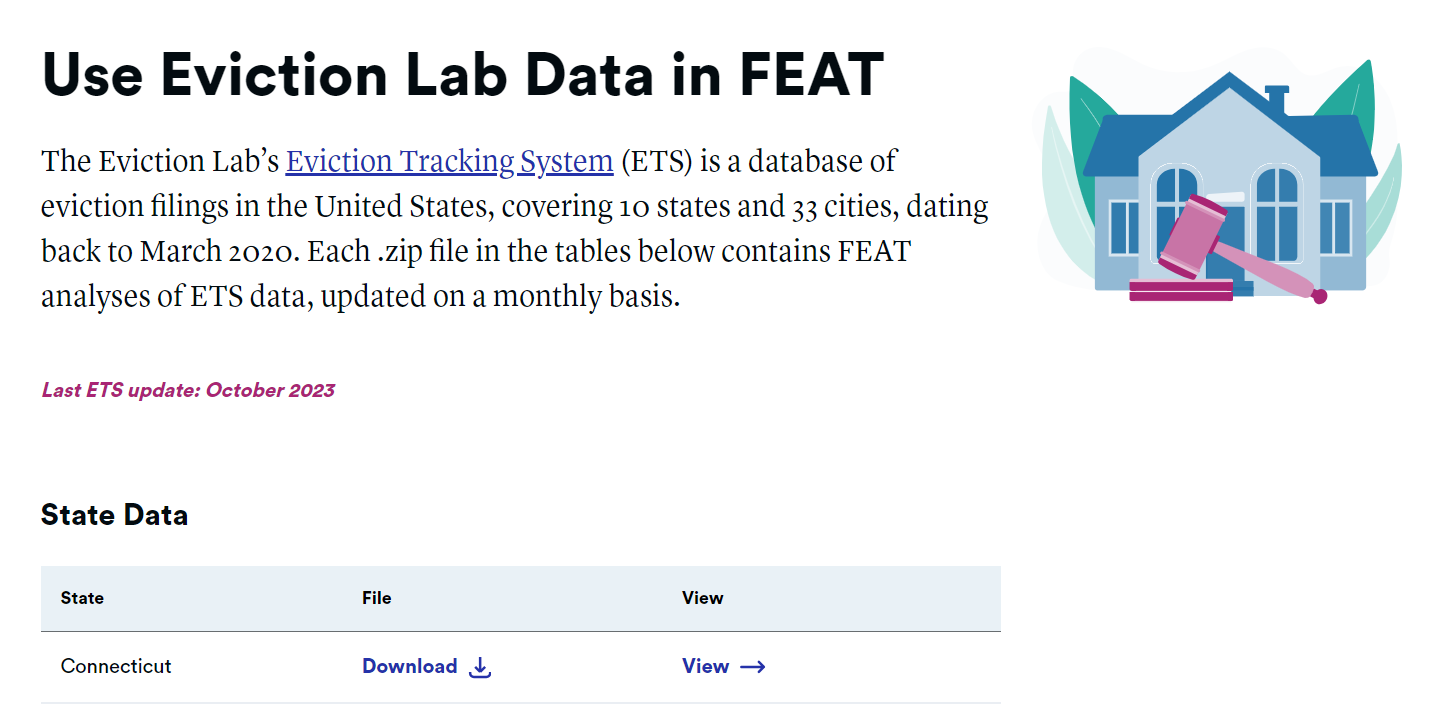
Using Eviction Lab’s Eviction Tracking System Data
FEAT can also run eviction filing data from Eviction Lab’s Eviction Tracking System (ETS) and produce the same analysis as it would on housing loss data sourced by a user. The ETS is a database of eviction filings across approximately 10 states and 30 cities. The ETS tracks eviction filings from March 2020 until present day, and Eviction Lab updates this data on a monthly basis.
FEAT includes only the states and cities for which the ETS provides data at the census tract level, since FEAT analysis is at the census tract level. This means that the cities and states for which ETS data is provided at the zip code level are not included in FEAT. In Section 3, we discuss the methods used to process and produce analysis on ETS data in more detail.
Section 3. FEAT Methods
FEAT is a data transformation tool that runs through a series of data processing and analysis steps to produce useful insights on housing loss. The length of time that FEAT takes to run will depend on the volume of data being processed.
This section walks through each step that FEAT performs on housing loss data.
Map Input Data to Required Fields
FEAT validates that the housing loss data is stored in the proper format (.csv) and contains the required data fields (i.e., street_address_1, city, state, zip_code, date, and type). FEAT also checks that the data format meets the criteria laid out in Figure 1.
Clean and Drop Duplicate or Missing Data
FEAT cleans the input data and drops data that it cannot parse. FEAT drops data for the following reasons:
- Duplicate records that are identical on every required data field;
- Records missing required information (i.e., a date, address, or GEOID); or
- Records that have a date that is before 2016.
FEAT outputs uploaded data in the address_errors output file. See the Address Errors information in Section 4 for more detail.
Geocode Data Using Census Batch Geocoder API
FEAT geocodes data to the census tract. To translate addresses into their corresponding census tract IDs, or GEOIDs, FEAT standardizes the geographical identifier columns by converting them to uppercase, stripping any punctuation, and removing suffixes (e.g., apartment numbers or post office box numbers).
Then, FEAT uses one or more methods to match the address of the eviction or foreclosure record to the appropriate census tract. The method FEAT uses depends on the geographic location data included in the input data:
- If Address Data is Already Geocoded: If a census tract identifier (an 11-digit GEOID representing the combination of the 2-digit state, 3-digit county, and 6-digit tract code) is in the data, FEAT moves to the next step.
- If the Street Address Field Is Populated, but There Is No GEOID Data: FEAT uses the census.gov geocoder, and it submits addresses in batches to retrieve the GEOID and merge the found census tract information into the data. For all data input by the user, FEAT uses the 2020 census geocoder parameters. The parameter benchmark is set to Public_AR_Census2020 and the vintage is set to Census2020_Census2020.
It is important to note that any census tract level FEAT analysis only includes data that was successfully geocoded (i.e., matched to a census tract). According to the U.S. Census Bureau, there are several reasons why the census geocoder may be unable to match data, including:
- Address is non-residential or commercial;
- Housing unit may have been recently constructed and is not in our database yet;
- Local Addressing Authority changed the address, and changes are not yet reflected in our database;
- Address may be in a location where we are missing address range information; or
- Housing unit may have been destroyed/demolished.
It is important a user assesses what data is not geocoded by FEAT and thus dropped from some FEAT analysis. See Section 4 for more detail.
Summarize Data at Census Tract Level
Once FEAT has matched data to the relevant census tracts, FEAT aggregates the data by census tract and calculates housing loss summary statistics, including eviction or foreclosure totals, rates, and indices at the census tract level. FEAT conducts analysis individually on each type of housing loss, for each year of data uploaded and across the total years of data, and also provides analysis for combined housing loss (evictions and foreclosures), if a user uploads both types of data. See Section 4 for a more in-depth description of FEAT analysis.
Create a Time Series
FEAT organizes the data by month and year and creates a spreadsheet and time series chart that showcases housing loss totals over the course of a year.
Append Socio-Demographic and Housing Variables
This step utilizes the State and County FIPS Codes to source and append over 70 corresponding socio-demographic and housing variables from the five-year 2017–2021 American Community Survey (ACS) at the census tract level to the eviction or foreclosure data, using the census.gov API. This includes financial, housing, race and ethnicity, and other ACS variables from DP02 (selected social characteristics in the United States); DP03 (selected economic characteristics); DP04 (selected financial characteristics); and DP05 (demographic and housing estimates).
For a full list of ACS variables that FEAT appends, see our data dictionary here.
Calculate Correlation Analyses
FEAT calculates the Pearson correlation coefficient, or r value, between each ACS variable (using ACS 2017–2021 five-year estimates) and housing loss data. Specifically, FEAT calculates correlations on housing loss rates across all the geocoded census tracts in the data.
The Pearson correlation coefficient is calculated using the Pearson function in the stats module of the SciPy Python package. The methodology used to calculate this statistic is maintained here.
After each correlation is calculated, the correlation’s p value is compared to 0.05. If the p value correlation is less than or equal to 0.05, the correlation between the variable and that housing loss type rate is statistically significant at the 0.05 level. If it is higher than 0.05, the correlation between the variable and housing loss type rate is not statistically siginificant at the 0.05 level. This means it is more likely the true correlation between these variables is 0, and that the correlation coefficient we are observing with this set of data is an anomaly. For more details on interpretation of correlation analysis results, see Section 4.
Variables with a 0 variance have a 0 correlation. Census tracts that return an error value from the ACS for a variable (e.g., -888888888 or -666666666 in the ‘housing_loss_summary’ files due to insufficient or unavailable estimates) are excluded from the correlation analysis. For a complete list of estimate and annotation values and explanations, please see these ACS notes.
Get Geometry Data for Mapping
Lastly, FEAT sources census tract boundaries for the geographies from TIGERweb by the U.S. Census Bureau, creating a file containing geographical boundaries for the given county’s census tracts (.geojson) and a Geopackage file (.gpkg) for use with GIS software.
Eviction Lab Methods
Eviction Lab’s Eviction Tracking System (ETS) provides updated eviction filing data for 10 states and 33 cities in the United States, beginning in January 2020. In these jurisdictions, FEAT allows users to use ETS data to produce FEAT outputs.
Because ETS data is aggregated at the census tract or zip code level, and FEAT requires data to be at the individual record level, FEAT converts ETS data into a format that FEAT is able to run. Below are the steps that FEAT takes to process and analyze ETS eviction filing data.
- Download the following two files from Eviction Lab’s website: Cities and States. These files contain all of the eviction filing data housed in the ETS for cities and states, by month.
- For each of the files, the program cleans and formats the data to meet the criteria for FEAT. This includes disaggregating the data by census tract level, such that each eviction filing record is documented in its own row of data. The program also creates and populates data fields that FEAT requires that are not in the ETS data (e.g., “county” and “type”). Lastly, the program creates individual input files for each city and state in the ETS data.
- Each state and city input file is run through FEAT at the beginning of each month to reflect new Eviction Lab data.
- FEAT analysis for each state and city can be downloaded or viewed in the ‘Use Eviction Lab Data’ page of FEAT.
FEAT analysis of ETS data differs from analysis on housing loss data uploaded by a user in a few ways:
- 2010 Census Tract Boundaries: Eviction Lab uses 2010 census tract boundaries (as opposed to 2020 census tract boundaries).
- ACS Data: FEAT uses the 2015–2019 ACS five-year estimates, 2015–2019 ACS five-year data profiles, and the 2015–2019 five-year subject tables to run analysis on ETS data, to align with the 2010 census tract boundaries.
- TIGERweb: FEAT uses 2019 for the TIGERweb API call.
Users who access FEAT analysis of ETS data should use the following attribution: Peter Hepburn, Renee Louis, and Matthew Desmond, Eviction Tracking System: Version 1.0 (Princeton: Princeton University, 2020), www.evictionlab.org.
Section 4. FEAT Analysis and Interpretation
FEAT offers users two ways to access results: 1) a ZIP file for download, containing all the FEAT results and underlying data; and 2) a dashboard within the FEAT webpage, visualizing select insights from FEAT analysis. In this section, we provide more detail on the outputs from both of these.
Downloading FEAT Analysis in a ZIP File
The ZIP file will be named “feat_results_[date of run].” Below, we detail the analysis included in each folder contained in the ZIP file.
Full Datasets
In the full_datasets folder, there is a data_geocoded .csv, which contains the cleaned and standardized input data, along with the information required for geocoding for each type of housing loss in your input data. This geocoded data is still at the level of an individual eviction or foreclosure (i.e., not aggregated by census tract) and documents whether the census geocoder was able to match the data to an appropriate census tract, or GEOID. This data can be used to visualize where within a city or county housing loss is occuring (at the address level).
Data Summaries
In the data_summaries folder, there are four .csv files: acs_data_dictionary, housing_loss_summary, housing_loss_total, and address_errors.
Address Errors
The address_errors file contains the housing loss records that are excluded from all FEAT analysis and the reason why they are excluded. Below we list reasons why data may be dropped from FEAT analysis, as well as the error message that would be generated in this file:
- NA: The street_address_1 variable was blank or recorded as ‘n/a’ for this record.
- Duplicate: If the data in the required fields matches exactly for more than one record, FEAT will include one record in the data for analysis and drop any other duplicates.
- Error Parsing Address: The address was unable to be standardized. This occurs for example with PO Boxes, mobile home parks, addresses that specify a floor or entrance, and addresses that contain multiple street words (e.g., Drive and Boulevard).
- Unable to Find a Match in the Census Geocoder: The address appears to be valid, however the census geocoder could not find a match in their database. According to the census geocoder FAQs here, the possible reasons an address could not match are:
- Address is non-residential or commercial;
- Housing unit may have been recently constructed and is not in our database yet;
- Local Addressing Authority changed the address, and changes are not yet reflected in our database;
- Address may be in a location where we are missing address range information; or
- Housing unit may have been destroyed/demolished.
The Housing Loss Summary File
The housing_loss_summary file aggregates each type of housing loss data at the census tract level and calculates eviction or foreclosure totals, rates, and indices. These calculations are produced for individual years of data, as well as across all the years in the input data. Note that if there’s only one year of data, the total and yearly housing loss rates and indices will be the same.
Housing loss rates and indices are calculated using the following ACS variables: total renter occupied households and total owner occupied households with a mortgage.
Note: FEAT does not require a full year of data to produce analysis. Even a single record with a date in a given year will produce calculations. As such, users should exercise caution when interpreting the housing loss analysis and particular attention should be paid to the date range of the input data.
Housing Loss Rates
The methodology used to calculate eviction or foreclosure rates at the census tract level is as follows:
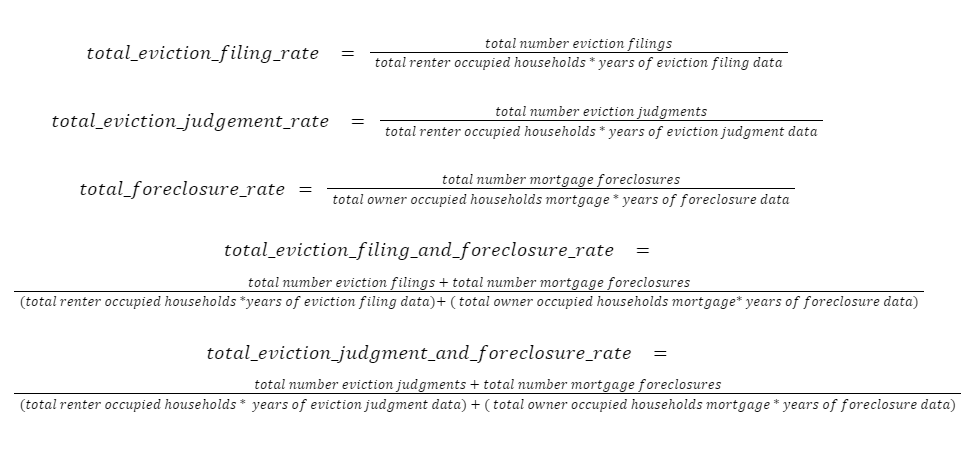
Housing Loss Rate Interpretation: The number of housing loss incidences per 100 households in an area (e.g., a 6 percent eviction filing rate means that 6 evictions were filed for every 100 renter households in a geographic region).
Housing Loss Indices
FEAT also produces housing loss indices, which is the ratio of the given census tract’s overall housing loss rate to the rate of the geographic scope of the input data, whether it’s at the county, city, or state level. For example, if the input data covers a county, housing loss indices would be calculated as follows:
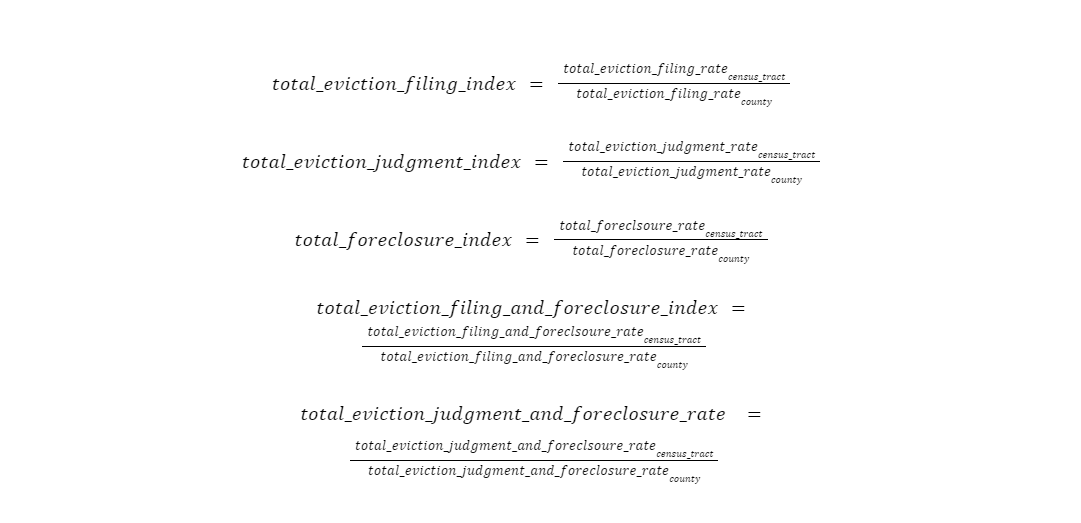
Housing Loss Index Interpretation: A housing loss index assesses which census tracts have the most severe housing loss relative to other tracts within that geographic scope. A housing loss index value of “1” denotes an average value (i.e., the housing loss rate of that census tract is exactly in line with that of the geography as a whole). Values less than 1 indicate lower than average housing loss, and values over 1 indicate higher than average housing loss relative to the rest of the geography. These values can be expressed in terms of their relation to the average: A value of “2” means that housing loss in the tract occurs twice as often as the rest of the county, a value of “3” means that it occurs three times as often, and so on.
Housing Loss Totals
FEAT produces a spreadsheet that aggregates data and includes housing loss totals and rates across all census tracts in the input data.
ACS Data Dictionary
FEAT sources over 70 variables from the U.S. Census Bureau’s American Community Survey. For a full list of ACS variables that FEAT appends, see our data dictionary here.
Analysis Plots
The analysis_plots folder contains analysis of the total housing loss over time, as well as correlation analysis between the ACS variables and each type of housing loss (as well as the combined housing loss) in the input data.
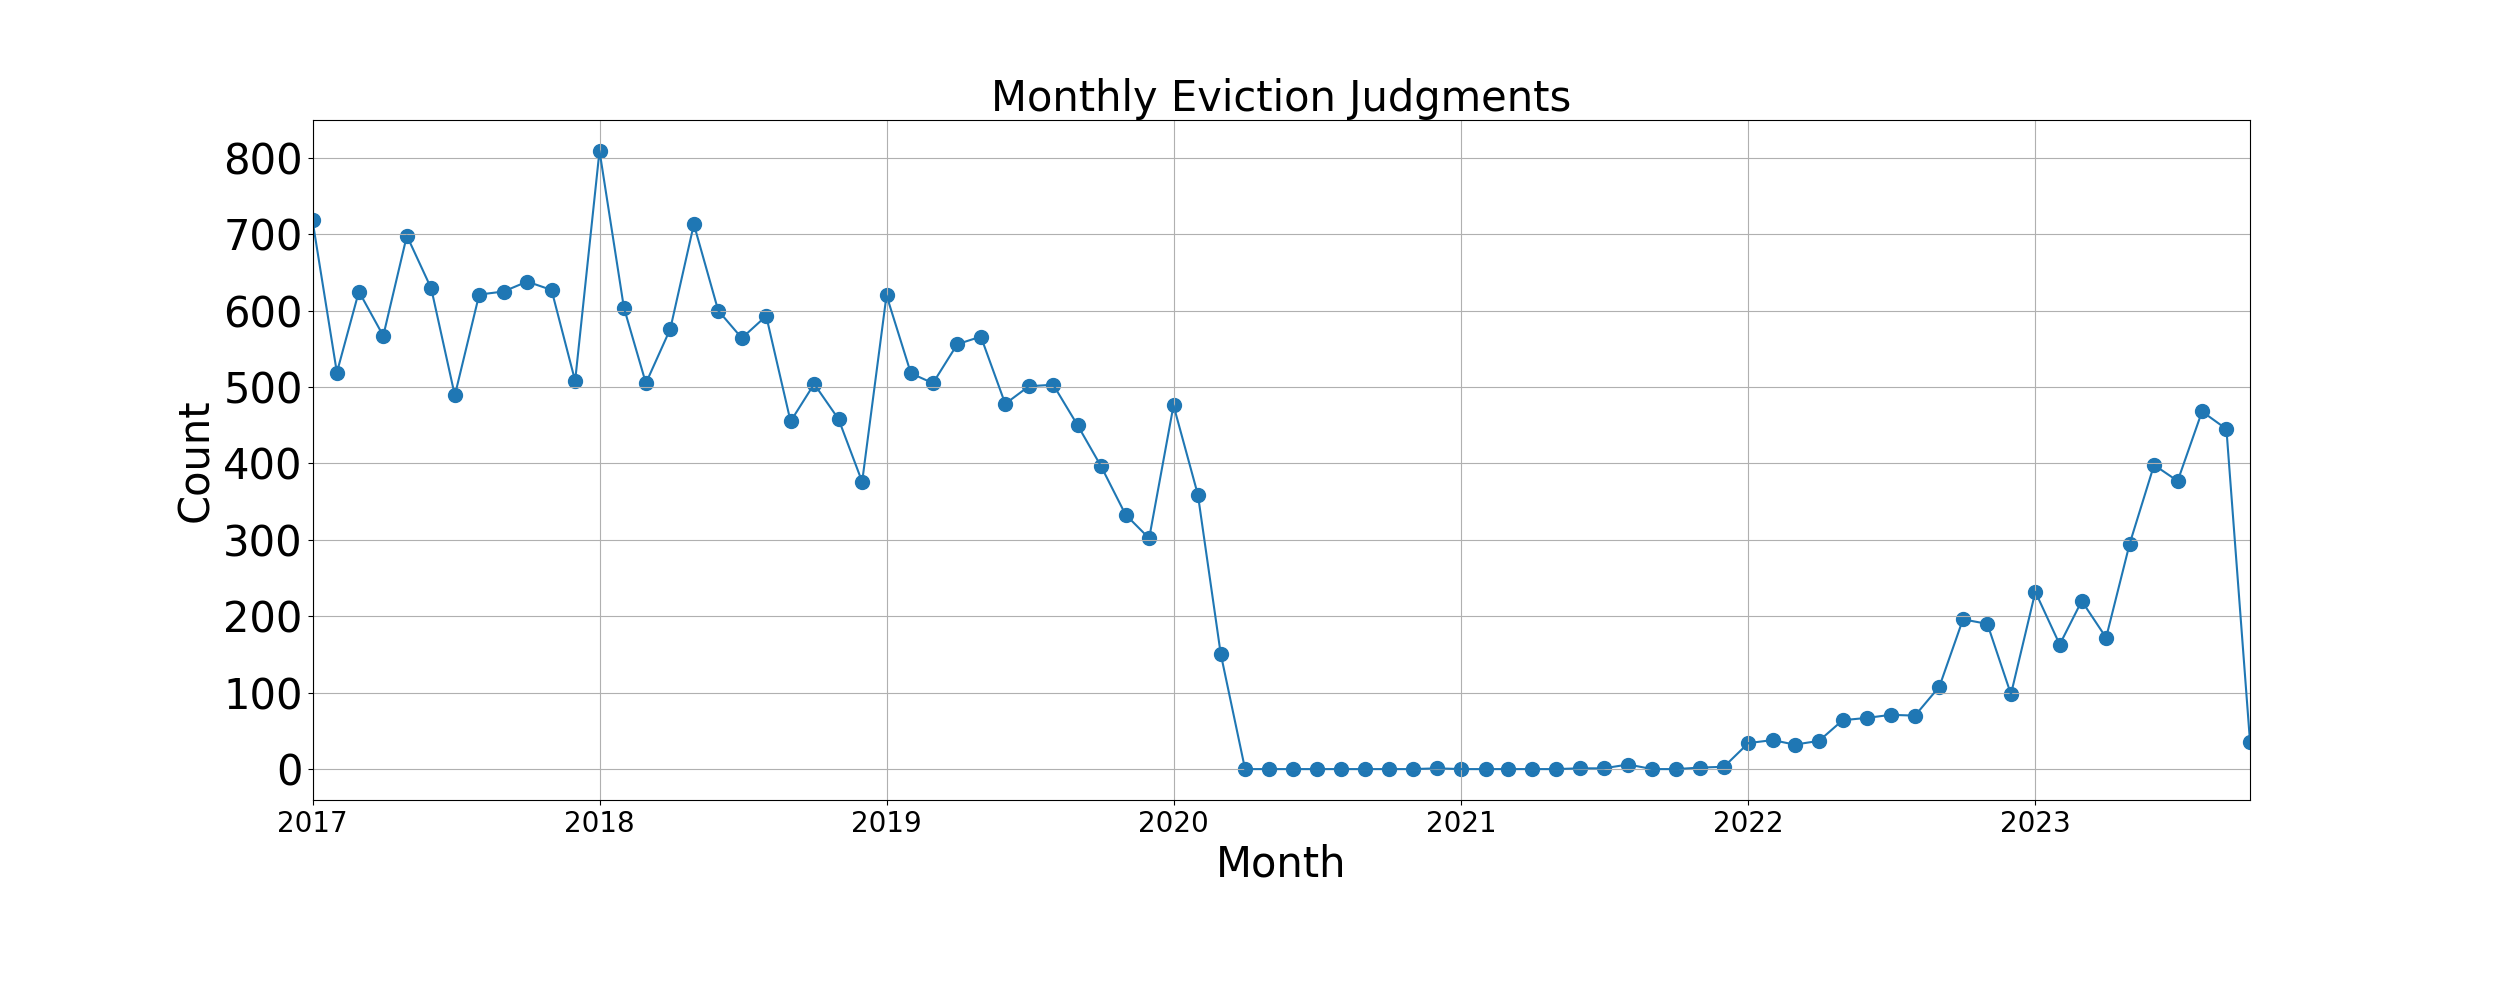
Time Series
FEAT produces a .csv file that aggregates housing loss data by month and year for each type of housing loss in the input data.
In addition, FEAT produces a time series chart by housing loss type that visualizes the total housing loss counts by month.
Correlation Analysis Bar Charts and Scatter Plots
The correlation analysis is intended to demonstrate the strength of the relationship between each kind of housing loss and over 70 ACS socioeconomic, demographic, and housing variables, to assess the characteristics of the neighborhoods most at risk of housing loss. There is a correlation analysis folder for each kind of housing loss data, containing a bar chart of significant correlation results, a .csv that includes the correlation coefficients and results of statistical testing, and a series of scatter plots visualizing the relationships.
The Pearson correlation coefficient, or r value, ranges from -1 to 1 and indicates the strength of the linear relationship between the ACS variable and the housing loss variable. Generally, Pearson correlation coefficients above 0.7 or below -0.7 are described as “strong” associations, values between 0.4 and 0.6 or -0.4 and -0.6 are described as “moderate” associations, and values between -0.3 and 0.3 are described as “weak” associations.1
It is important to note that these relationships should not be interpreted as casual. That is, if race is found to be strongly and statistically significantly correlated with housing loss, we cannot conclude that worse housing loss is due to the racial composition of a neighborhood or that neighborhoods with a higher proportion of a certain race face higher rates of housing loss. We can only conclude that neighborhoods with higher racial composition are likely to experience higher rates of eviction in the jurisdiction being analyzed.
It should also be noted that correlation calculations on datasets with fewer than 30 observations should not be considered reliable, as the sample size is too small.
FEAT outputs a .csv, titled total_[type]_rate_all_correlation_results, within an analysis plots folder that includes all of the correlation results. For each ACS variable and housing loss type, the .csv details the Pearson correlation coefficient, the strength of association, the direction of association, the p value, and whether the correlation is statistically significant (p value is less than or equal to 0.05).
Variables that cannot be included in a correlation calculation, such as those that have no variation, are recorded as -666 in this file.
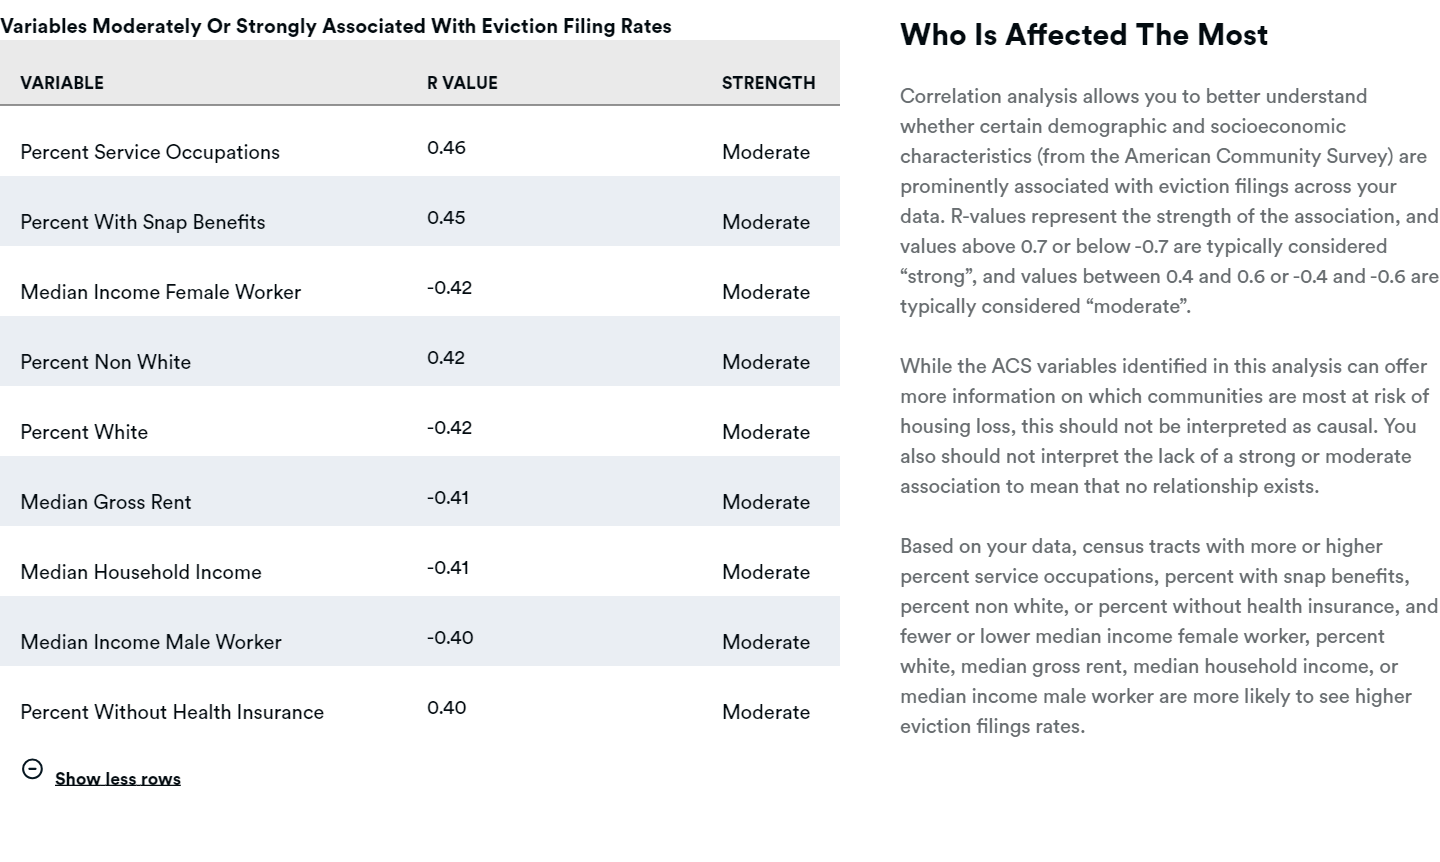
FEAT also produces a bar chart that shows the ACS variables. The bar chart shows the correlation coefficients of statistically significant ACS variables that are either moderately or strongly associated with housing loss, organized by strength of association (highest to lowest).
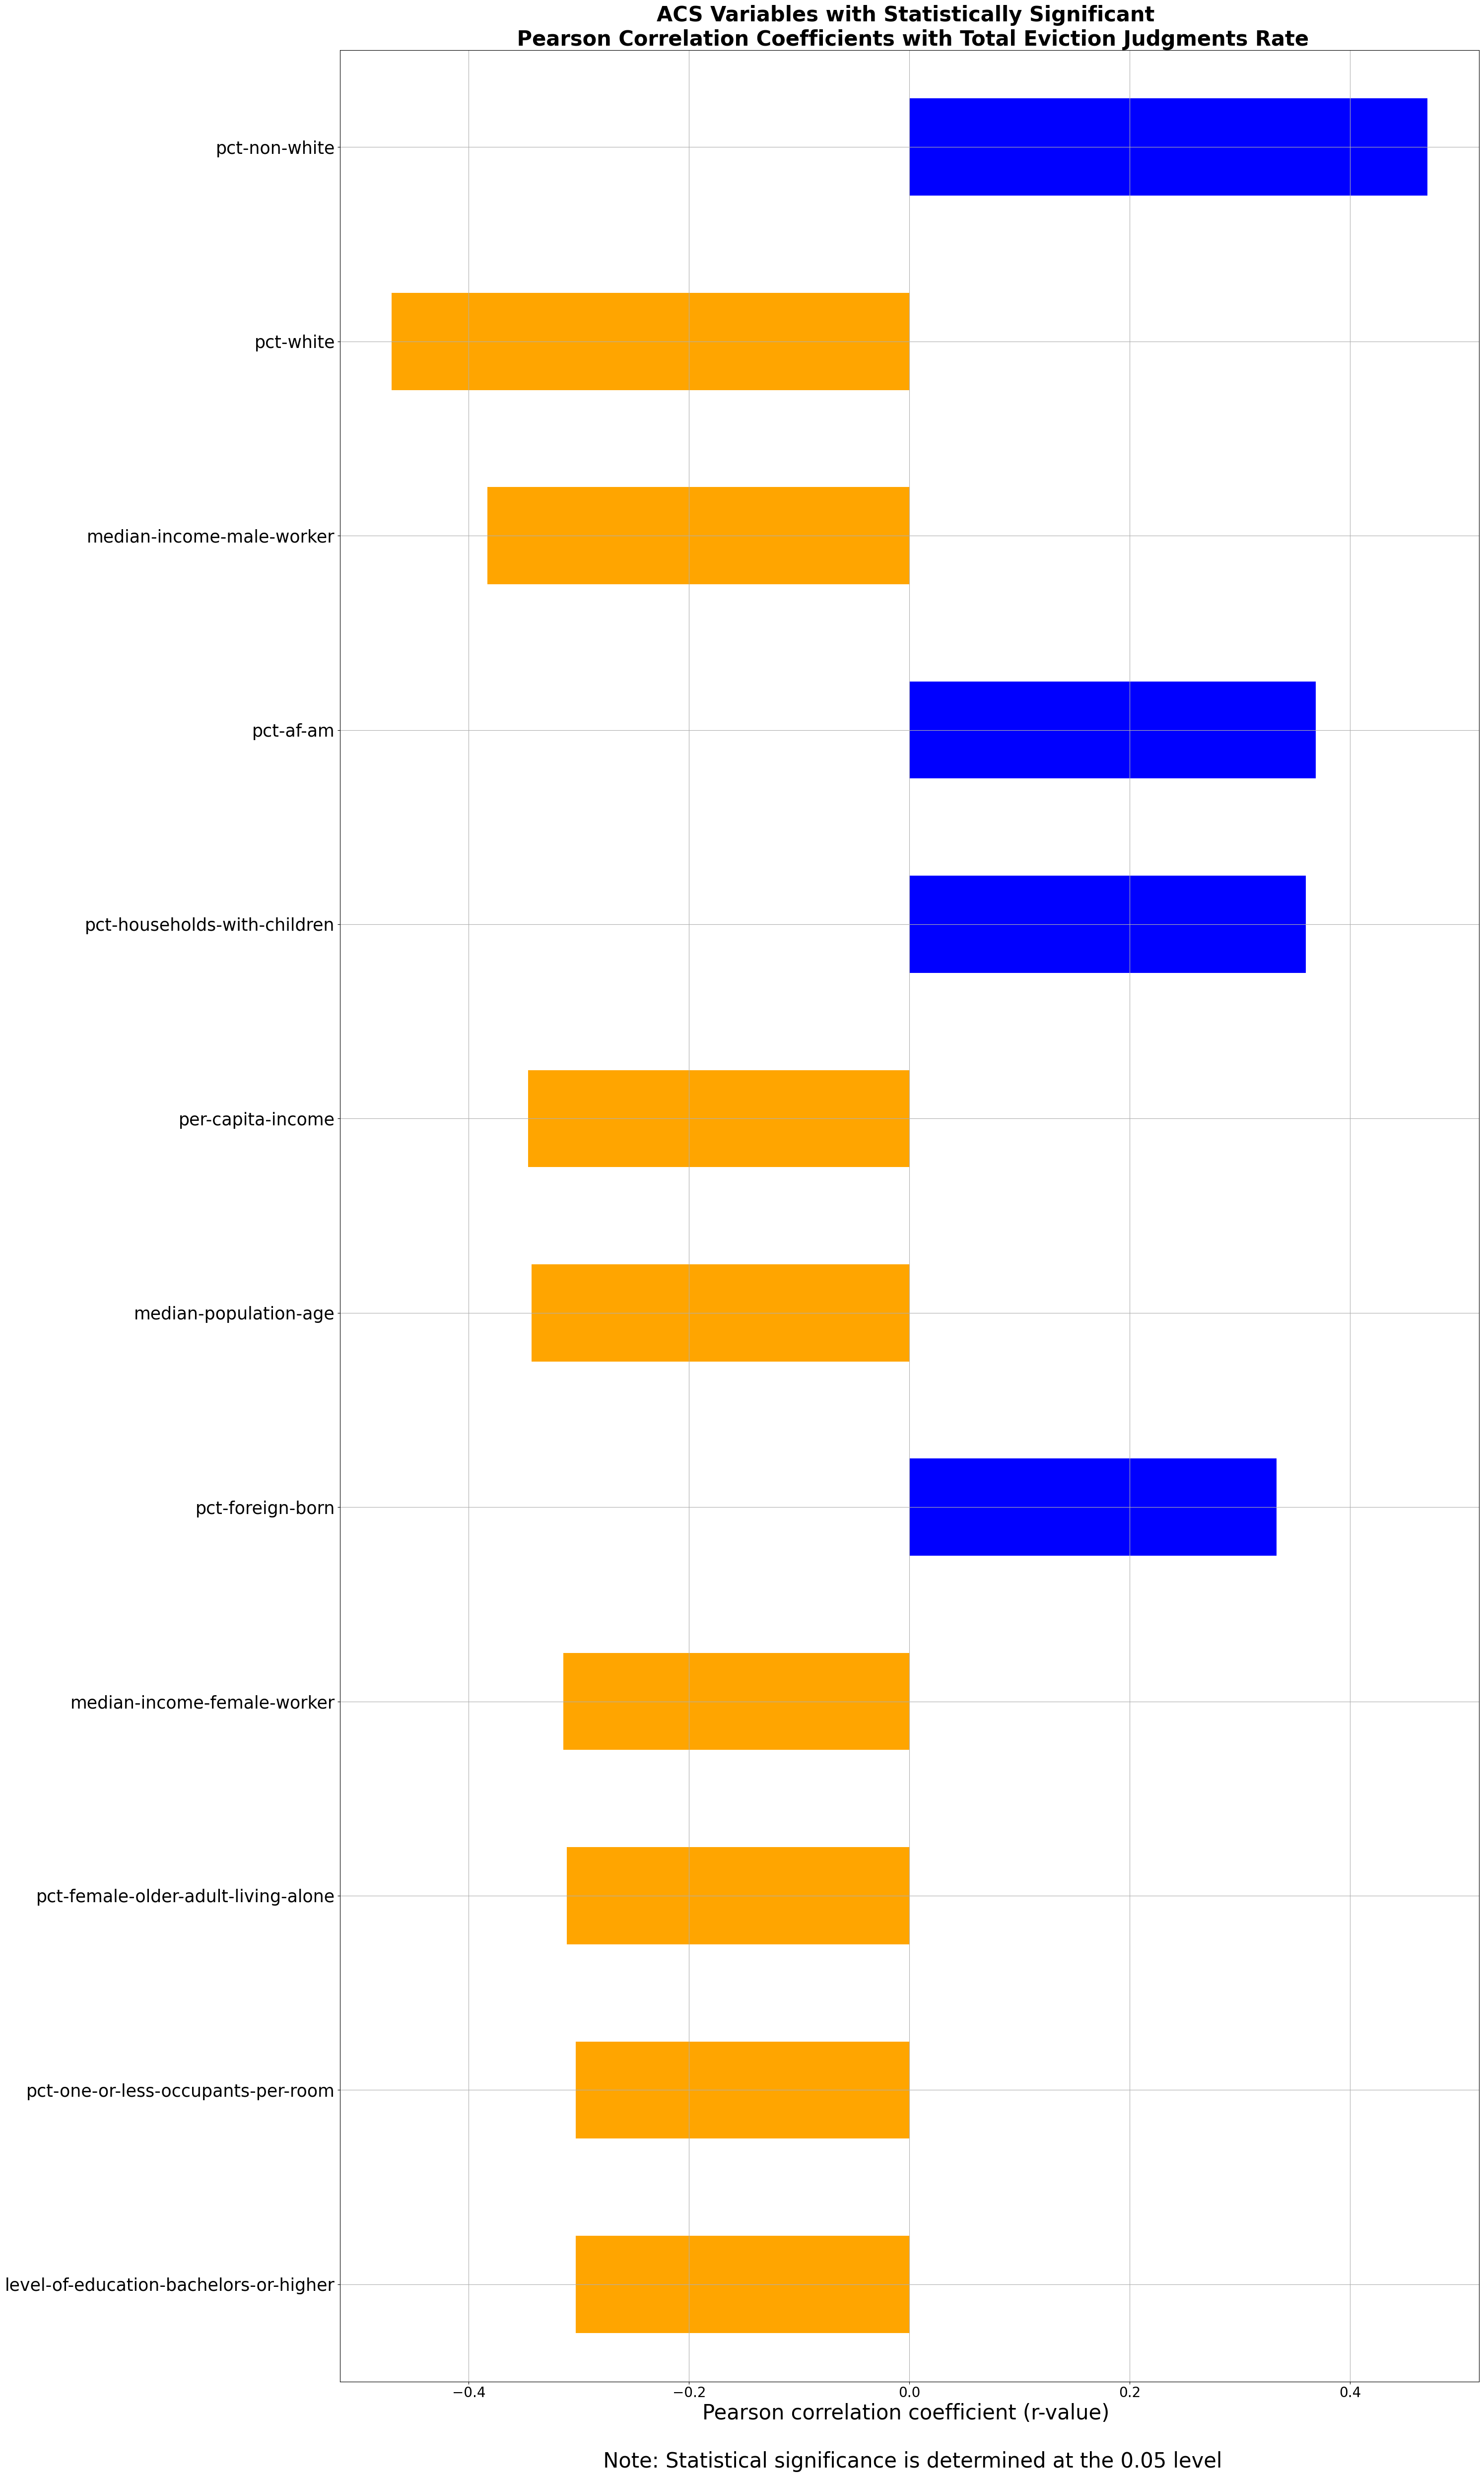
In the chart above, using the statistically significant, positive, and relatively strong correlation coefficient for percent of non-white households and eviction filings, the relationship can be interpreted as follows: Census tracts with a higher percentage of non-white households are likely to experience higher rates of eviction filings than census tracts with fewer non-white residents. In other words, census tracts with more non-white households tend to face higher risk of eviction than census tracts with fewer non-white households.
FEAT also outputs scatter plots for each ACS variable that meets the same criteria.
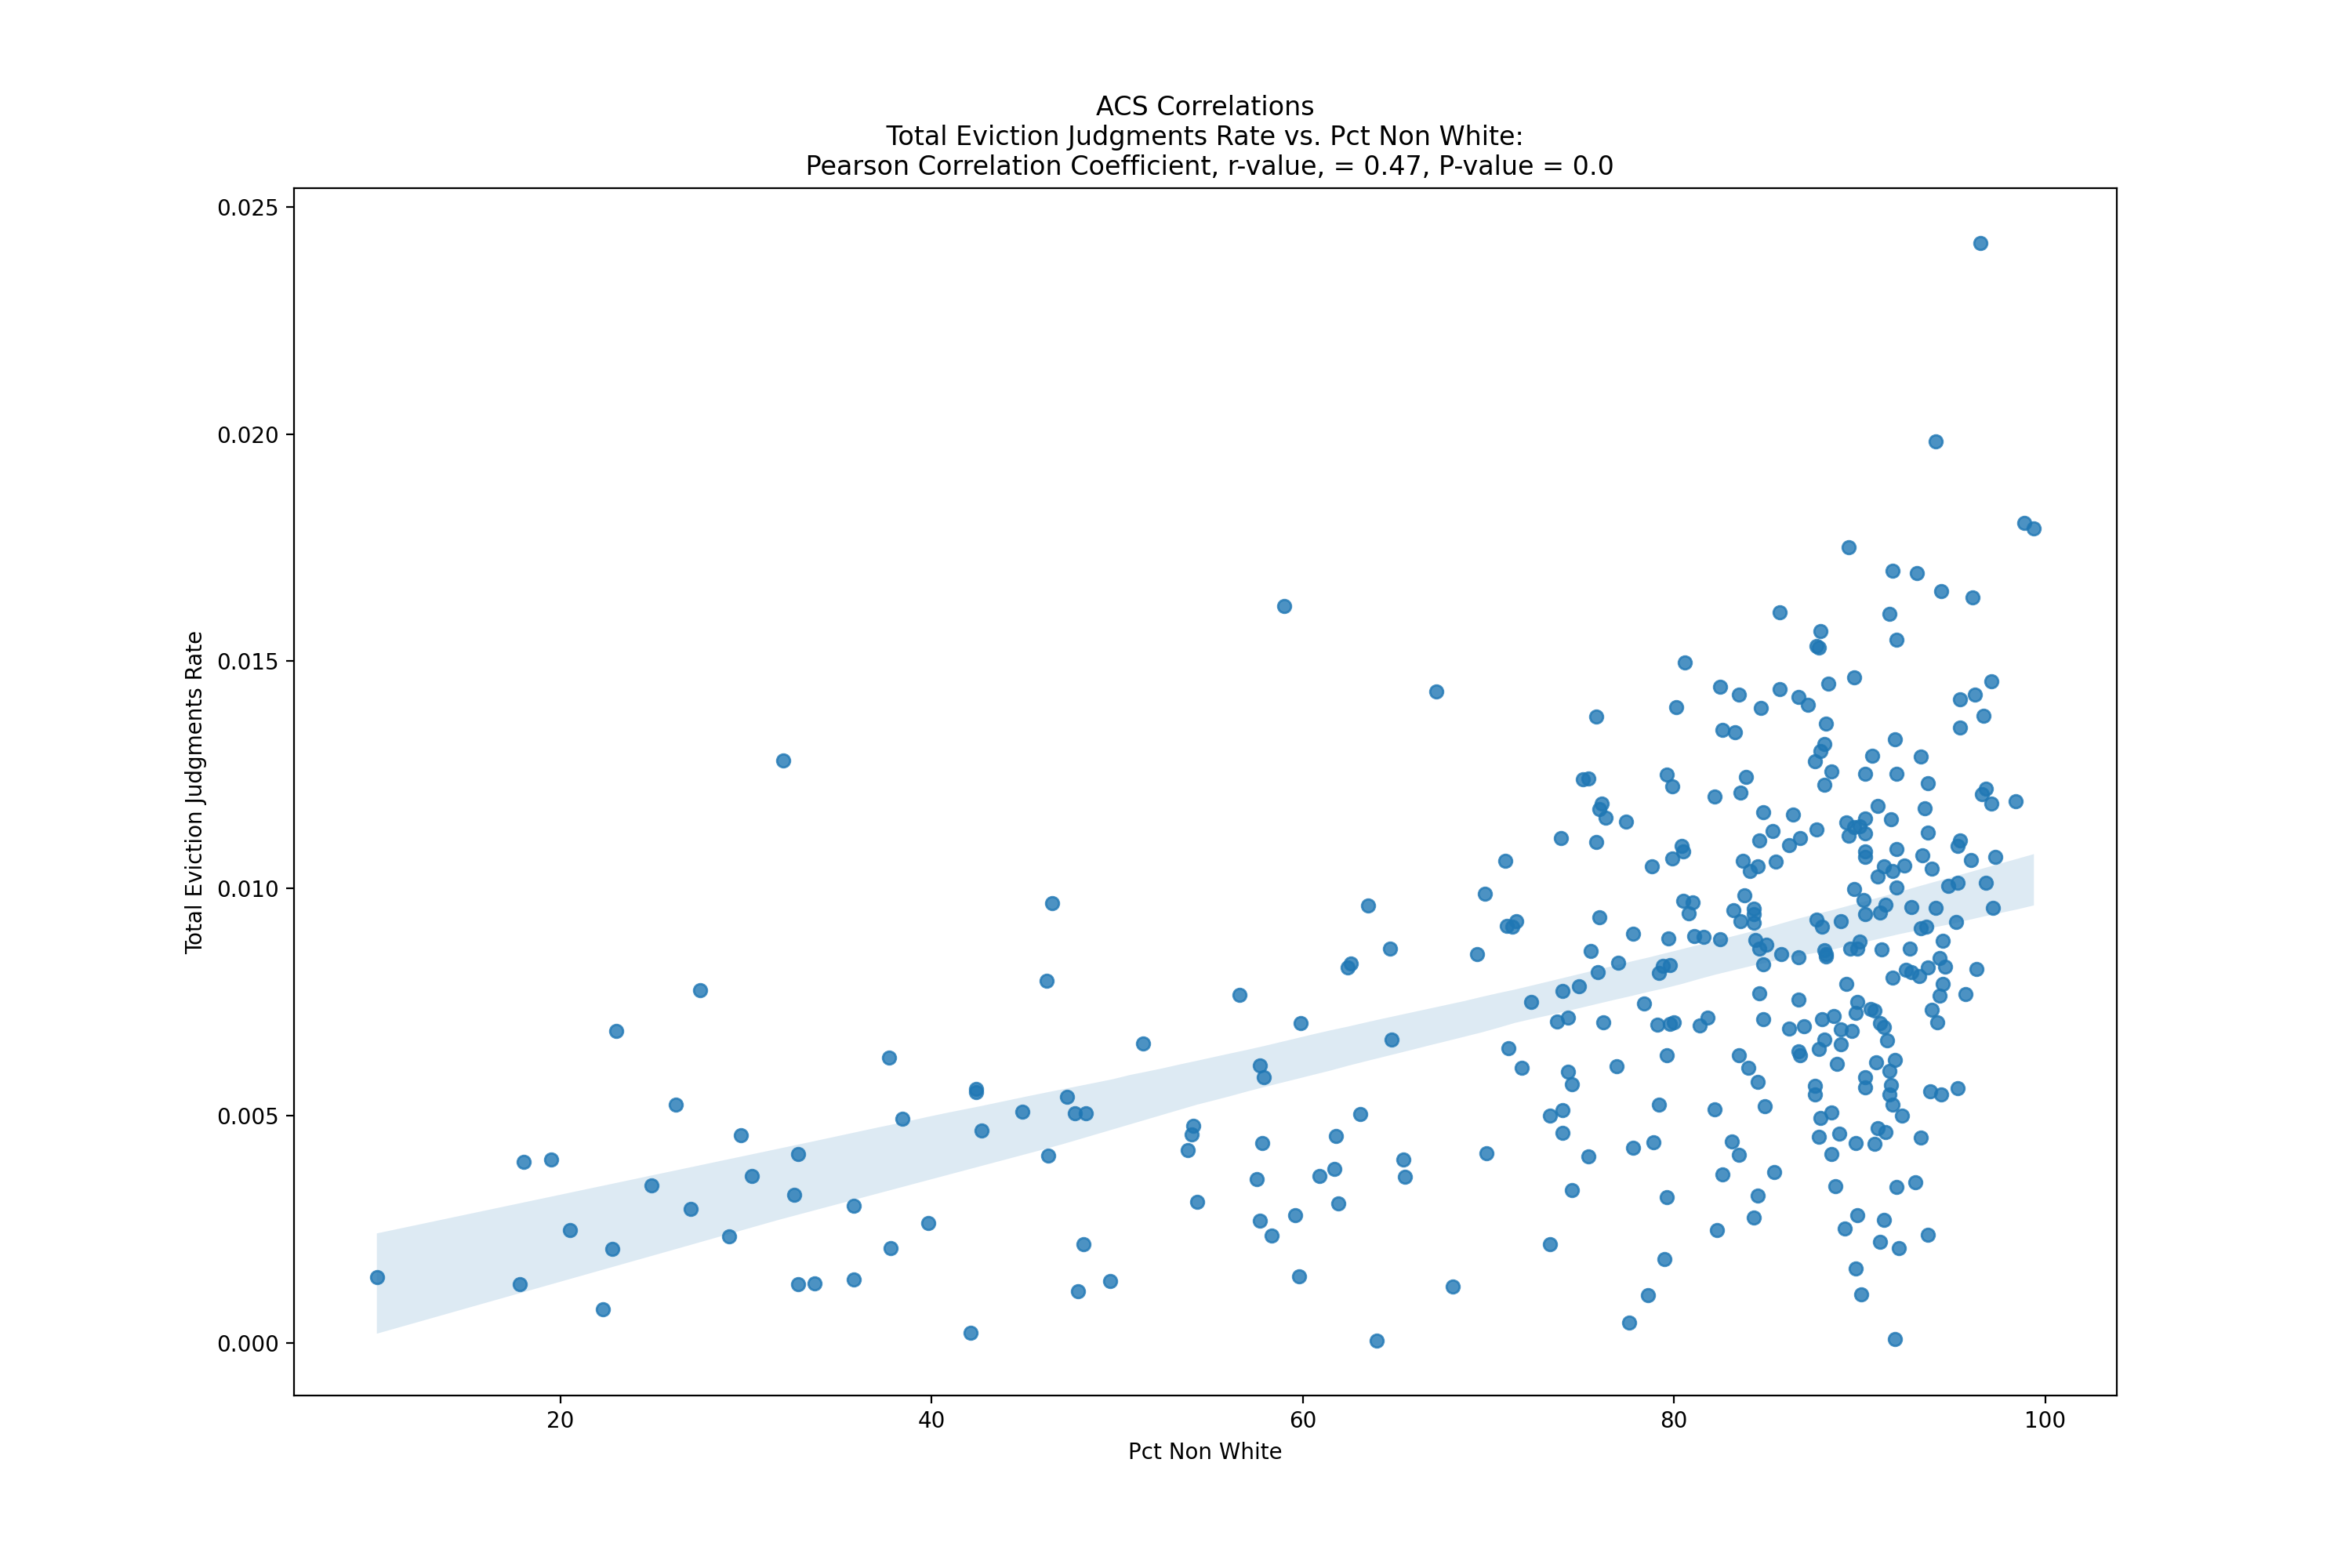
Finally, the scatter plot above represents an ACS variable (percent of non-white households) against eviction filing rates across census tracts. The scatter plot shows a moderately positive association between census tracts with a higher percentage of non-white households and the rate of eviction filings.
Note: These correlation results should not be interpreted as causal. That is, if race is found to be strongly correlated with housing loss, we cannot conclude that worse housing loss is due to the racial composition of a neighborhood or that neighborhoods with a higher proportion of a certain race face higher rates of housing loss. Rather, the full suite of correlation results provides an understanding of the social, economic, and housing characteristics of a neighborhood that is more at risk for housing loss.
Mapping Data
The mapping data folder has one file with geographical boundaries for the given county’s census tracts (.geojson) and a Geopackage file (.gpkg) to use in creating maps of housing loss data within a specific geography, including overlays of ACS variables, in GIS.
The geocoded data files stored in the other folders can be used with programs like Datawrapper and Excel to conduct additional analyses and visualizations, but these mapping-specific files are intended to be ready for use in an open source GIS software such as QGIS or in ArcGIS.
Visual Dashboard of FEAT Results
Below is a brief description of the select visualizations available in FEAT (all based on FEAT analysis of 2020–2023 eviction filing data in Albuquerque, New Mexico, from Eviction Lab’s ETS).
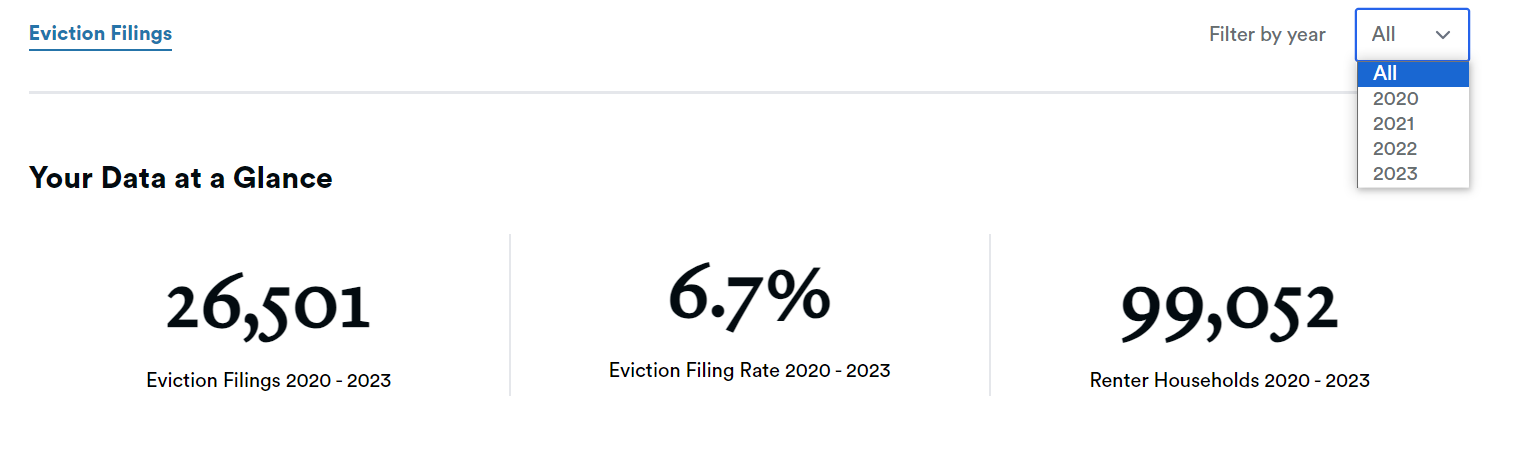
The ‘Your Data at a Glance’ section gives a snapshot of the number of eviction filings over a time period in your data, the average eviction filing rate, and the number of renter households in Albuquerque. Users can select whether to view results for all years or by an individual year.
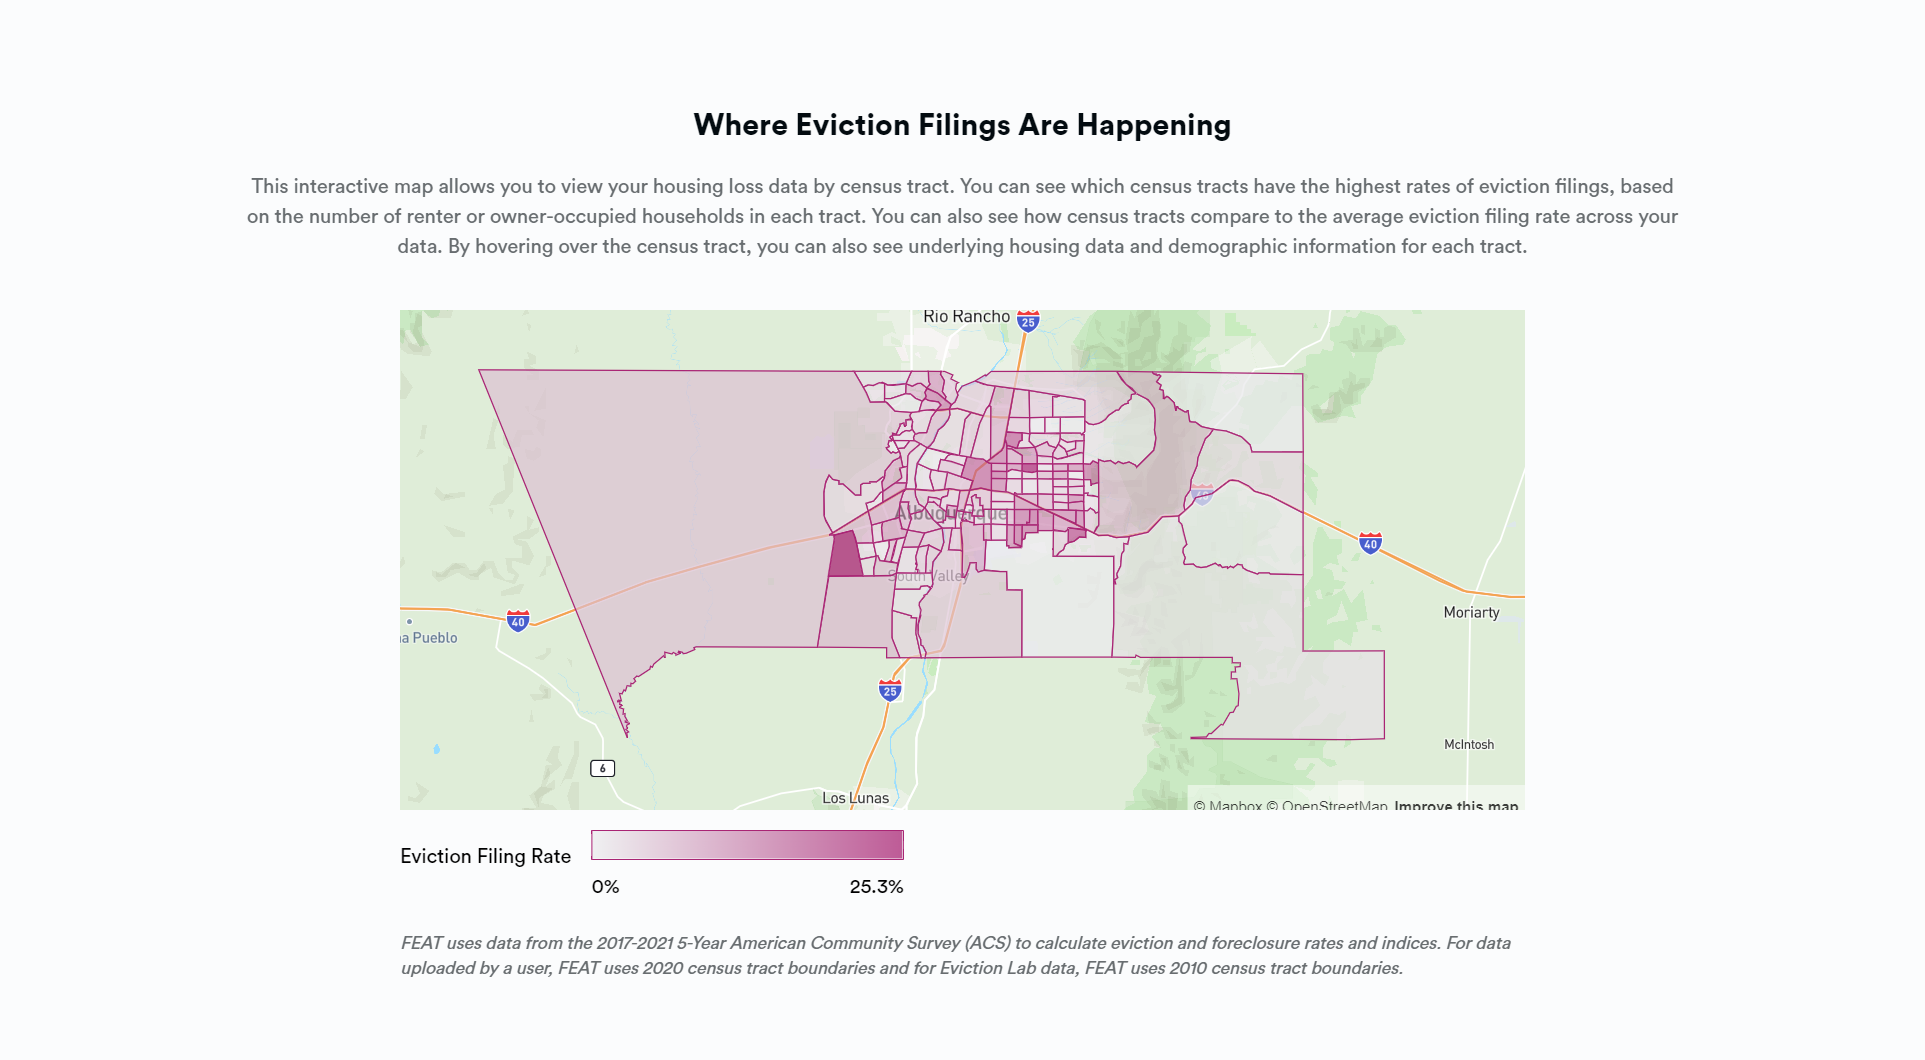
The ‘Where Eviction Filings are Happening’ visualization presents a census tract level heat map based on eviction filing rates. Hovering over each census tract offers additional information on housing loss and demographics.
The ‘Who is Most Affected’ visualization shows select results for the correlation analysis run between ACS variables and housing loss rates. Specifically, the dashboard displays variables that are moderately or strongly associated with eviction filing rates and are statistically significant. Full correlation analysis results are in the ‘analysis_plots’ folder in the ZIP file.
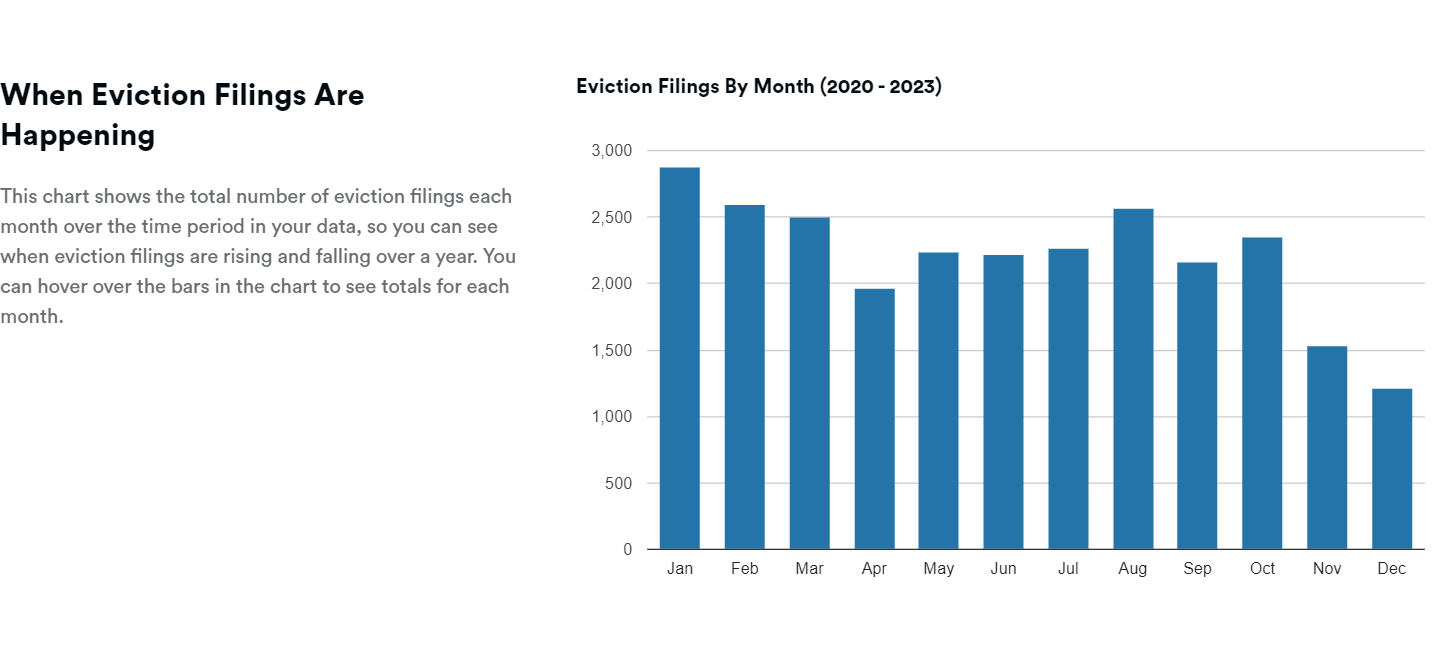
The ‘When Are Eviction Filings Happening’ visualization is a chart of eviction filings over the course of a calendar year (January to December). Hovering over each bar shows the total number of filings for that month.
Citations
- Christine P. Dancey and John Reidy, Statistics Without Maths for Psychology (London: Pearson, 2007).