
Findings
Varying Degrees 2022: New America’s Sixth Annual Survey on Higher Education interviewed 1,517 Americans ages 18 and older to better understand their perceptions of education after high school, including oversamples of Black, Latinx, and Asian Americans, and student loan borrowers. It provides important trend data to judge how attitudes about the value of education after high school, how it is funded, and how it should be held accountable have changed over the past six years, particularly since the COVID-19 pandemic.
Value
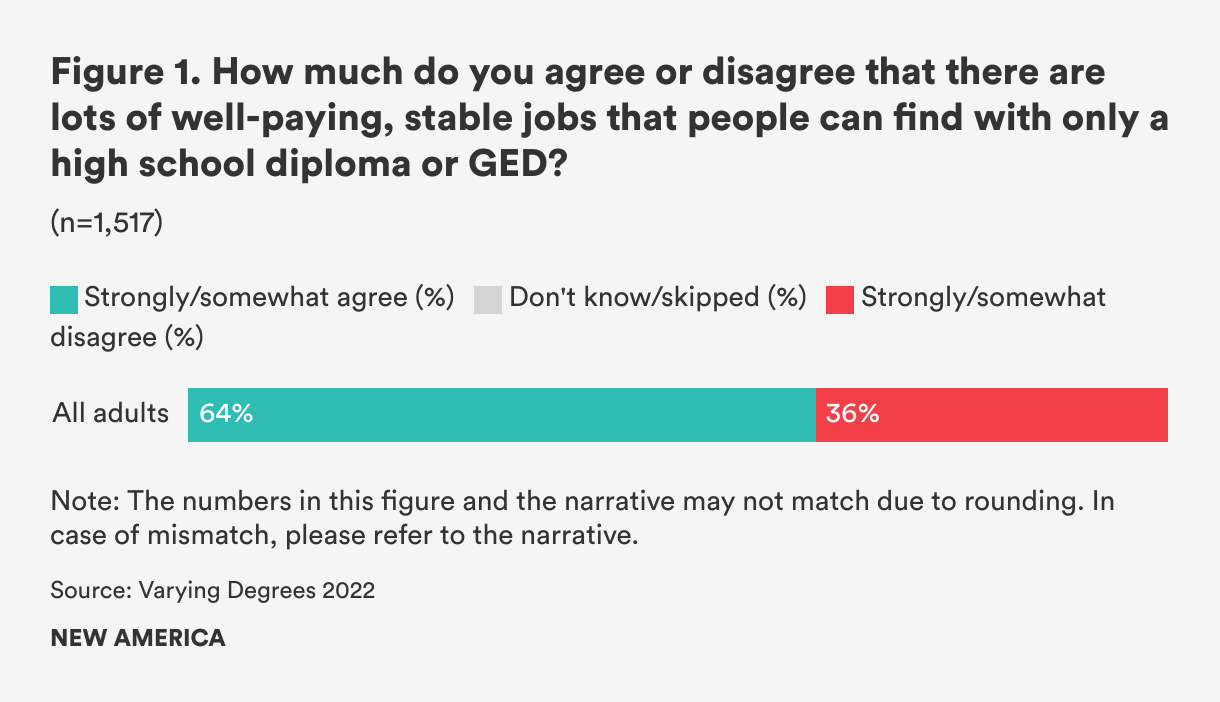
Americans continue to believe in the value of pursuing educational opportunities after high school. While almost two-thirds of respondents to this year’s Varying Degrees survey attest that well-paying, stable jobs can be obtained with only a high school diploma or GED (See Figure 1), the majority agree that it is easier to find consistent employment with additional degrees or postsecondary technical certifications.
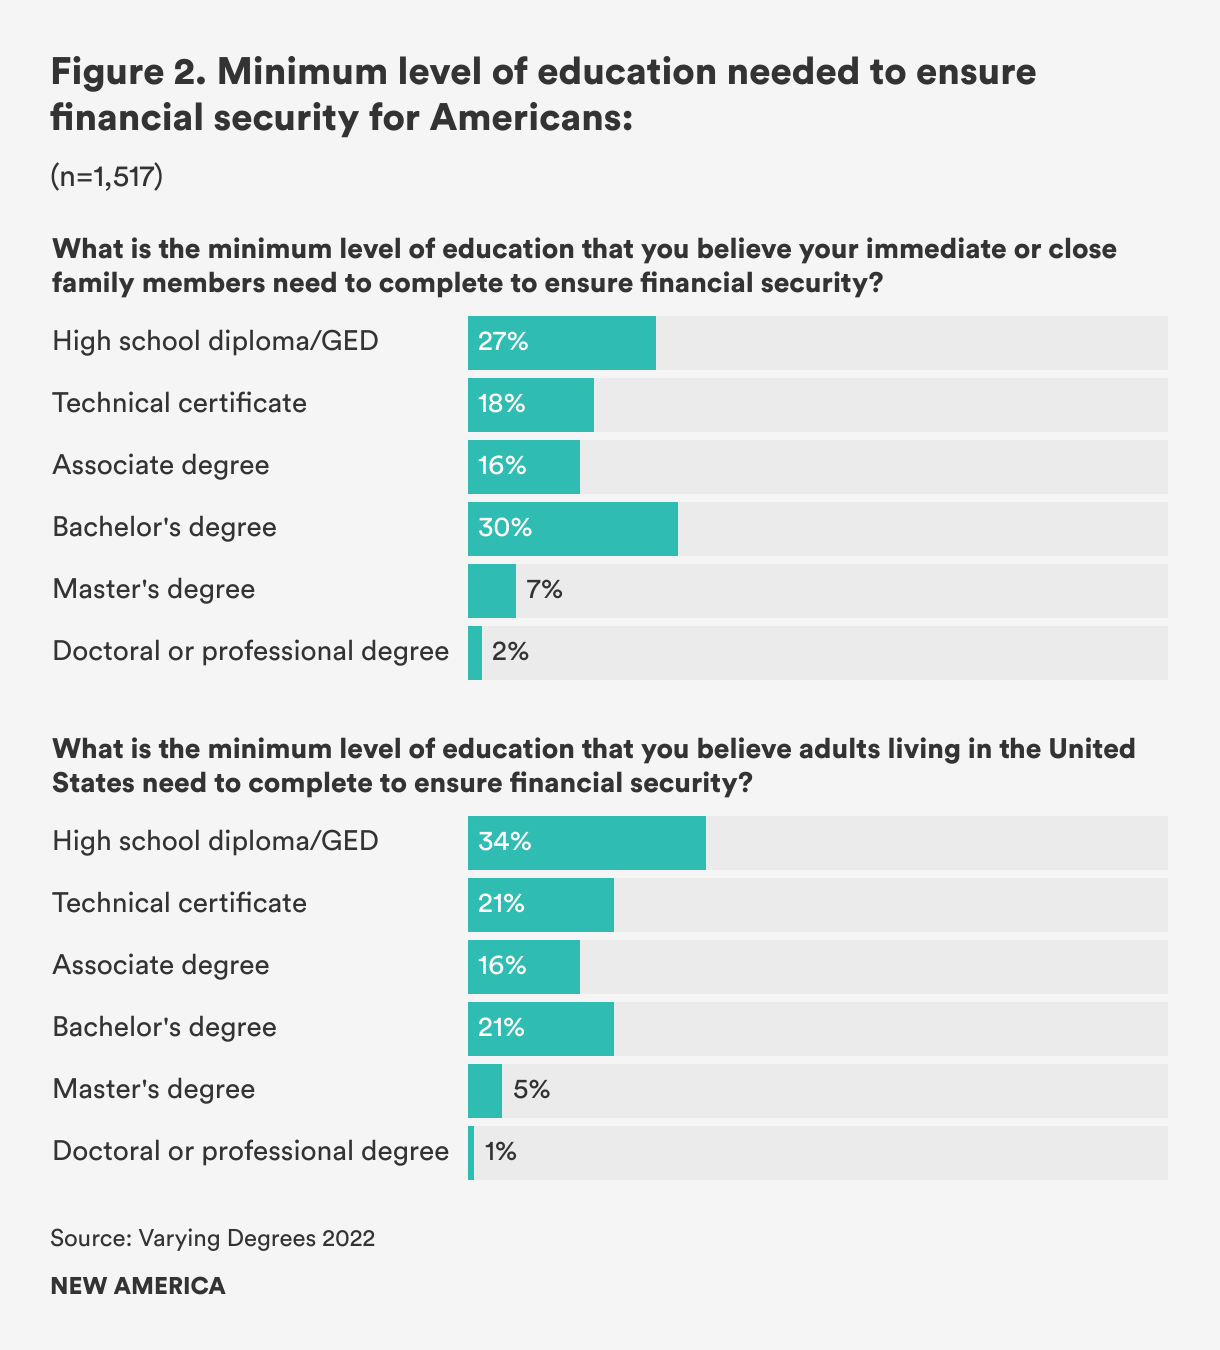
In a new question this year, we asked about the minimum level of education respondents believe their immediate or close family members should complete to ensure financial security. Although 64 percent of Americans agree that well-paying employment can be found with only a high school diploma or GED, the majority (73 percent) believe that some sort of postsecondary credential will be required for their child or close family member to achieve economic security. A plurality of respondents (39 percent) believe that their child or close family member will need at least a bachelor's degree or beyond. Nearly 10 percent believe that a master’s, doctoral, or professional degree is necessary to ensure their child or close family member’s financial stability. (See Figure 2.)
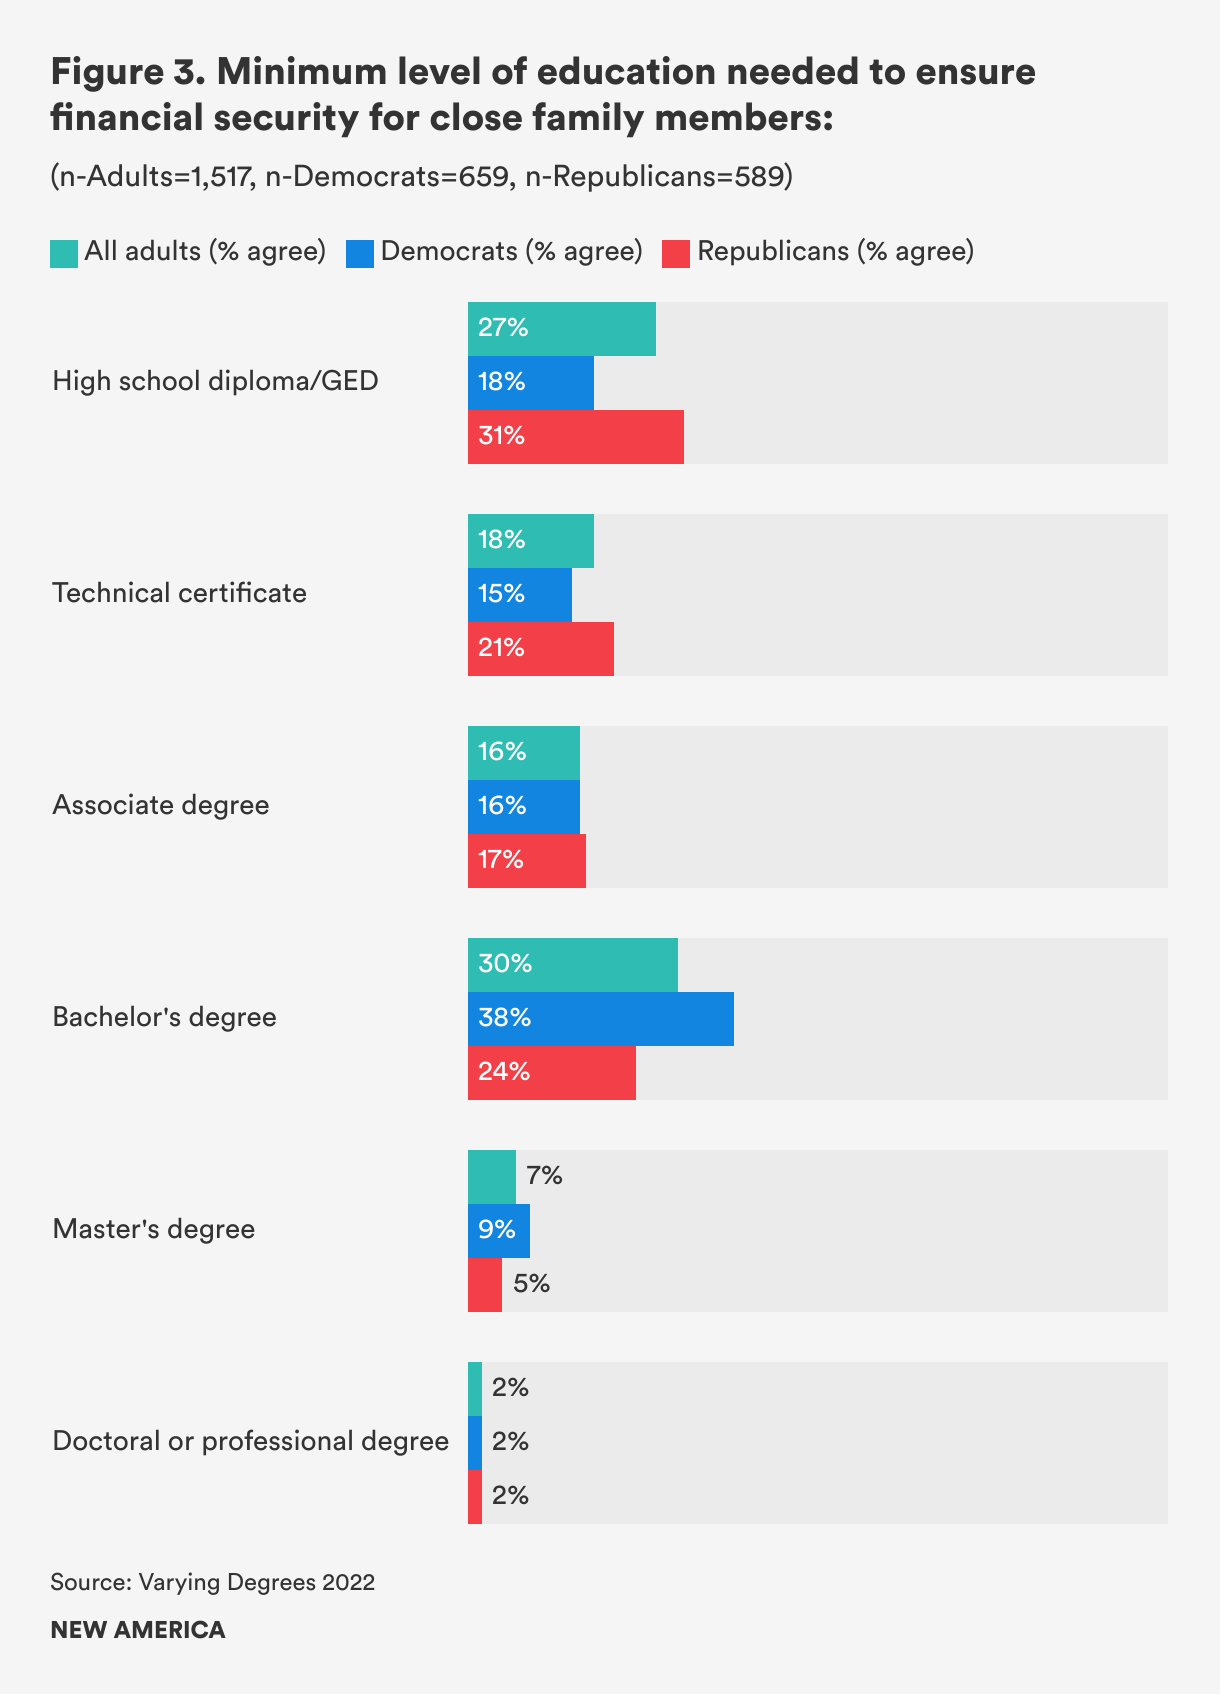
There emerged a key difference between Republicans and Democrats on this question. Republicans are significantly more likely than Democrats to consider a high school diploma sufficient for economic security, by 31 to 18 percent. Democrats are more likely than Republicans to recommend that family members complete at least a bachelor’s degree, by 38 to 24 percent. (See Figure 3.)
In a variation on this question, we broadened the population of interest from what one would recommend to a close family member to what one would recommend for adults in the U.S. Overall, respondents believe that their close family members personally needed higher levels of education than the general population of adults in America. While 39 percent of respondents believe that close family members should complete at least a bachelor's degree or above, only 27 percent believe that all American adults need at least a bachelor's degree or above to achieve financial security. About one-third (34 percent) believe that a high school diploma is sufficient for adults in the U.S. to be financially stable. Only one-quarter of Democrats polled believe that a high school diploma is sufficient for Americans to achieve economic security, compared to 39 percent of Republicans who said so. (See Figure 2.)
Education after High School Offers Strong Return on Investment
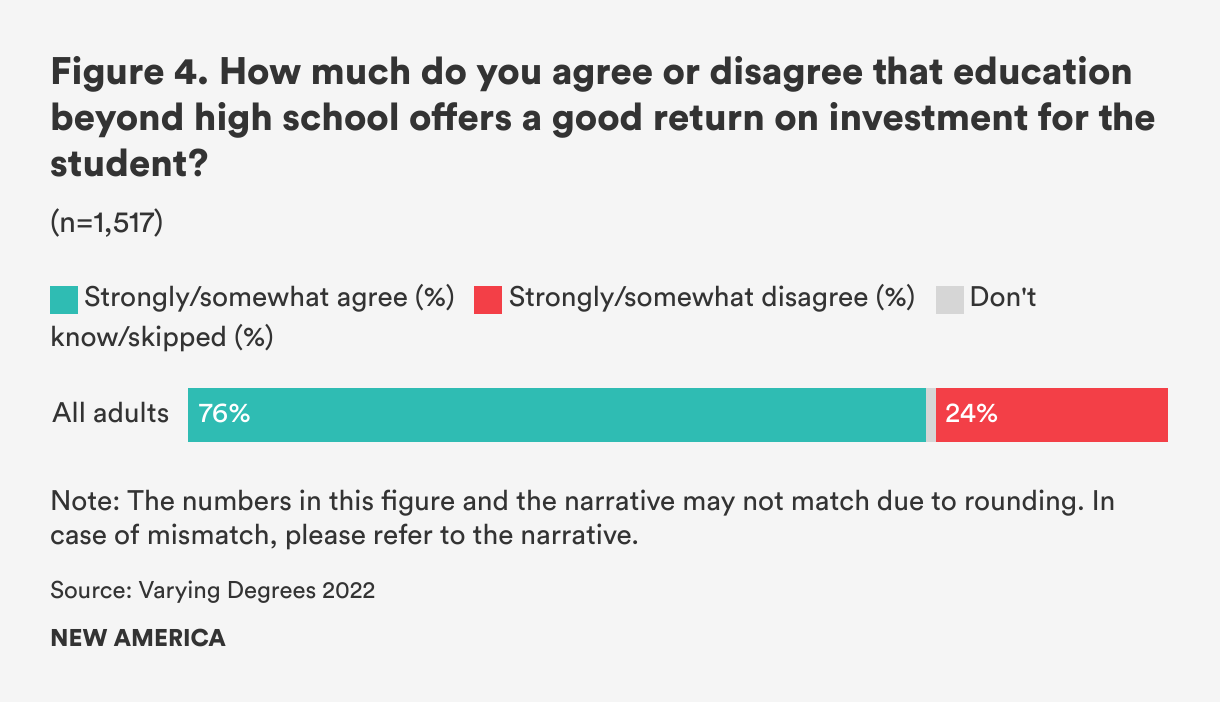
Over three-quarters of Americans continue to believe that education beyond high school offers a good return on investment for students. (See Figure 4.) This number has remained relatively stable since we began collecting data in 2017. Although there is a general consensus on this question, we found demographic differences among party identification, age, and race. Democrats are statistically more likely to agree (84 percent) than Republicans (71 percent). Asian respondents (84 percent) agree at higher rates than White (75 percent), Black (75 percent), and Latinx (76 percent) adults. And older generations, such as Gen X (79 percent) and Baby Boomers (84 percent), are statistically more likely to agree than Millennials (64 percent) and Gen Z (71 percent).1
In a new question this year, we asked if education beyond high school offers a good return on investment for the general population. Numbers remain similar to the previous question that focused on return on investment for students. Overall, 75 percent of respondents agree. (See Figure 5.)
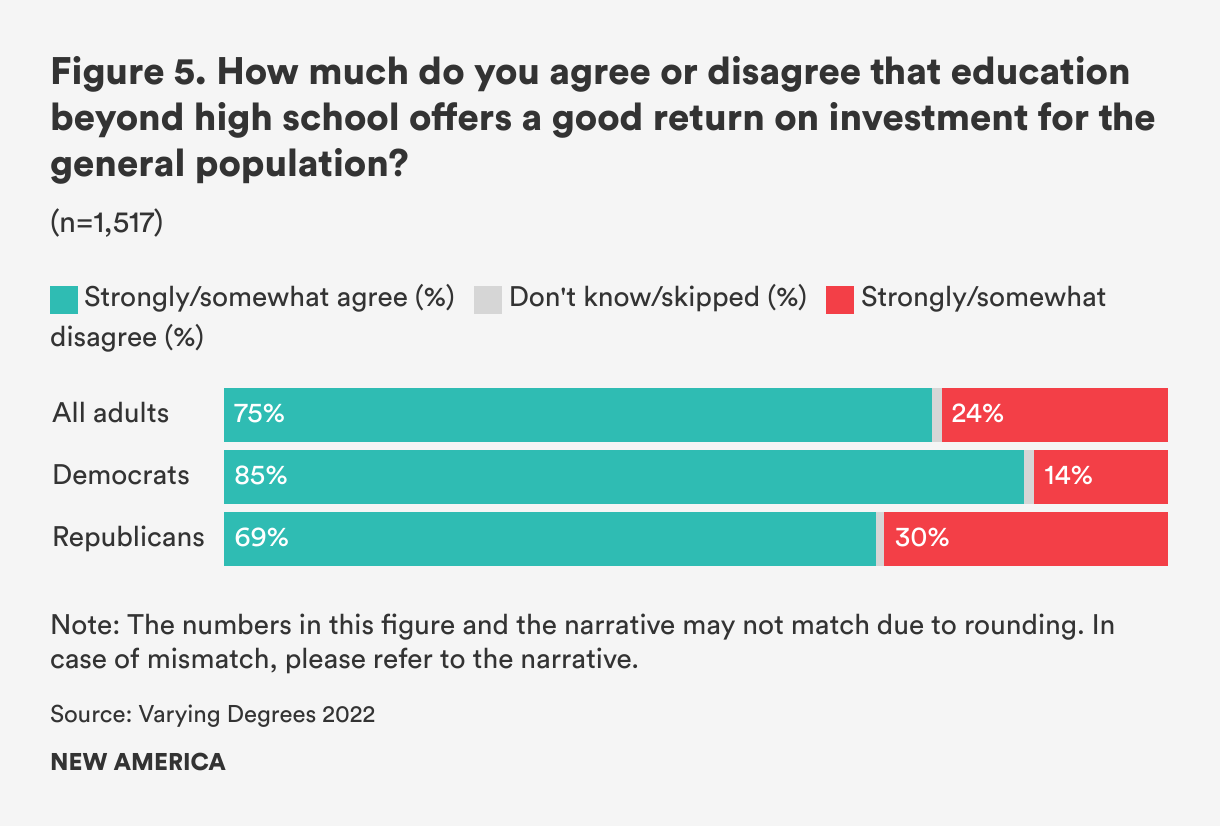
While there were some differences in opinion among party identification, race, and gender, all agree in the majority that education beyond high school offers a good return on investment for the general population. We found a slightly wider partisan divide with this question: 84 percent of Democrats and 69 percent of Republicans believe that higher education offers a good return on investment for the public. Differences across racial demographic groups are less significant, though Asian respondents (82 percent) remain more likely to agree than White (73 percent), Black (74 percent), and Latinx (77 percent) Americans that education after high school offers a good return on investment for the general population. As in the previous question, Gen X (77 percent) and Baby Boomer (80 percent) respondents agree at higher rates than their Millennial (66 percent) and Gen Z (67 percent) counterparts.
Colleges & Universities Leading America in a Positive Direction
Just over half of Americans (55 percent) believe that colleges and universities are leading America in a positive direction. The proportion of Americans who feel positively about the impact of colleges and universities has dropped by 14 percentage points since we started collecting data on this question in 2020. Similar to last year, there is a strong and significant partisan divide on this question. Nearly three-quarters of Democrats (73 percent) believe that colleges and universities have a positive effect, compared to just over a third of Republicans (37 percent). (See Figure 6.)
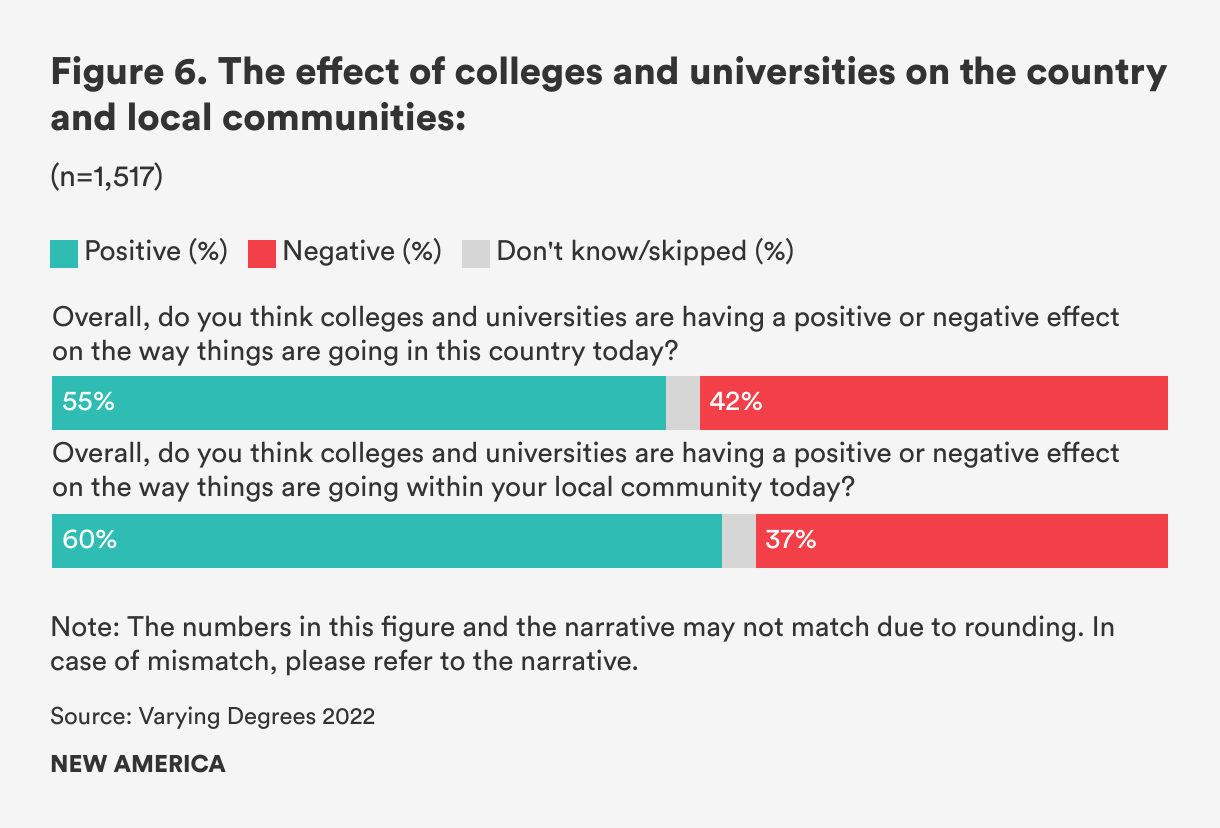
In a related question, we found that a greater majority of Americans (60 percent) believe that colleges and universities have a positive effect on their local communities. (See Figure 6.) There is a notable partisan divide in these results, too: 77 percent of Democrats responded positively to this question, compared to 45 percent of Republicans.
Although Americans feel positively about the impact of colleges and universities, particularly those located in their communities, only 37 percent agree that higher education in America is fine how it is. But attitudes on this question have improved significantly since 2017, when only 26 percent agreed higher education was fine the way it was.
Higher Education Sectors Contribute to a Strong Workforce, but Not All Are Worth the Cost
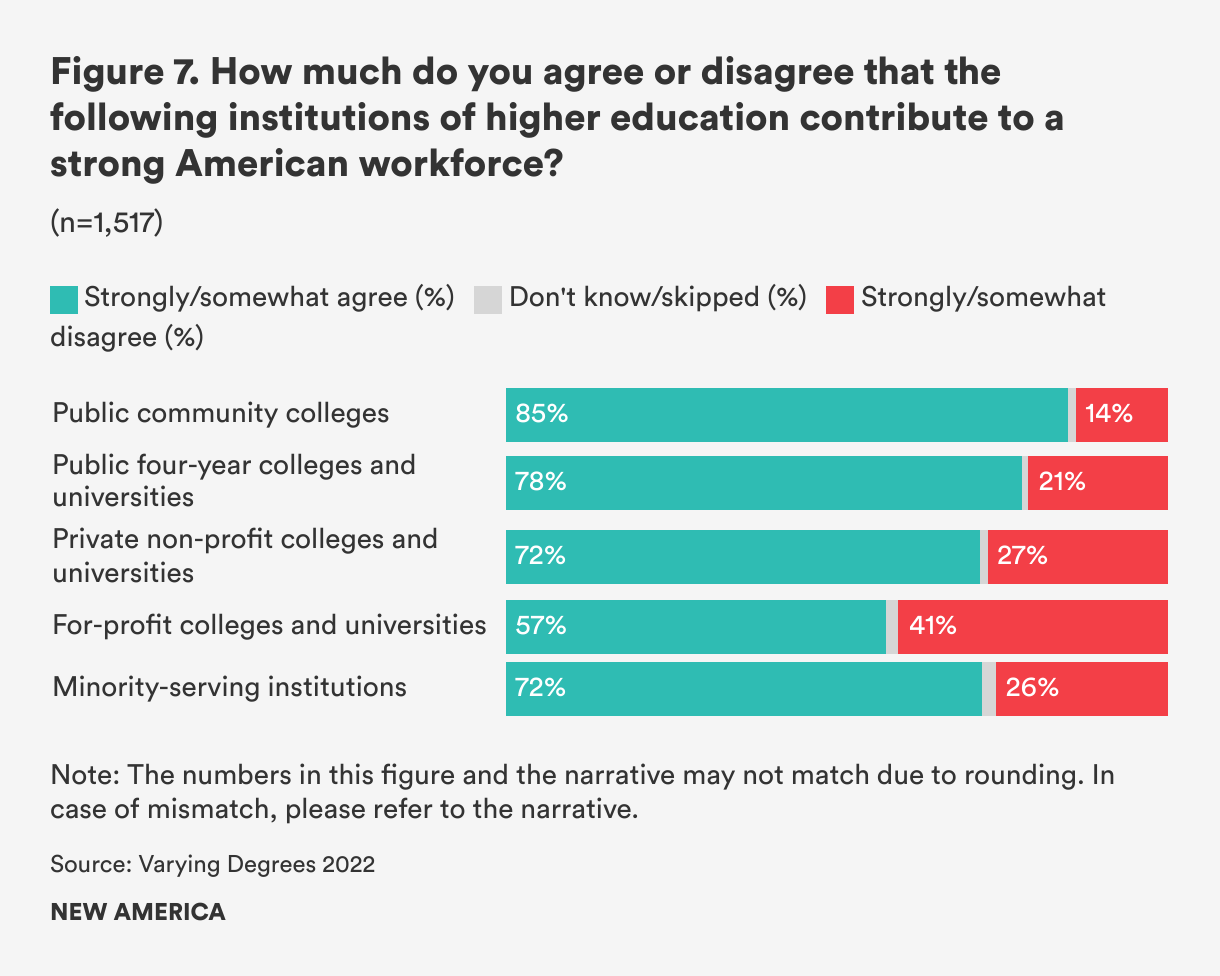
Americans have a favorable opinion of how colleges and universities across all sectors contribute to the workforce, continuing the trend from 2017 when we started the survey. Most Americans believe community colleges contribute to a strong workforce. All other sectors share a similar level of agreement, though there is a significant decline for the for-profit sector. Approximately 78 percent of Americans agree that public four-year colleges prepare a strong American workforce, compared to 71 percent for private nonprofit colleges, 72 percent for MSIs, and 58 percent for for-profit colleges. (See Figure 7.)
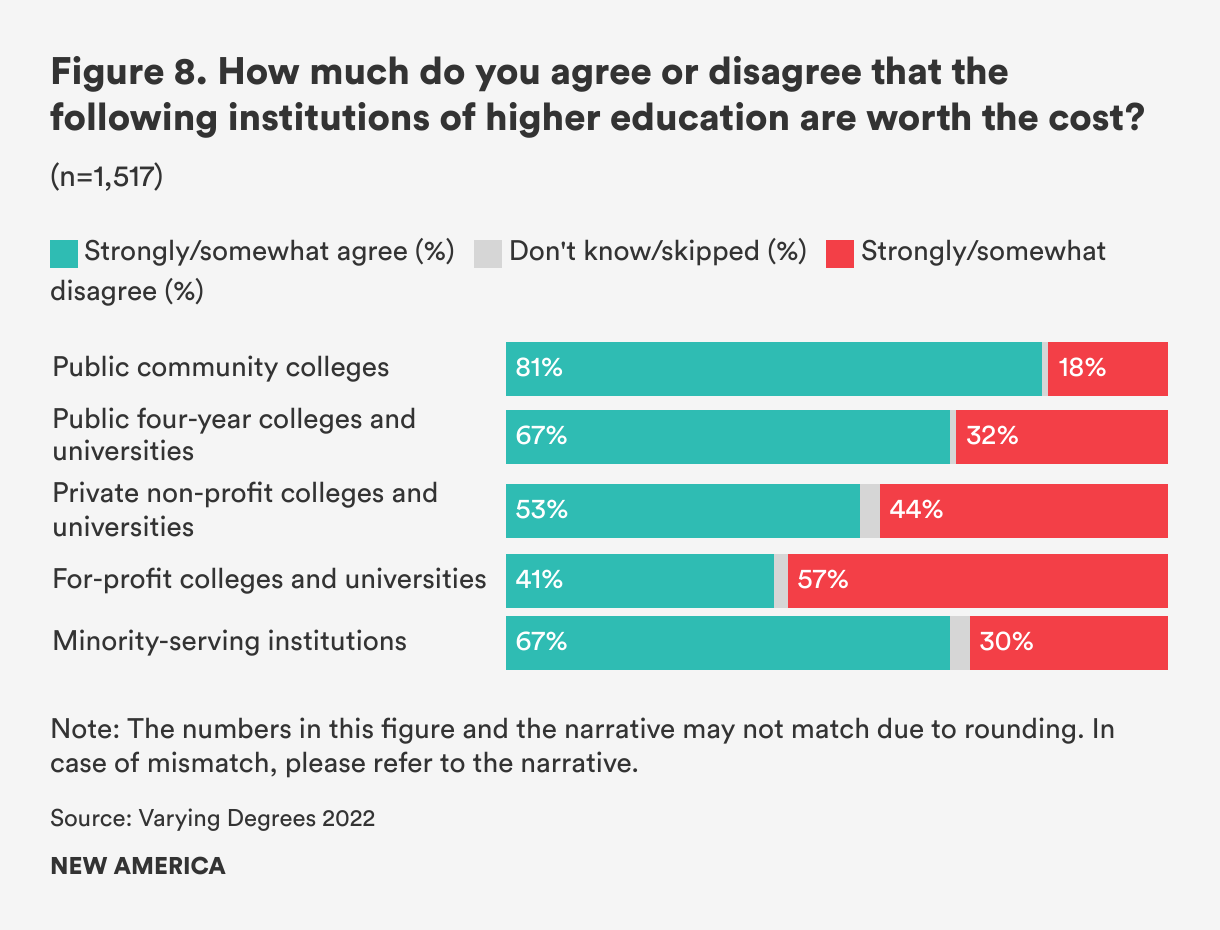
When it comes to whether certain sectors are worth the cost for students, the number sinks for for-profit colleges and universities. While 81 and 67 percent, respectively, agree that community colleges and public four-year colleges and universities are worth the cost and more than half (54 percent) think so for private nonprofit colleges, only 41 percent think for-profit colleges are worth the cost. A majority of Americans (67 percent) think MSIs are worth the cost. (See Figure 8.)
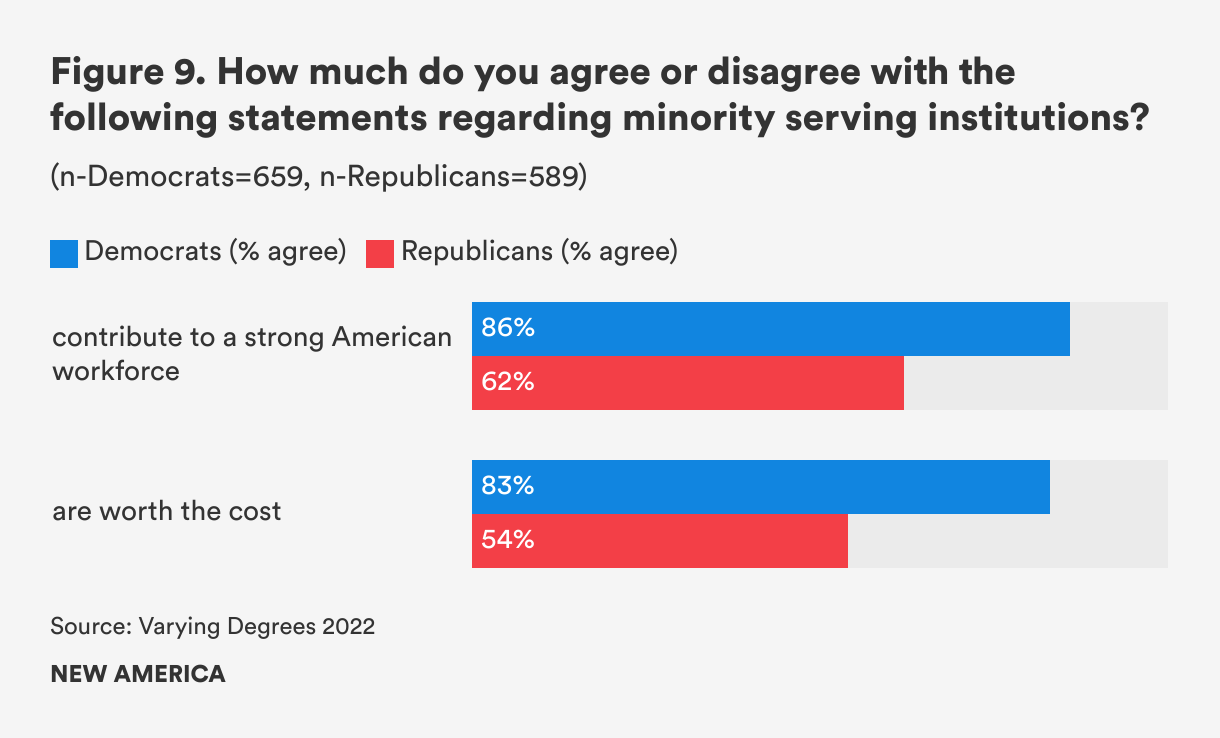
Democrats and Republicans generally align on how they think about institutions of higher education from different sectors. When it comes to MSIs, however, their opinions diverge. While as many as 86 percent of Democrats think MSIs contribute to a strong American workforce, only 62 percent of Republicans think so. Eight in 10 Democrats think MSIs are worth the cost, but only 54 percent of Republicans agree with that statement. (See Figure 9.)
Online Education Should Cost Less
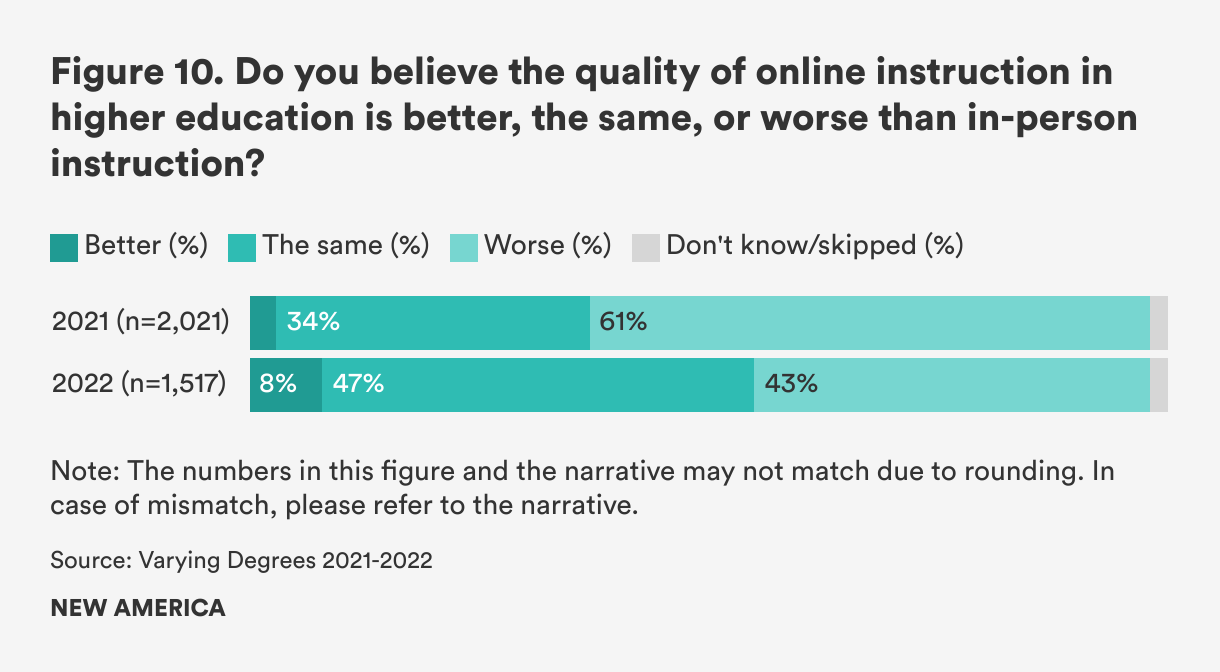
Opinion on online education experienced a significant shift from last year. More, albeit still a low number, believe the quality of online instruction in higher education is better than in-person instruction (8 percent in 2022 vs. 3 percent in 2021), and nearly half (47 percent) think the quality of online instruction is the same as in-person instruction. Notably, 17 percent of current students think the quality of online instruction is better than in-person instruction, compared to only 6 percent of those who are not current students. (See Figure 10.)
As many colleges and universities opt into hybrid education (a mix of online and in-person instruction) even when most Covid restrictions have been lifted, the shift in opinion could reflect how widespread and accepted online instruction has become. But this shift is unexpected and particularly concerning from an accountability perspective, as experts have raised alarms about the operations of online programs at public and private nonprofit colleges,2 and the predatory, predominantly online, programs at for-profit colleges.3
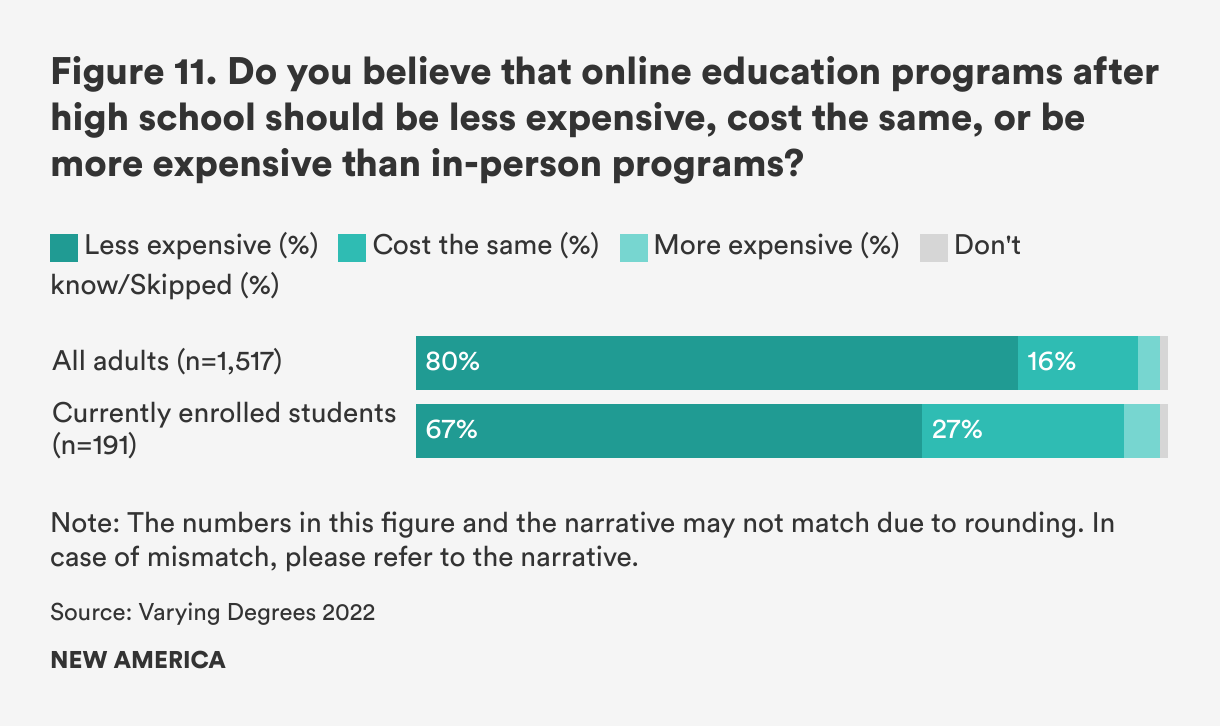
Having said that, 80 percent of Americans still think online education programs should cost less than in-person programs, which is similar to last year. Surprisingly, fewer current students this year (68 percent) than last year (74 percent) think these programs should cost less, and 27 percent think these programs should cost the same as in-person programs. (See Figure 11.)
Funding
With a hot labor market, rising inflation, and continued supply chain disruption due to the pandemic, Americans have found it challenging to navigate and understand their future economic situation. With signs of economic recession on the horizon, they remain divided on whether students have access to an affordable education after high school and how that education should be funded.
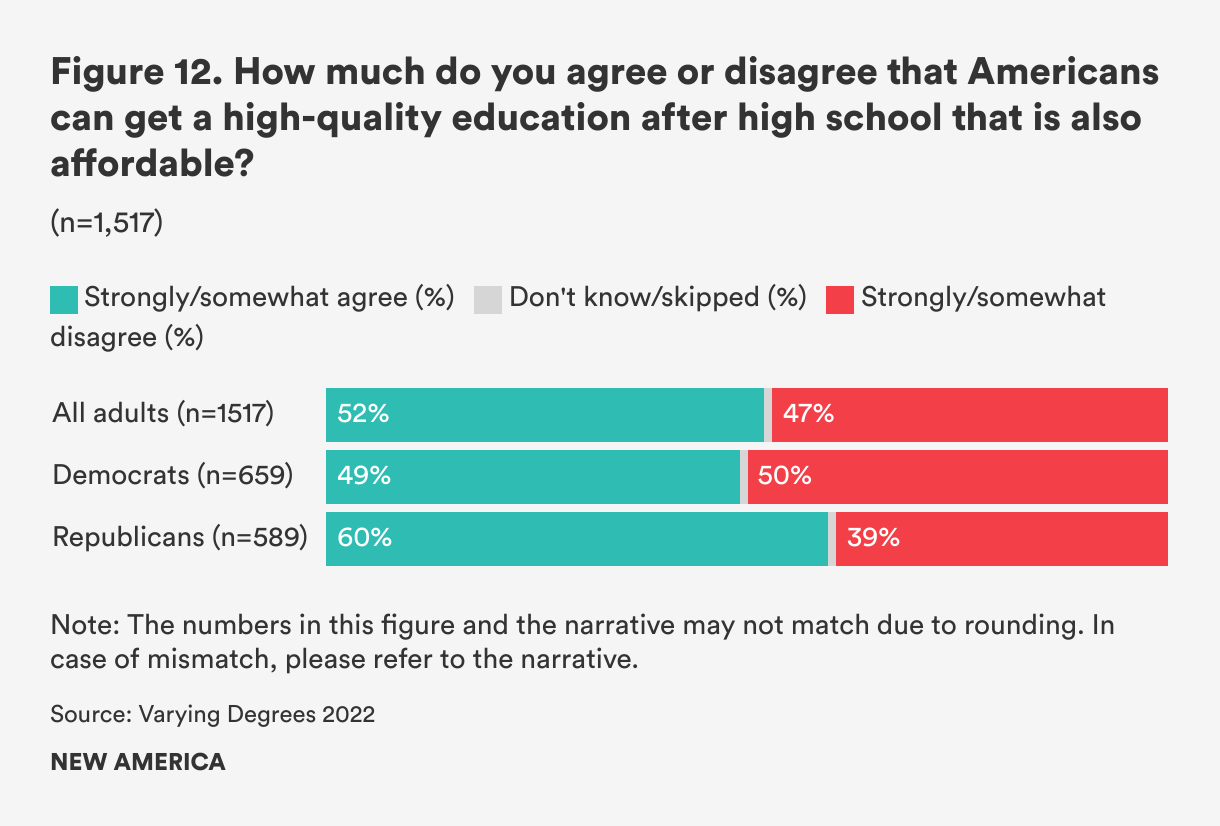
Similar to previous years, Americans are split on whether someone can get a high-quality education after high school that is also affordable: 52 percent agree, a slight increase from last year’s 48 percent. There is a difference between the way Democrats and Republicans feel about this issue. About half (49 percent) of Democrats believe that Americans can get a high-quality education after high school that is also affordable, compared to over half (59 percent) of Republicans. (See Figure 12.)
There is also a noticeable difference among generations, with younger respondents agreeing at much lower rates than older ones. Only 36 percent of Generation Z, 45 percent of Millennials, and 45 percent of Gen X agree that someone can get a high-quality and affordable education after high school, compared with 66 percent of Baby Boomers. The rapid rise in college price for the youngest generations may explain this difference of opinion.
Government Must Spend Money on Education after High School
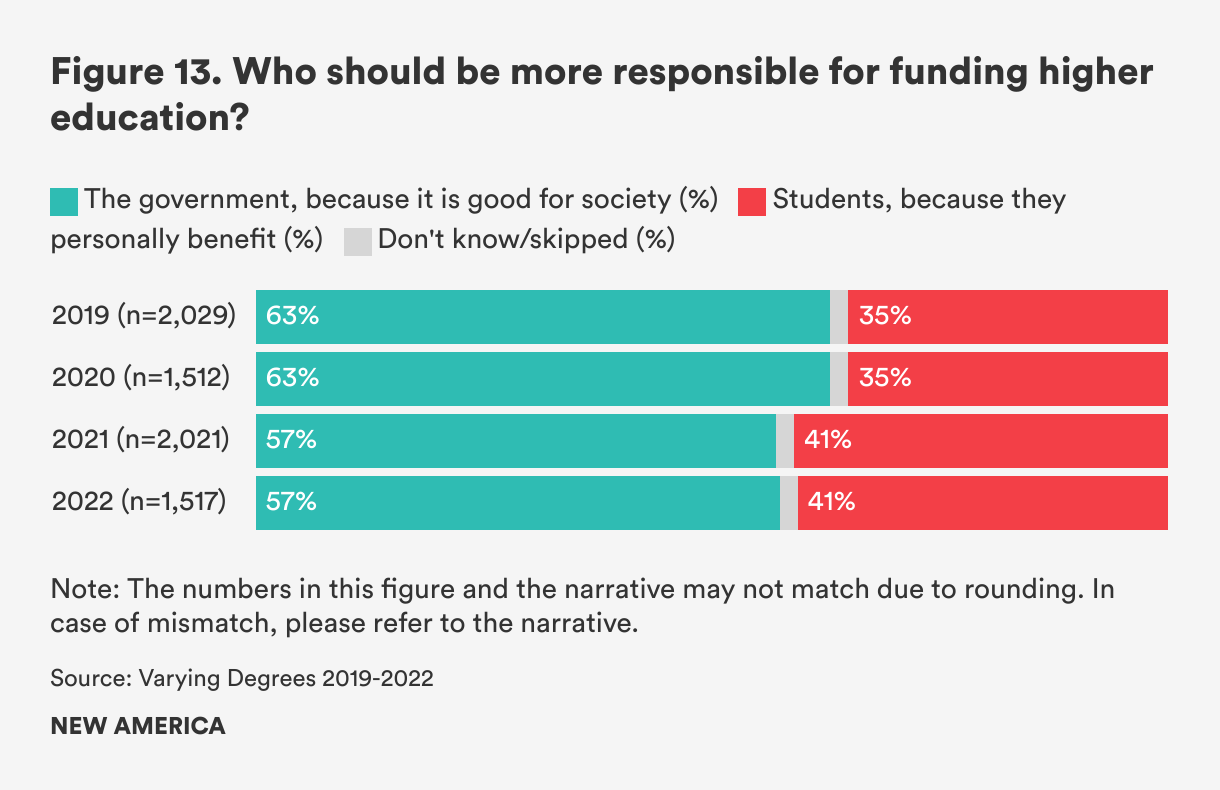
When it comes to who should fund higher education—the government, because it is good for society, or students, because they personally benefit—a majority of Americans still believe the burden should fall on the government. Similar to last year, 58 percent of Americans said the government should be more responsible for funding higher education. However, this still reveals a decline in opinion from 2019 and 2020, when 63 percent of them believed the government should be the primary funder. (See Figure 13.)
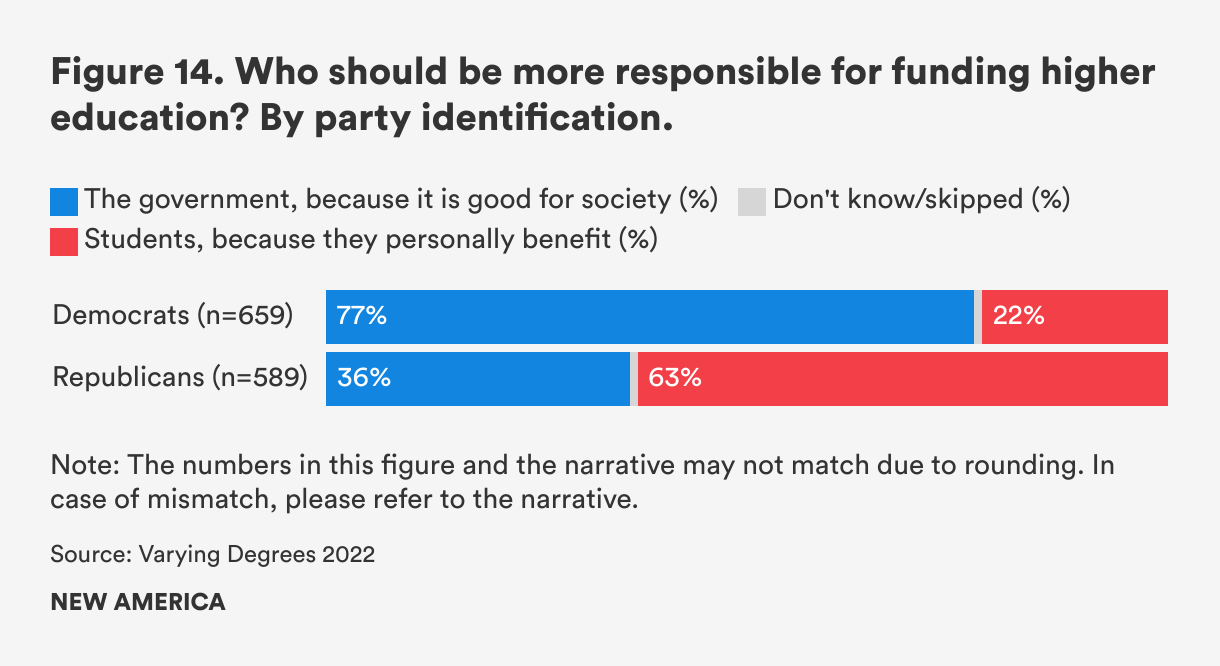
Democrats and Republicans remain deeply divided over this question, as they have every year we have collected data. More than three-quarters of Democrats (77 percent) believe the government should fund higher education because it is good for society. Meanwhile, 63 percent of Republicans say students should fund education beyond high school because they personally benefit. (See Figure 14.)
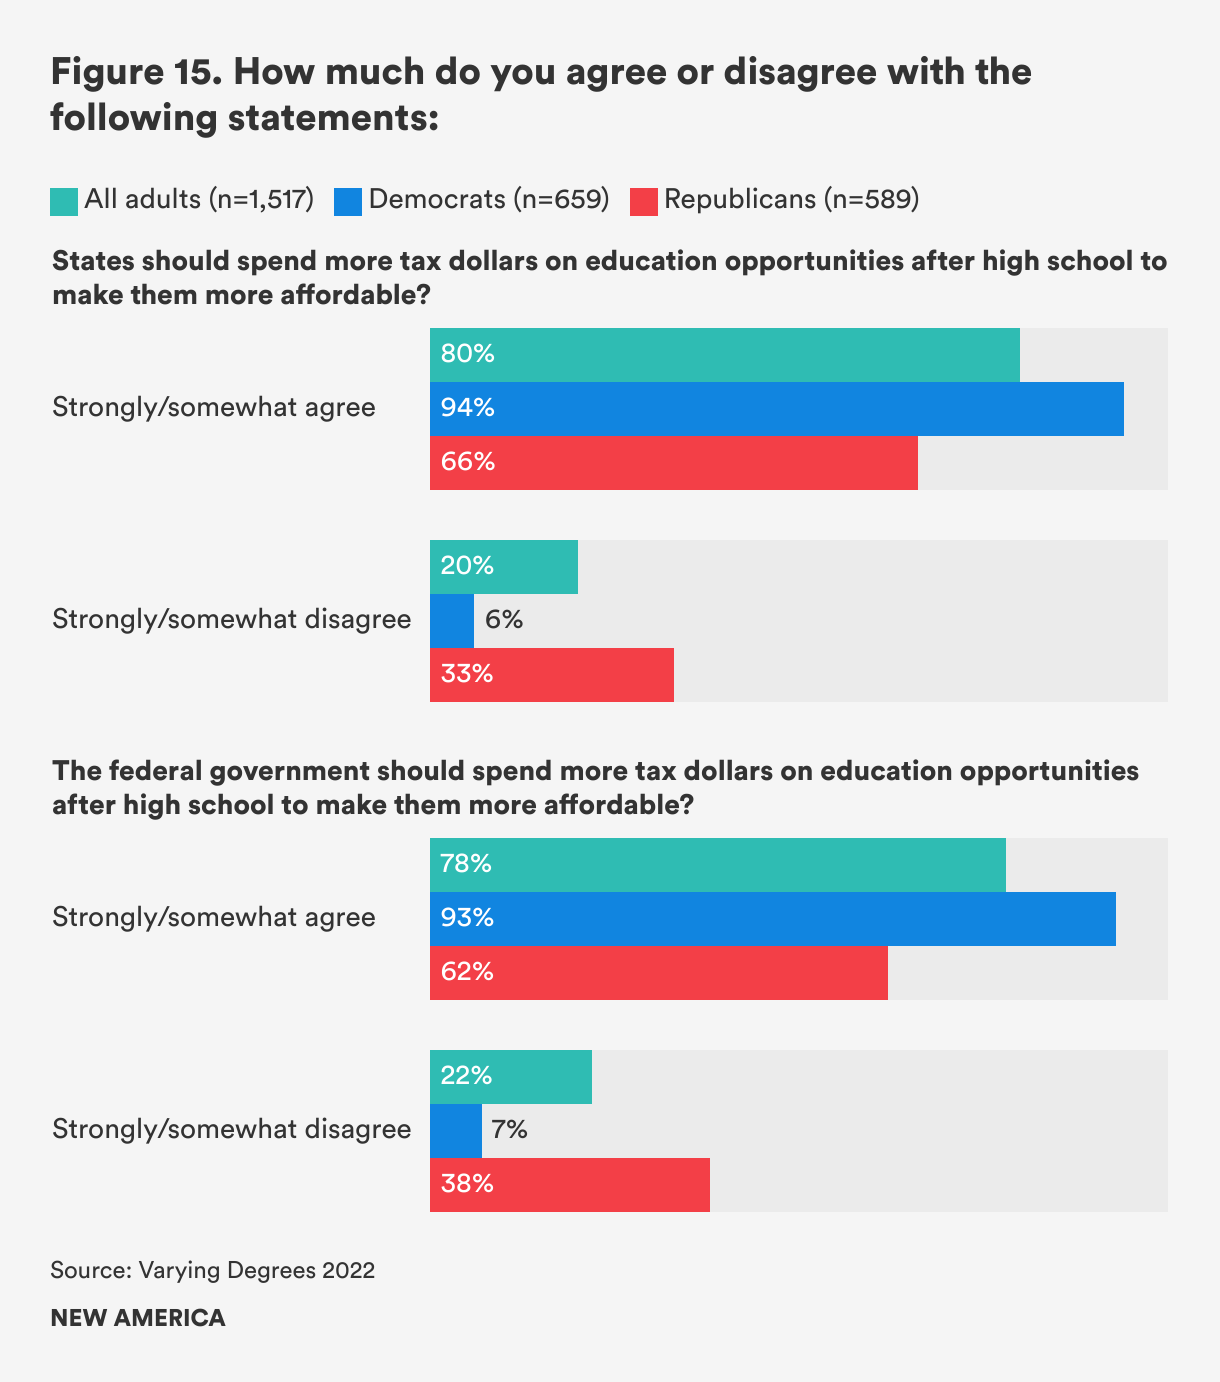
Even though the share of Americans saying that the government should fund higher education because it is good for society has declined since 2019, a strong majority still say that states (80 percent) and the federal government (78 percent) should spend more tax dollars on educational opportunities after high school to make them more affordable.
Although both Democrats and Republicans disagree on who should be the primary funder of higher education—government or students—they both agree that federal and state governments should spend additional tax dollars to make higher education opportunities more affordable. Most Democrats feel that both federal (93 percent) and state governments (94 percent) should spend more. Republicans also agree, but at lower rates (66 percent agree for state government, 62 percent for federal). (See Figure 15.)
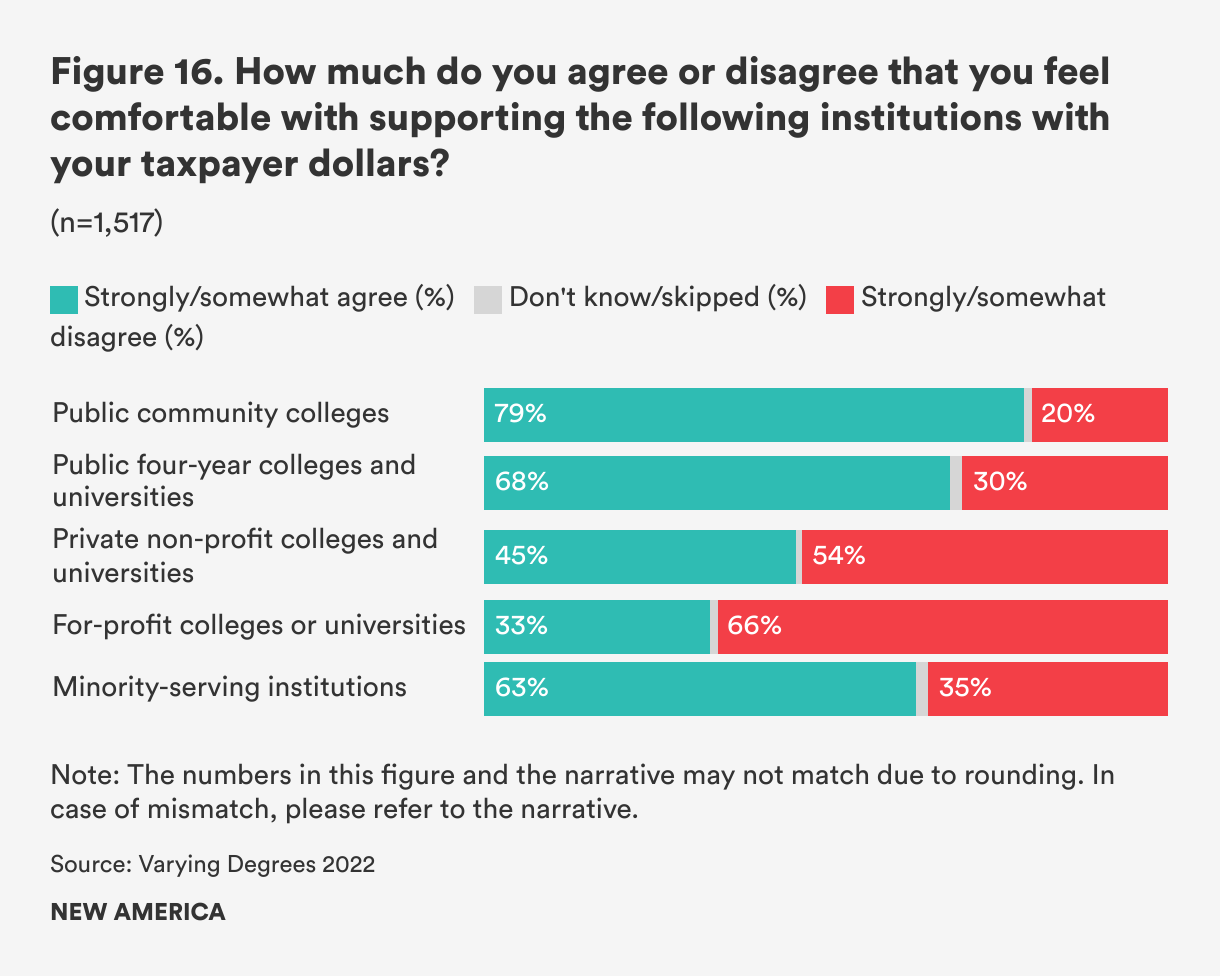
Public Colleges & Universities Worth the Investment & Are Underfunded
While a majority of Americans believe that federal and state governments should spend more money to make higher education opportunities more affordable, they are only comfortable with taxpayer support going to specific institutions. The only institutional types that a majority of Americans are comfortable supporting with taxpayer dollars are public colleges and universities and minority-serving institutions. Overall, 79 percent of Americans feel comfortable spending taxpayer dollars on public community colleges, 68 percent on public four-year universities, and 63 percent on MSIs. Only a third of Americans support spending taxpayer dollars on for-profit colleges and universities. (See Figure 16.)
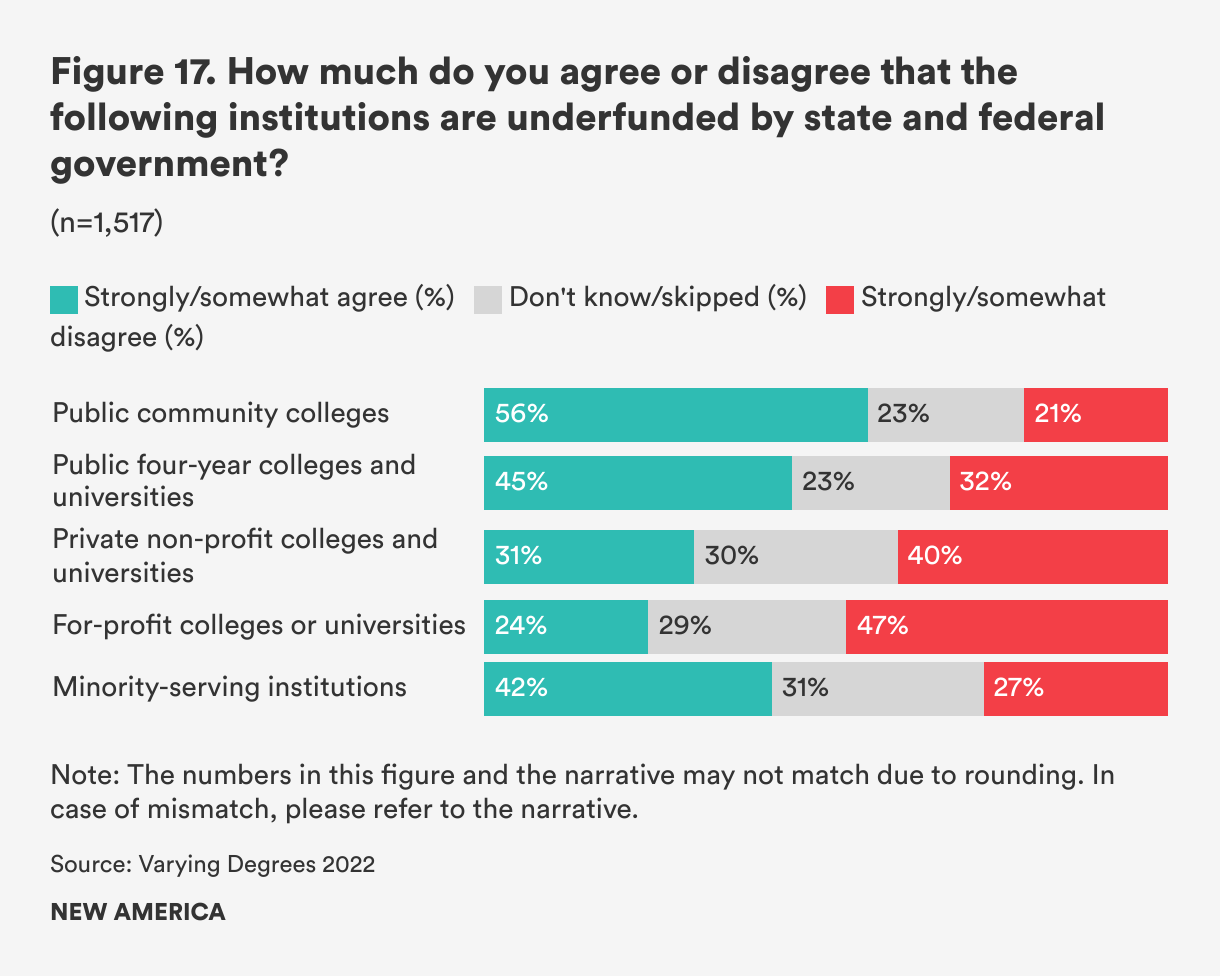
A majority of Americans agree that public community colleges are underfunded (56 percent) but agree only in the minority that other sectors of higher education are underfunded. (See Figure 17.)
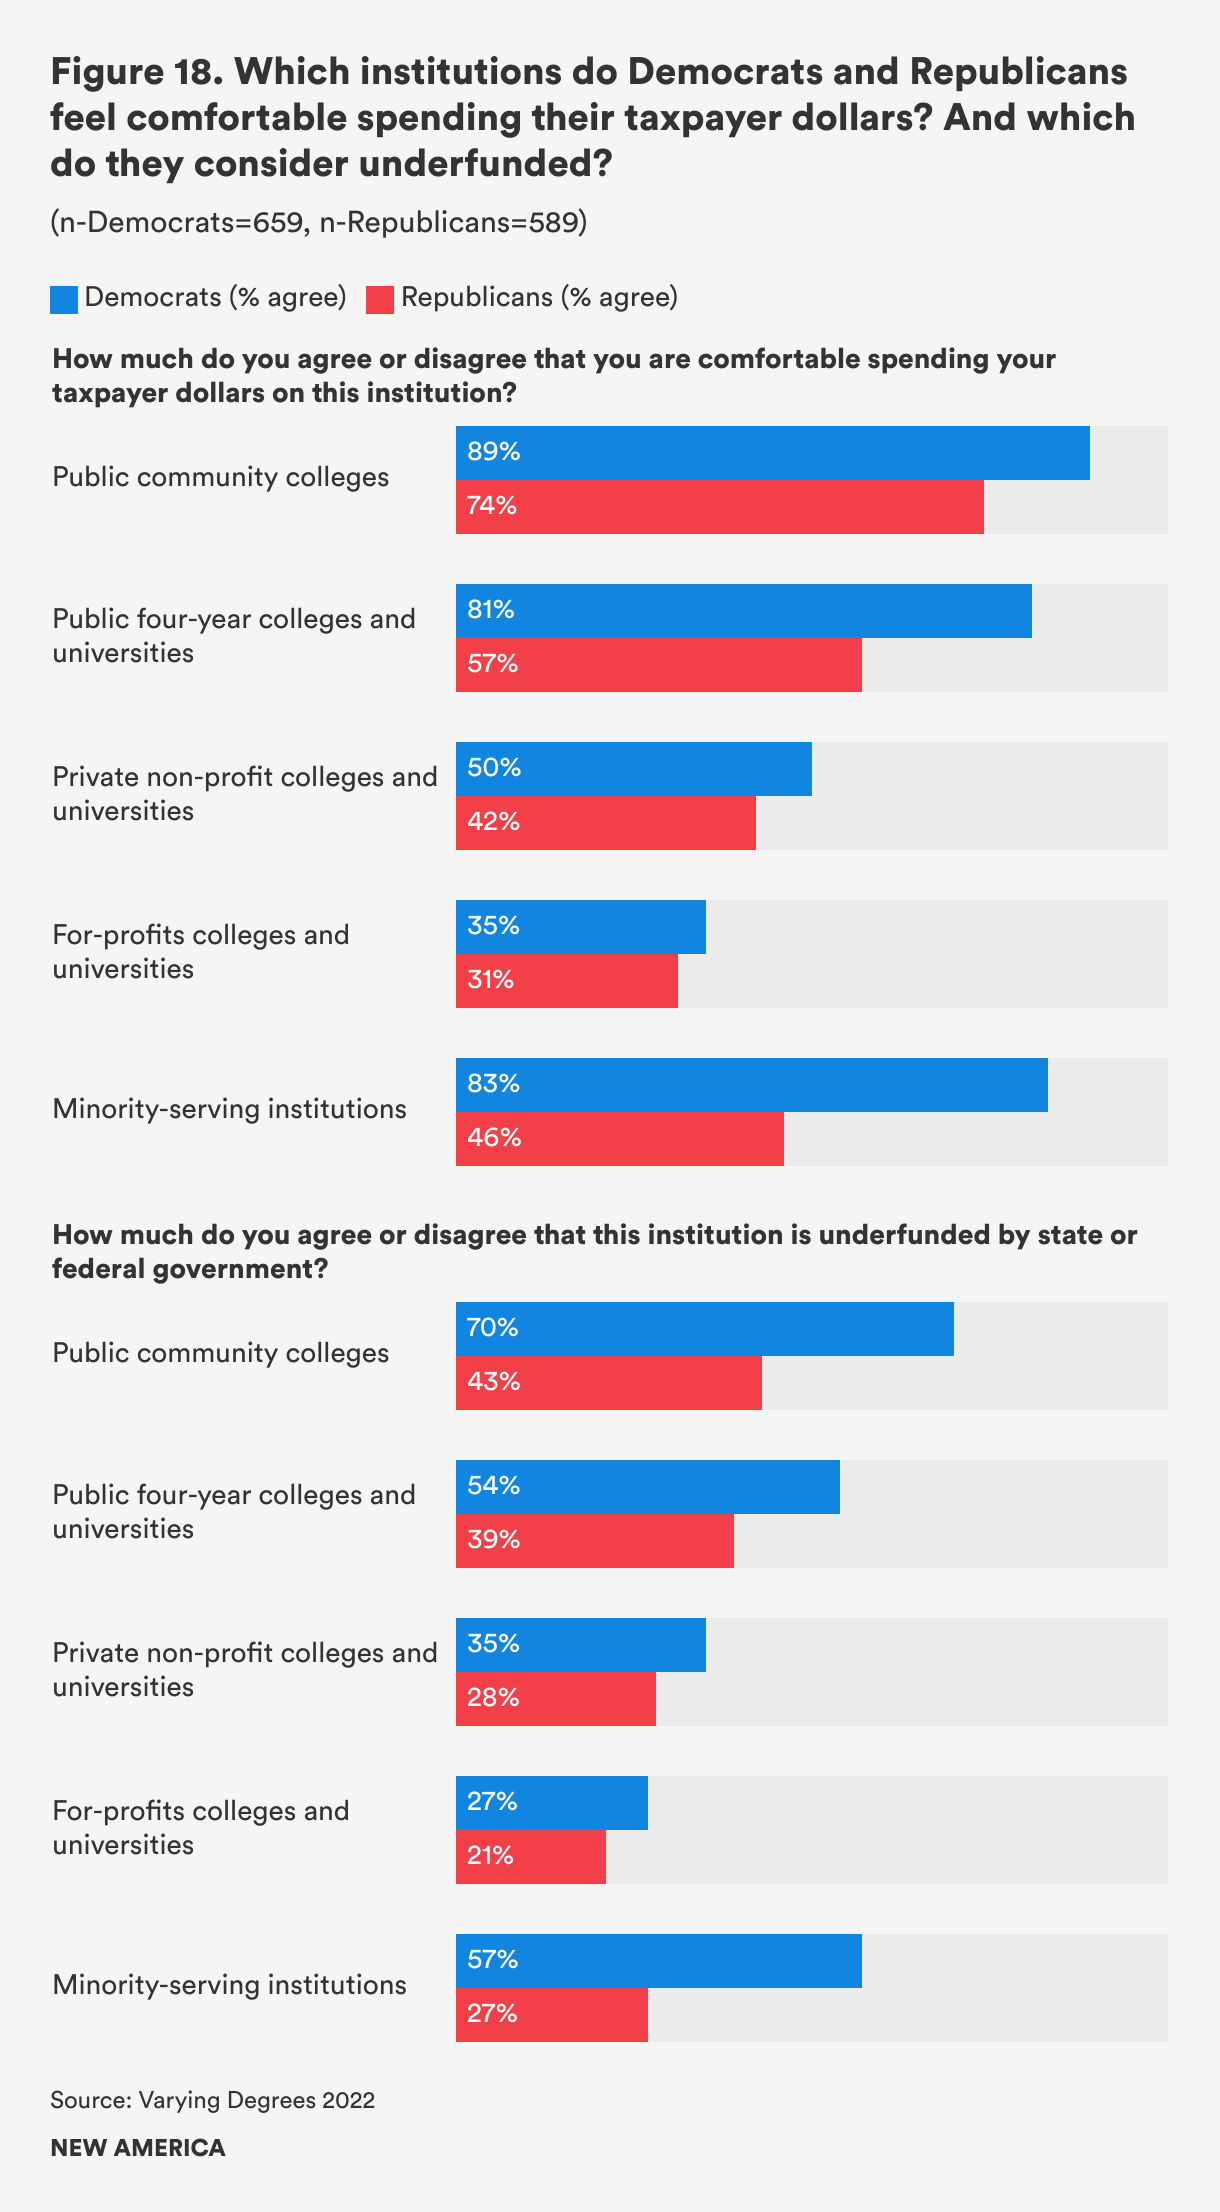
Like the general population, Democrats and Republicans both agree that they are comfortable supporting public two-year and four-year institutions with taxpayer dollars, albeit at different rates. Democrats agree that they are comfortable supporting public two-year (89 percent) and four-year institutions (81 percent) at higher levels than Republicans (74 percent for public two-year, 57 percent for public four-year). A larger proportion of Democrats support using taxpayer dollars to fund MSIs (83 percent) than Republicans (46 percent). Just about half of Democrats are comfortable supporting private nonprofit colleges and universities with taxpayer dollars, compared to 42 percent of Republicans. Neither Democrats nor Republicans agree in the majority that they are comfortable supporting for-profit colleges or universities with taxpayer dollars (35 percent and 31 percent, respectively).
Democrats and Republicans also have divergent opinions as to whether certain higher education sectors are currently underfunded by state and federal government. Approximately 70 percent of Democrats agree the public two-year sector is underfunded, compared with 43 percent of Republicans. Just over half of Democrats agree that the public four-year sector is underfunded, compared to 39 percent of Republicans. And 57 percent of Democrats agree that MSIs are underfunded, compared to just 27 percent of Republicans. (See Figure 18.)
Taking Loans for Degrees That Are In-Person Seen as More Acceptable Than for Online Programs
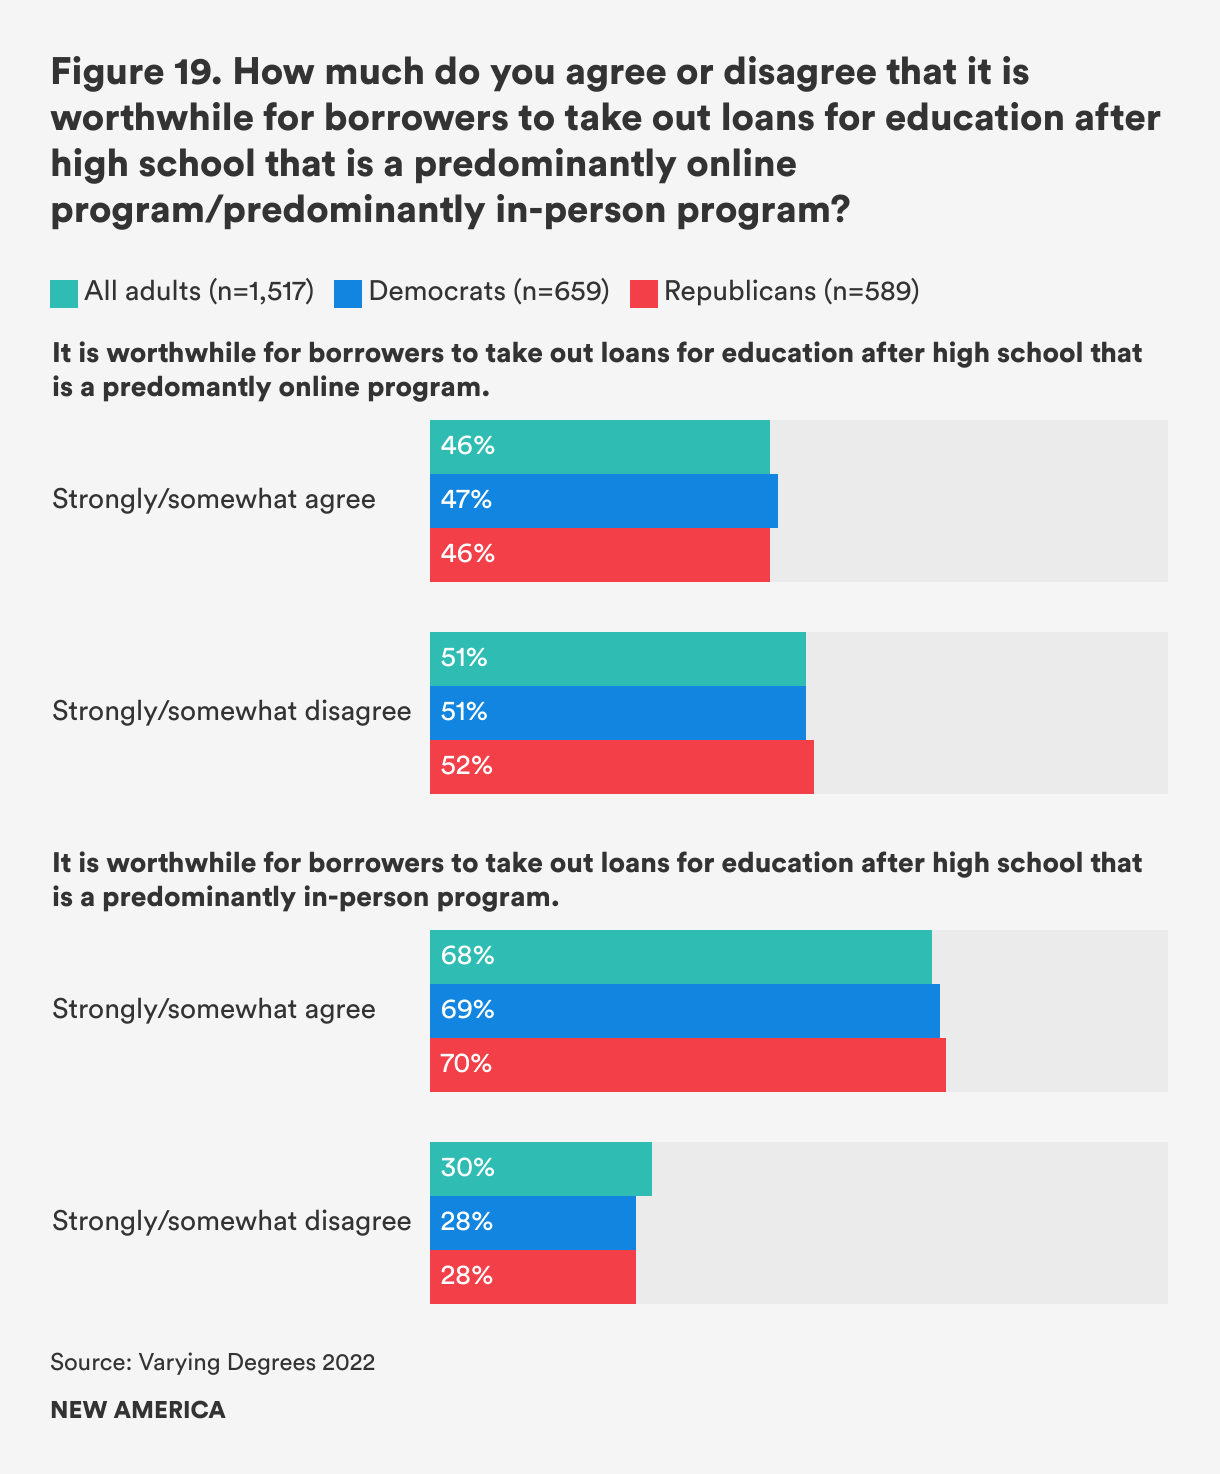
Online education continues to play a big role as we enter year three of the pandemic. This year we asked whether it is worthwhile for borrowers to take out loans for education after high school for predominantly online and predominantly in-person education. Just under half of Americans agree that it is worthwhile to borrow for predominantly online programs, compared to 68 percent who agree that it is worthwhile to borrow for in-person instruction. Republicans and Democrats agreed at similar rates when it came to borrowing for online education (47 percent of Democrats and 46 percent of Republicans), and in-person programs (69 percent of Democrats and 70 percent of Republicans). (See Figure 19.)
Accountability
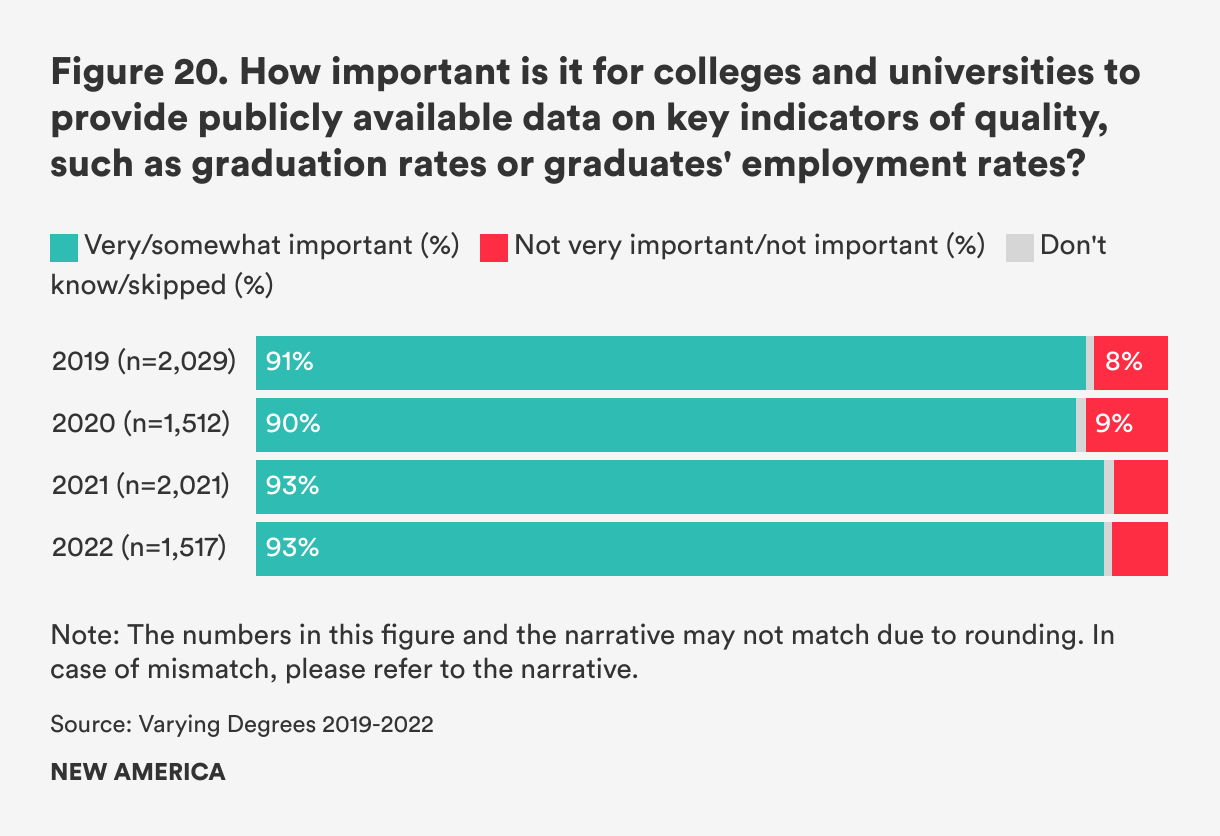
As in previous years, Americans continue to strongly support holding colleges and universities accountable for their student outcomes. Nine in 10 Americans think it is important for colleges and universities to make outcome data, such as graduation rates or graduate employment rates, accessible. This number has remained steady since 2019. (See Figure 20.)
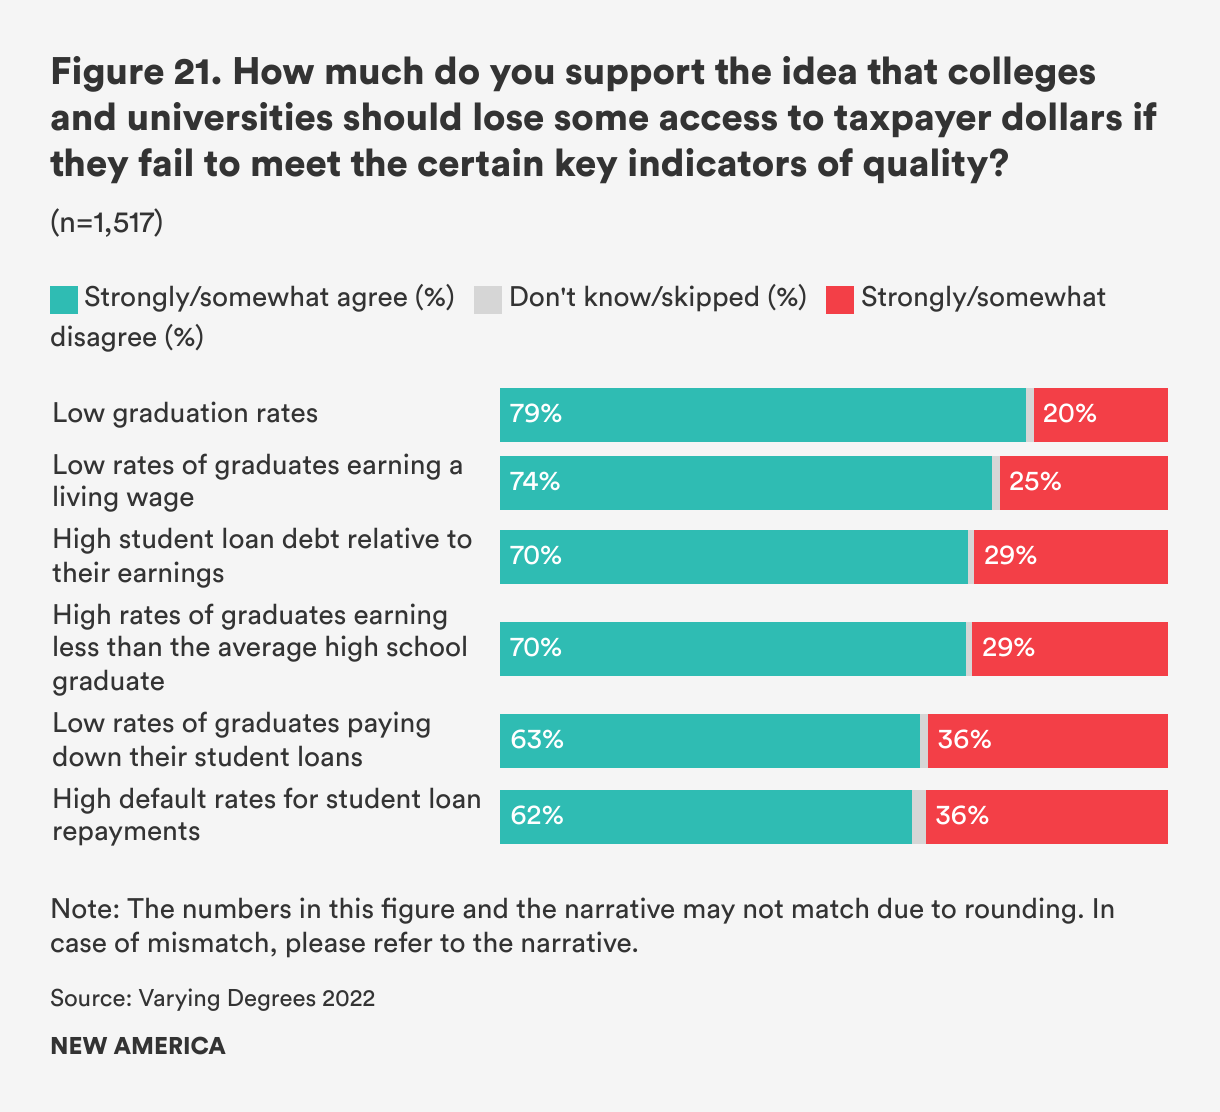
A majority of Americans support the idea that colleges and universities should lose some access to government funding if they have low graduation rates (78 percent), low rates of graduates earning a living wage (73 percent), or high student loan debt relative to earnings (70 percent), all failures to meet certain indicators of quality. (See Figure 21.)
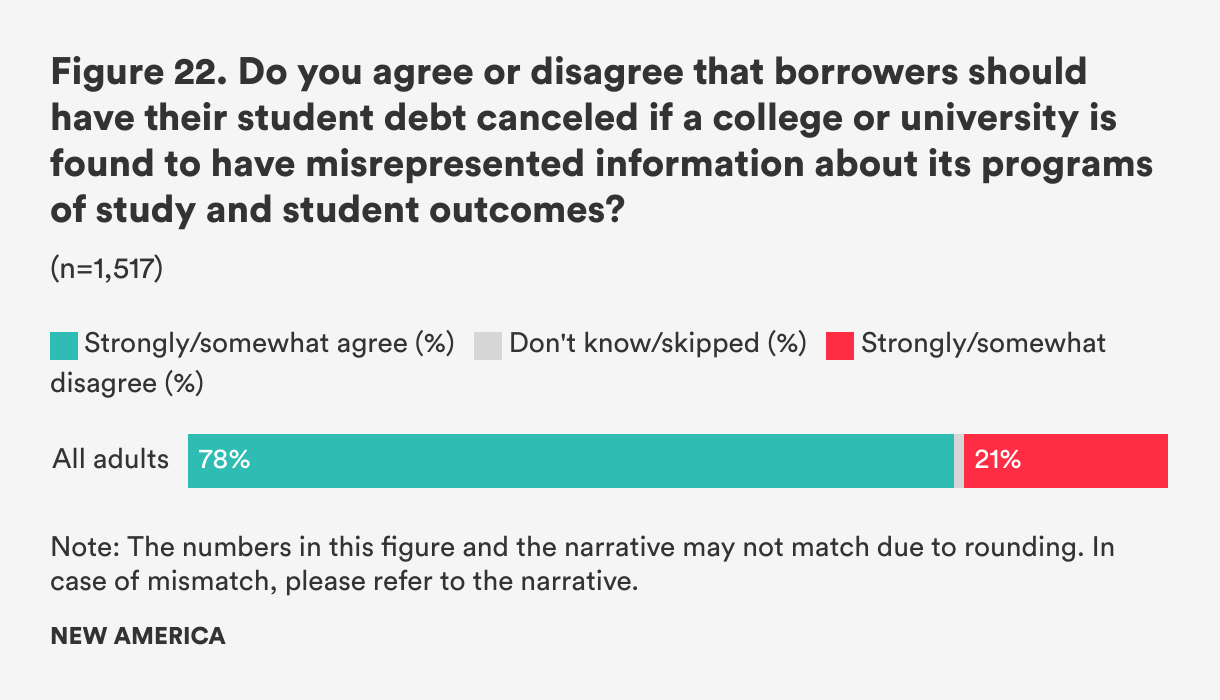
Apart from restricting access to funding for colleges that fail to meet key indicators, the federal government also allows students who have been misled by colleges to apply for “borrower defense to loan repayment” (or “borrower defense” for short),4 a process through which students can have some or all of their federal student loan discharged. The Biden administration in June approved the largest student loan discharge in history for more than 550,000 borrowers who attended the now-defunct Corinthian College, which misrepresented employment outcomes.5 This year, nearly eight in 10 Americans (79 percent) support this measure. (See Figure 22.)
Accountability is one issue where Democrats and Republicans are aligned. High levels of both Democrats (96 percent) and Republicans (90 percent) support greater transparency on quality data such as graduation rates or graduate employment rates. Both parties agree that colleges and universities should lose some access to taxpayer money if they fail to meet certain indicators of quality. On the question about canceling debts for borrowers who were misled by their colleges, most Democrats (91 percent) and a smaller number of Republicans (63 percent) support the idea.
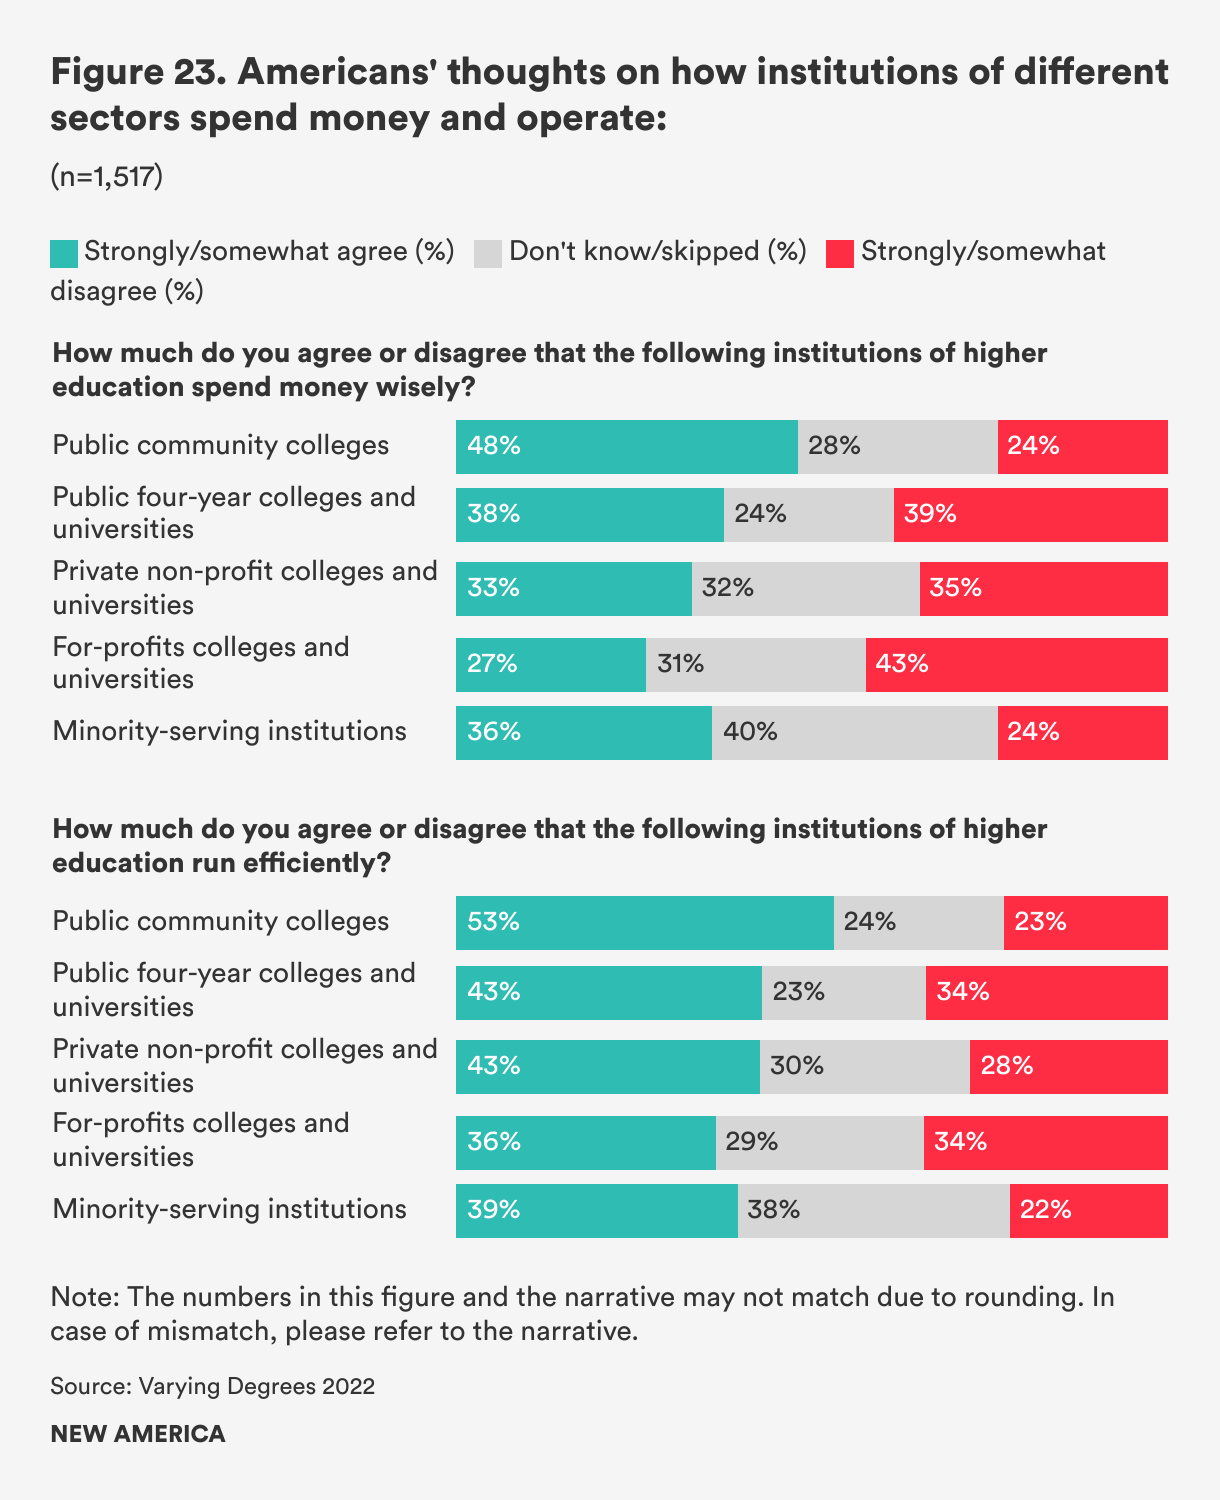
Opinion on College & University Spending Declines
While Americans generally have a favorable opinion of colleges and universities across all sectors, they are less positive about whether colleges and universities operate efficiently or spend their money wisely. Only around half of Americans believe community colleges are running efficiently and spend money wisely. The numbers drop for the other sectors: for public four-year colleges, only 43 and 38 percent, respectively, think they are running efficiently and spending money wisely; for private nonprofit colleges, the numbers are 43 and 33 percent, respectively; for for-profit colleges, the numbers are 36 and 27 percent; and for MSIs, the numbers are 39 and 36 percent. (See Figure 23.)
Compared to Democrats, Republicans agree at lower rates that colleges operate efficiently and spend their money wisely, even for community colleges, which usually see broad support from both parties. Nearly two thirds of Democrats (61 percent) think community colleges are running efficiently, compared to only half of Republicans (51 percent). And while 53 percent of Democrats think community colleges are spending money wisely, less than half of Republicans (46 percent) think so.
Focus Feature: Test-Optional Admissions
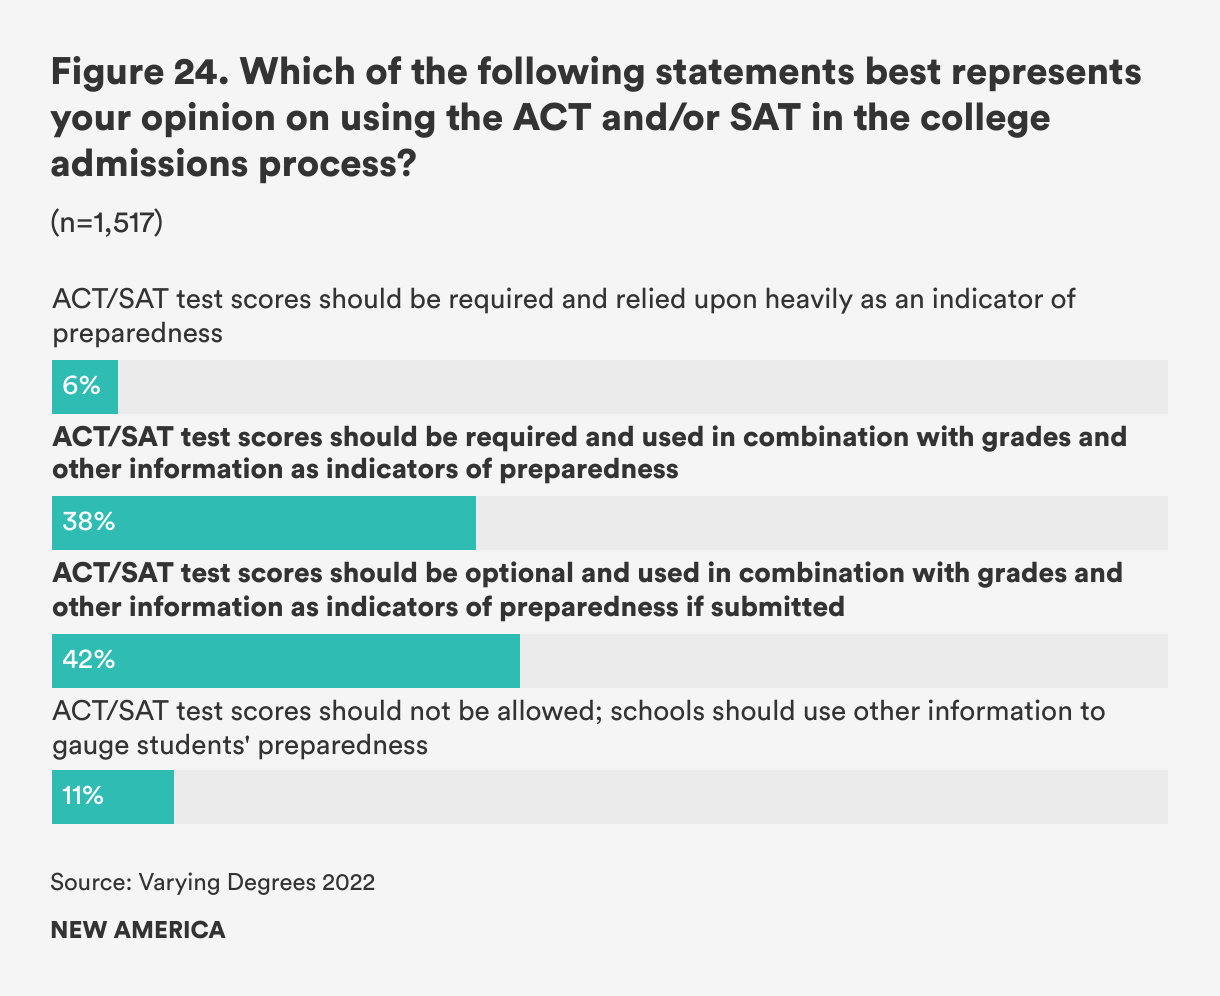
This year, the Varying Degrees poll asked several questions about the use of testing in college admissions, given the movement towards test-optional admissions during the pandemic. Americans have varying perspectives on the value and use of SAT and ACT scores in the admissions process, though few (6 percent) believe that the scores should be heavily relied upon when institutions make admissions decisions, and some believe that test scores should not be considered at all (11 percent). (See Figure 24.)
There are demographic differences in race and political affiliation when it comes to support for test-free or optional admissions: higher proportions of Black (47 percent) and Latinx (45 percent) respondents support test-optional policies than White (41 percent) and Asian (34 percent) respondents. Nearly half of Democrats support test-optional admissions, compared to about one-third of Republicans.
Almost 40 percent of respondents believe that SAT and ACT scores should be required but used in combination with other admissions materials. Republicans were 17 percentage points more likely to support this policy than Democrats (48 percent Republican versus 31 percent Democrat). Asian (55 percent) and White (42 percent) respondents were significantly more likely than Latinx (29 percent) and Black (26 percent) respondents to support the use of standardized tests as a requirement of college applications.
Strong and significant differences emerged among age groups. Gen Z respondents supported test-optional policies at notably higher rates (60 percent) than Millennials (45 percent), Gen X (43 percent), and Baby Boomers (35 percent). Older respondents were more likely to agree that test scores should be a required part of the admissions process: a majority of Baby Boomers (53 percent) supported mandating the SAT or ACT, compared to approximately one-quarter (24 percent) of Gen Z respondents.
Focus Feature: Household Financial Literacy & Security
With the economic outlook hazy, in this year’s Varying Degrees we asked those we polled about their thoughts on their own finances, along with more global questions about student lending and the largest forms of consumer debt in America.
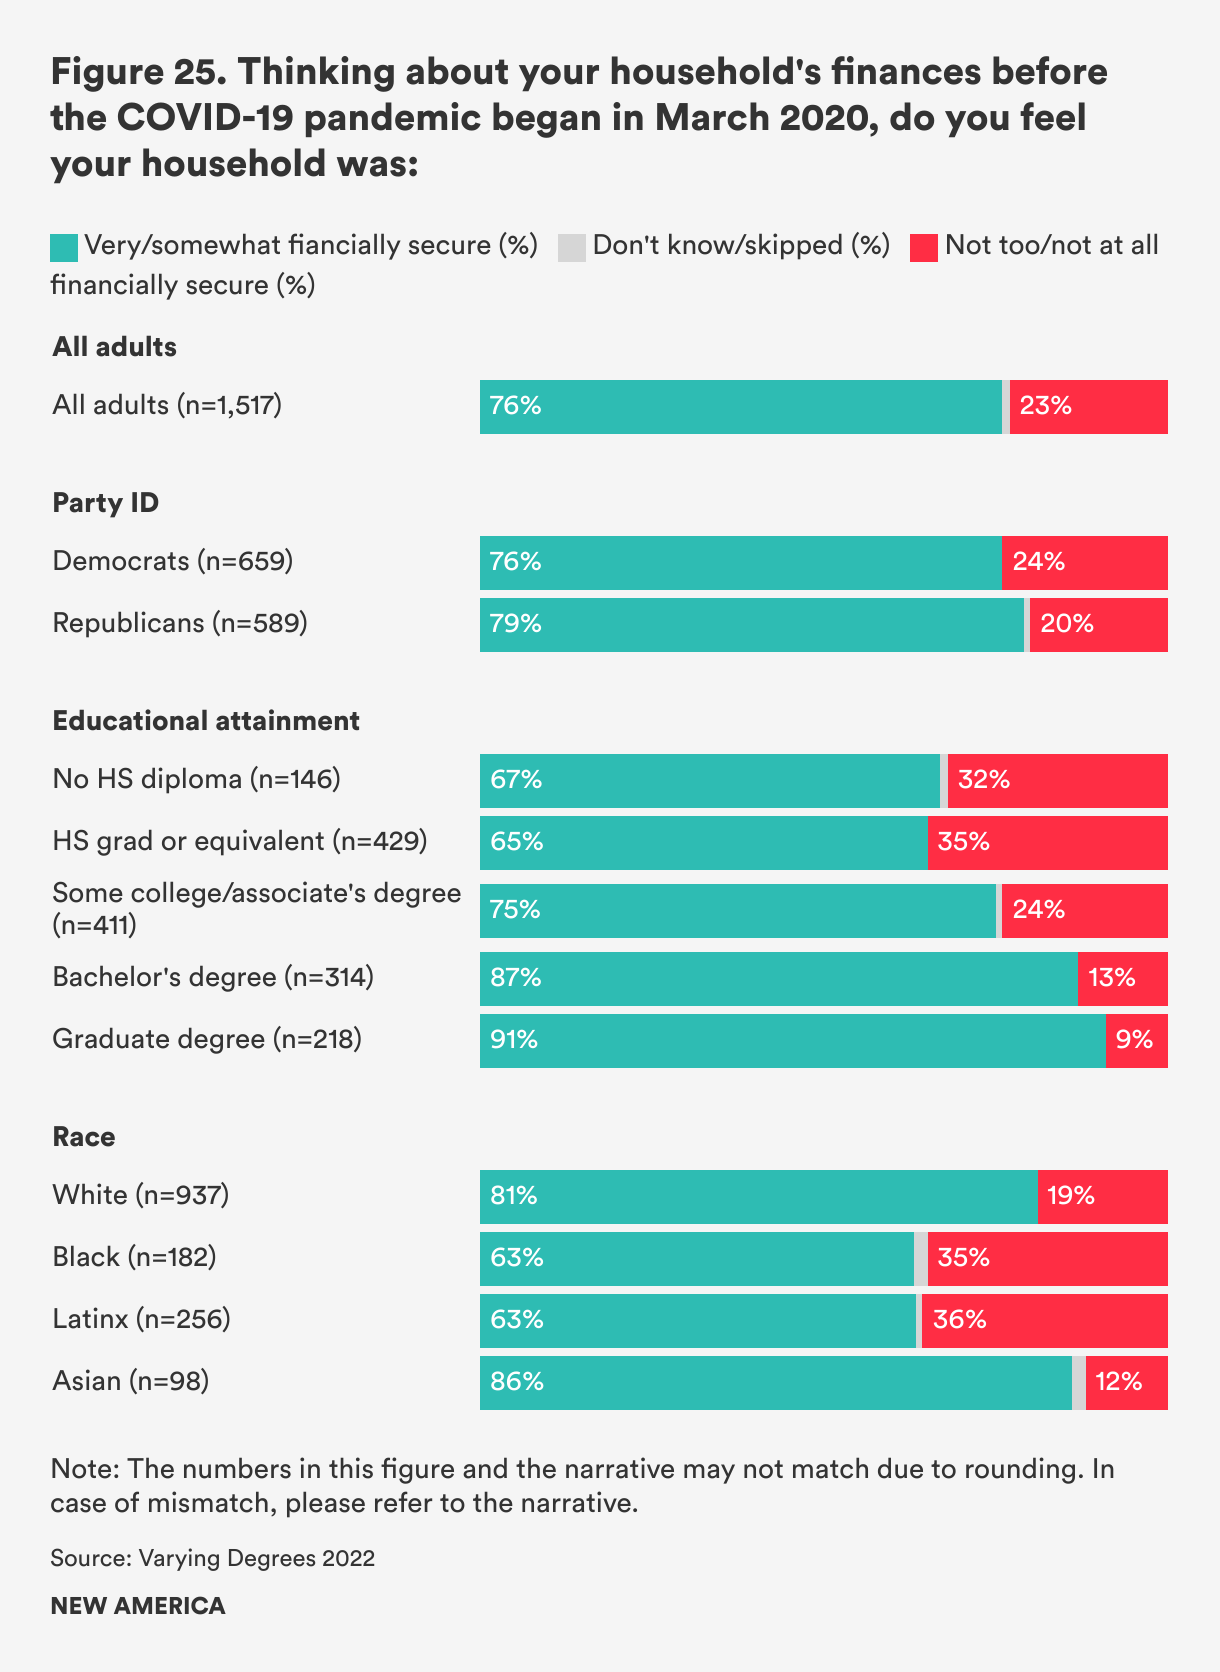
Thinking about their household’s finances before the pandemic began in March 2020, a majority of respondents—76 percent—felt their household was economically secure. Both Democrats (76 percent) and Republicans (79 percent) regarded their family finances this way.
There were, however, stark contrasts in this answer when we looked at educational attainment and race. The higher the educational attainment of the respondent, the more likely they were to say that their households were economically secure. For example, 65 percent of high school graduates with no higher education said they were economically secure compared to 87 percent of those with bachelor’s degrees. White and Asian Americans were more likely to say they had been economically secure pre-pandemic than Black and Latinx respondents. (See Figure 25.)
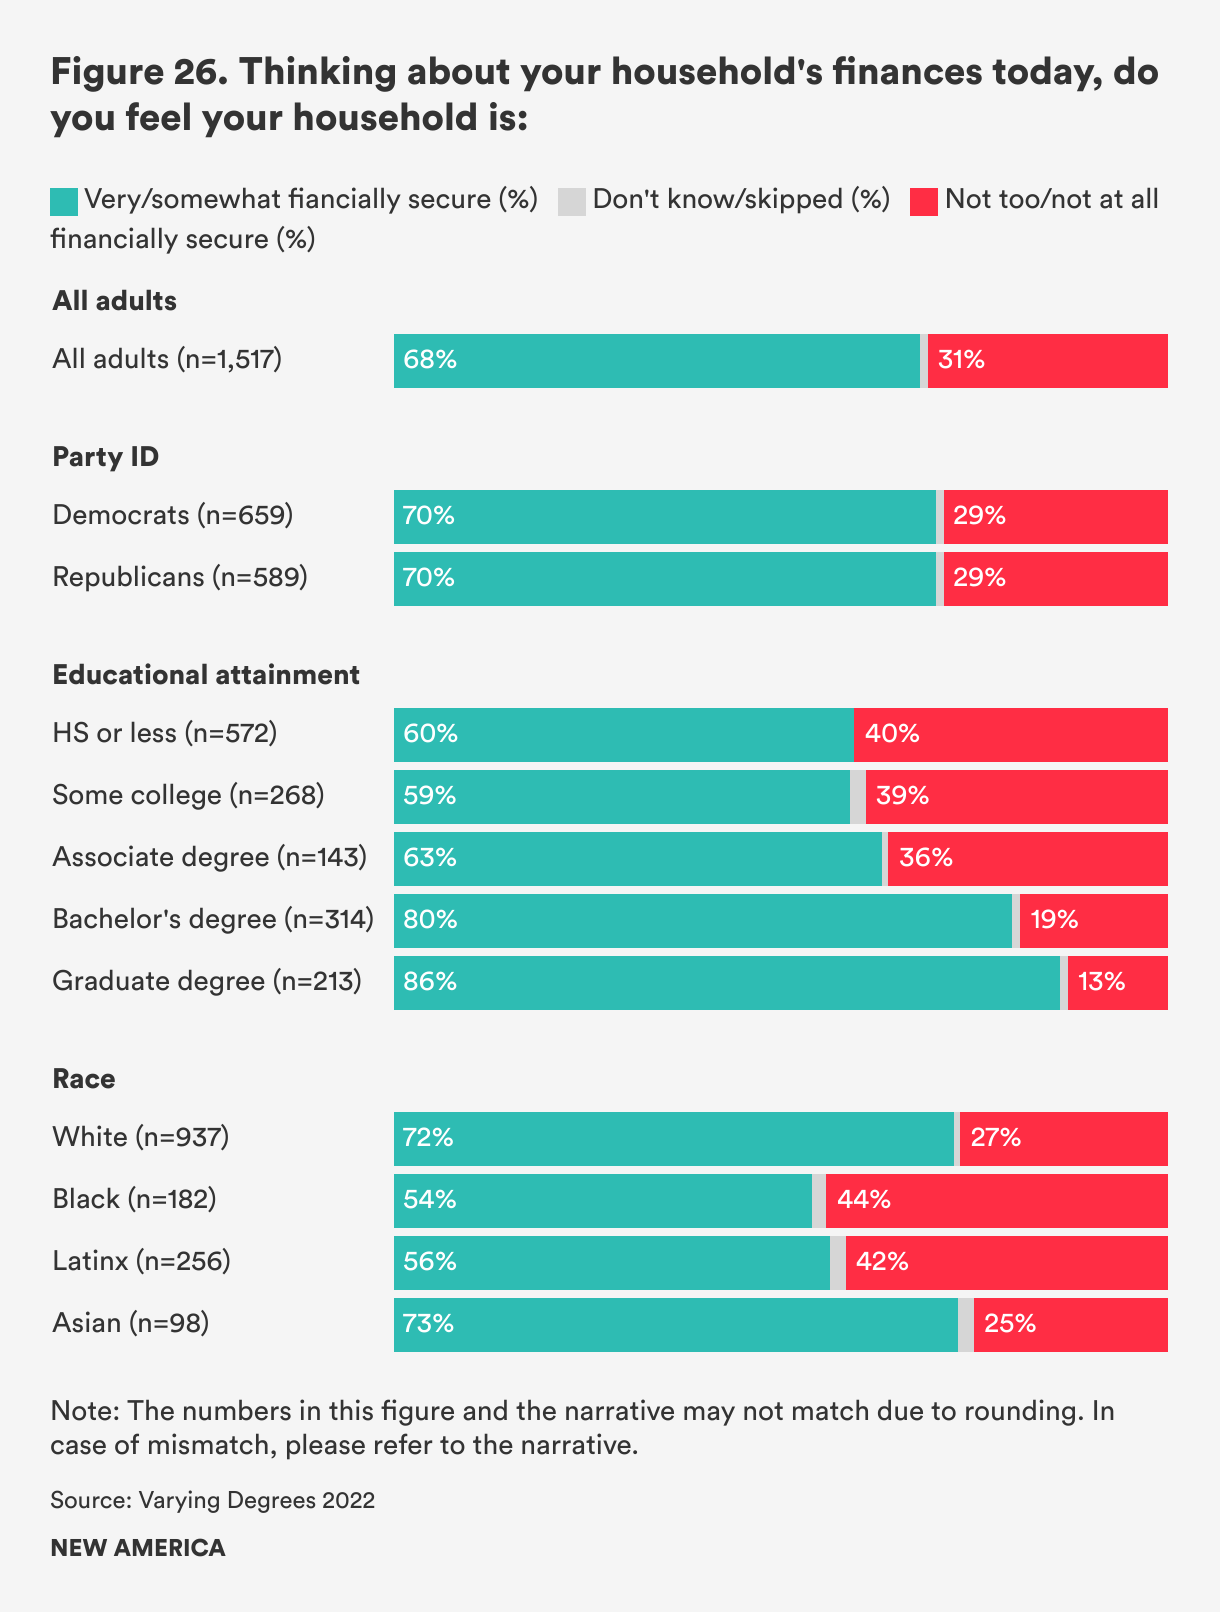
When it comes to their finances today, there has been a significant decline in economic security, but people still think their household’s finances are secure in the majority (68 percent). Like the previous questions, Democrats and Republicans are aligned in feeling that their households are currently economically secure (70 percent for both). Again, we saw a difference when we looked at educational attainment, with 60 percent of high school graduates with no college degree saying they were financially secure compared to 80 percent of those with a bachelor’s degree. White and Asian Americans said they were more economically secure (73 percent for both) than Black (54 percent) and Latinx (57 percent) respondents. (See Figure 26.)
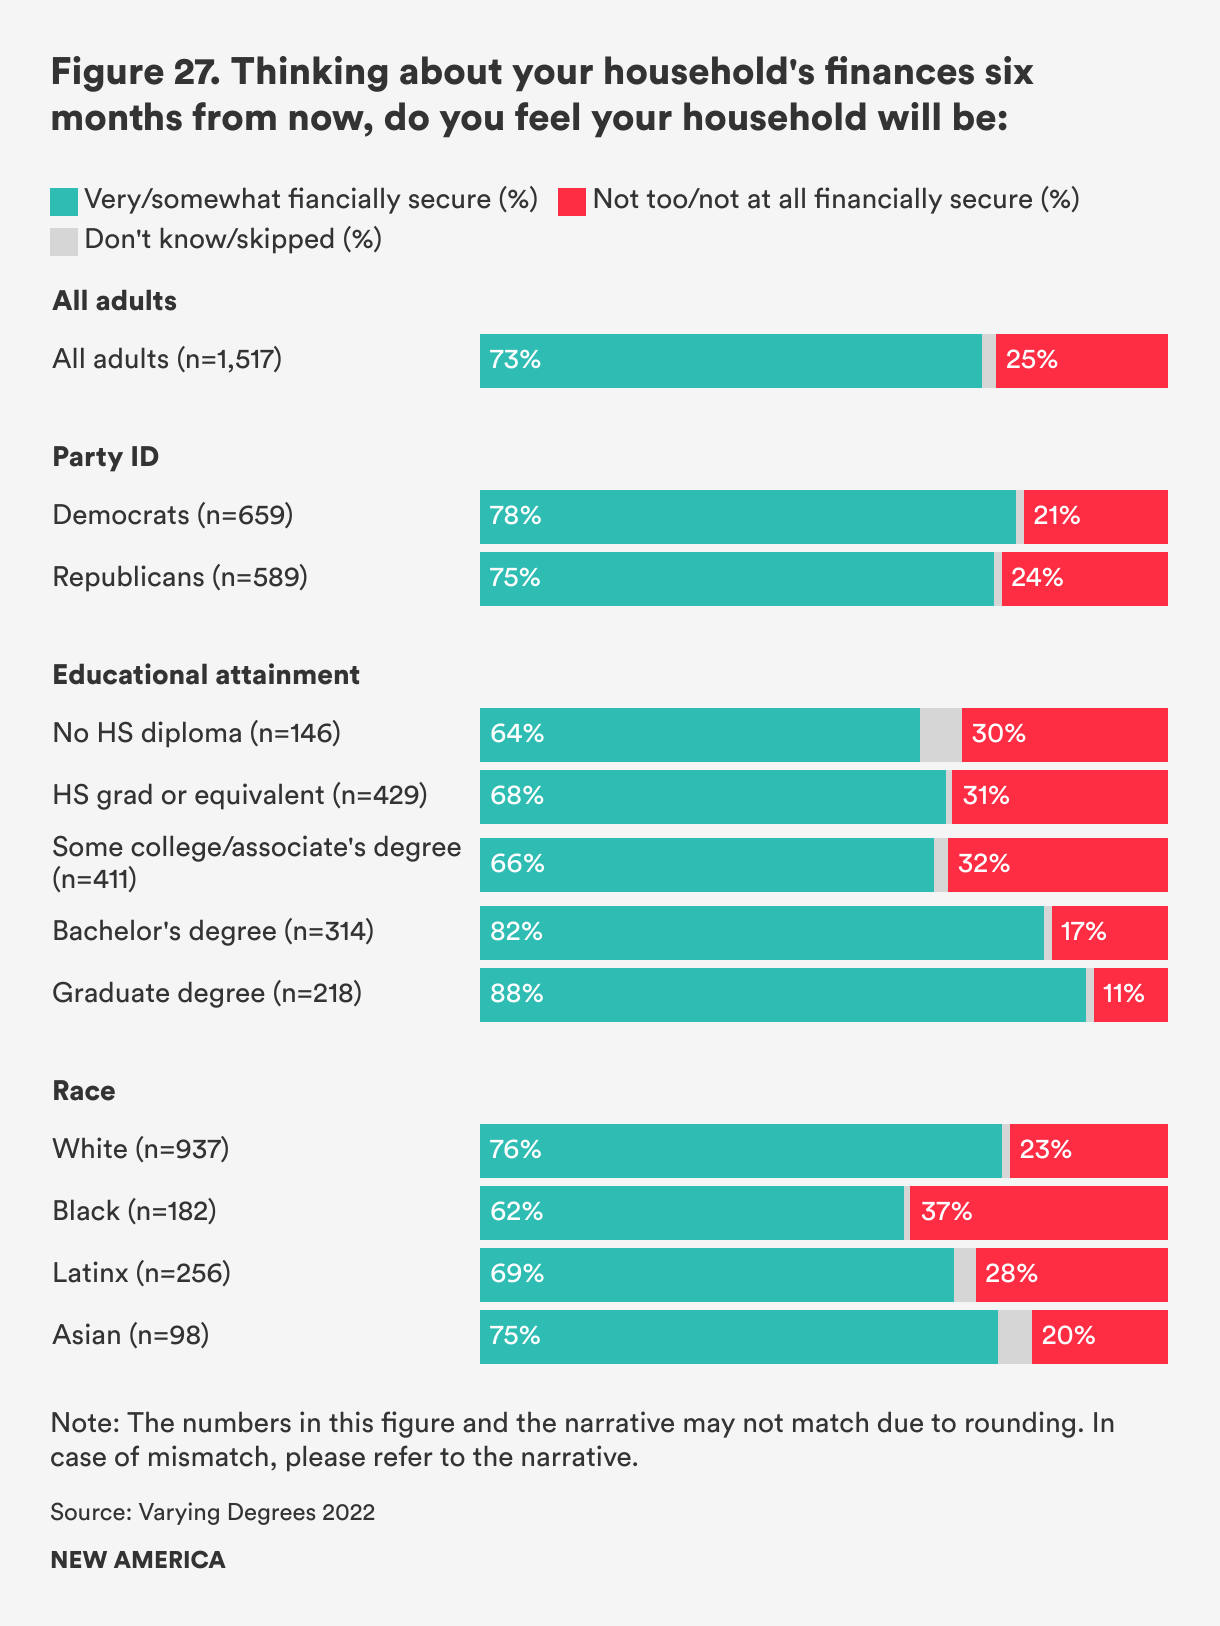
Thinking about household finances six months from now, respondents were optimistic. Overall, 73 percent felt that their household would be economically secure, with 78 percent of Democrats and 74 percent of Republicans saying so. There were some notable differences by race, with 76 percent of White and Asian Americans saying they planned on being economically secure, as compared with 61 percent of Black and 69 percent of Latinx respondents. (See Figure 27.)
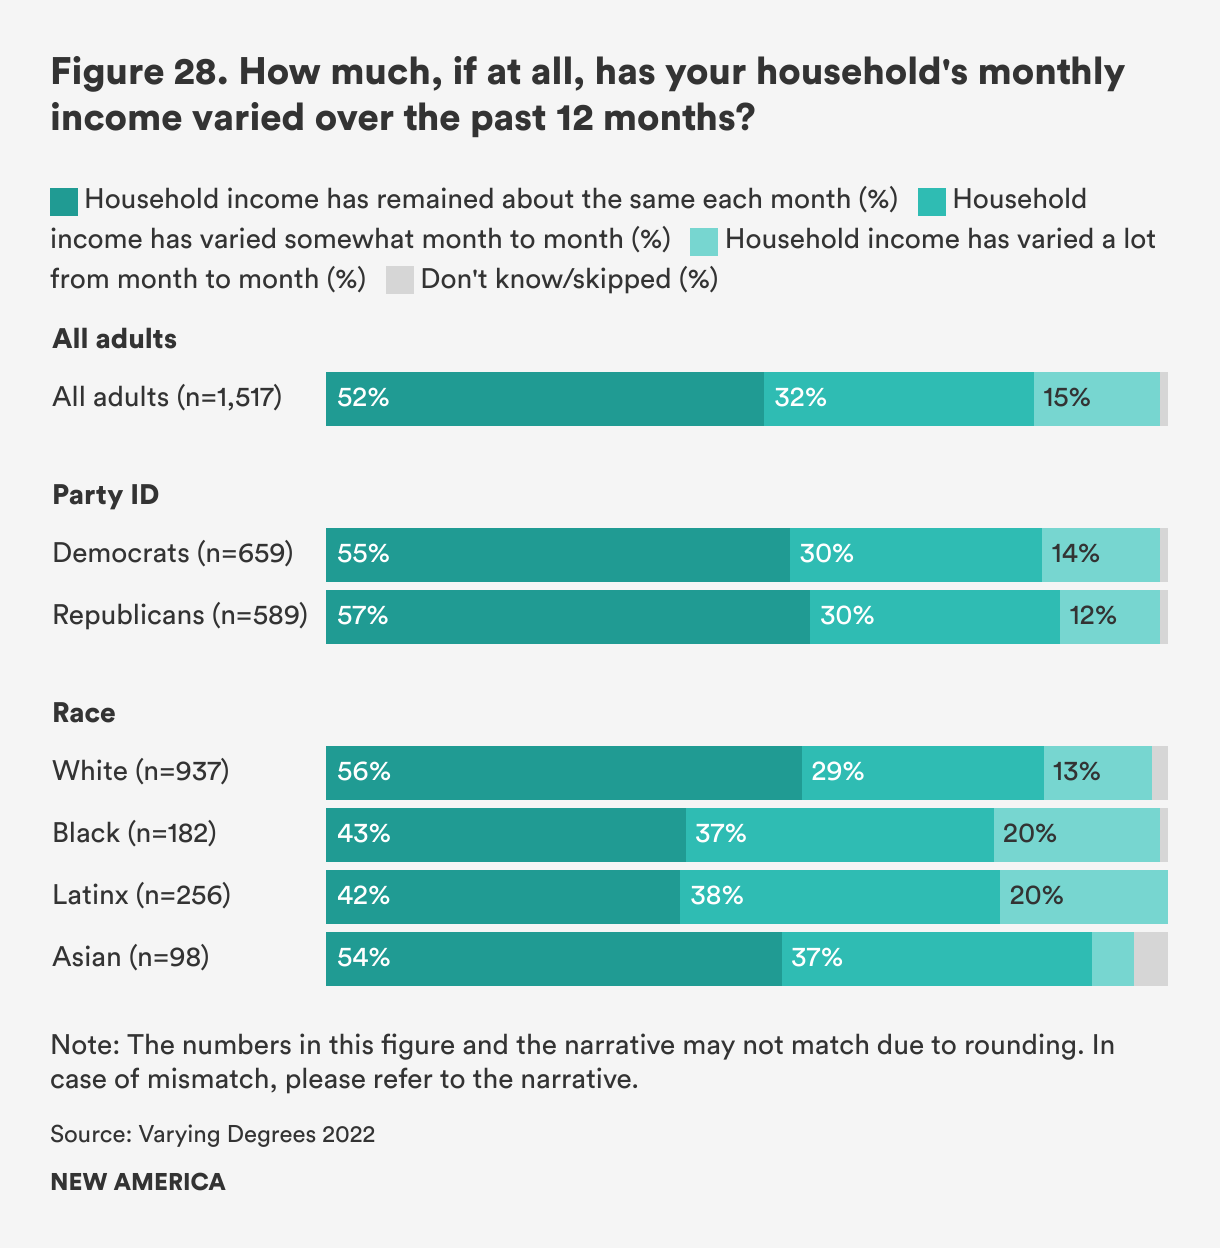
When asked how much, if at all, monthly income has varied over the past six months, nearly half (47 percent) said it varied at least somewhat, with a small proportion of those (15 percent) saying it varied a lot. Black and Latinx (20 percent for both) Americans said that their incomes varied a lot at higher rates than White and Asian Americans (13 and 5 percent, respectively). (See Figure 28.)
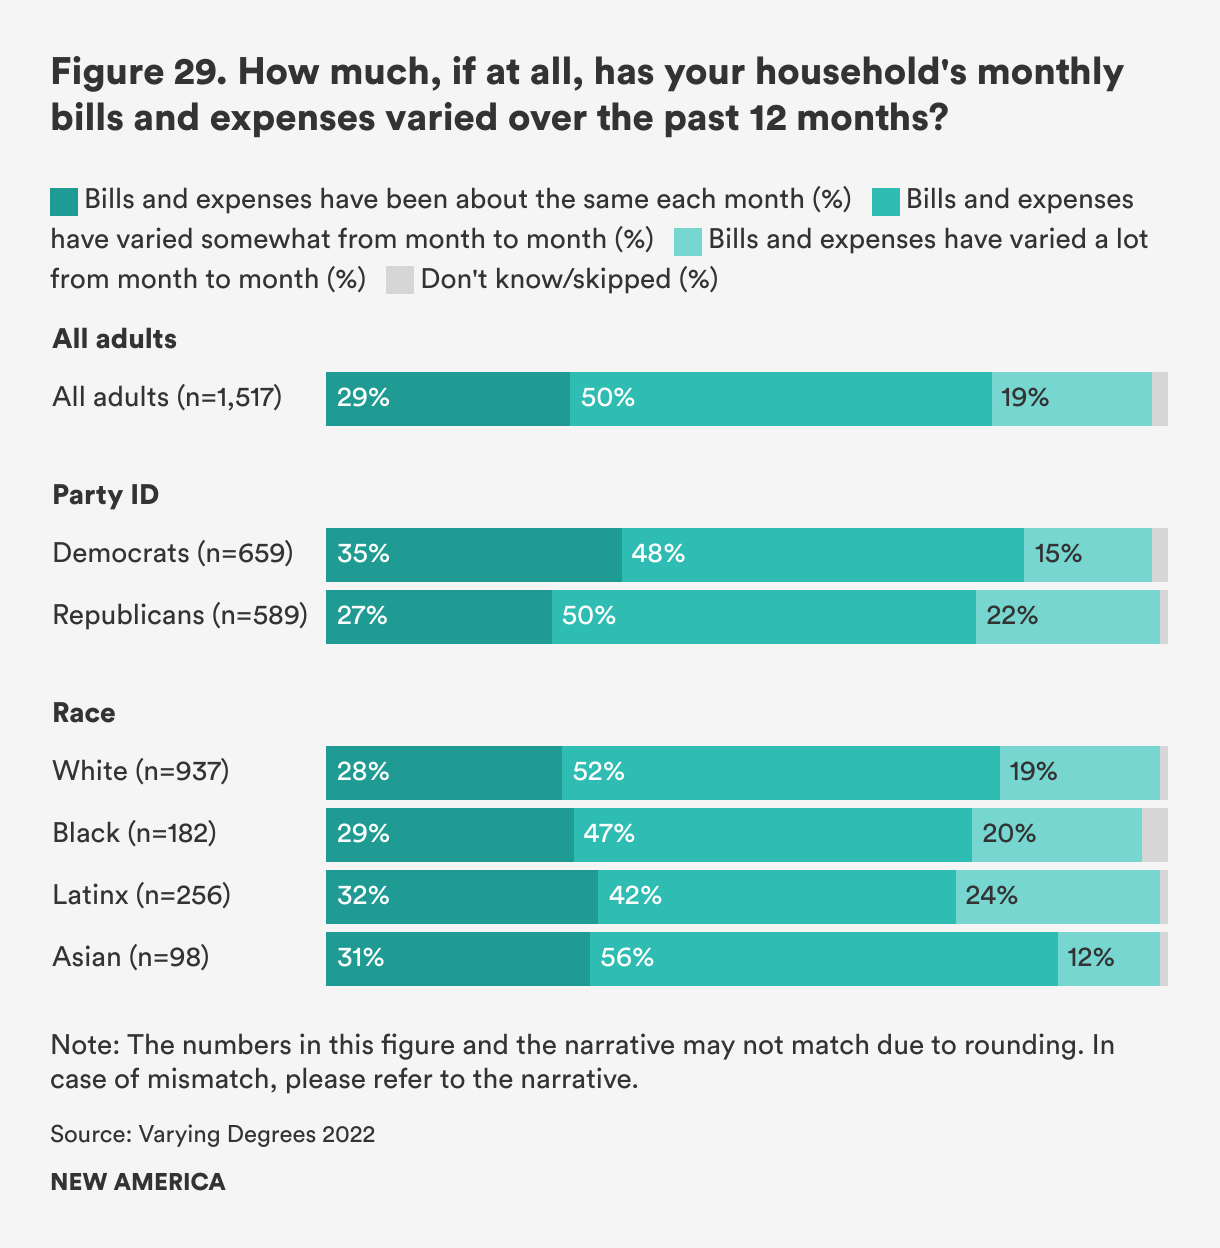
Along with experiencing at least some variability in income over the past six months, 69 percent of respondents experienced at least some variability in monthly bills and expenses, with almost a fifth saying their monthly bills varied a lot. Republicans (22 percent) were more likely to say that their bills varied a lot than Democrats (15 percent). (See Figure 29.)
Perceptions versus Reality: Americans’ Perceptions of Student Loan Borrowing and Consumer Debt
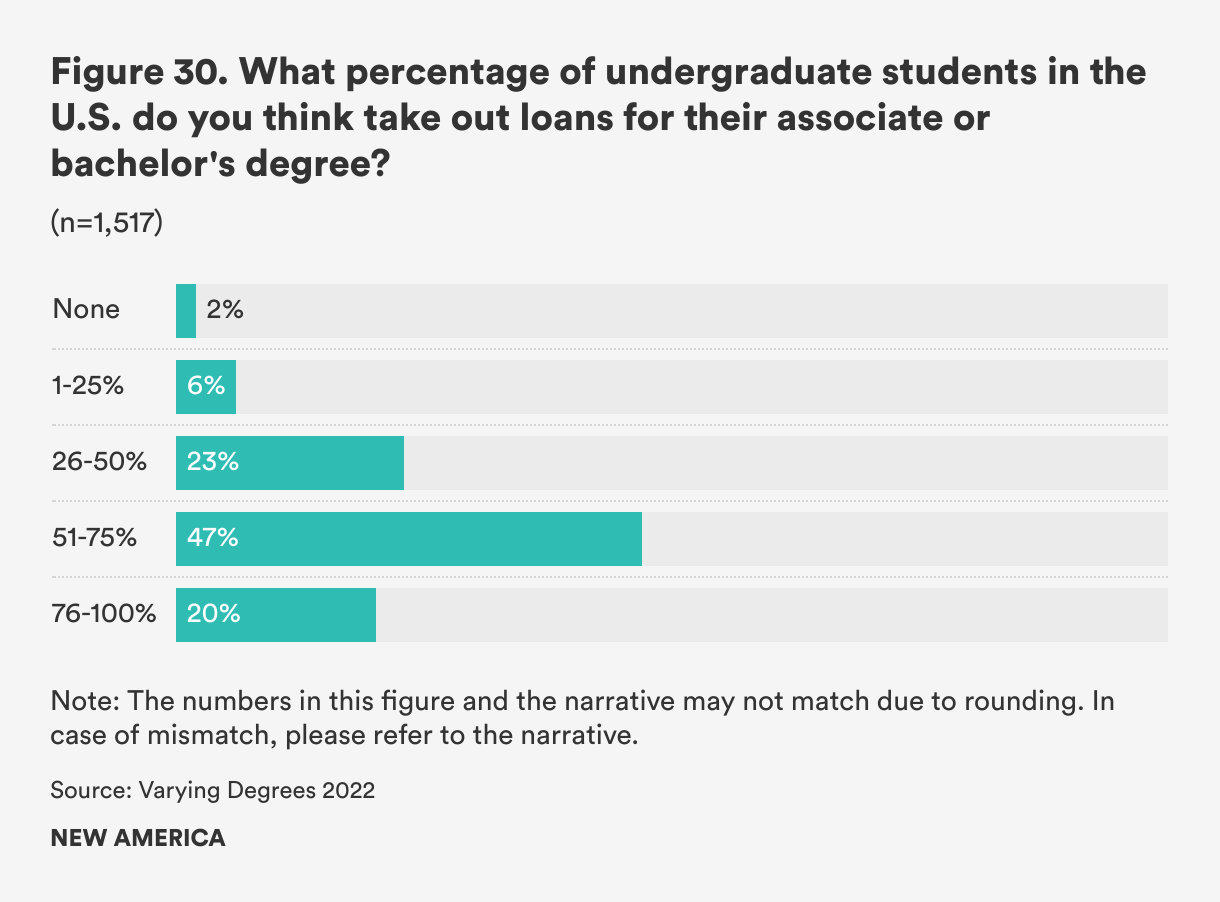
This year we asked two questions to see how perceptions of student loan borrowing and consumer debt reflect reality. Overall, about two-thirds of respondents believe that a majority of students borrow for their undergraduate degrees. (See Figure 30.)
Americans’ views are not far off from reality. According to U.S. Department of Education data, 60 percent of students who started their higher education in 2012, the most recent year for which we have data, took out loans for their undergraduate programs.6
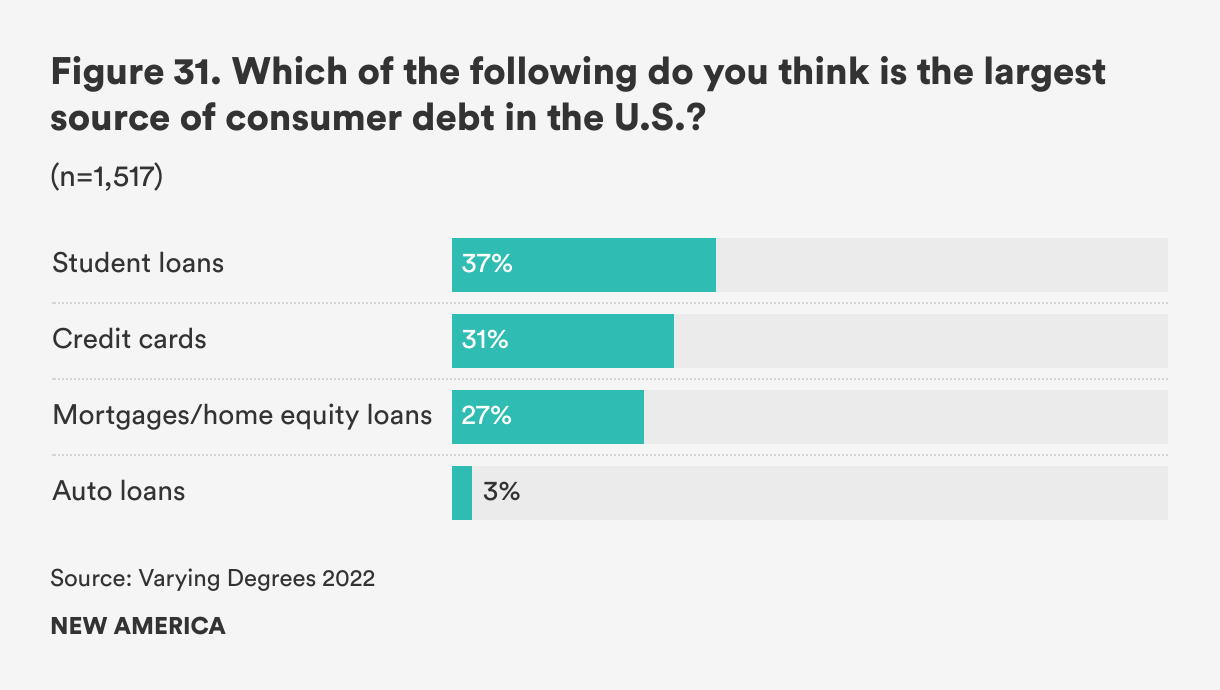
Americans believe that the largest source of consumer debt in the U.S. is student loan debt. But student loan debt, currently at $1.59 trillion, is dwarfed by mortgage and home equity loans, which stand at $4.35 trillion. Auto loans fall not far behind student loan debt, at $1.47 trillion, with credit card and other debts at $1.29 trillion.7 (See Figure 31.)
Citations
- In the Varying Degrees survey, Generation Z includes people who were born in and before 1995, Millennials include those born between 1980 and 1994, Generation X includes those born between 1965 and 1979, Baby Boomers include those born between 1946 and 1964, and the Silent Generation includes those born in and before 1945. We omitted data on the Silent Generation this year, due to small sample size.
- Jon Marcus, “More Colleges and Universities Outsource Services to For-profit Companies,” The Hechinger Report, January 8, 2021, source.
- Robin Howarth and Lisa Stifler, The Failings of Online For-profit Colleges: Findings from Student Borrower Focus Groups (Washington, DC: Brookings, March 2019), source.
- Federal Student Aid (website), “Borrower Defense Loan Discharge,” source.
- U.S. Department of Education, “Education Department Approves $5.8 Billion Group Discharge to Cancel All Remaining Loans for 560,000 Borrowers Who Attended Corinthian,” press release, June 1, 2022, source.
- New America analysis of U.S. Department of Education Beginning Postsecondary Students (BPS) survey. BPS:2012/2017, source.
- Federal Reserve Bank of New York (website), “Center for Microeconomic Data: Household Debt and Credit Report,” source.