
Table of Contents
- Introduction
- Where We Have Been: The History of Gerrymandering in America
- How Gerrymandering Got So Nasty: Means, Motive, and Opportunity
- Redistricting Reform
- Can Commissions Make Districting Fairer?
- 2021–2022 Reapportionment and Commissions
- Alternatives to American-Style Districting
- Areas for Future Research
- Conclusion
- Appendix
Can Commissions Make Districting Fairer?
In the previous section, we discussed the criteria typically used to evaluate redistricting. To review, analysts rely on five broad criteria for evaluating district boundaries.
- Partisan neutrality
- Competitiveness
- Minority representation
- Keeping existing communities together
- Compactness
Partisan Neutrality
The basic idea of partisan neutrality is simple on the surface: districting plans should not favor either party. But in practice, no plan is truly neutral. Despite decades of scholarship, academics cannot agree on a measure of partisan neutrality (though all competing measures are correlated). The disagreements stem from the difficulties in establishing a baseline of fairness, given the peculiarities of districting.
Additionally, partisan neutrality is frequently in conflict with the other criteria for districting, as we will see below.
Competitiveness
Competitiveness is a similarly intuitive concept on the surface. Districts should be competitive between the two major parties. Voters should have a say in who represents them. But, like partisan neutrality, competitiveness is also more complicated a concept than it first appears. Some of this is a matter of measurement—at what point does a district cross over from being competitive to safe is more of a judgment call than a precise analysis. Is it 5 percent? More? Less?
Ensuring districts are fair to both parties typically means making sure that both Democrats and Republicans have a rough balance of districts, which typically means giving them both more safe districts. More profoundly, in an era in which Democrats and Republicans simply live in different places, drawing competitive districts is especially in tension with keeping communities together and ensuring compact districts.
Fair Minority Representation
In theory, the diversity of representation in Congress should look like the diversity in the country at large. In practice, this is difficult to achieve. Under the Voting Rights Act of 1982, states were directed to draw majority-minority districts to increase the number of minority representatives, on the thinking that minority candidates would be unable to win in majority white districts, and minority voters should be able to elect representatives who look like them. While majority-minority districts have indeed increased the share of minority representatives as intended, they have also worked against competitiveness and to some extent partisan fairness. Because minority voters in America overwhelmingly support Democrats, majority-minority districts are rarely, if ever two-party competitive. And because these districts tend to be lopsidedly Democratic, Democratic voters can be “inefficiently” concentrated in majority-minority districts, working against overall partisan neutrality.
Keeping Communities Together
Communities should be kept together in the drawing of districts. Again, sounds simple in principle: Cities and towns and neighborhoods should not be split. On the converse, natural borders should be respected. But again, this simple principle is more complicated in practice. First, since statewide districts must be of roughly equal size, larger cities and towns will inevitably need to split in the line-drawing process. But more challengingly, keeping communities together can work against both competitiveness and partisan balance. Democrats and Republicans live separately. And under single-member districts, both partisan fairness and district competitiveness are extremely sensitive to where voters live.
Compactness
A final criteria is district compactness. This is generally the least important criteria, but as a general rule, it is probably better for districts to cover something resembling a geographically compact space. Some of this is aesthetics. When you look at funny-looking, salamander-shaped districts that wind narrowly and seemingly arbitrarily across states, you cannot help but assume they were drawn for partisan gain, and therefore you question the map’s legitimacy. Moreover, to the extent that the theory of representation under single-member districts envisions the district as some kind of coherent unit of representation, such serpentine stretches strike at the theory. However, achieving the four other criteria above (especially partisan neutrality and competitiveness) frequently means that districts will inevitably contain odd and unexpected juts.
In theory, a “fair” map is one that meets all five of these criteria. In practice, however, these criteria are often in tension with one another, especially partisan neutrality and competitiveness, which makes it virtually impossible to satisfy them all at once.
Moreover, though all five of these standards may appear intuitive at first, they become much more complex when one attempts to measure them. Indeed, analysts have not settled on a single measure of any of these five standards.
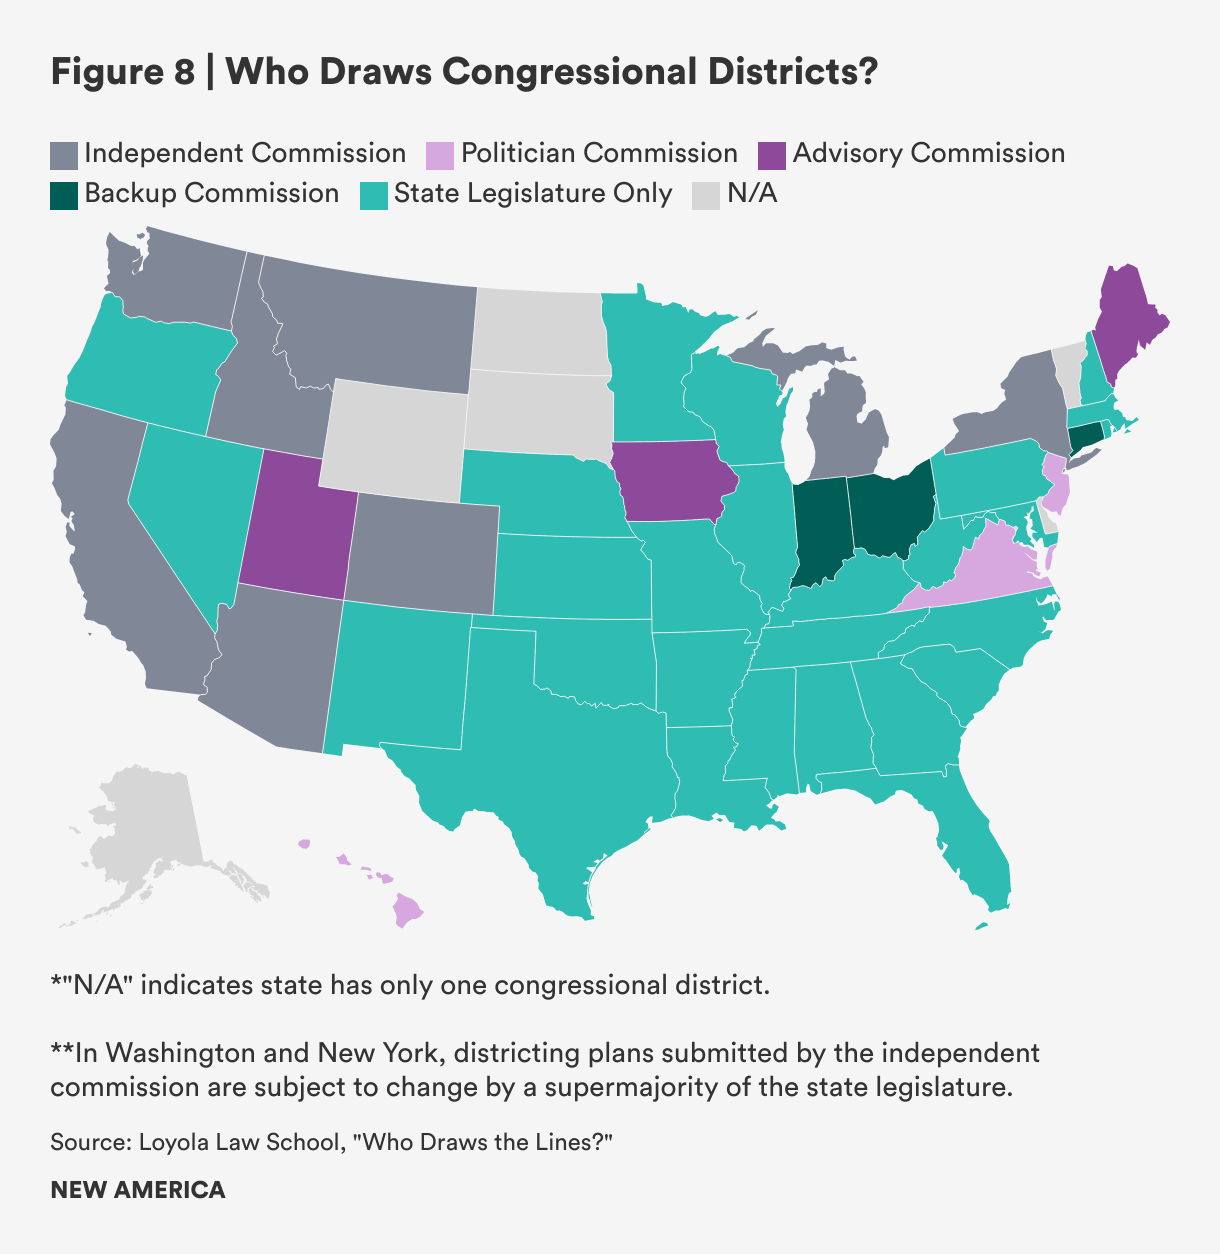
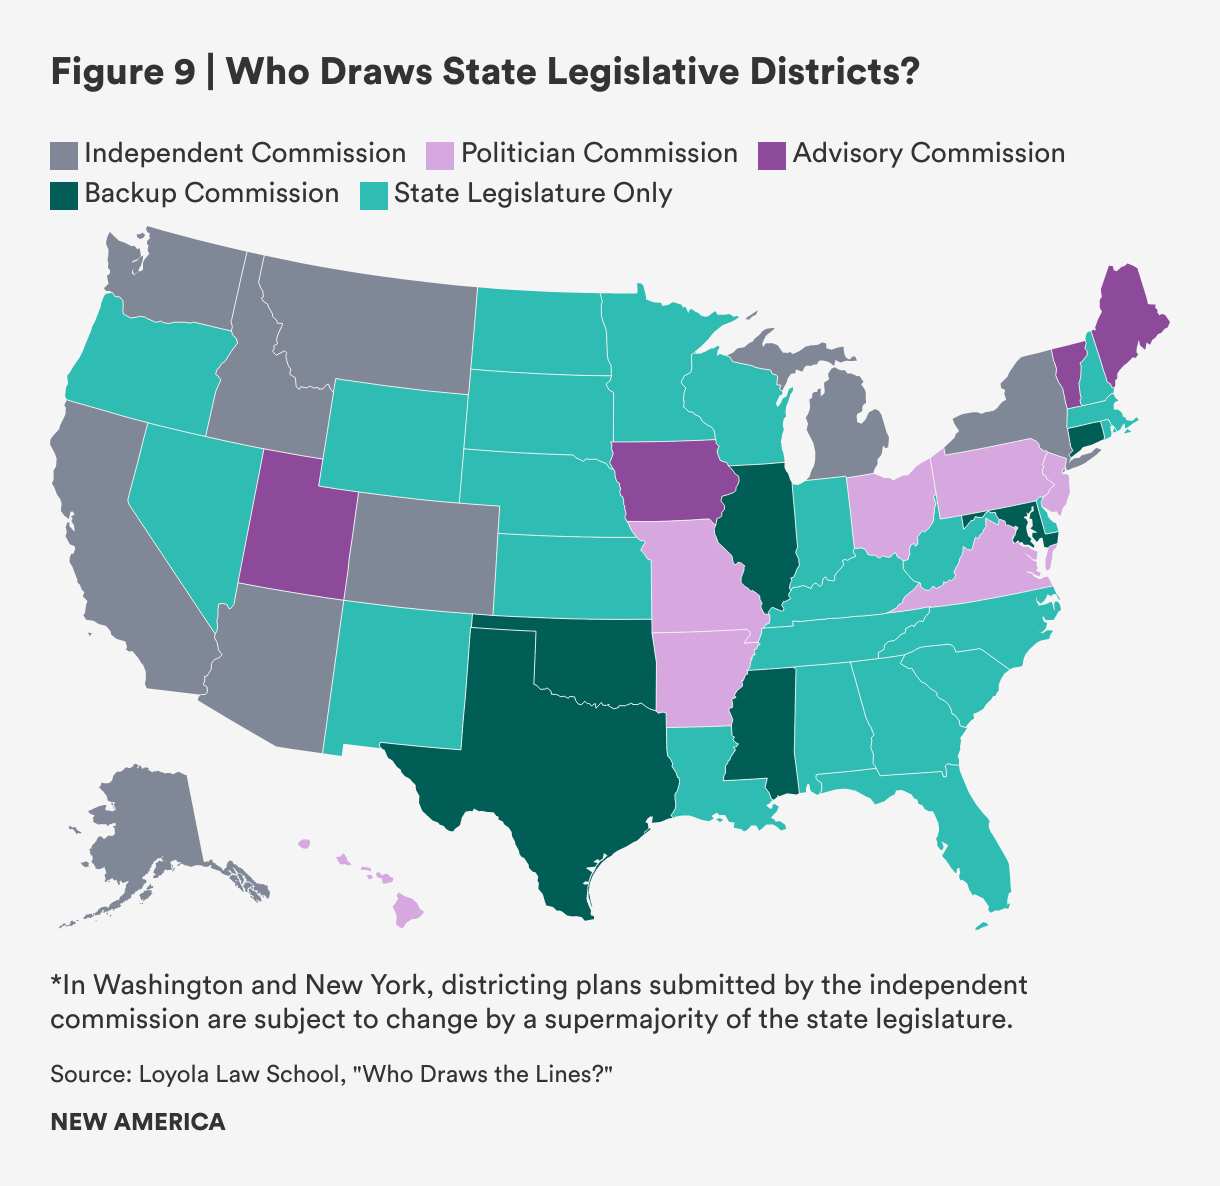
Additionally, since these five standards are often in tension with each other, there is no agreed-upon way in which states should prioritize among them. In states with redistricting commissions, each state’s enacting legislation offers a different framework for evaluating between the five standards, as well as different guidance on how to measure them (see maps below or Tables 10-12 in the appendix for details by state).
Bottom line: Districting involves many trade-offs and fairness is difficult to measure precisely.
Districting should be done in such a way that maximizes fairness. But this is much harder said than done: when you break down the concept of fair districting into its five key components, you find they are all in tension with one another—maximizing any one comes at a cost to others. “In some instances, pursuing one objective clearly undermines another. In others, relationships between principles become operationally inconsistent. In other words, unavoidable conflicts of principle occur both in theory and in practice.”1 More challengingly, there is neither agreement on how to measure the core criteria here, nor agreement on how much is enough, nor how to prioritize. And the more that elections become games of inches, the more consequential these trade-offs become.
Types of Commissions
To further complicate the matter, not only do different states direct their commissions to make different trade-offs and prioritizations. Different states also set up their commissions differently.
Commissions vary in their composition, their authority, and their priorities. Broadly, there are four models of redistricting commission: advisory, backup, politician, and independent. The redistricting control maps below show where these different types of commissions have been adopted and where state legislatures have maintained control over the redistricting process. See appendix for tables with information on each commissions’ composition, decision-making protocols, and specific charges.
Advisory Commissions
Advisory commissions draw maps, but their maps are mere recommendations. In theory, they serve as a baseline. However, being advisory, partisan legislators can choose to ignore the maps. In an earlier era of more consensual politics, advisory commissions had more influence. Today, they are largely ignored.
Backup Commissions
Backup commissions exist as a default if a state legislature is gridlocked and unable to come up with a districting plan. These are typically bipartisan commissions, sometimes made up of elected officials, sometimes appointed by elected officials. The value of a backup commission is that it can provide a kind of ultimatum to a stuck legislature, forcing lawmakers to get something done or lose the power to draw the lines.
Politician Commissions
Politician commissions are autonomous commissions, separate from the legislature, but composed of elected officials (or their designees). Some have partisan neutrality, others require balance among different offices. New Jersey has sometimes been cited as a model, because it requires partisan neutrality. As Bruce Cain has written, “The advantage of the New Jersey bargaining model is that it incentivizes both parties to compete for the tiebreaking member’s vote much in the manner that electoral incentives often lead to a median voter result. In theory, the adopted plan should exhibit more moderation and consensus. In practice, the New Jersey system depends heavily on the perceived impartiality of the tiebreaking member, a feature that can be problematic.”2
Independent Citizens Commissions
The most recent innovation is the independent citizens commission. Under this model, the redistricting process is done entirely independently of elected officials. The state legislature has no say in the process, and the commission itself does not have a single elected official. Hence the citizen name. Arizona’s independent redistricting commission is a five-member commission, with two Democrats, two Republicans and one “Independent.” California takes things a step further, randomly selecting 15 commissioners from a pool of citizen applicants.
Finally, each cycle, several states wind up having state courts ultimately draw their maps because litigants challenge maps as violating state constitutions. No state sets out to have courts draw their maps, of course. But several studies compare court-drawn maps to other approaches nonetheless. In general, courts tend to draw the maps that are overall most fair.
With these differences in mind, let us now turn to the studies. Numerous studies have evaluated the performance of redistricting commissions. Most of the studies focus either on how commissions impact partisan neutrality and competitiveness. Because almost all the studies focus on a single criteria, we will here group the studies by the outcome that they evaluate.
Commissions and Partisan Neutrality
Partisan legislatures engage in partisan gerrymandering. This is perhaps the most widely documented fact of modern congressional districting. No matter which measure of partisan neutrality is used, unified partisan control of state legislatures produces maps biased heavily in favor of the party in power.3
The topline answer is that redistricting commissions modestly improve partisan fairness as compared to partisan legislatures. However, there is considerable variation and complexity beneath this topline finding. So let us turn to the studies.
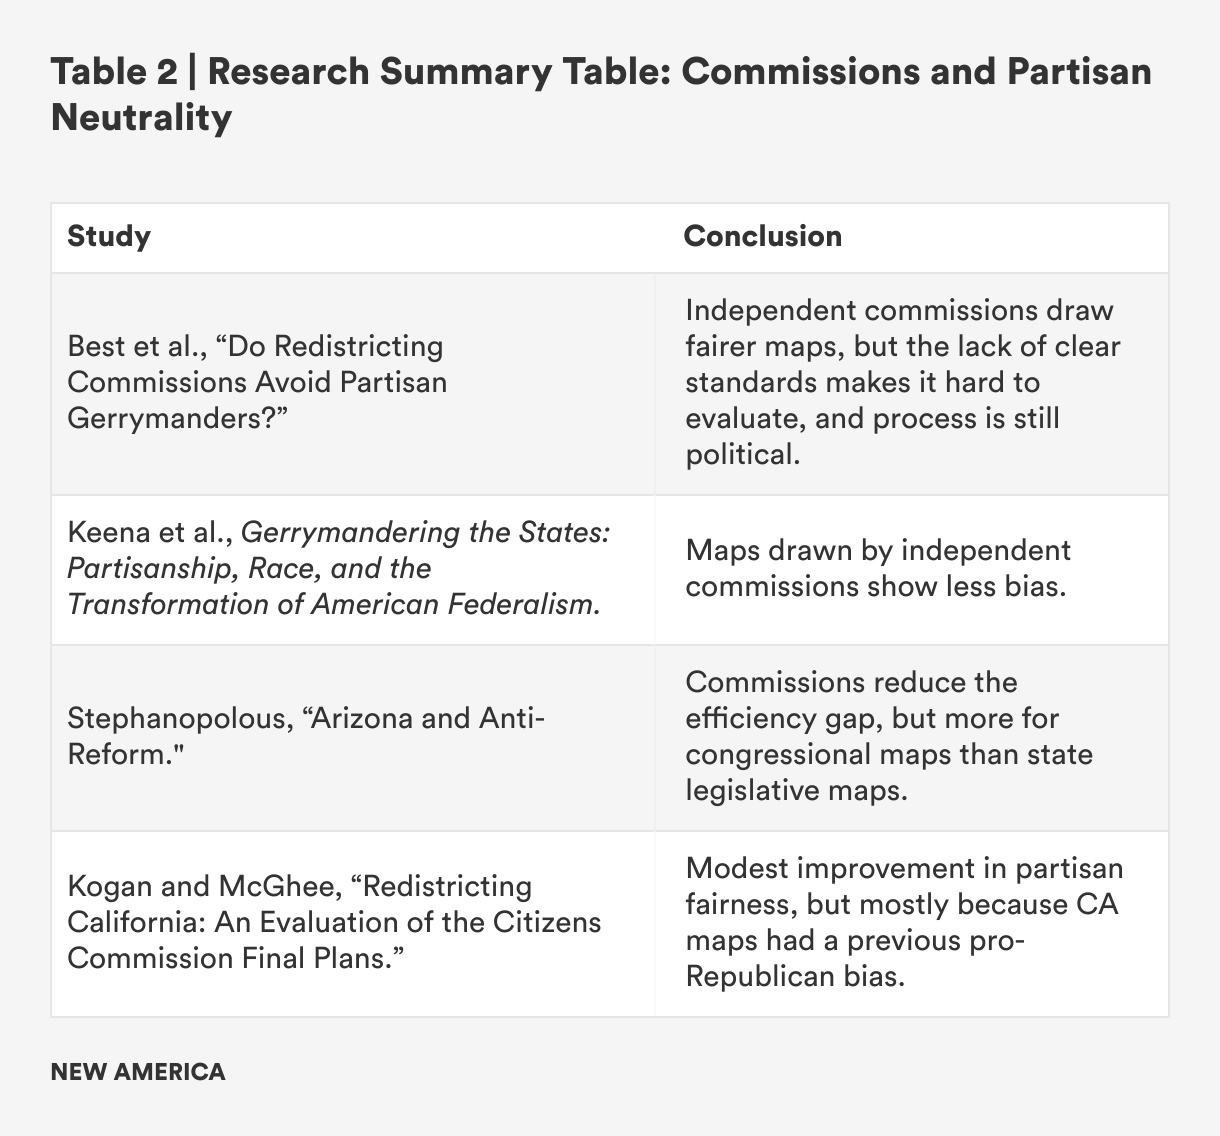
In “Do Redistricting Commissions Avoid Partisan Gerrymanders?,” a comprehensive 2021 study on the effects of redistricting in the 2010s, Robin E. Best, Steve B. Lem, Daniel B. Magleby, and Michael D. McDonald find that: yes, “commissions tend to do a relatively good job at avoiding partisan gerrymandering, where the baseline for relative comparisons is states not using commissions. Still, it is too much to say that commissions do a uniformly good job. Three of seven commission states—Arizona, New Jersey, and Virginia (then an advisory commission)—enacted plans that packed voters in some districts in ways that both reduced the seat-to-vote responsiveness compared to expectations from residential patterns and introduced bias.”
Overall, Best and colleagues draw two big conclusions. First, even when commissions, not politicians, are drawing the district lines, districting is still a political process because partisan outcomes are at stake. As they write: “commissions are decidedly bipartisan, and the maps they create are influenced by politics and their partisan skew. In some instances (e.g., California, Washington), bipartisan collaboration produces plans endorsed by both parties; these maps reduce partisan bias to little more than what one would expect from underlying residential patterns. On the other hand, when bipartisanship fails to materialize (e.g., Arizona, New Jersey), commissions create maps that add partisan bias in favor of the voting majority.”
Second, because there are many different ways to measure partisan fairness and commissions and no agreed-upon standard, commissions struggle—especially when they are not given direct instructions to prioritize partisan fairness above other competing values in districting. As Best et al. write: “a fundamental problem for any and all commissions is their adoption focuses on form and not substance. Commissions are given no charge, or at most a vague charge, to avoid partisan gerrymanders. The missing, meaningful charge likely reflects the same problem the Supreme Court sees for itself, a fatalist resignation that no discernable and manageable standard exists.”
In their 2021 book, Gerrymandering the States: Partisanship, Race, and the Transformation of American Federalism, Alex Keena, Michael Latner, Anthony J. McGann, and Charles Anthony Smith, find that only truly independent commissions reduce partisan bias in districting. As they explain, “we see much promise in comprehensive procedural reforms… extreme partisan bias in districting occurs almost exclusively when one party monopolizes the redistricting process. … [M]aps drawn by nonpolitical actors have on average less bias than maps drawn by political actors. Accordingly, reforms that transfer redistricting authority from a political body (e.g., a legislature or politician commission) to nonpolitical actors, such as citizen commissions or courts, are likely to lead to substantial reductions in partisan bias.”4
Like many other analyses, Keena et al. note how the use of the single-member district limits the options for map-drawers. They explore alternative options, such as proportional, multimember districts, which they see as far more promising for partisan fairness: “given our analysis of the transition to single-member districting, it follows that the adoption of proportional, multimember districting plans would limit partisan bias in the translation of votes into seats.
In a 2015 law review article, “Arizona and Anti-Reform,” Nicholas Stephanopolous also finds a modest gain in partisan fairness from nonpartisan commissions. Stephanopolous analyzes the effect of commissions on the efficiency gap for all elections from 1972 to 2012. He finds that commissions modestly improve the fairness of districting, but the results are somewhat limited. Commissions reduce the efficiency gap by 6 percent, or about half of the 12 percent efficiency gap of the median congressional plan. The effects, however, are smaller for state legislative maps. As Stephanopolous notes, “These results provide strong, though not overwhelming, support for the predictions of process theory… Courts produce a statistically significant drop in the absolute efficiency gap at the state legislative level, while commissions do the same (but more dramatically) using presidential data at the congressional level. The coefficients for court usage and commission usage are negative in every model as well. However, they fail to rise to statistical significance in several cases, thus rendering the overall picture less than perfectly clear.”5
The study that documents most improvement, but specific to California’s independent citizens commission, is a 2012 paper by Vladimir Kogan and Eric McGhee, “Redistricting California: An Evaluation of the Citizens Commission Final Plans,” that examined California’s move to an independent commission. They found a modest improvement in partisan fairness, mostly stemming from the fact that the new maps were more favorable to Democrats than the previous maps, which were biased towards Republicans, across a few different measures.6
As Kogan and McGhee conclude, “The partisan change we predict for the new plans is generally modest, and where it is larger, the new lines are not necessarily responsible. … The implications of these results depend greatly on one’s primary concern. If the question is whether the new maps are better for the Democrats, the answer is clearly yes. But the gains for Democrats are either uncertain, because they depend on competitive seats, or conditional, because they depend on the esoterica of Senate seat numbering. Moreover, there is nothing about the new lines that guarantees a good Democratic performance.”
But as they note, “Perhaps most importantly, the experience of the CRC has shown that a nonpartisan, participatory, and transparent process does not eliminate the zero sum nature of electoral competition. The commission’s maps have both winners and losers and may result in lasting impacts on the balance of political power.”
Conclusion
Compared to partisan state legislatures, redistricting commissions, especially independent redistricting commissions, draw districts that are fairer to both major parties. This is a consistent conclusion across all four studies. But this is hardly surprising, since partisan state legislatures are drawing maps to benefit their party.
The more important question is how much improvement commissions make over partisan legislatures. And here the findings are more limited across all four studies. The impacts of commissions are generally more marginal than transformative, and depend very much on how the commissions are structured. To maximize partisan fairness, a commission should be maximally independent of politics, and have its top goal as maximizing partisan fairness. But again, maximizing partisan fairness can come at the expense of other values, especially competitive elections. California, for example, puts partisan fairness lower on its list of priorities than many other values.
At first glance, it may appear puzzling that nonpartisan commissions do not offer a more transformative solution to concerns about partisan fairness. After all, the harms of partisan gerrymandering are very real, and widely documented.
But the limited observed impacts for redistricting commissions presumably reflects a few factors.
First, there are limits to what commissions can achieve, given the inherent properties of single-member districts, and trade-offs among competing values, and the geographic coalitions of the parties.
Second, because only a handful of states have yet to enact commissions that are truly independent and not subject to political meddling, the limited number of cases makes it harder to quantify the effects of commissions. As the number of states enacting commissions increases, the effects may become clearer. Similarly, since partisan gerrymandering has undoubtedly grown worse over the last several cycles, the potentially positive effects of independent commissions may be growing as well, since they now may have greater distortions to correct.
Third, while it is straightforward to show a distortion, it may be more difficult to establish a baseline. This is the challenge of partisan fairness metrics more broadly. Nobody agrees on what fair partisan districting looks like.
To be sure, in a closely contested politics in which a handful of districts can determine control of the House of Representatives, even a small benefit can be transformative. But this is precisely the problem: when elections are so closely contested, and control of the House depends on a few seats here and a few seats there, even small distortions are consequential. And yet, with no agreed-upon standard on separating the small distortions from the larger distortions, we may simply be asking independent commissions to do too much.
Commissions and Competitiveness
Now we turn to competitiveness. As discussed in the previous section on competitiveness, districts have become less competitive over the last several decades largely due to factors unrelated to gerrymandering. As the parties have sorted geographically, and the share of undecided or swing voters has declined, it has become harder and harder for mapmakers to draw competitive districts while preserving other criteria, even if their explicit goal were to maximize competition.
Nonetheless, partisan state legislatures are often motivated to draw as many safe districts as possible to ensure their members are re-elected, and there is at least some evidence that gerrymandering has reduced the share of competitive districts above and beyond more natural declines stemming from the geographical sorting of the two parties.
Accordingly, there is some modest evidence that redistricting commissions can improve the share of competitive districts above what state legislatures typically produce, though the increases tend to be quite limited.
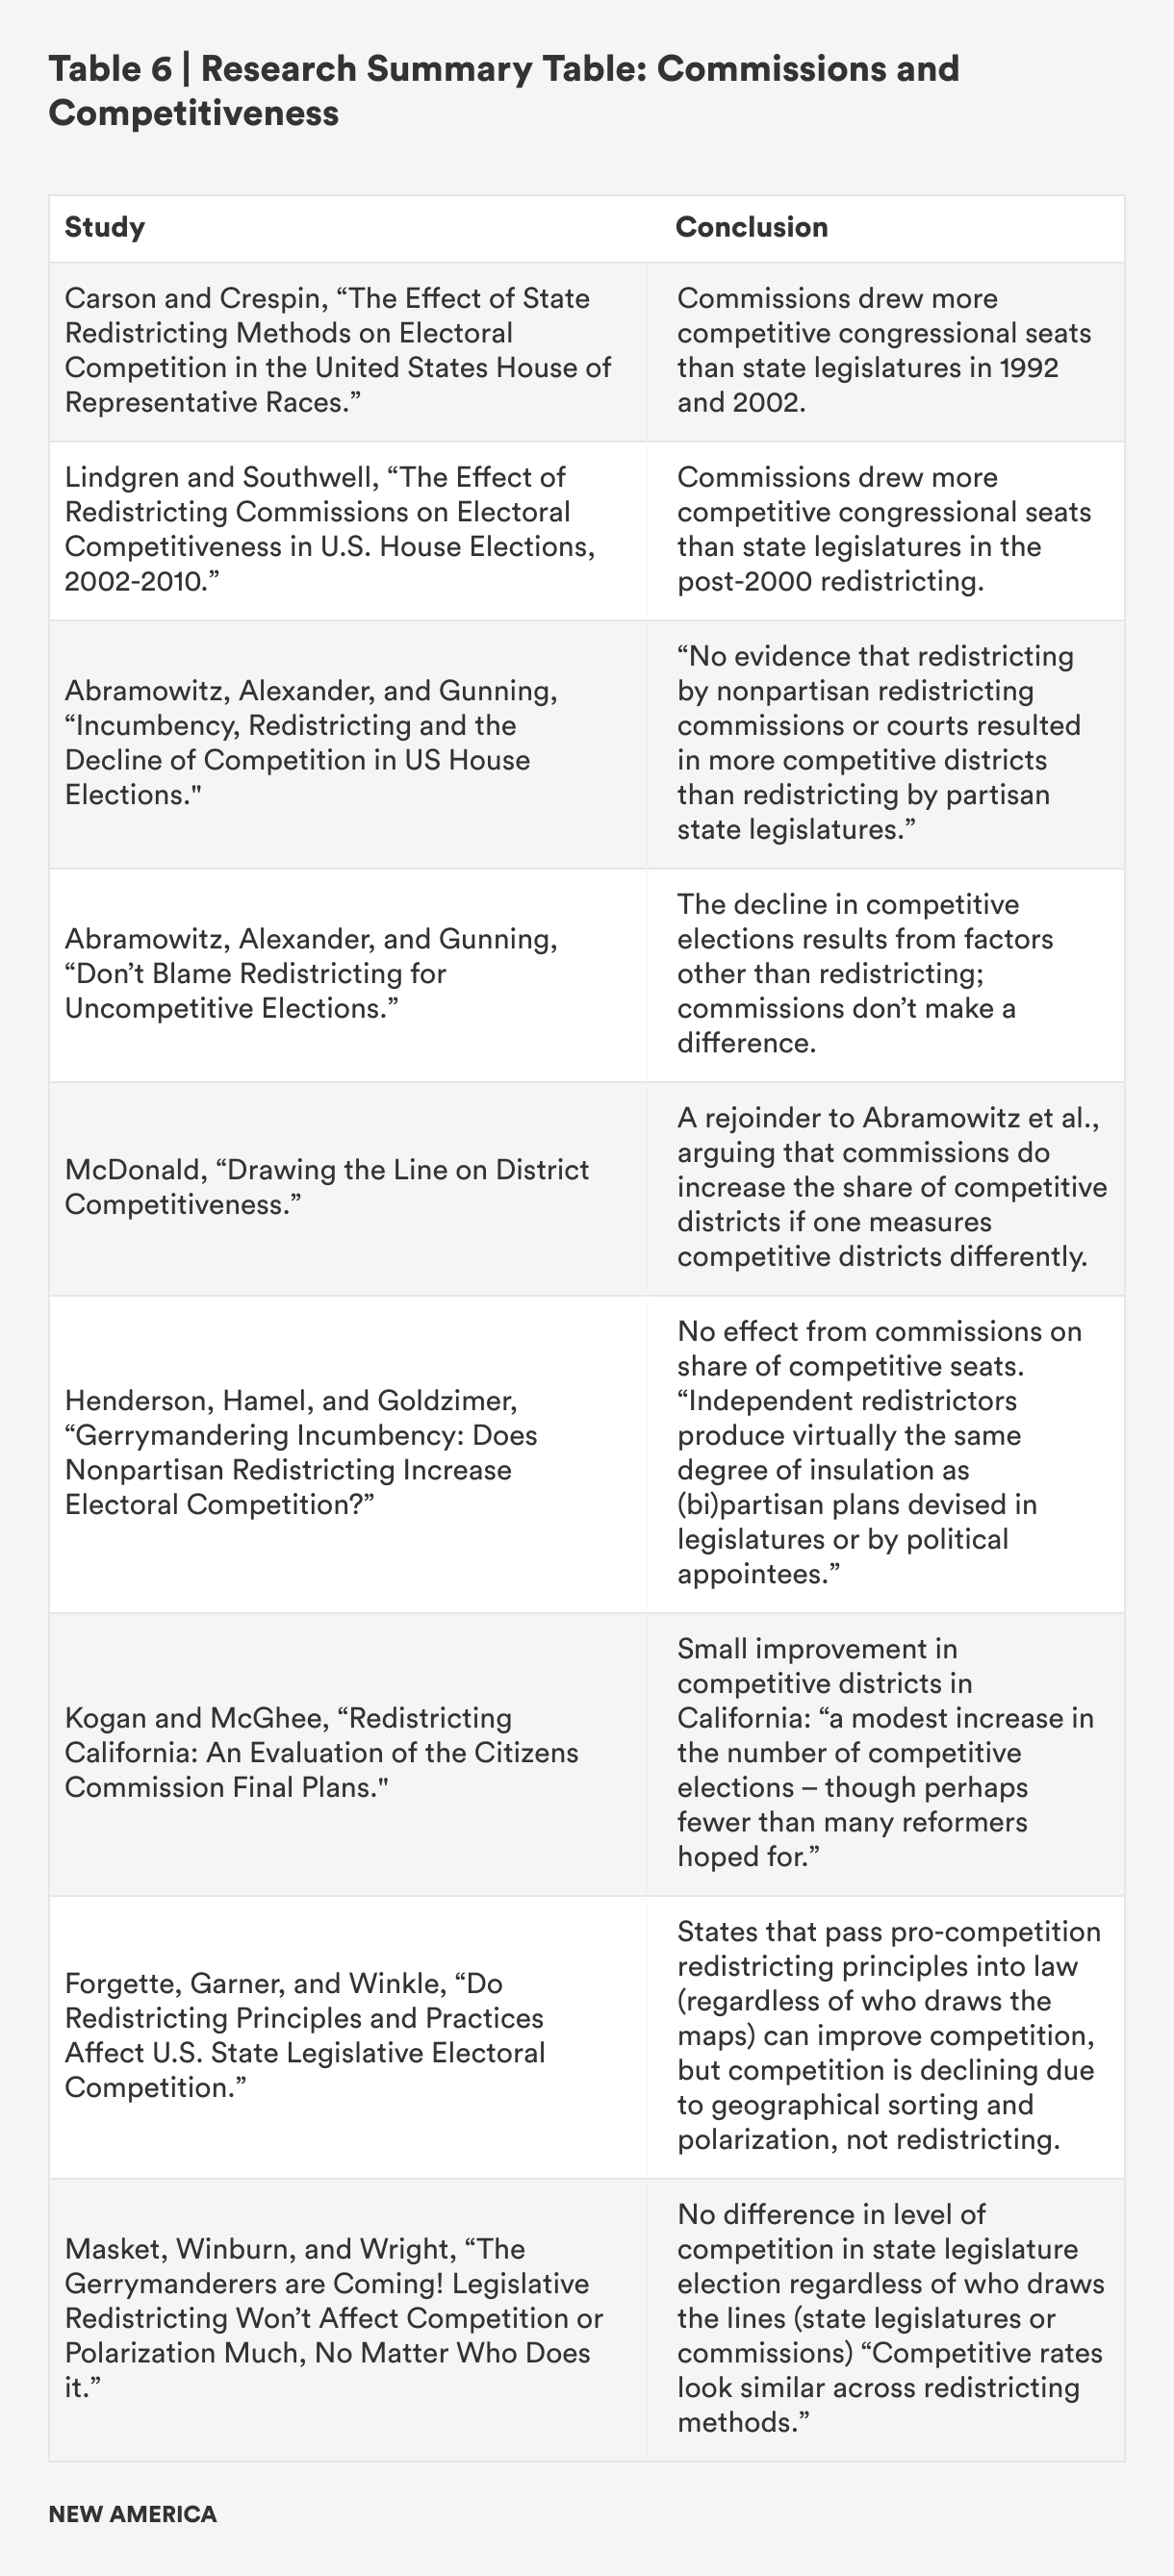
In their 2004 article, “The Effect of State Redistricting Methods on Electoral Competition in United States House of Representatives Races,” Jamie Carson and Michael Crespin find that courts and commissions drew a higher percentage of competitive districts than legislatures. Their findings are described in the table below.
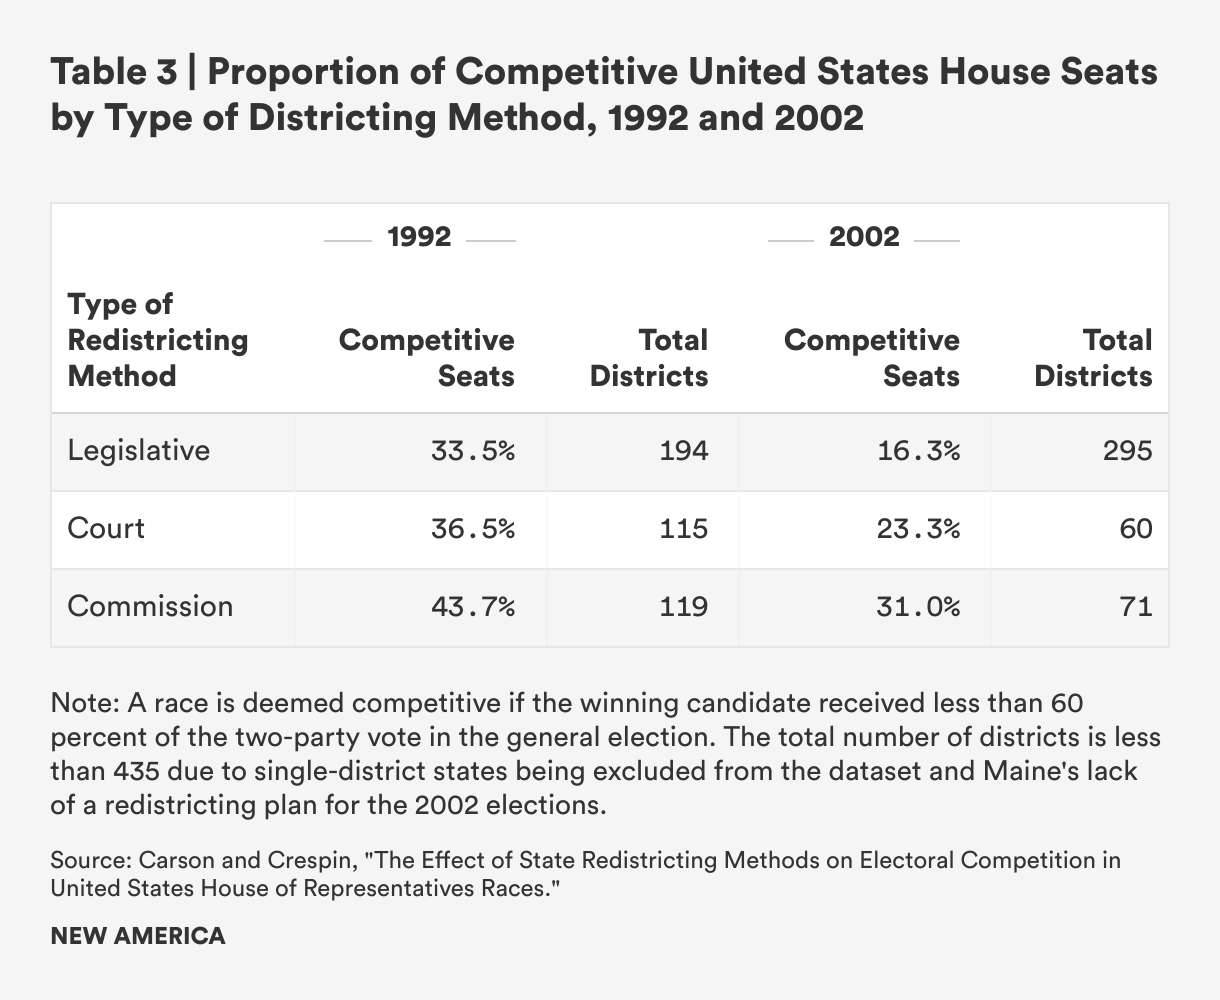
By comparing these different approaches to districting over two cycles, it is clear that there is a secular trend in the decline of competition regardless of the approach to districting. In fact, it is noteworthy that by 2002, only 31 percent of commission-drawn districts were competitive. That is a smaller percentage than the 33.5 percent of legislative-drawn districts that were drawn in 1992!
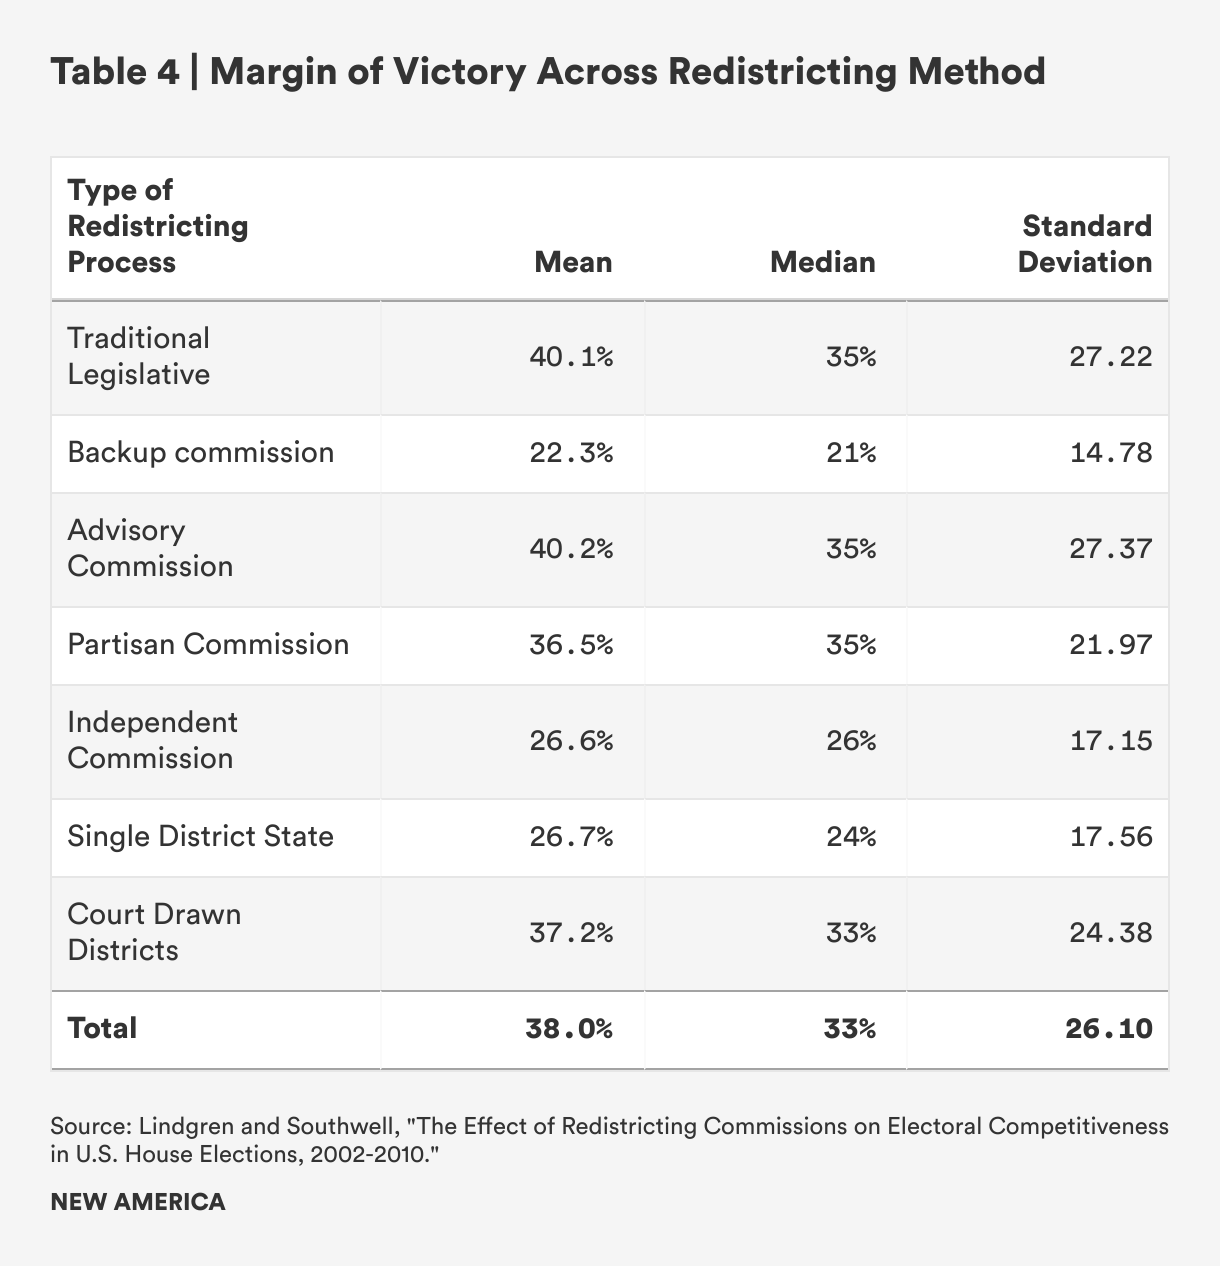
Similarly, Eric Lindgren and Priscilla Southwell looked at the post-2002 redistricting in their 2013 article, “The Effect of Redistricting Commissions on Electoral Competitiveness in U.S. House Elections, 2002–2010” and also found that commissions, especially backup commissions, produced more competitive elections on average. However, they used a different metric of competitiveness than the Carson and Crespin study above, focusing on the margin of victory. They also used more finely grained distinctions among different types of commissions.7
Below is the key summary table describing their findings.
Other studies find no effect on competition. In a 2006 article, Alan Abramowitz, Brad Alexander, and Matthew Gunning found that nonpartisan commissions do not improve competition: “There is no evidence that redistricting by nonpartisan redistricting commissions or courts resulted in more competitive districts than redistricting by partisan state legislature.”8
Their metric is the proportion of safe districts and the proportion of marginal districts. As they write: “in states in which redistricting was done by nonpartisan commissions or courts, the proportion of marginal districts decreased from 25% in 2000 to 24% in 2002 while the proportion of safe districts increased from 44% in 2000 to 51% in 2002; in states in which redistricting was done by partisan state legislatures, the proportion of marginal districts decreased from 29% in 2000 to 28% in 2002 while the proportion of safe districts decreased from 46% in 2000 to 45% in 2002.”
So why do Abramowitz et al. find no effect as compared to the previous two studies discussed above? The core disagreement appears to be over where one draws the lines between competitive and non-competitive districts. By their definitions: “Marginal districts are those in which the two-party division of the presidential vote was within plus or minus 5 percentage points of the two-party division of the national presidential vote; safe districts are those in which the presidential vote was at least 10 percentage points more Democratic or Republican than the national presidential vote.” Abramowitz et al. also do not distinguish among types of commissions, as the other studies do.
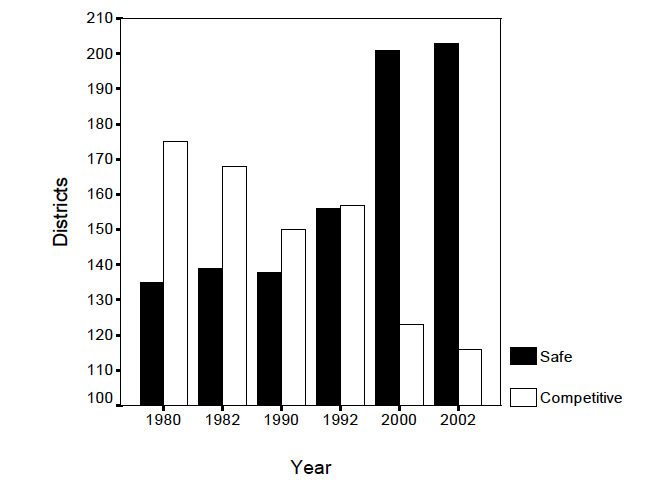
In a related 2006 article, Abramowitz et al. focus more on the broad trend of declining district competitiveness that goes beyond a single redistricting cycle—a constant theme in these studies. See Figure 10 below, reproduced from their article.9
However, Michael McDonald argued in his 2006 article, “Drawing the Line on District Competition,” that Abramowitz et al. used a flawed measure of presidential two-party vote share by relying too much on the 1992 election, in which Perot’s entry may have disrupted the normal partisanship. McDonald recommends using the 1988 vote share instead.10 He argues that under a different metric, redistricting commissions do improve the share of competitive districts.
Abramowitz et al responded to McDonald’s charges in a follow-up article, defending their choice of competitiveness metric.11 However, McDonald does acknowledge that no matter which metric is used, the number of competitive districts is declining for reasons unrelated to gerrymandering, and that these reasons (mostly geographic partisan sorting) account for much more of the decline in competitive districts.
Yet another approach involves using simulated and alternative maps. This is similar to the “Ensemble analysis” in measuring partisan fairness, which eschews any particular standard of competitiveness and instead compares the enacted plans to all possible plans. Using this analysis, John A. Henderson, Brian T. Hamel, and Aaron Goldzimer examine the post-2010 census redistricting cycle in their 2018 article, “Gerrymandering Incumbency: Does Nonpartisan Redistricting Increase Electoral Competition?.”12 They find that independent redistricting commissions do no better than legislatures when it comes to the competitiveness of district maps.13
As they conclude, “Independent redistrictors produce virtually the same degree of insulation as (bi)partisan plans devised in legislatures or by political appointees. Our findings suggest that replacing parties with independent redistrictors is unlikely to increase competition in legislative elections, offering little remedy to contemporary concerns about representation.” However, they do found that when courts intervene, maps are more competitive.
Focusing only on California, Kogan and McGhee examine the share of congressional and state legislative seats in which neither party has more of a 10-point advantage.14 Based on their analysis, “The new maps will produce a modest increase in the number of competitive elections—though perhaps fewer than many reformers hoped for.” The below table is from their analysis:
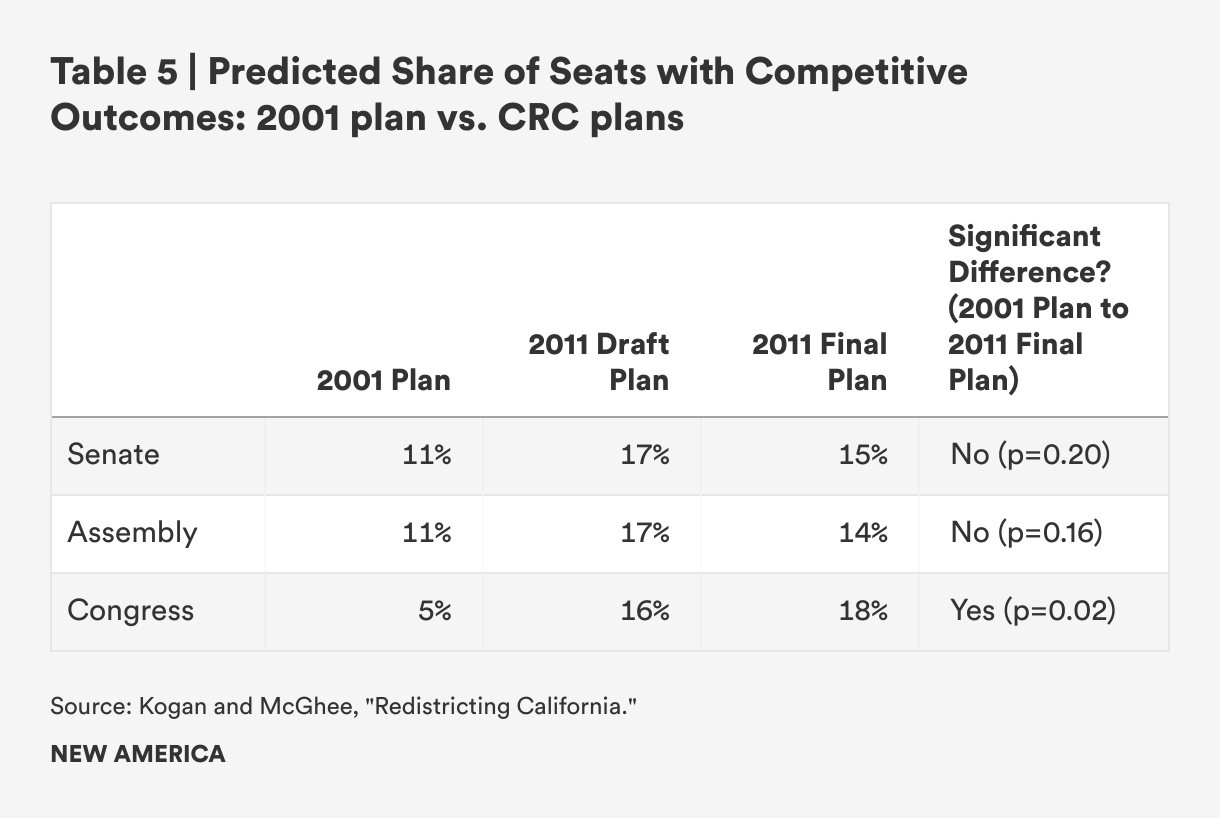
However, Kogan and McGhee note that there are clear limits to how many competitive districts states can draw, without doing damage to other values. As they explain, “Maximizing certain criteria, such as keeping communities intact and protecting the voting rights of historically underrepresented groups, makes achieving other goals, such as increasing competitiveness, more difficult.”
In a 2009 study, Richard Forgette, Andrew Garner, and John Winkle examine redistricting from the 1990s and early 2000s and find that “independent redistricting commissions did not appear to affect state legislative competition.”15
However, Forgette and co-authors do find that where states pass particular redistricting principles into law, these principles can increase the share of competitive districts. As they explain, "We argue that state redistricting principles lessen the range of possible redistricting plans available to elected partisans for drawing new lines. That is, state legislative mapmakers are limited by the political and legal context unique to their state. Proposed maps must achieve acceptance by diverse advocacy groups and survive judicial scrutiny.”
Forgette and colleagues also observe the same trend that many others have observed—that electoral competition is declining broadly, and that even other reforms designed to increase competition, such as term limits, have not stemmed the tide. As they write, "We find that electoral competitiveness in state legislative races declined throughout the 1990s, even after term limit reforms were implemented. The proportion of uncontested state legislative seats has doubled since the 1970s, and there has also been a slight increase in average margin of election district victory.”
Once again, the decline of competition appears mostly driven by the geographical sorting and polarization of the two parties, above and beyond any redistricting shenanigans by state legislatures.
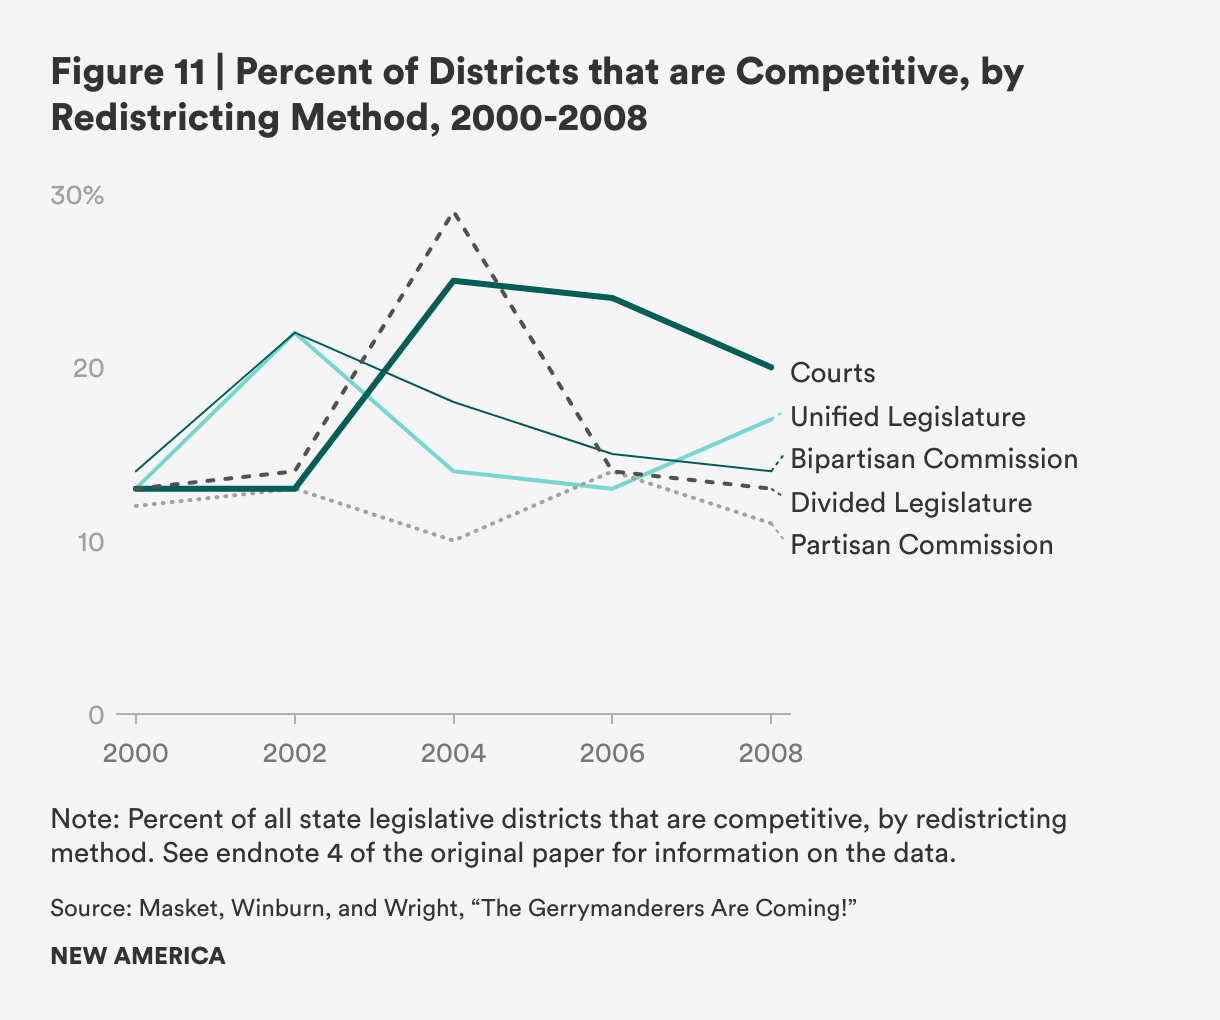
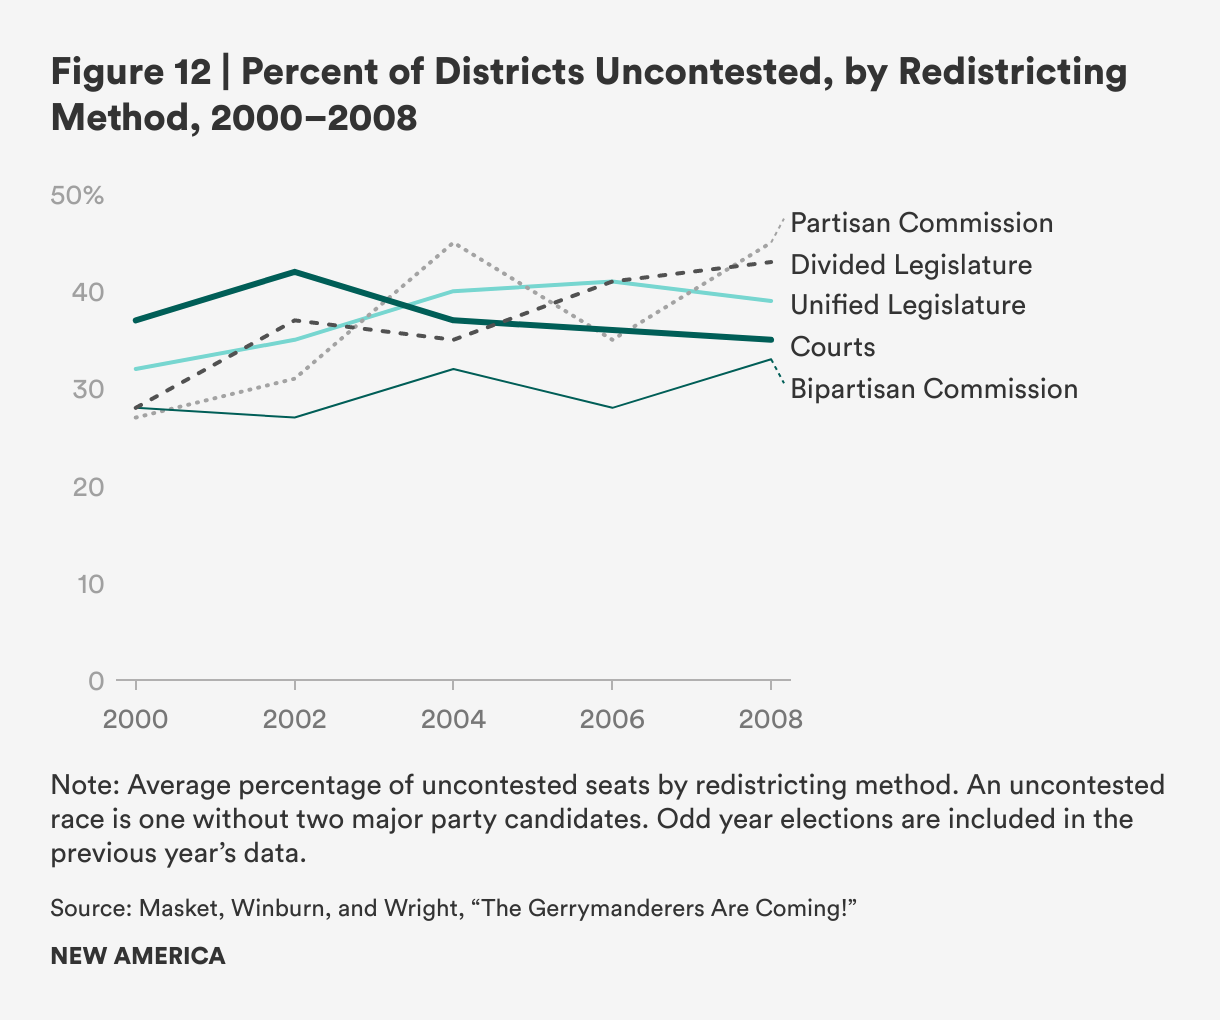
Similarly, a 2012 article by Seth Masket, Jonathan Winburn, and Gerald C. Wright examines competition in state legislatures in the 2000s and finds, as the article title makes clear, that there is no detectable relationship between who draws the maps and the share of competitive seats in state legislative elections. As they write, “Competitive rates look similar across redistricting methods, with no plan producing more than 30% competitive seats during the decade. Before redistricting, the 2000 elections showed almost identical rates of competition across the five redistricting categories.”16
Moreover, they find that, “when legislators under unified partisan control draw the maps, their results often actually increase competition, at least initially. Furthermore, the bipartisan ‘neutral’ commissions that some states have appointed to redraw their districts have seen less-competitive elections immediately following redistricting. However, these trends do not appear to hold with subsequent elections; we do not find evidence of clear long-term trends in levels of competition.”
The figures below describe their main findings.
Again, we see the familiar trade-off between partisan fairness and competition. When partisan legislatures maximize their share of seats, they typically do so by spreading their voters out more efficiently, which makes for more districts that are competitive, especially over the course of a decade during which demographics change and partisan waves come and go.
Interestingly, Masket et al. also find that “states with nonpartisan redistricting methods saw their legislatures become more polarized, while those states with partisan methods saw slight de-polarization, on average.” It is unclear whether or not this relationship is causal, or if so, in which way the causality runs. But if independent redistricting methods ensure partisan fairness at the expense of more competitive seats (as they sometimes do), more safe seats for both parties may lead them to further embrace their extremes.
The Bottom Line on Commissions and Competitiveness
Taking the several studies as a whole, we can conclude that under certain conditions, nonpartisan redistricting commissions can improve the share of competitive districts. But the effects are limited. And as with partisan neutrality, the benefits of redistricting commissions seem clearer for congressional elections than for state legislative elections.
So why do some conclude that commissions draw more competitive districts while others do not? The studies vary in their measurements of competitiveness, their methodological approaches for assessing the impact, and the time frame and states that they choose to study. These debates will likely continue in future studies. Rather than referee these disputes, a more reasonable conclusion is that if redistricting commissions are able to improve the share of competitive districts, the effects are small. Indeed, all of the studies acknowledge the considerable obstacles in drawing competitive districts imposed by the geographic sorting of the two parties, suggesting that there are real limits to what commissions can accomplish in increasing competitiveness, regardless of their political independence.
Commissions and Compactness, Keeping Communities Together
While the effects of commissions on both partisan neutrality and competition have been somewhat well-studied, only one peer-reviewed study evaluating how well commissions perform on the compactness criteria or the keeping communities together criteria has been published. This is a 2017 study, “Institutional Control of Redistricting and the Geography of Representation,” by Barry Edwards, Michael Crespin, Ryan D. Williamson, and Maxwell Palmer.17
Their conclusion is simple and straightforward: “We examine a large sample of congressional and state legislative districts and find that, relative to legislatures, IRCs [Independent Redistricting Commissions] tend to draw more compact districts, split fewer political subdivisions, and may also do a better job of preserving the population cores of prior districts.”
Edwards et al. find that IRC-drawn congressional districts split 0.68 fewer counties and 2.44 fewer cities than those produced by state legislatures. State legislative districts drawn by IRCs and state legislatures are indistinguishable in terms of counties split, but IRC-drawn districts divide 1.22 fewer cities.
However, “The amount of respect shown to political subdivisions varies considerably.” They “do not find significant differences among redistricting institutions with respect to preserving the cores of prior congressional districts. At the state level, however, we find that IRCs do a better job of preserving the cores of prior districts than state legislatures do.”18
Given that there has only been one peer-reviewed study on both of these criteria, additional studies might be valuable. However, given that keeping communities together and drawing more compact districts is relatively uncontroversial and easier than ever to do with modern mapping software, the conclusion is hardly surprising.
Commissions and Fair Minority Representation
As of this writing, the only significant data-rich study assessing the role of commissions on minority-influence districts (districts where racial minorities make up a majority of voters in the districts) is a preliminary one assessing the initial results of the 2021 districting process.19 As shown in the charts below, this study does not detect a meaningful relationship between the type of district process used and the extent to which statewide Black and Hispanic voting age populations correspond to the percent of Black and Hispanic-influence districts.
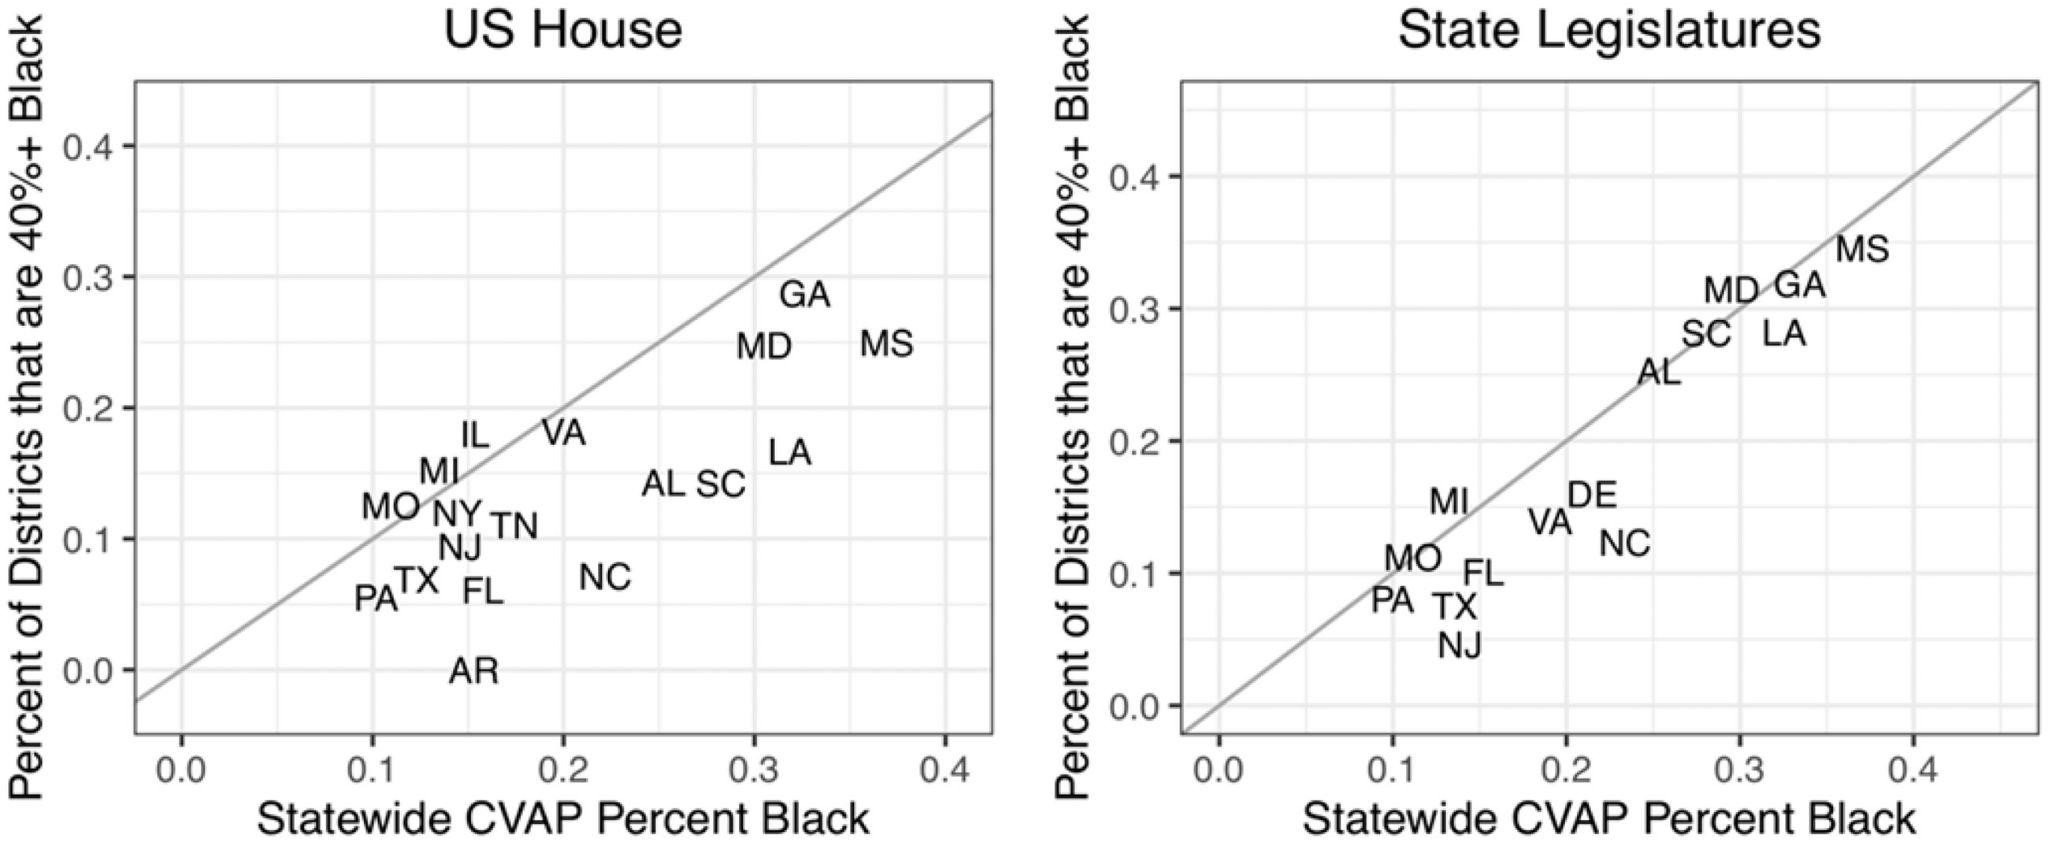
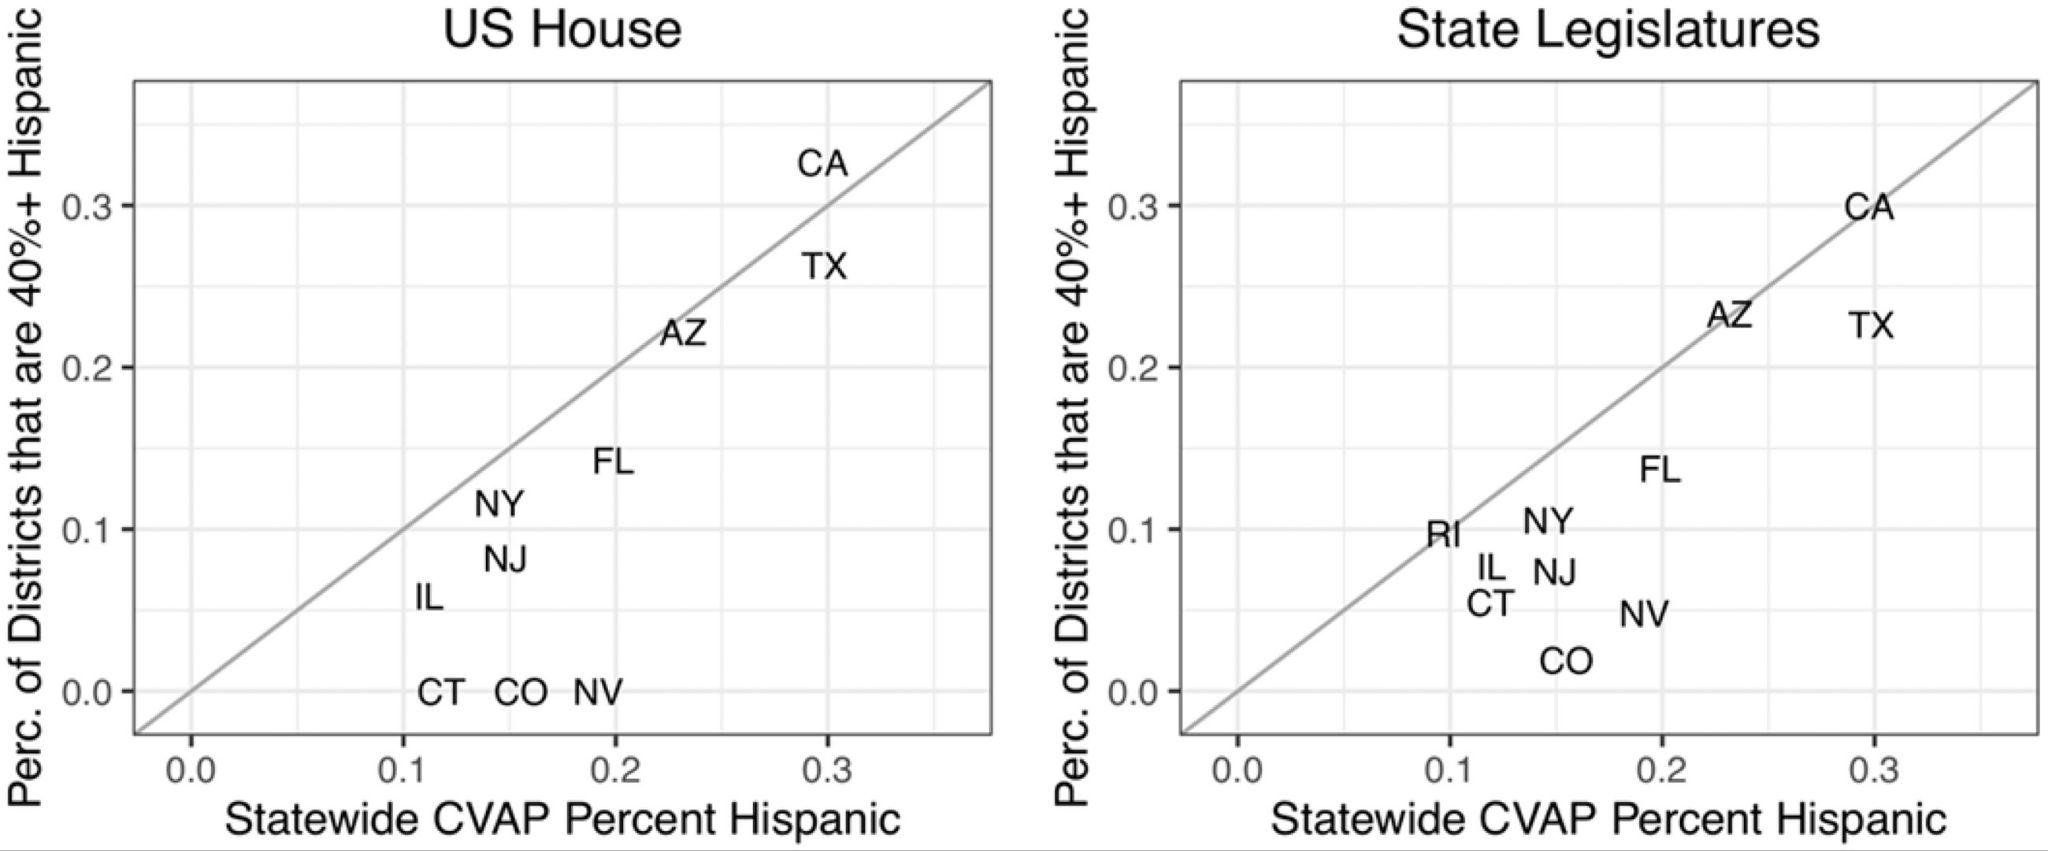
Warshaw, McGhee, and Migurski, “Districts for a New Decade.”
Interestingly, while Arizona and California’s independent redistricting commissions fairly drew minority influence districts for Hispanic voters, Colorado’s independent redistricting commissions did not.
The California Redistricting Commission is required by state law to draw districts for underrepresented racial and ethnic groups. By contrast, competitiveness and partisan fairness are downgraded as priorities. In evaluating the new maps, Eric McGhee and Jennifer Paluch observe improvements for Latino representation, stasis for Black and Asian representation.20
With the final California maps, the number of majority Latino districts in the state increased significantly, adding six districts for Congress, three for state senate, and five for state assembly. As a share of all districts, these numbers nearly match the share of the Latino voting-eligible population (30 percent). By contrast, “influence” districts—where Latinos are a significant minority, which we define as 30 percent or more—decreased by eight for the U.S. Congress, seven for the state senate, and five for the state assembly.
For Asian Americans and African Americans, the final maps show less change. The state assembly map now has two Asian majority districts—up one from the current assembly map—but none in the congressional or state senate maps. In fact, the number of Asian influence districts is unchanged or lower in every case. There are no majority Black districts in any map nor additional assembly or senate influence districts, but the congressional plan now has two new Black influence districts.
Citations
- Richard Forgette, Andrew Garner, and John Winkle, “Do Redistricting Principles and Practices Affect State Legislative Electoral Competition?,” State Politics & Policy Quarterly 9, no. 2 (2009): 151–175. See also David Butler and Bruce E. Cain, Congressional Redistricting: Comparative and Theoretical Perspectives (New York, NY: Macmillan Publishing Company, 1992); Jan E. Leighley, The Oxford Handbook of American Elections and Political Behavior (Oxford, UK: Oxford University Press, 2010).
- On the case for politician commissions see Bruce E. Cain, “Redistricting Commissions: A Better Political Buffer?,” Yale Law Journal 121 (2012): 1817; Sam Hirsch, “Unpacking Page v. Bartels: A Fresh Redistricting Paradigm Emerges in New Jersey,” Election Law Journal 1, no. 1 (2002): 7–23.
- See Nicholas O. Stephanopoulos and Christopher Warshaw, “The Impact of Partisan Gerrymandering on Political Parties,” Legislative Studies Quarterly 45, no. 4 (2020): 609–643.
- Keena et al., Gerrymandering the States, 184.
- Nicholas O Stephanopoulos, “Arizona and Anti-Reform,” University of Chicago Legal Forum (2015): 34, 499.
- Vladimir Kogan and Eric McGhee, “Redistricting California: An Evaluation of the Citizens Commission Final Plans,” California Journal of Politics and Policy 4, no. 1 (February 2012): 1–22. First, they simulate how Democrats and Republicans would perform in a “Good Democratic Year” and a “Good Republican Year.” They also examine how well Democrats and Republicans perform using an expected seats-to-votes curve.
- The authors note that: “ In the post-2000 round of redistricting, 28 states used the traditional legislative process to draw their congressional districts (261 districts); three used an independent backup committee when the legislature failed to draw suitable districts (CT, IA, IN [19 districts]), three used an advisory committee (NY, OH, RI [49 districts]), two used a partisan commission (NJ, HI [15 districts]), three states had independent commissions (AZ, ID, WA [19 districts]), seven states only have one district (AK, DE, MT, ND, SD, VT, WY), and seven states had districts drawn by state or federal courts (ME, MN, NM, OK, OR, SC, TX (Note 1) [65 districts]). As shown in Table 1, a majority of House districts were drawn using the traditional legislative process. Another 15% were court-drawn districts, which Cox and Katz (2002) point out, often ultimately rely on partisan maps). After the 1.6% for single district states, the remaining 23.4% were drawn by some form of commission.”
- Alan I. Abramowitz, Brad Alexander, and Matthew Gunning, “Incumbency, Redistricting, and the Decline of Competition in U.S. House Elections,” Journal of Politics 68, no. 1 (February 2006): 75–88.
- Alan Abramowitz, Brad Alexander, and Matthew Gunning, “Don’t Blame Redistricting for Uncompetitive Elections,” PS: Political Science and Politics 39, no. 1 (2006): 87–90.
- McDonald writes: “One simple method to avoid the confounding influence of Per ot's presence is to analyze other election results within the same districts, such as the 1988 presidential vote within the 1992 districts. If Perot presents no confounding effect, then the measurement of competitive districts in 1992 by either measure should be the same.
- Alan Abramowitz, Brad Alexander, and Matthew Gunning, “Drawing the Line on District Competition: A Rejoinder,” PS: Political Science & Politics 39, no. 01 (January 2006): 95–97, source.
- John A. Henderson, Brian T. Hamel, and Aaron M. Goldzimer, “Gerrymandering Incumbency: Does Nonpartisan Redistricting Increase Electoral Competition?,” Journal of Politics 80, no. 3 (May 2018): 1011–16, source.
- Or more specifically, “we find that politicians produce maps that are safer than 77.1% of the simulated alternatives for their states, in terms of average win margins. Yet this insulation is virtually identical to that uncovered for states with indepen- dent commissions, with 74.9% of simulations (p p :935) being more competitive than adopted plans. An analysis of the publicized alternative maps indicates again that inde- pendent commissions choose maps that are as uncompetitive as those enacted by politicians.” To be sure, however, their analysis is limited to “15 states that meet equal population and contiguity constraints from the full set of data made publicly available by state legislatures or re- districting commissions.”
- Vladimir Kogan and Eric McGhee, “Redistricting California: An Evaluation of the Citizens Commission Final Plans.” They write: “his definition of “marginal” districts is commonly used by scholars of legislative elections, and a 10-point advantage is certainly close enough to keep a representative or legislator concerned about reelection without forcing us to adopt an overly restrictive definition. We use party registration and incumbency to produce our estimates, first by fitting a statistical model that used these two variables to predict the results of previous elections with data from those elections, and then by combining the model coefficients with the relevant data from the new maps to generate predictions under the new lines.”
- Richard Forgette, Andrew Garner, and John Winkle, “Do Redistricting Principles and Practices Affect U.S. State Legislative Electoral Competition?,” State Politics & Policy Quarterly 9, no. 2 (June 2009): 151–75, source.
- Seth Masket, Jonathan Winburn, and Gerald C. Wright, “The Gerrymanderers Are Coming! Legislative Redistricting Won't Affect Competition or Polarization Much, No Matter Who Does It,” PS: Political Science and Politics 45, no. 1 (2012): 39–43.
- Barry Edwards, Michael Crespin, Ryan D. Williamson, and Maxwell Palmer, “Institutional Control of Redistricting and the Geography of Representation,” Journal of Politics 79, no. 2 (2017): 722-726, source.
- Barry Edwards et al., “Institutional Control of Redistricting,” 722–26.
- Christopher Warshaw, Eric McGhee, and Michal Migurski, “Districts for a New Decade.”
- Eric McGhee and Jennifer Paluch, “Racial Representation and Partisan Leanings in California’s Final Redistricting Maps,” Public Policy Institute of California, January 12, 2022, source.