A Closer Look at Title I Stimulus Spending

Yesterday we took a look at total stimulus funding per student as estimated by the House Education and Labor Committee’s stimulus allocation data. Today, we will take a closer look at the estimated 2009 Title I funding distributions per poor student in each state and the District of Columbia (Puerto Rico is not included in Census estimates). Title I stimulus distribution is expected to be the same in 2009 and 2010. To the untrained eye, Title I stimulus funding appears to be allocated randomly, with little connection to student poverty levels.
According to the House stimulus bill, distribution of stimulus Title I funds will be channeled through two Title I funding formulas: 50 percent through Targeted Grants and 50 percent through Education Finance Incentive Grants (EFIGs). Both of these formulas target funds based on the number of poor students in a state or district as measured by the census. We used 2007 census data for our analysis.
Our analysis suggests that Wyoming is expected to receive the most stimulus funding per poor student at $1,493. This is unexpected given that Wyoming ranks fairly low in terms of percent of students living in poverty – 43rd out of 51 at 10.8 percent. As might be expected, Utah appears slated to receive the least Title I stimulus funding per poor student at $428. Utah has 10.2 percent of students in poverty and ranks 47th out of 51 on that indicator. Even though Utah and Wyoming have similar percentages of students living in poverty, their Title I stimulus allocations differ dramatically.
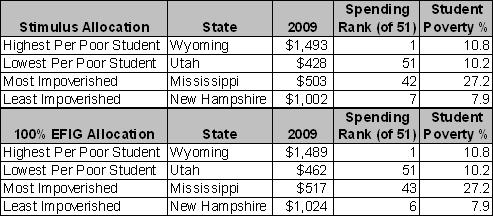
Mississippi has the most students living in poverty (27.2 percent) of the 50 states and the District of Columbia. However, it is only expected to receive $503 dollars in Title I funding per poor student via the stimulus. New Hampshire, the state with the smallest number of students living in poverty, 7.9 percent, is expected to receive $1,002 in Title I funds per poor student.
These findings show that current allocations do not effectively target states with the largest impoverished populations. In fact, of the 10 states expected to receive the most Title I stimulus funding per poor student, only two of them, DC and New York, rank in the top 25 states in terms of student poverty. The District of Columbia ranks third in terms of student population living in poverty at 24.8 percent and New York ranks 14th with 18.3 percent.
Conversely, of the ten states expected to receive the least Title I stimulus funding per student, six of them are in the top 25 states in terms of student poverty – Arizona, Mississippi, Arkansas, Alabama, Oklahoma, and Tennessee.
The lack of continuity between projected Title I stimulus funding per poor student and percent of students living in poverty can in some part be attributed to the complicated formulas used to calculate the Title I distributions. Grant allocations are skewed by small state minimums, hold harmless amounts, and state expenditure factors.
Furthermore, the Targeted Grant formula uses poverty weights to provide more money to districts with larger impoverished populations. The Targeted formula allocates dollars based on either the actual number of poor students or the proportion of poor students, depending on which results in a higher weighting. As a result, it favors states with many small districts that educate a large proportion of poor students or states with large districts but relatively small proportions of poor students.
For example, a district with 200 students, 25 percent of which live in poverty, would receive less money per poor student than a district with 2,000 students and the same percentage in poverty. The actual number of poor students in the larger district outweighs the number in the first. Similarly, a district with 200 students and 150 of them living in poverty would receive more money per poor student than a district with 2,000 and the same number living in poverty. The percentage of poor students in the first district outweighs that in the second, earning a higher weight in the formula.
The Education Finance Incentive Grants formula allocates funds based on the number of students in poverty as well as factors that measure a state’s education funding equity and effort. These factors attempt to reward states that have high levels of inter-district spending equity and high per pupil spending (i.e. effort) relative to total state spending. As a result, states that already put significant resources in education and ensure a degree of funding equity among districts receive more dollars per poor student. However, research suggests that equity and effort play a small role in the EFIG formula, resulting in a distribution that reflects a straight forward per poor pupil allocation.
To further examine the correlation between student poverty and the EFIG formula, we used a CRS estimate of state-level Title I stimulus funding where 100 percent of funds would be distributed by the EFIG formula. The results were not markedly different than that in the stimulus allocation. Wyoming would receive the most funding per student and Utah would receive the least. Mississippi would come in 43rd in terms of per poor student funding and New Hampshire would come in sixth under the 100% EFIG allocation.
Only a few states would receive significantly different allocations using the 100% EFIG formula. Although Louisiana ranked 29th in per poor student funding in the stimulus allocation with $593, it would rank 41st with $531 per poor student using 100% EFIG. Nevada would move from 33rd ($564 per poor student) to 46th ($505 per poor student) in per poor student funding.
These outcomes for the Title I stimulus allocations are unexpected. Funds should flow to states and districts with the neediest populations. Instead, allocations are the result of complicated Title I funding formulas that don’t appear to do a great job of providing the maximum benefit to states with large impoverished populations. Admittedly, $13 billion in Title I funds is a small part of the total pot of stimulus funding (as much as $140 billion) aimed for education, but its sole purpose is to improve educational opportunities and outcomes for poor students. We hope that the final stimulus bill enables those funds to do just that.
A spreadsheet containing this data for all 50 states and the District of Columbia can be downloaded here.
More About the Authors
Issues
Related

Community College Presidents and Trustees Invited to Complete National Survey on Economic Development

Public Comments on DOL’s Independent Contractor Rule

Unraveling the Case for Credentials in High School