
Lee Drutman
Senior Fellow, Political Reform Program

A core problem in American politics is ideological polarization, which makes compromise impossible, not only in Congress but also in the states. Polarization has many causes, most of which can’t be altered. But over the last few years, a growing crowd of scholars has explored the intriguing possibility that stronger parties could reduce polarization.
The logic of this argument goes something like this: since political parties above all else want to win elections, they should support moderate candidates, who are more likely to win in general elections (as compared to extreme candidates). The more actively parties can control who runs for office, the more moderate candidates they will run, thus reducing polarization.
One way to strengthen parties would be to allow them to raise and control more of the money in the process, thus wresting control over the nomination process away from both individual candidates and the outside groups that may be concerned more about ideology than winning. Leading thinkers like Jonathan Rauch and Rick Pildes, as well as others skeptical of traditional reform approaches, have offered more detailed elaborations of this general point.
But it’s not just a theoretical question. It’s also an empirical question. Because different states have different rules on how much money parties can raise, we can empirically test the proposition that allowing parties to raise more money reduces polarization.
So far, we have one influential test of this proposition. Political scientists Ray LaRaja and Brian Schaffner have compared legislators in states with limits on contributions to parties against those in states without limits. They conclude that legislators in states that limited what parties can raise were more ideologically extreme. Therefore, they argue, removing limits on contributions to parties would lead to more moderate parties. Their finding has since become a key part of the argument for strengthening parties by allowing them to raise more money.
This is too quick a conclusion to draw on the basis of a single analysis. Looked at another way, the same data suggests the very opposite result: that states that limit contributions to parties are actually less polarized than states without limits. Before building a reform program around strengthening parties by opening up some of the few remaining limits on money, we ought to be careful and modest about what we think we know.
Let’s start with LaRaja and Schaffner’s original graph from their July 2014 Monkey Cage post and forthcoming book, which is reproduced below as Figure 1. They write that the graph represents, “the ideological distribution of officeholders in the Democratic and Republican parties in the 20 most professional legislatures.” This distribution places thousands of individual legislatures on a left-right ideological spectrum, drawing on ideology data produced by Boris Shor and Nolan McCarty. Their key conclusion is that if you combine all individual legislator-year observations across 20 different state legislatures into two partisan distributions, you will find that the median Democrat and the median Republican are closer to each other (read: less polarized) in the professionalized legislatures with no limits on contributions to parties, as compared to the professionalized legislatures that do limit contributions. In other words, it would appear that states with party contribution limits are considerably more polarized than states with no limits.
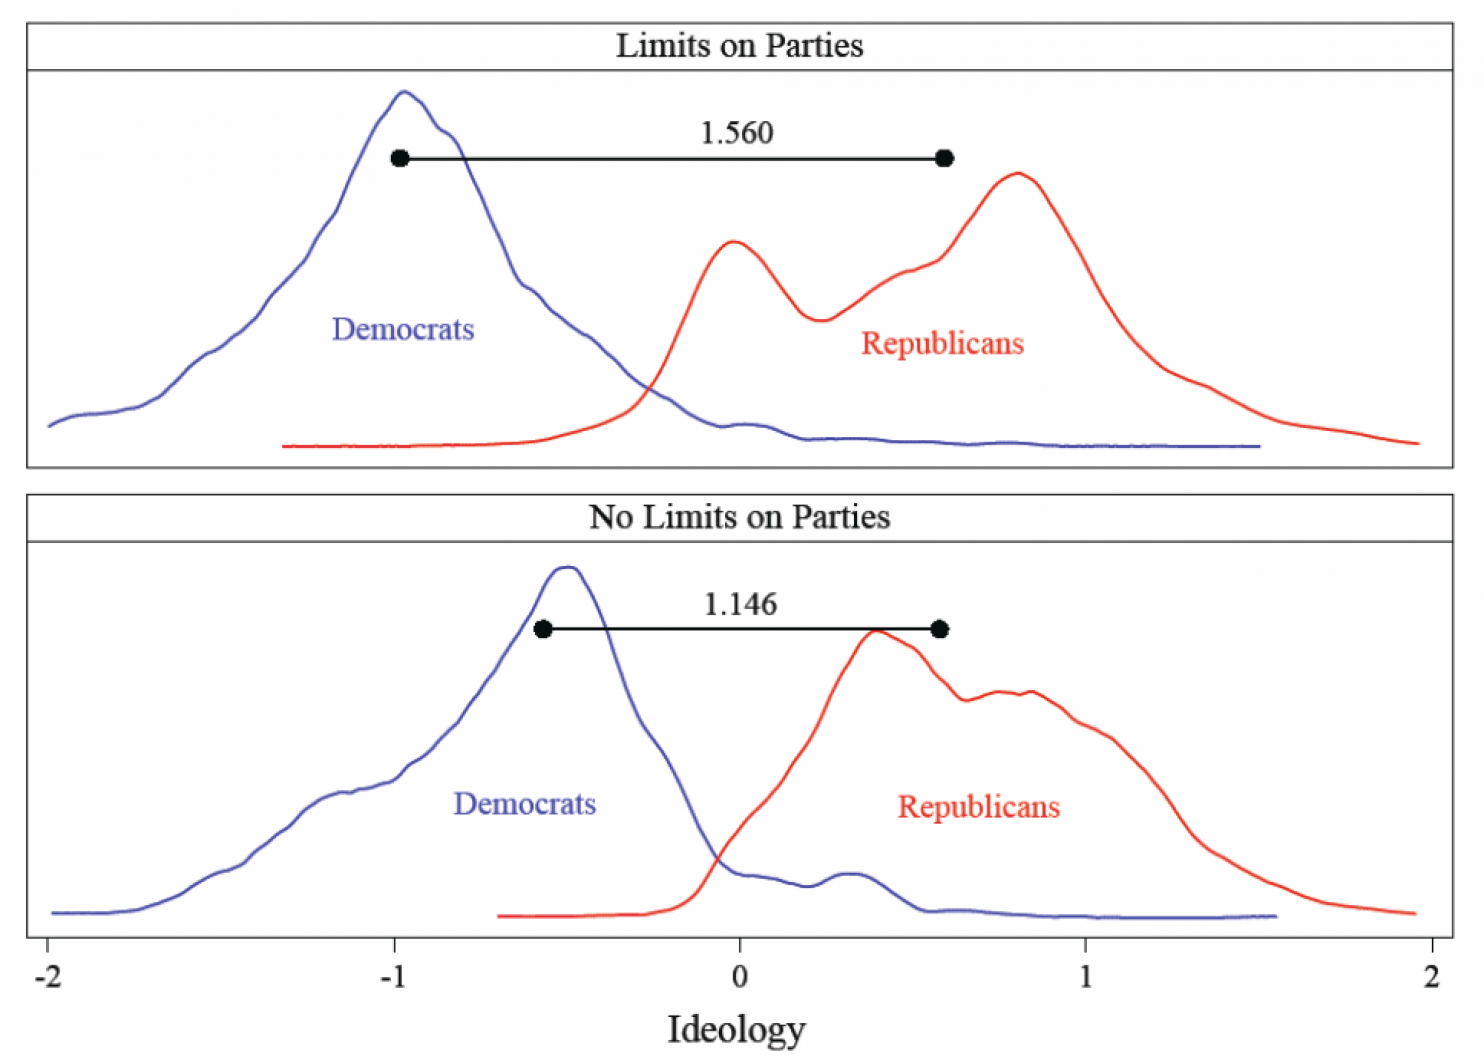
Figure 1. Original LaRaja/Schaffner distributions
But let’s look more closely at this finding by peeling back the methodological choices that go into analyzing the data this way.
The first choice is the decision to include only 20 “professionalized” legislatures in the sample. While I do think this is a reasonable decision (they argue that “These are the legislatures where campaign money matters more and that probably have greater relevance for Congress”), it’s worth asking how the results change if you include more or all states. Put another way: how sensitive are these conclusions to the particular selection of states?
The second and far more consequential choice is the decision to combine all individual legislators across different states and years into a single distribution. Doing this treats an Alaska Democrat as the equivalent of a California Democrat; it treats a New York Republican as the equivalent of a Texas Republican. Even more significantly, it weights states by the size of their legislature. So, for example, Pennsylvania (253 legislators) gets weighted twice as heavily as New Jersey (120 legislators), rather than treating them equally.
A simpler and more straightforward approach would be to measure the differences between the ideological position of the median Democrat and the median Republican in each chamber, and then compare them across states. This is the measure that Shor and McCarty describe in their codebook as their “preferred measure of polarization.”
Figure 2 below does just this. Following LaRaja and Schaffner, I’ll stick with with the “professionalized legislatures” (Their list is: AK, AZ, CA, CT, DE, FL, HI, IL, MA, MI, MN, NC, NJ, NY, OH, PA, SC, TX, WA, and WI; This is based on the “Squire Index”. The list of states with and without limits on contributions to parties comes from the National Conference of State Legislatures. I use the average difference over a 10-year period (2004-2013).)
The simple conclusion is the states with limits on contributions to parties are less polarized that states without limits. In the lower chambers, the median difference in party medians of 1.31 for states with limits, as compared to a difference 1.68 for the states with no limits. In the upper chambers, states with limits have a median a difference in party medians of 1.50, as compared to 1.59 for states with no limits.
Looked at another way, six of the seven least polarized lower chambers have limits, and four of the five least polarized upper chambers have limits.
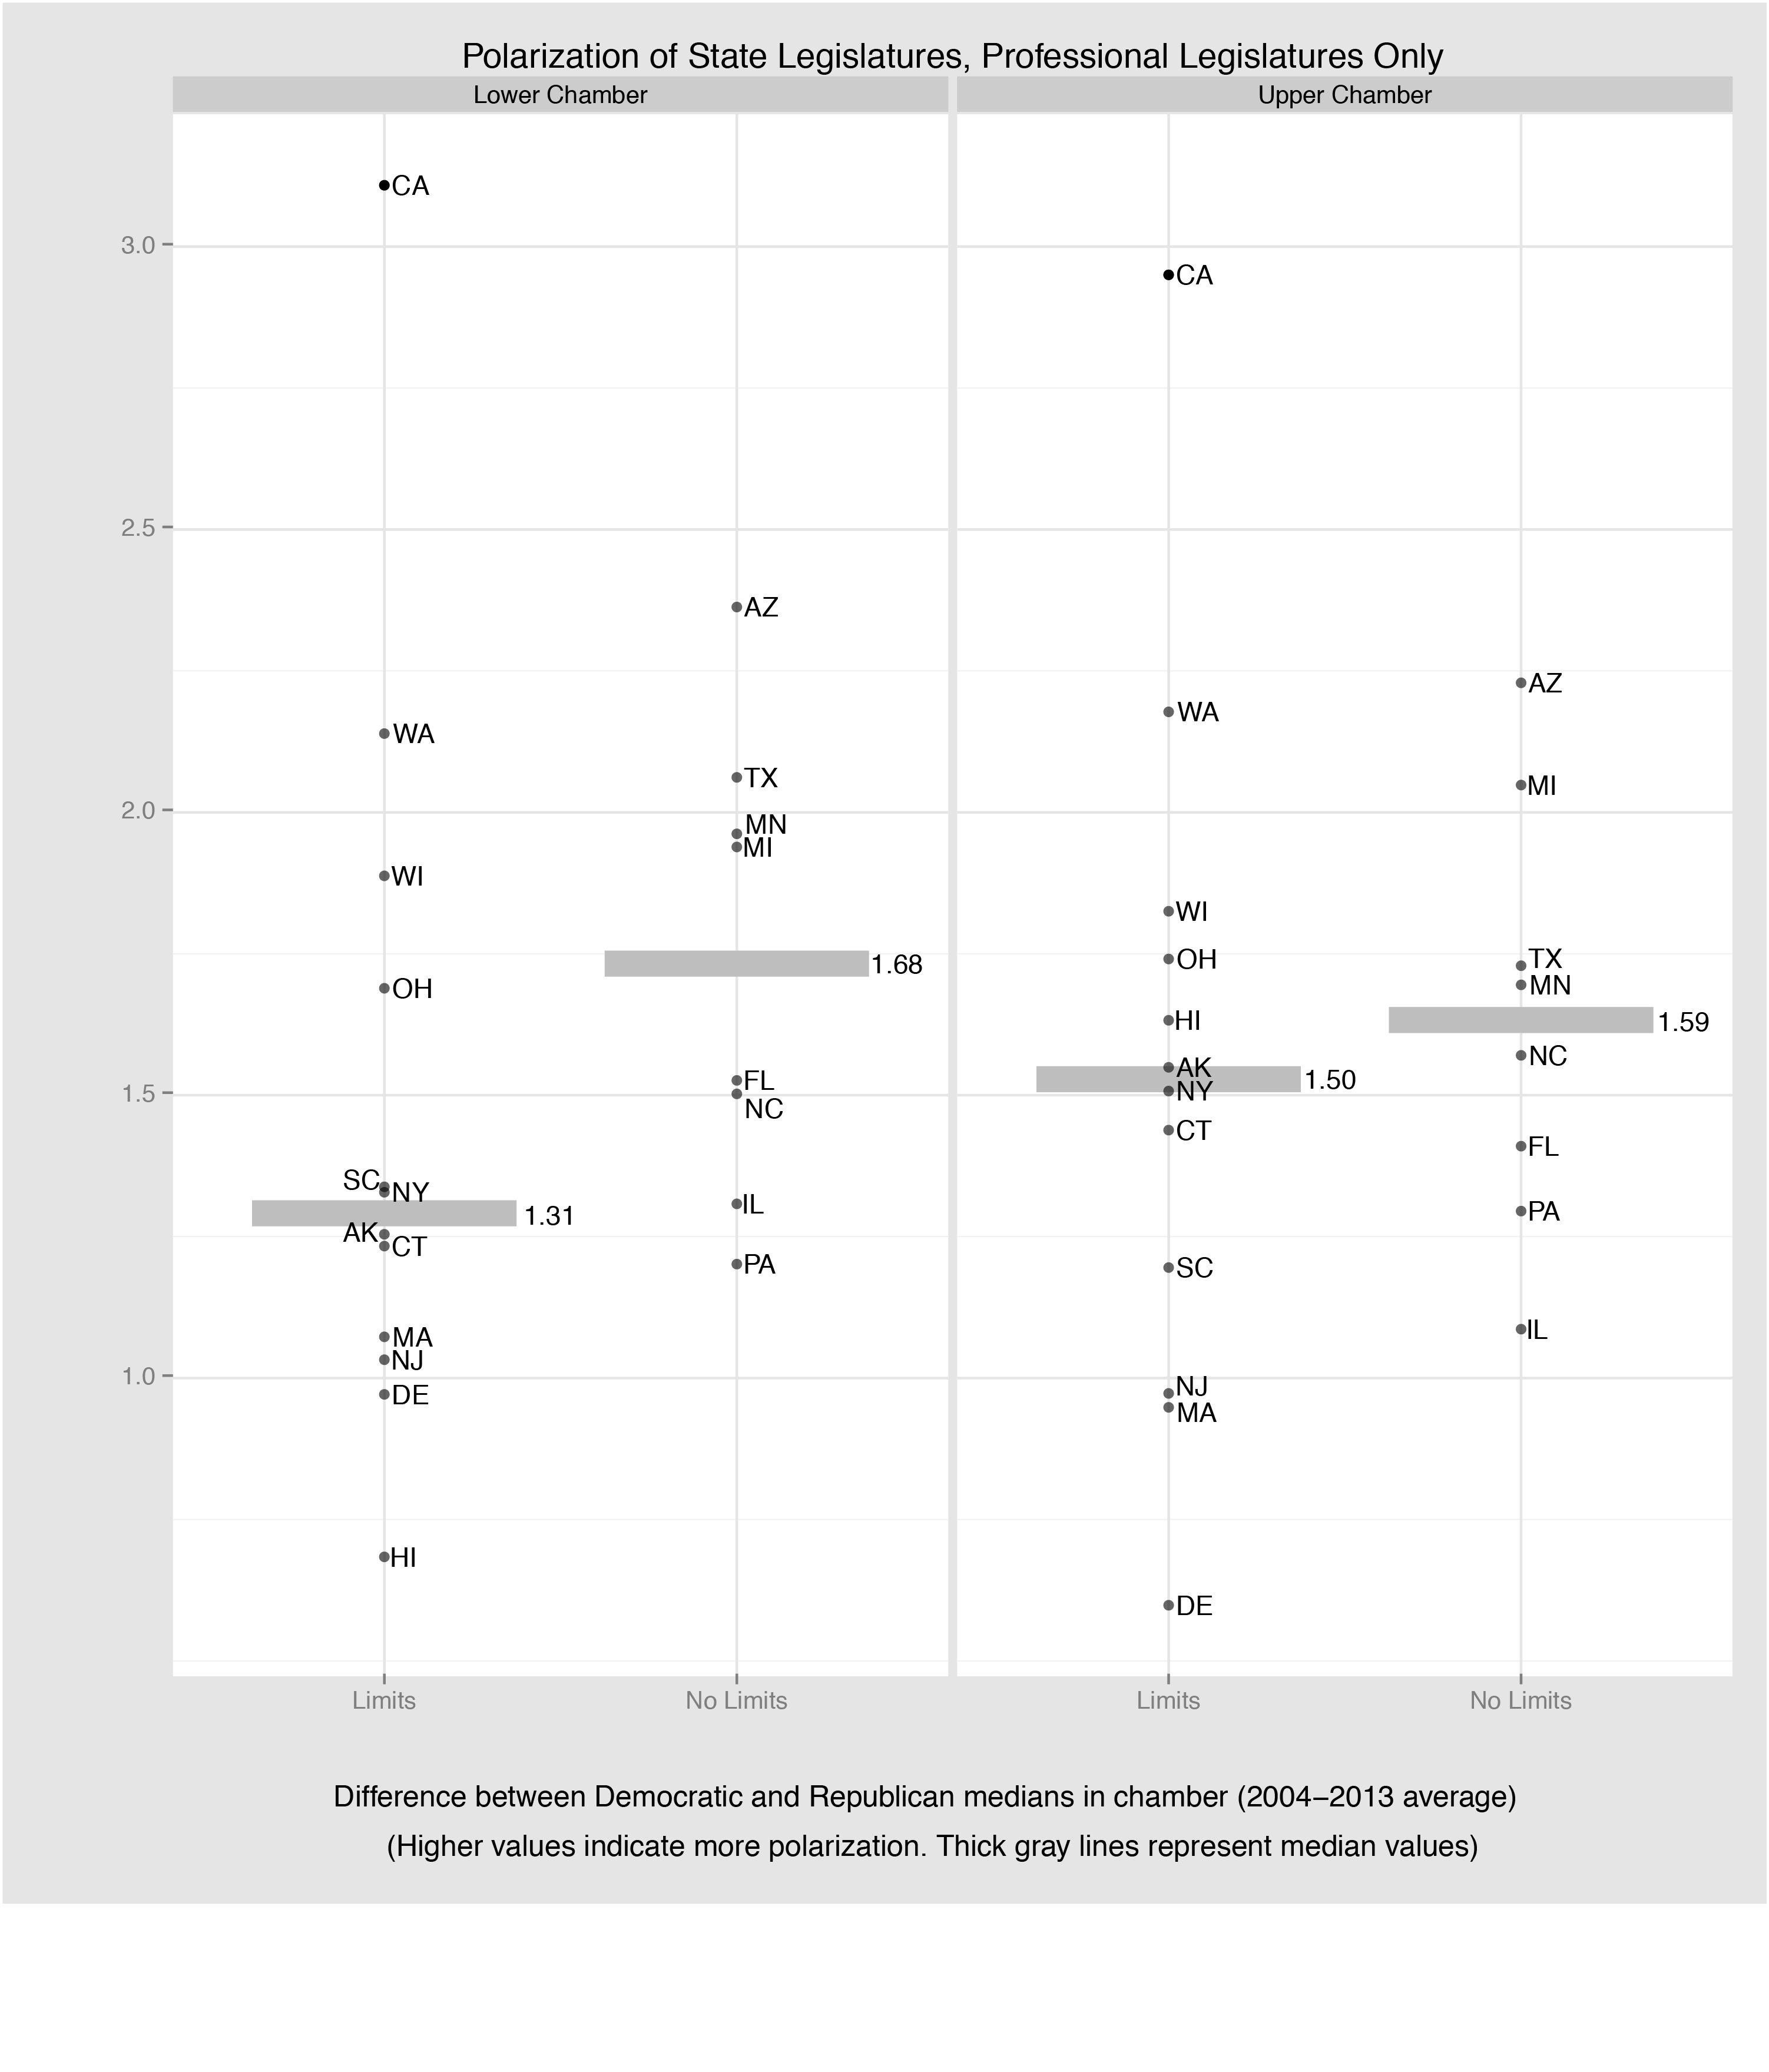
Figure 2. Differences in party medians, by chamber, professionalized states only.
If we expand from 20 states to all states, the basic conclusion stays the same. States without limits are slightly more polarized than states with limits. The median of the differences in party medians in lower chambers decreases from 0.37 to 0.16; the median of the differences in party medians in the upper chambers increases from 0.09 to 0.21.
| States with limits | States with no limits | Difference | |
| Lower Chamber | 1.31 | 1.68 | 0.37 |
| Upper Chamber | 1.50 | 1.59 | 0.09 |
| States with limits | States with no limits | Difference | |
| Lower Chamber | 1.31 | 1.51 | 0.16 |
| Upper Chamber | 1.38 | 1.59 | 0.21 |
Table 1. Median difference between party medians (polarization) in ALL legislatures
Looking more closely at the distribution of states up and down the y-axis, the first thing that should be clear is that there is considerable variation in polarization across states. So, while we do observe differences in the party medians, it’s hard to put too much emphasis on party limits as the key explanatory factor.
Second, several of the states with limits have exemptions. Among professionalized legislatures that have limits, California, New York, Ohio, and South Carolina allow unlimited contributions for party building or administrative activities. Washington, meanwhile, allows unlimited contributions in the 21 days before elections. Among states with limits, three states with exemptions (California, Ohio, and Washington) are three of the four most polarized.
If we re-classified these five states with exemptions into the no limits category, the differences would be more significant, as shown in Figure 3. Among the professionalized lower chambers, 10 of the 11 most polarized legislatures either have no limits or major loopholes. Among upper chambers, seven of the eight most polarized upper chambers have no limits or major exceptions.
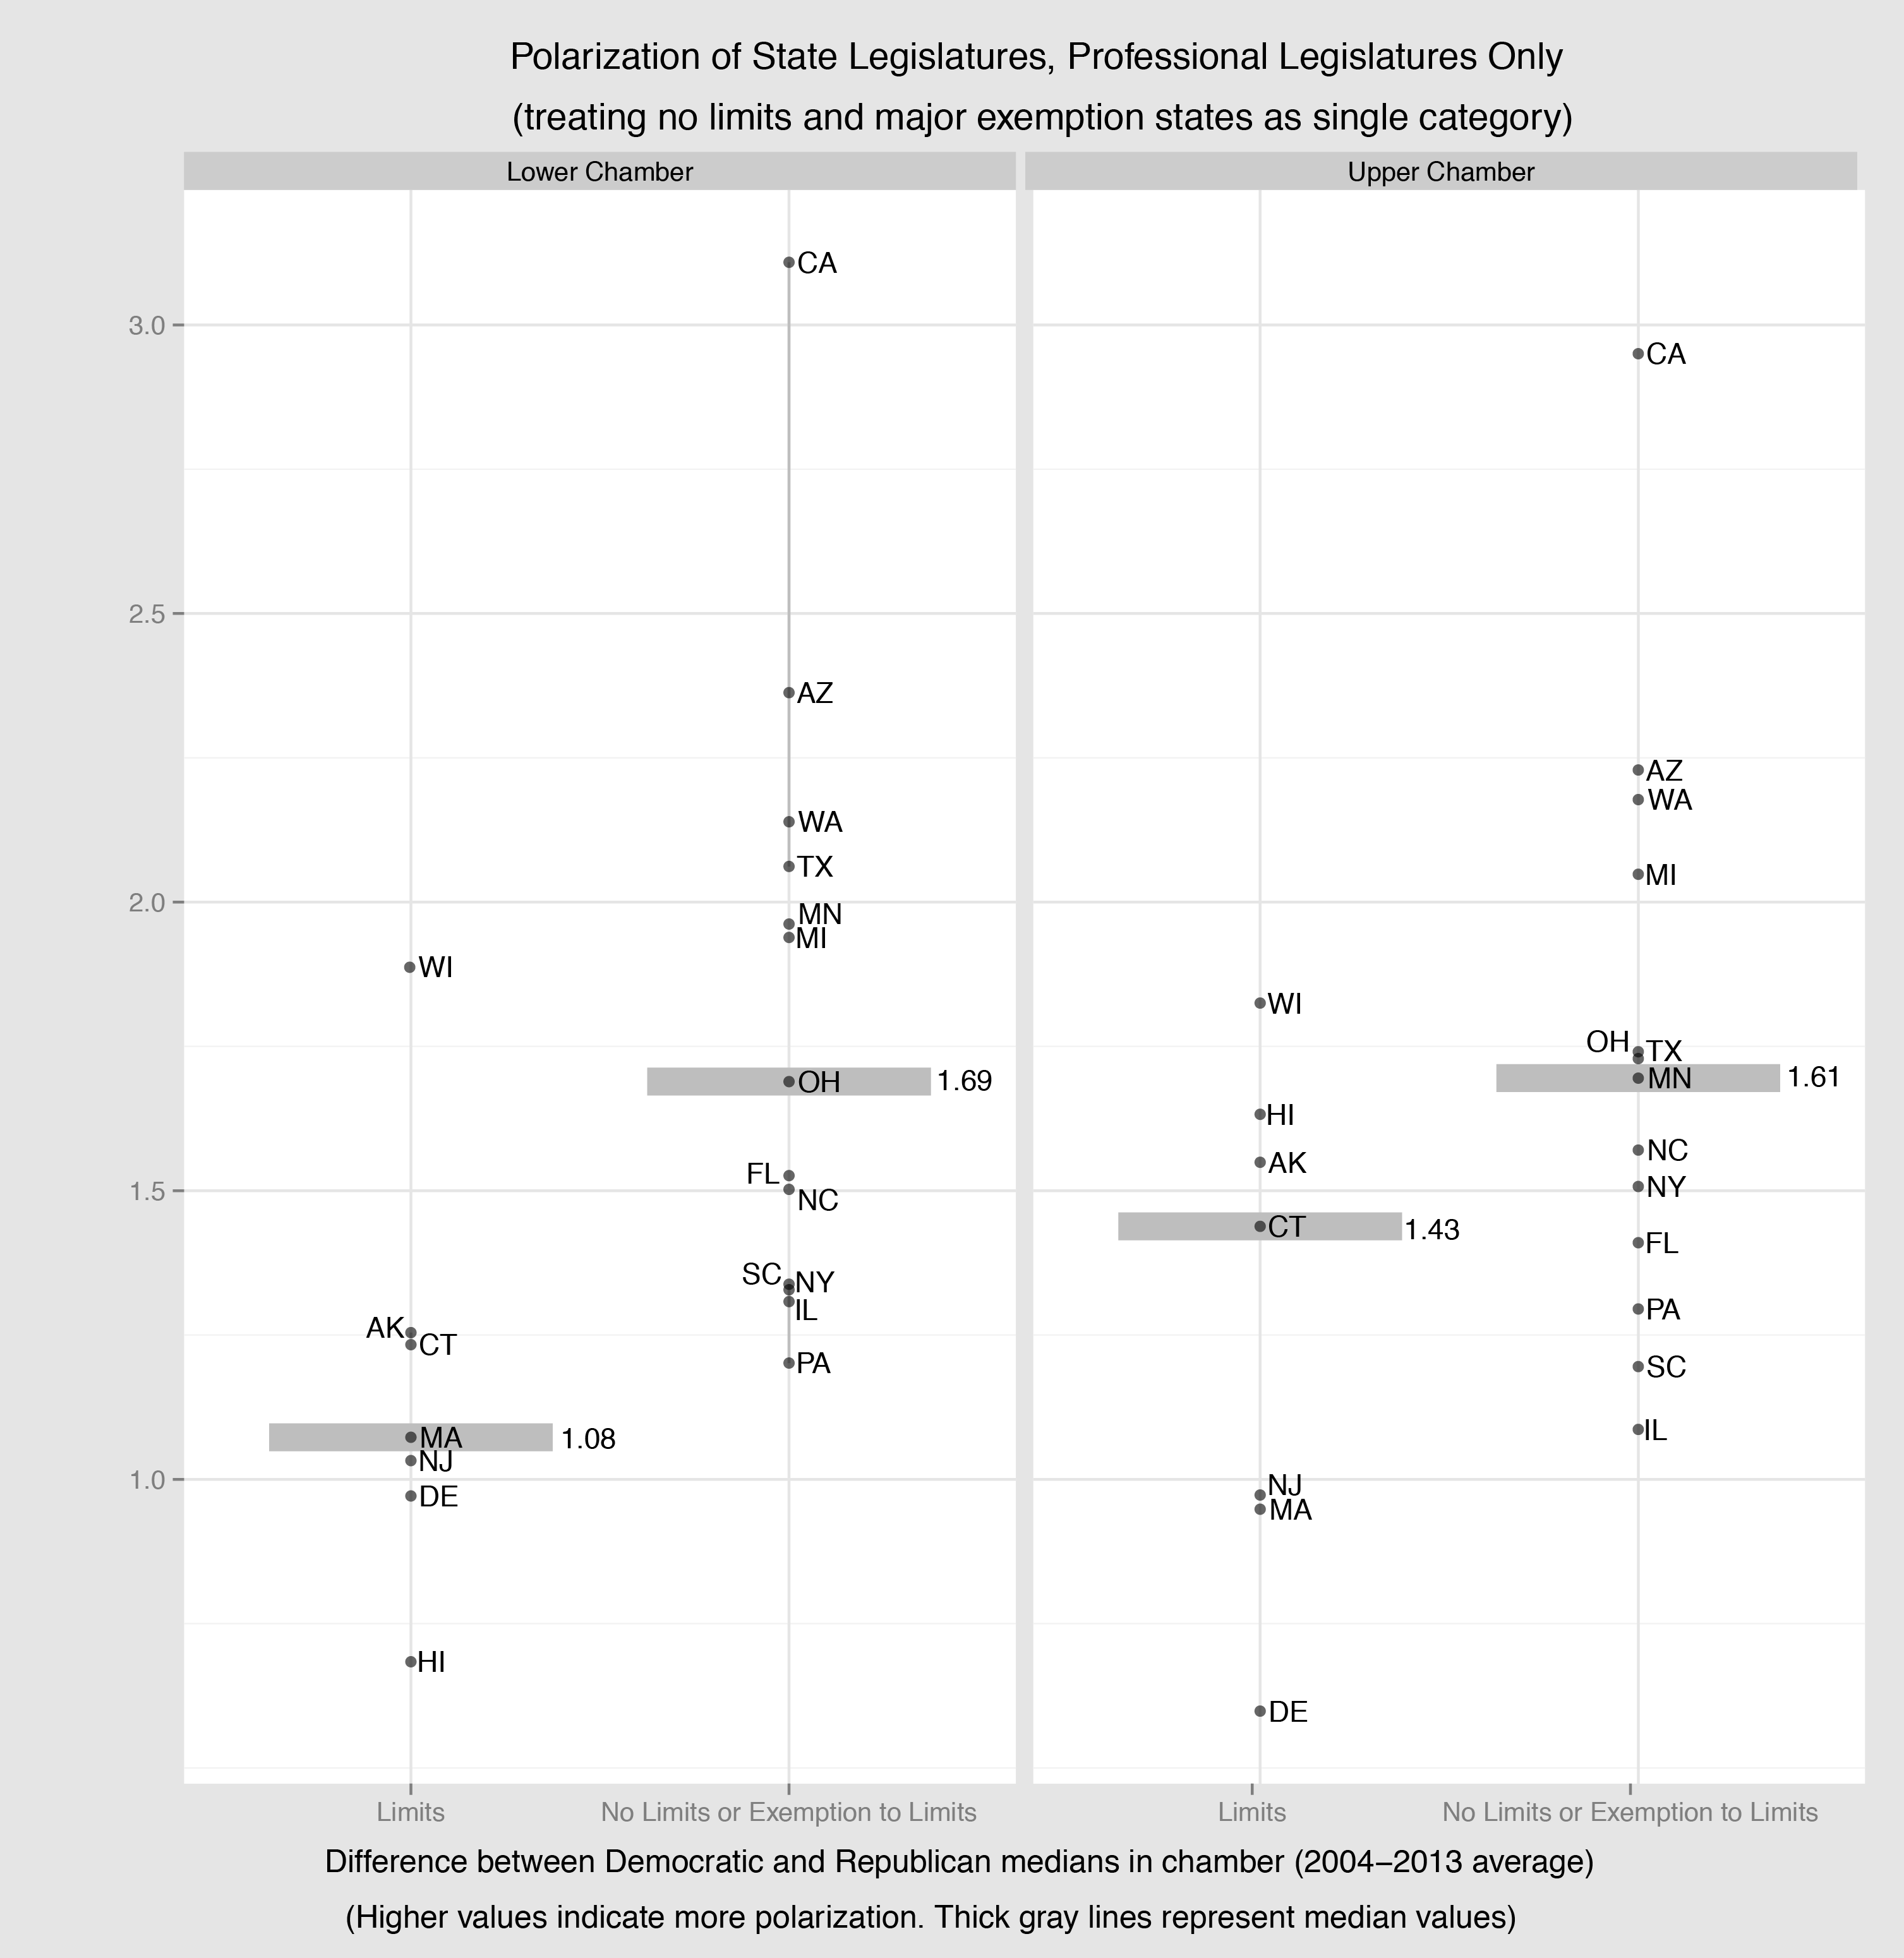
Figure 3. Differences in party medians, by chamber, professionalized states only, treating states with exemptions and no limits equally.
We know that polarization has increased over time. We also might want to know to what extent the changes vary depending on limits on party funding. If the LaRaja-Schaffner hypothesis is right, states with limits should have polarized more than states without limits.
To assess the changes, I’ve calculated state-level averages over two three-year periods as the start and end points (the 1996-1998 average, and the 2008-2010 average). I do this because there are some missing values in the Shor-McCarty data (especially after 2010). I also don’t want to make the changes too dependent on the choice of any single year.
Looking first at the changes in professionalized legislatures (Figure 3), we see a mixed story. Among lower houses, the median state with no limits got more polarized than the median state with limits. Among upper houses, the difference was miniscule.
However, during this time period, the biggest changes in polarization were in the lower chambers, not the upper houses. During this time period, the median difference in party medians among professionalized lower chamber went from 1.21 to 1.54; the median upper chamber actually became slightly less polarized, going from a difference in party medians of 1.54 to 1.48 (the statistical equivalent of no change).
So, the quick conclusion is that, if anything, having no limits is associated with slightly more polarization. However, there is so much variation that other factors are almost surely at work.
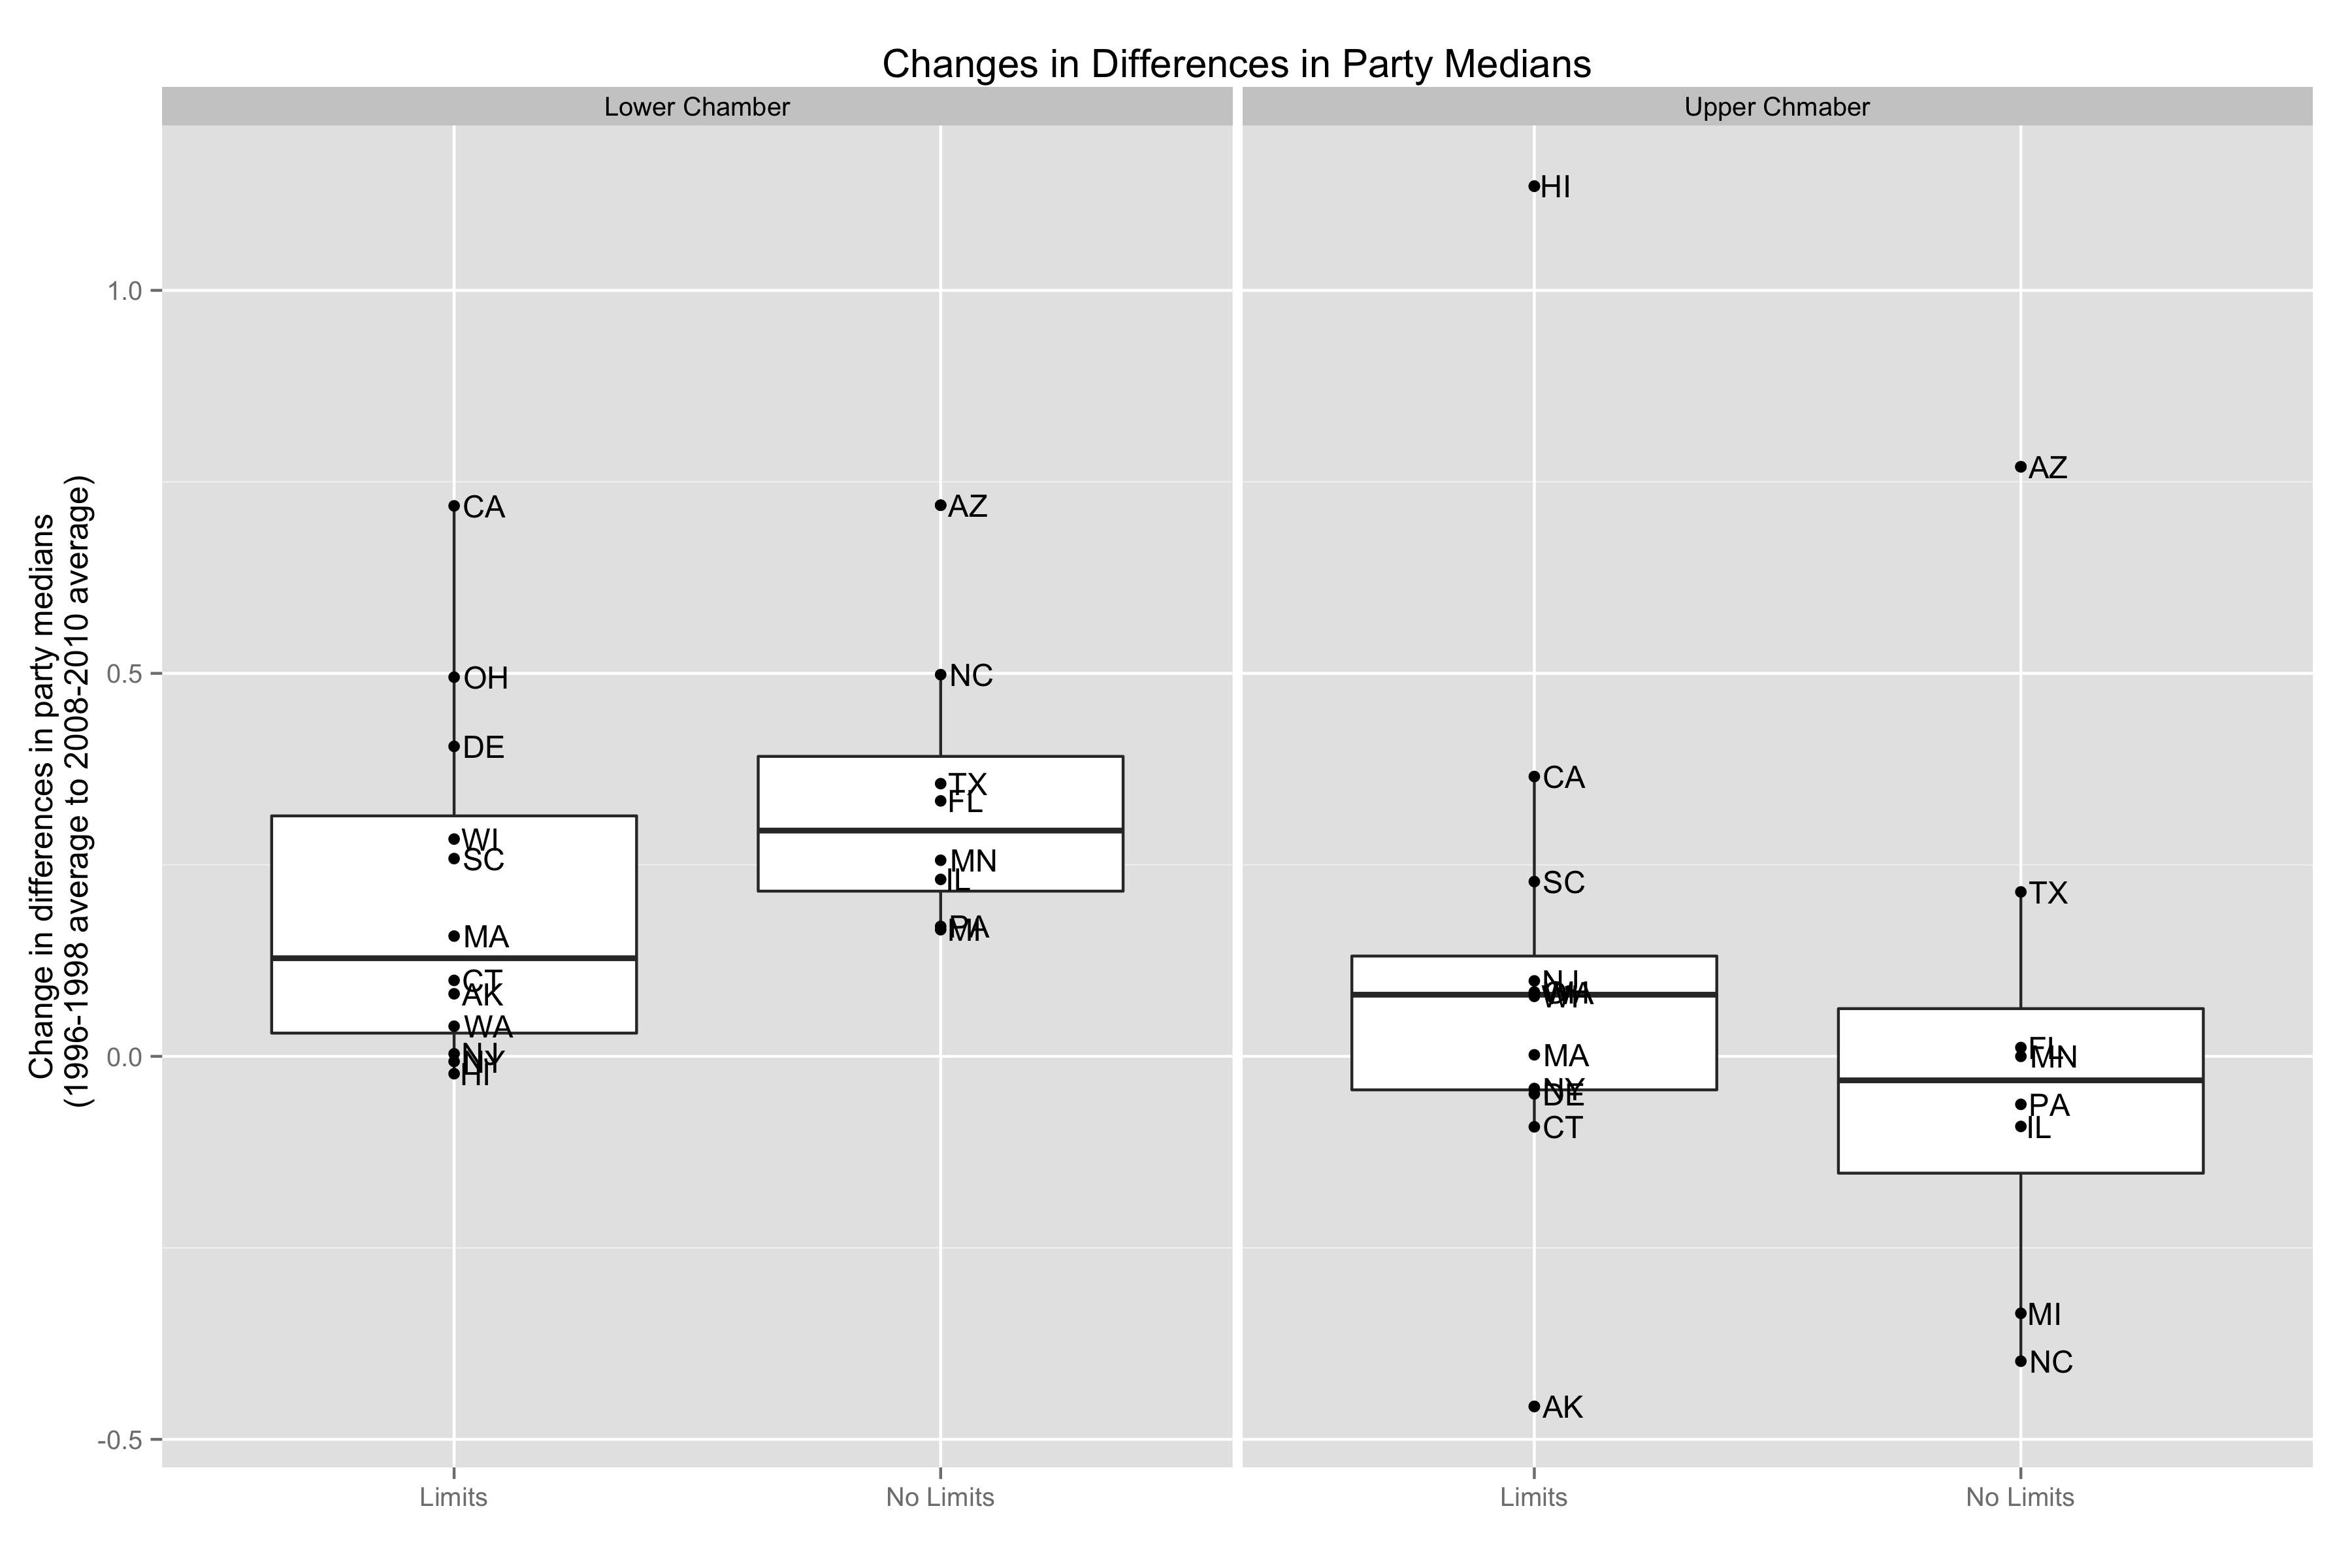
Figure 4. Changes in differences in party medians (1996-1998 average to 2008-2010 average), professional legislatures only
Again, we might want to look beyond the 20 professionalized legislatures to all states. As Table 2 shows, if we expand our analysis to all 50 states, we get a more consistent pattern: states without limits became more polarized across both chambers than states with limits. This makes the group of states we choose to analyze a little more consequential. But again, the differences are small.
| States with limits | States with no limits | Difference | |
| Lower Chamber | +0.12 | +0.29 | 0.17 |
| Upper Chamber | +0.08 | -0.03 | -0.11 |
| States with limits | States with no limits | Difference | |
| Lower Chamber | +0.20 | +0.36 | 0.16 |
| Upper Chamber | +0.07 | +0.18 | 0.11 |
Table 2. Changes in Median difference between party medians (polarization)
Again, the same analytical caveats apply: there is considerable variation in how states have changed — far more variation than campaign finance rules might be able to explain.
Still, since this analysis suggests that unlimited contributions to parties is associated with more polarization, it’s worth considering why this may be the case.
To start, let’s look more closely at the “unlimited money to parties, more moderation” hypothesis. This hypothesis relies on the median voter theory (this is also called “Downsian theory,” since it originated with economist Anthony Downs). The theory suggests that parties have an incentive to move to the middle to win more voters, because the pivotal voter in an election will always lie in the middle of a left-right ideological distribution. Therefore, if parties have more money and more power, parties can encourage and enforce moderation to help them win.
For this to work as advertised, the voters who actually show up on Election Day must be well-informed about the positions of the candidates and the parties. They must also neatly array on a clear left-right dimension. Additionally, elections must be competitive to the point where the median voter is actually near the middle of the ideological distribution. These are all debatable propositions.
The alternative hypothesis — “unlimited money to parties parties, more polarization” – emerges out of a different framework. This framework suggests that parties win elections to make policies that reward their most involved and active supporters – the “intense policy demanders” whose big checks give them the most active role in selecting candidates and determining party priorities. As Jacob Hacker and Paul Pierson explain in an important critique of the median voter paradigm, “Party leaders will be attentive to such demands because groups can provide resources they need, offering critical financial and organizational support.” Allowing unlimited money to parties amplifies the importance of that financial support.
In this alternative framework, the parties are not independent actors trying to move to the middle. The parties are coalitions of their most active and generous supporters, who tend to be intensely polarized. The more money parties can raise, the more money they will raise from their most active supporters – and the more they will reward their most active supporters.
This money is a powerful resource. It allows parties to muddy the actual policy debates, obfuscating how far they have moved to the policy extremes by aggressively shaping the public narrative. They can run more ads to disparage their opponents, making elections about character and personalities instead of actual policy. More money also means that they can better mobilize their most reliable (read: partisan) supporters, to alter the distribution of the electorate that actually turns out and move the ideological position of the median voter in their direction.
As Hacker and Pierson conclude: “Recent trends in American politics have not been kind to the Downsian paradigm. Parties not only fail to converge, they diverge asymmetrically. Voters don’t push back against rising inequality as expected, or at least they don’t have the influence that Downsian thinking would suggest. Some political voices are durably muted due to the erosion of organizational representation as well as new forms of disenfranchisement.”
Framing the choice as parties vs. outside groups also ignores
another alternative: supporting
small donors through a public-matching system. It is true that, in the
current system, small donors do tend to
be highly polarized. But a small donor matching system offers candidates a
different way to run for office. Rather than go from fundraiser to fundraiser, pledging
fealty to the wealthy partisans who attend, potential candidates would have
incentives and opportunities to develop their own base. They’d have reason to
appeal directly to voters for matched contributions that make it worth their
while to get to know their constituents, who are generally
more moderate than the existing set of donors. Such a system might draw in
a different type of candidate, who could bring in some fresh ideas and raise
new issues outside the traditional partisan battle lines. While such candidates
could still face opponents funded by large outside groups, they would be more
likely to have the money to be a competitive candidate. And above a certain
point, money has a diminishing marginal impact on election outcomes.
Moreover, as Thomas Mann and Anthony Corrado note, “It is hard to believe that small donors could possibly exceed mega-donors to Super PACs and politically active nonprofits in their ideological zeal or distaste for compromising with the other party.”
While party-centered systems may organize political choices more clearly and create more accountability, candidate-centered systems also have their benefits. They create more potential diversity in candidates by creating more independent pathways into office. They also allow for more potential policy entrepreneurs who can build unusual coalitions and raise new issues outside the traditional partisan divides. Notably, during the candidate-centered election period of the 1960s and 1970s, polarization in Congress was relatively low. As party committees came to play a larger role, polarization increased.
Though the evidence here provides modest support for the “stronger parties, more polarization” hypothesis, it is again important to emphasize the high levels of variation across states in how polarized they are, suggesting other factors may be at work. Some states have more competitive seats than others. Some states are bigger than others (it’s at least worth mentioning that the two least-polarized states, Delaware and Rhode Island, are also the two smallest geographically, while California, the largest, is by far the most polarized).
It’s also important to be clear that limits-no limits distinction on contributions to parties is a little fuzzy. Several of the states that do have limits also have important exemptions, making for a less clear dichotomy. Some states are more clearly one-party states than others. Finally, the distinction between states with limits and no limits may not be that important because in states with limits, party networks use independent expenditures to get around limits.
Like most factors in political life, polarization is complicated. The likelihood that polarization can be reduced by a single institutional change is doubtful. We ought to be especially careful when that institutional change – allowing unlimited contributions to parties – comes with the danger of further empowering a very small, unrepresentative, and highly polarized slice of the population that accounts for the vast majority of donations.
Senior Fellow, Political Reform Program