How Low Teacher Quality Sabotages Advanced High School Math
Blog Post
Jan. 9, 2007
In 1983, the National Commission on Excellence in Education recommended in its landmark A Nation at Risk report that all high school students take a course of study called the "New Basics." By 2000, the percentage of high schoolers completing the core of that curriculum—four courses in English and three each in science, math, and social studies—had quadrupled from 14.3 percent to 57.2 percent.1 At first glance, the recommendations seemed like a great success.
Yet high school achievement failed to show similar growth during that time, with reading scores on the National Assessment of Education Progress (NAEP) test of 17-year-olds unchanged and math scores up only slightly. Many high school graduates continue to arrive in college unprepared for college-level work. More than one in four college freshmen in 2000 were forced to take "remedial"—that is, high school-level—courses in reading, writing or math.2
The "New Basics," it seems, haven't made much of a difference in student achievement.
Recent research from the Illinois Education Research Council (IERC) suggests at least a partial explanation: Students who take advanced math courses in schools that employ the fewest well-qualified teachers are far less likely to be adequately prepared for college, or to succeed in college, than students who take the same courses—or even less advanced courses—at schools with the most well-qualified teachers. Students who fail to take advanced courses do poorly across the board. But it turns out that simply enrolling students in more advanced classes isn't enough—you also need good teachers to teach them.
Ready, or Not
In 2001, Illinois began administering the ACT to all 11th graders statewide. The IERC combined this data with information from high school transcripts to create a "College Readiness Index" for each of the 113,000 students who took the test statewide. Students with a combined ACT score of less than 20 and a GPA less than 2.5 were identified as "Not/Least" ready for college. Students with a combination of high ACT scores and high GPAs were deemed "Most" ready, while others fell somewhere in between.3 Thirty-four percent of students statewide fell into the "Not/Least" category, while 20 percent were identified as "Most" prepared for college.
The IERC also constructed a Teacher Quality Index (TQI) to measure the relative level of teacher quality in every school in the state.4 The TQI is a composite of six school-level measures of teacher qualifications that research suggests are associated with classroom effectiveness:
- Percentage of teachers with bachelor's degrees from more competitive colleges, as determined by Barron's Guide to Colleges.
- Percentage of teachers with less than four years of teaching experience.
- Percentage of teachers with emergency or provisional credentials.
- Percentage of teachers who failed the "Basis Skills Test" at least once. Illinois requires teachers to pass this test to earn state certification.
- Teachers' composite ACT score.
- Teachers' English ACT score.
Chart One shows college readiness results for the Illinois class of 2002, broken down by the most advanced math class students took in high school.5 Within each category of course-taking, Chart One further breaks down results by the TQI of the high school the students attended.

Very few of the students whose highest math course was Algebra I or Geometry were found to be "More" or "Most" ready. Teacher quality seems to make little difference—whether the school TQI was high or low, 6 percent of these students or fewer were well-prepared for college. This is consistent with studies such as those conducted by researcher Clifford Adelman, who found a strong link between math course-taking in high school and success in college.6 Results for students who stopped at Algebra II were better, but still very low. This suggests that the "New Basics" may not set the bar high enough in math—students could theoretically meet the three-course standard by only taking an Algebra I–Geometry–Algebra II sequence, or even less.
But the results for Algebra II also show a new pattern: the higher the school's Teacher Quality Index, the more likely students were to be prepared for college. Twenty-one percent of students who went to schools with a TQI in the top quartile statewide were "More" or "Most" prepared. Only 6 percent of students from schools with a TQI in the bottom 10 percent were similarly prepared.
The TQI differences become even more dramatic in the last two categories, Trigonometry or other advanced math, and Calculus. In each course-taking category, student readiness increases in lock-step with school TQI. Students who took Calculus in the lowest TQI schools were five times less likely to be well-prepared than students who took Calculus in the highest TQI schools. In fact, students who took Calculus in schools with a TQI below the 10th percentile had a lower preparedness rate (16 percent) than students who only took Algebra II in schools that were above the 25th percentile.
Chart Two shows the same analysis, but with a focus on the percent of students whose ACT scores and GPA identified them as least prepared for college. It is essentially a mirror image of Chart One, with huge differences between students who took similar advanced math courses depending on relative TQI within their school.

The burden of being taught by the least-qualified teachers is not equally shared in Illinois. The IERC found that 56 percent of schools that were in the top 10 percent in terms of poverty—the poorest schools in Illinois—were in the bottom 10 percent in terms of TQI.7 By contrast, less than 1 percent of the schools with the fewest poor children were in the lowest TQI category. Low-income students, who face some of the greatest barriers to education, are much less likely to be taught by teachers with the best qualifications.
These disparities carry forward to life after high school. The IERC tracked the progress of the class of 2002 into college, to see how they fared. Overall, 73 percent of students enrolled in college by 2005, three years of graduation. But as Chart Threeshows, there were sharp differences depending on college readiness. Over 90 percent of those who were "Most" ready enrolled, compared to only 55 percent of those who were "Not/Least" ready.
Chart Three illustrates a fact that is sometimes overlooked in discussions of preparing high school students for college: most high school graduates will go to college, whether or not they are prepared to succeed there. Even the least prepared members of the class of 2002 were more likely than not to give college a try. But as Charts Four and Five show, they had very different results when they got there, both in terms of where they went to college, and whether they succeeded once they arrived.

Chart Four shows that students who entered college with the lowest levels of readiness were much more likely than their more-prepared peers to attend an institution rated by Barron's Guide to Colleges as being non-competitive. By contrast, they were far less likely to attend more prestigious, selective institutions. For students with the highest levels of preparation, the pattern was exactly the opposite.
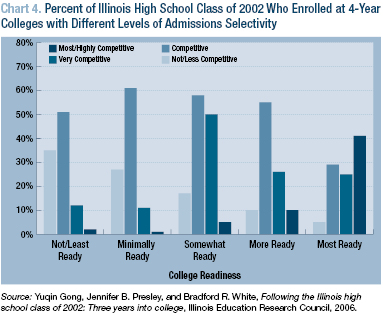
Chart Five shows what happened to students from the class of 2002 who enrolled in college immediately after graduation. Three years later, 41 percent of students who entered as "Not" or "Least" ready had dropped out of the system, four times the attrition rate of those who were "More" or "Most" ready.

The stark differences in high school preparation—and ultimately, college success—of students who took ostensibly the same upper-level math classes in high school shows one reason why K–12 education reformers have advocated various kinds of standardized testing. Not all schools can be relied upon to ensure that students who earn credits in certain course have truly acquired the knowledge and skills they need. That's also why colleges often require students to present some form of test-based validation of what they've learned, either in the form of commercial assessments like the Advanced Placement tests and SAT produced by the College Board, or through placement tests produced by colleges themselves.
The results from the Illinois class of 2002 also show why it's not enough to simply identify what students need to know and then enroll them in classes that cover that content. The basics, new or otherwise, are just the beginning. Students need good teachers to help them through.
Endnotes
1 U.S. Department of Education, Digest of Education Statistics 2005, Table 135. A Nation at Risk also recommended that students complete a half-credit of computer science and, for the college-bound, two credits of foreign language. The percent of students completing this curriculum has increased from 2.0 percent to 31.0 percent.
2 Basmat Parsad, Laurie Lewis, and Bernard Greene, Remedial Education at Degree-Granting Postsecondary Institutions in Fall 2000, U.S. Department of Education, National Center for Education Statistics, 2003.
3 The IERC readiness index is based on a matrix of ACT scores and GPAs. For example, a student is deemed "Most Ready" if he or she has a combined ACT score of 26 or greater and a GPA greater than or equal to 2.5, or a GPA of 3.5 or greater and an ACT score of 23 or greater. 9.5 percent of all Illinois students, and approximately 53 percent of all students deemed "Most Ready," scored at or above 26 and had a GPA at or above 3.5. The readiness index is modeled on analyses of the National Educational Longitudinal Study (NELS) examining the relationship between high school academic achievement and test scores and success in college; see Lutz Berkner and Lisa Chavez, Access to Postsecondary Education for the 1992 High School Graduates, U.S. Department of Education, NationalCenter for Education Statistics, 1997.
4 See Jennifer B. Presley, Bradford R. White, and Yuqin Gong,Examining the Distribution and Impact of Teacher Quality in Illinois, Illinois Education Research Council, 2005.
5 The author acknowledges the work of the Education Trust, which has previously presented versions of this chart in data presentations that can be downloaded from the Education Trust Web site at http://www2.edtrust.org/EdTrust/Product+Catalog/recent+presentations.htm.
6 Clifford Adelman, The Toolbox Revisited: Paths to Degree Completion from High School to College, U.S. Department of Education, 2005.
7 Presley, White, and Gong, 2005.
This work by Education Sector is licensed under a Creative Commons Attribution - Noncommercial 3.0 United States License.
Education Sector encourages the free use, reproduction, and distribution of our ideas, perspectives, and analysis. Our Creative Commons licensing allows for the noncommercial use of all Education Sector authored or commissioned materials featured on this site. We require attribution for all use. Link to and credit Education Sector as the original publisher of the work and, if applicable, also credit a particular author.