Hidden Details
A Closer Look at Student Loan Default Rates
Blog Post
Oct. 27, 2007
When U.S. Secretary of Education Margaret Spellings announced in September that the federal student loan default rate—the percentage of borrowers who fail to repay their government student loans—was 4.6 percent, the press didn't lift a pencil. The rate has hovered around 5 percent for years.1
But a new report by the U.S. Department of Education's own National Center for Education Statistics (NCES) reveals that student loan defaults are a far larger problem for some groups—particularly students of color and those who leave college with a lot of debt.
The U.S. Department of Education's reported default rate—referred to as the "cohort default rate"—tracks all borrowers who are expected to begin repaying their student loans in a given year. It is calculated as an overall percentage—the number of borrowers in the cohort who default on their loans within the first two years of repayment, divided by the total number of borrowers in the cohort.
The federal education department uses the broad-gauged cohort default rate primarily to identify and sanction colleges with extremely high default rates (over 25 percent), and to encourage default prevention among colleges, loan companies, and guarantee agencies.2
The NCES report, a 10-year follow-up on the debt status of students who graduated from college during the 1992–93 school year, provides a much more detailed view of student loan defaults.3 And while NCES default rate numbers cannot be directly compared to the Department of Education's numbers because of methodological differences, the NCES study does show that the low overall default rate reported by the Department of Education does not accurately reflect the experiences of all student borrowers.4
The NCES report, for instance, disaggregates default rates by student characteristics such as debt level and income and shows that the likelihood of a student defaulting on his or her loan is highly dependent on both the student’s total amount of debt and the student’s salary after graduation.
Chart 1 reveals that a student graduating in the 1992–93 school year with $15,000 or more in loans was nearly three times as likely to default on his or her loan as a student with less than $5,000 in loans. In fact, one in five students with over $15,000 in debt defaulted on his or her loan in the 10 years after graduation.

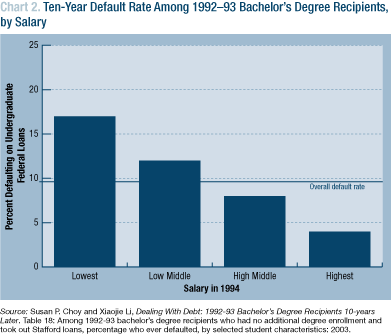
A similar pattern emerges when default rates are disaggregated by students' post-graduation income. Chart 2 shows that students with the lowest salaries in 1994 were more than four times as likely to default on their loans as students with the highest salaries after graduation.

Our analysis of the NCES data also reveals that student loan default rates vary widely by race, with huge differences between black and Hispanic students, and white and Asian students, as Chart 3 shows.

Black students who graduated in 1992–93 school year had an overall default rate that was over five times higher than white students and over nine times higher than Asian students. The differences for Hispanic students are not as large, but are still substantial. Hispanic students' overall default rate was over twice that of white students and four times higher than Asian students. And these differences cannot be fully explained by differences in borrowing patterns or salaries. The 1994 percentage of monthly income going to student loan payments—an indication of both how much debt a student has and their earnings—was actually lowest for Hispanic students and only slightly higher than average for black students.5
This type of more detailed information about students who default on their loans is not evident if we only look at an overall default rate, such as that reported by the Department of Education. For the NCES sample, for instance, the overall default rate is 9.7 percent, which, as shown in all three previous charts, does not reflect the experiences of all students in the NCES sample. Those with the highest amounts of debt or the lowest salaries, as well as black and Hispanic students, all have default rates well over 9.7 percent.
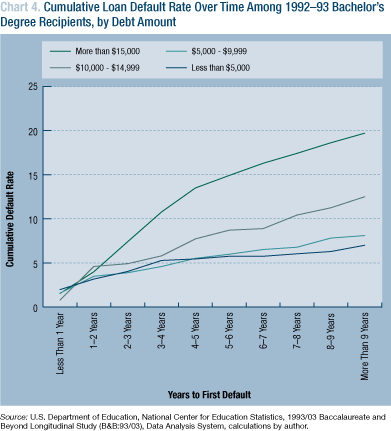
The NCES study also found that, on average, defaults occurred four years following graduation—two years longer than the Department of Education follows borrowers for its default rate calculations. As Chart 4 shows, tracking students over the life of their loans provides important information on the total number of borrowers defaulting on loans and when those defaults are most likely to occur. The Department of Education's short, two-year time frame for tracking borrowers is especially misleading for students with the highest amount of debt. For those students, the two-year default rate looks comparable to the default rate for students with much lower debt levels. But, if you track defaults for three or more years, big differences emerge between these students. In fact, the Department of Education's own Office of Inspector General found in a 2003 audit report that the two-year calculation does not reflect longer term default rate trends.6

For some borrowers, student loan debt is very difficult to manage. For black and Hispanic students, students who enter low paying, often public service, careers, or students who take on extremely high amounts of debt, defaulting is a very real possibility. And defaulting on student loans can be a crushing financial blow to a student, particularly if that student does not have outside support, such as family or friends, to rely on. At each default, collection costs of up to 40 percent of the loan balance are added to the loan plus any unpaid interest. If a borrower defaults multiple times, his or her balance can quickly balloon, making the total debt to be repaid even more daunting.7
The NCES study makes clear that to get a complete picture of student loan defaults it's necessary to disaggregate default rates by student characteristics and to track students' borrowing histories for longer time periods than the Department of Education does currently.
1. "Student Loan Default Rates Remain Low," U.S. Department of Education Press Release, September 10, 2007. For default rate trends and information on default rates by state and institution, see the Financial Aid Professionals Web site athttp://www.ed.gov/offices/OSFAP/defaultmanagement/cdr.html.
2. See for example, Looking for Relief: Americans' View of College Costs and Student Debt (Berkeley, CA: The Project on Student Debt, May 4, 2006).
3. Susan P. Choy and Xiaojie Li, Dealing With Debt: 1992–93 Bachelor's Degree Recipients 10-Years Later, (Washington, DC:National Center for Education Statistics, June 2006).
4. The Department of Education's default rate calculations include all student loan borrowers and track students for two years after they enter repayment. The NCES study only followed students who finished a four-year degree, but tracked these students for 10 years following graduation.
5. Baccalaureate & Beyond: 2003 (Washington, DC: NationalCenter for Education Statistics). Calculations by the author, Data Analysis System (DAS). The median monthly loan payment as a percentage of monthly income in 1994 for recent 1992–93 graduates was 6.7 percent for the United States as a whole, 7.4 percent for Asian students, 7.2 percent for black students, 5.3 percent for Hispanic students, and 6.8 percent for white students.
6. Audit to Determine if Cohort Default Rates Provide Sufficient Information on Defaults in the Title IV Loan Programs(Washington, DC: Department of Education Office of Inspector General, December 2003).
7. See "Defaulting on Student Loans," FinAid.org, available at: http://www.finaid.org/loans/default.phtml.
This work by Education Sector is licensed under a Creative Commons Attribution - Noncommercial 3.0 United States License.
Education Sector encourages the free use, reproduction, and distribution of our ideas, perspectives, and analysis. Our Creative Commons licensing allows for the noncommercial use of all Education Sector authored or commissioned materials featured on this site. We require attribution for all use. Link to and credit Education Sector as the original publisher of the work and, if applicable, also credit a particular author.