Comparing New America's and College Board's Tax Benefit Figures
Blog Post

Nov. 5, 2015
For nearly two decades the College Board has been publishing annual statistics on both the price of college and the aid that students receive. They run the gamut of higher education finance, measuring everything from military and veterans tuition programs, state financial aid programs, and of course, federal student aid. They have also provided one of the only estimates of federal tuition tax benefits, until now.
This week, New America released a new paper, A New Look at Tuition Tax Benefits, which adds to this work and provides key details previously unavailable to policymakers or the general public.
By using nationally representative survey data about undergraduate students, we estimate the dollar amount of each benefit available to college students. While using survey data has certain trade-offs, it also allows for a much more fine-grained look at how much students are able to gain from tax benefits, how these amounts interact with other forms of student aid, and how policy changes have influenced these awards over time. In contrast, the College Board’s Trends in Student Aid uses aggregate statistics data from actual tax returns compiled and published by the Internal Revenue Service (IRS), to infer the share of tax benefits claimed by different types of students.
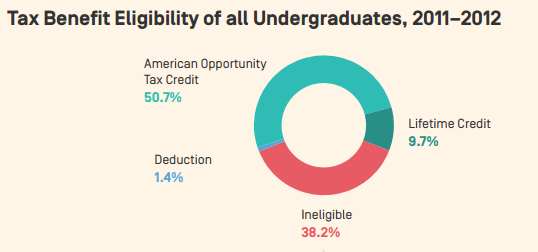
We add to this source of information in key ways. For example, our findings show that nearly 40 percent of undergraduate students are ineligible for any benefit. This information is excluded from the College Board’s report because tax returns by nature only provide information on cases where a tuition benefit is claimed. We can also examine why students are ineligible. Fully 63.5 percent of ineligible students had no tuition costs to offset, while 31 percent did not file federal taxes.
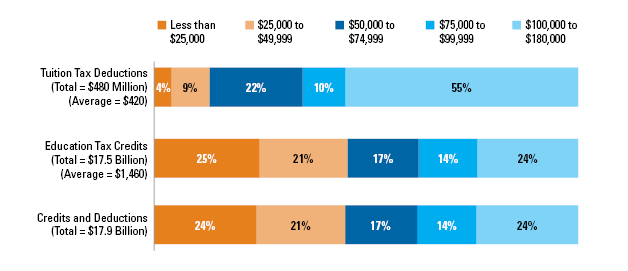
Likewise, we are able to show what tax benefits are available to undergraduates only, thereby excluding the benefits claimed by graduate students. (We released a separate study for graduate students.) For example, while Trends in Student Aid 2015 reports that students claim $480 million annually on the tuition and fees deduction, our analysis shows that only 1.4 percent of undergraduates would optimally claim this benefit -- far too few to account for the $480 million. This implies that graduate students make up a substantial portion of those claiming this benefit, a key distinction not shown in Trends.
Our analysis also shows how tax benefits are distributed by the types of schools student attend. Trends includes this information for other sources of financing, but the IRS statistics it uses to show tax benefits cannot provide such information. And it turns out that tax benefit eligibility by school type is a revealing perspective.
The average student at a for-profit school who can claim a benefit is eligible for about $1,744, slightly more than students attending public four-year schools. It is a lot more than students at community colleges, who can claim just $856 on average. These gaps are even more dramatic when we isolate the refundable portion of the AOTC. If students file optimally, 55 percent of the dollars available through the refundable portion of AOTC would go to students at for-profit colleges.

The data even allows us to estimate which of three tuition tax benefits families can claim, assigning them to undergraduates in a way that optimizes their award. We show that about 50.7% of all undergraduates can claim the American Opportunity Tax Credit (AOTC), the most generous tax benefit by far. An additional ten percent are ineligible for the AOTC, but can claim one of the other two tax benefits. They are largely students at community colleges. That is a level of detail that IRS statistics cannot provide, but is important for policymakers to know.
To be sure, the survey data and methodology we use has it’s own limitations, and in certain ways the College Board’s IRS-based estimates may be more useful than our own. For one thing, measuring eligibility, as we do in our analysis, is not the same thing as measuring take-up rates. Unlike the information in Trends, we cannot show the benefits families actually claimed.

In many ways, our new methodology reinforces what the College Board has been reporting for years. The size and scope of the tuition tax benefits has grown substantially over the years, and middle and upper income families can claim larger benefits because they incur more tuition costs.

Together, these two sources provide the foundation for a robust understanding of federal tax policy in higher education. "